
The Daily Shot: 11-Dec-20
• The United States
• The United Kingdom
• The Eurozone
• New Zealand
• China
• Emerging Markets
• Cryptocurrency
• Commodities
• Energy
• Equities
• Global Developments
• Food for Thought
The United States
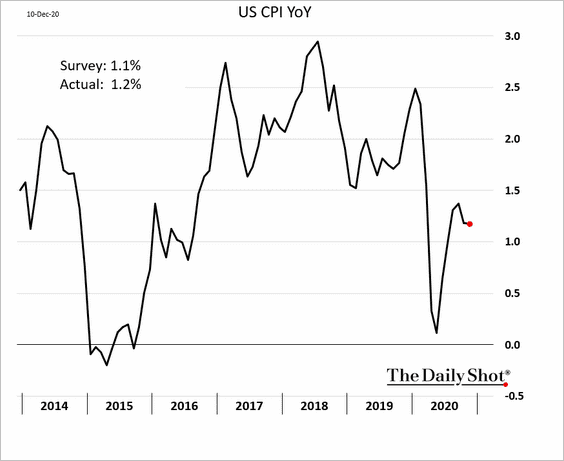
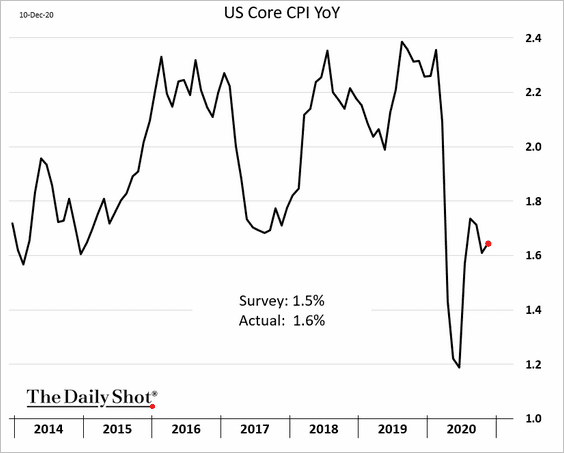
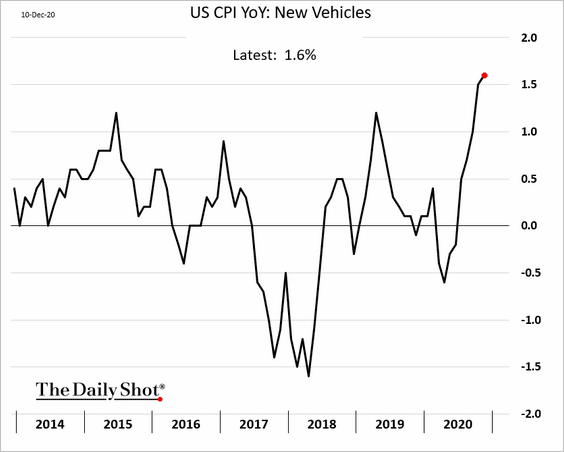
1. The CPI was firmer last month, topping economists’ forecasts.
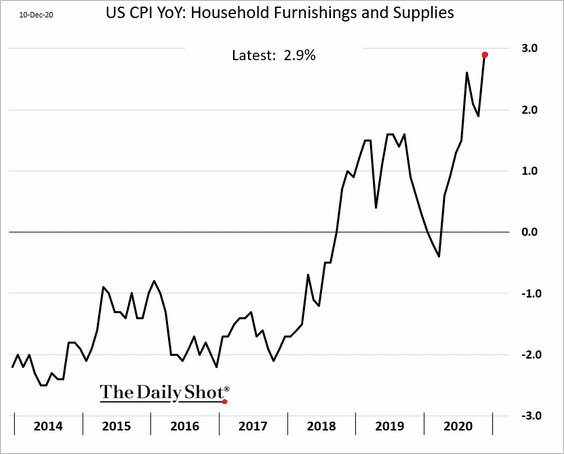
Tight inventories gave inflation a boost. As we saw yesterday (#4 here), durable goods’ inventory-to-sales ratios declined rapidly in recent months. Many of these goods, especially those related to housing and autos, have experienced rapid price gains.
• Furniture:
• Appliances:
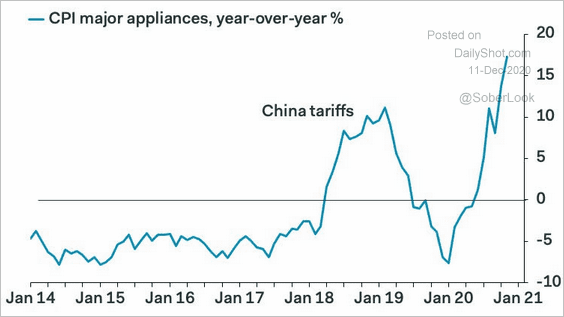 Source: Pantheon Macroeconomics
• New vehicles:
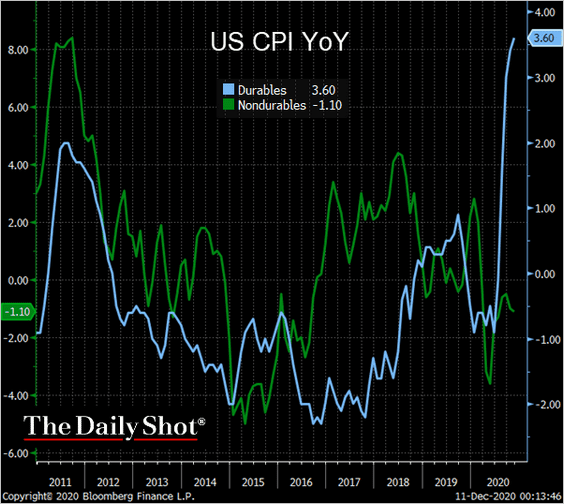
The CPI divergence between durables and nondurables mirrors the inventory trends (see chart).
 Source: @TheTerminal, Bloomberg Finance L.P.
——————–
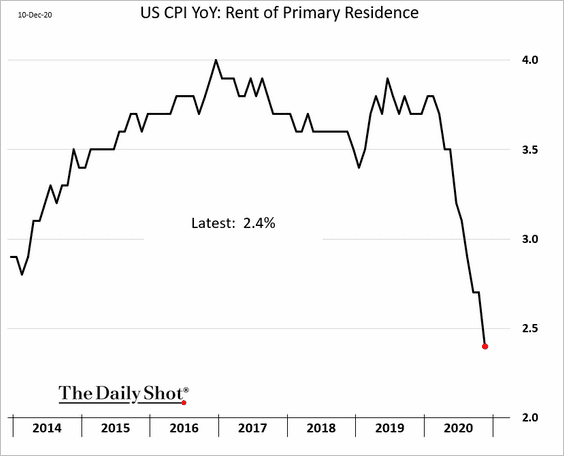
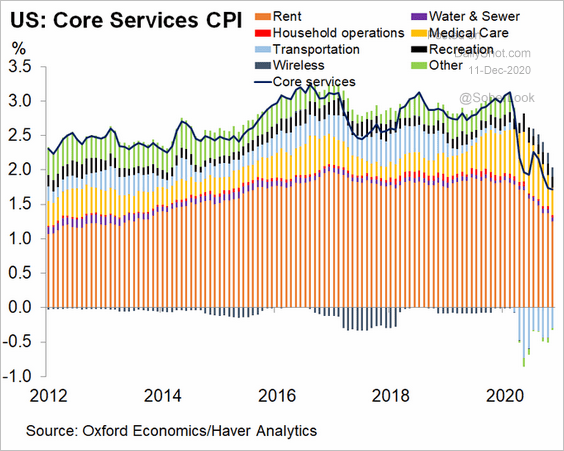
• Rent inflation continues to soften.
– Year-over-year:
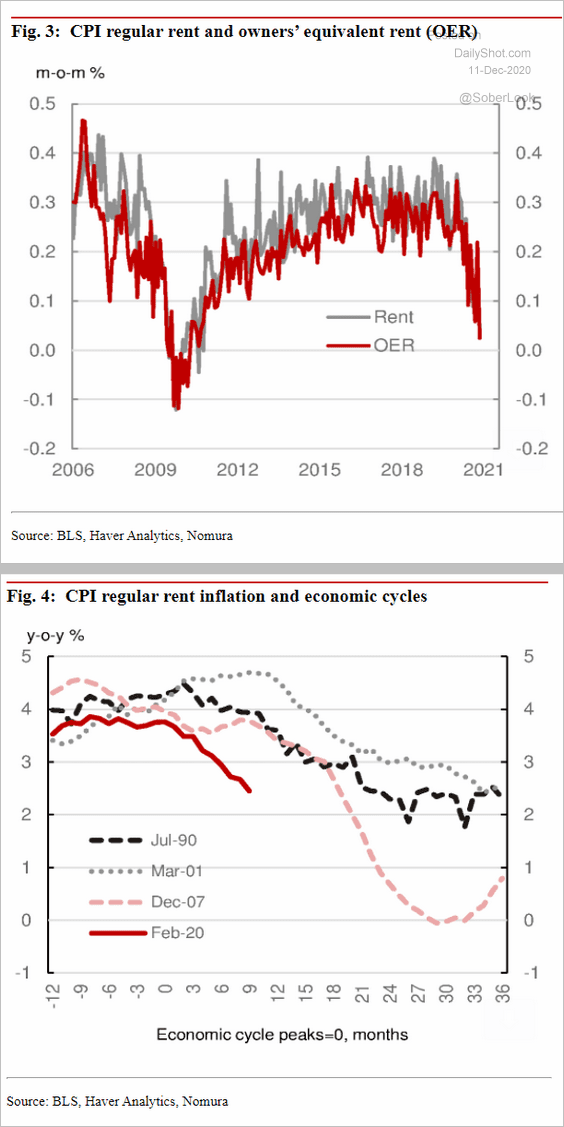
– Month-over-month:
 Source: Nomura Securities
Rent makes up a substantial portion of the core services CPI.
 Source: @GregDaco
Here is a comment from Nomura.
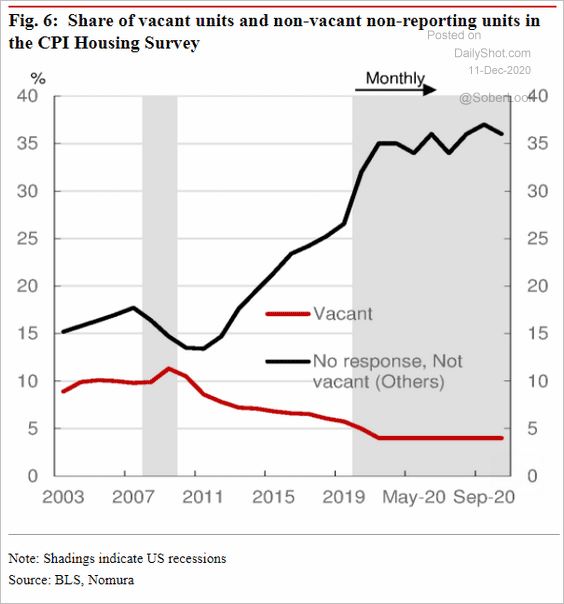
… there are a couple of potential factors that might have accelerated the slowdown in CPI rent inflation during this cycle. First, the ongoing eviction moratorium might be reducing the tenant turnover rate (the percentage of rented units but not renewed), which, in turn, could be forcing landlords to give up on rent collection. According to the Eviction Lab at Princeton University, the level of eviction filings remained low in large cities by historical standards thanks to eviction moratoria. In CPI estimation, unpaid rent which landlords/property managers forgive or give up collecting would be counted as a reduction in rent. This would be consistent with the fact that the share of CPI’s sampled units which became vacant remained low this year (Fig. 6). Second, landlords might be offering promotional free rents to new tenants aggressively, which would also be reflected in CPI.
 Source: Nomura Securities
——————–
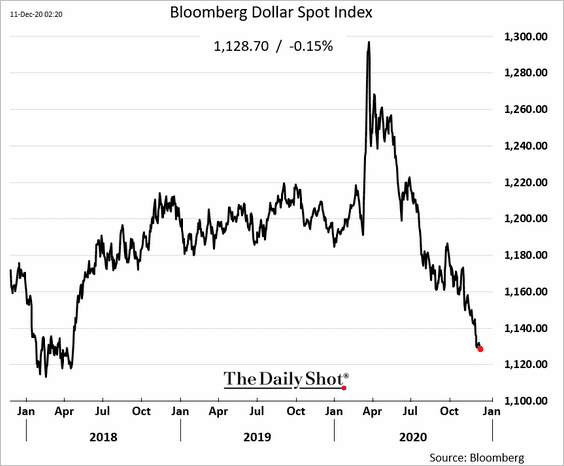
• The US dollar continues to drift lower, which will boost import prices.
• We are going to have additional updates on the November CPI report on Monday.
——————–
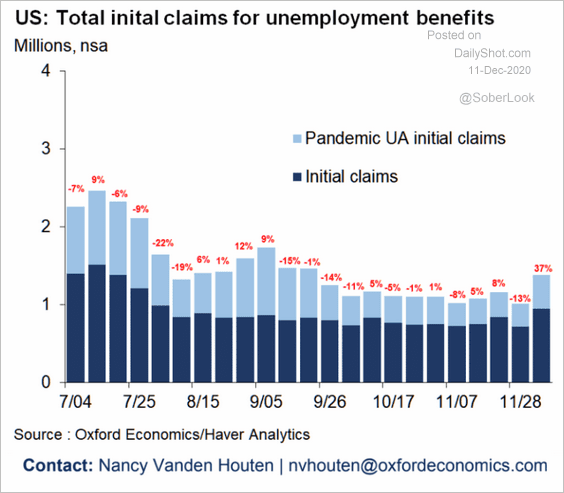
2. Some 1.4 million Americans filed for unemployment benefits last week.
 Source: Oxford Economics
It could take until 2024 for the labor market to fully recover.
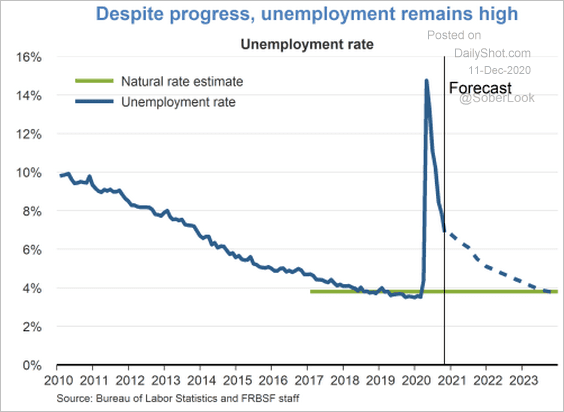 Source: San Francisco Fed Read full article
——————–
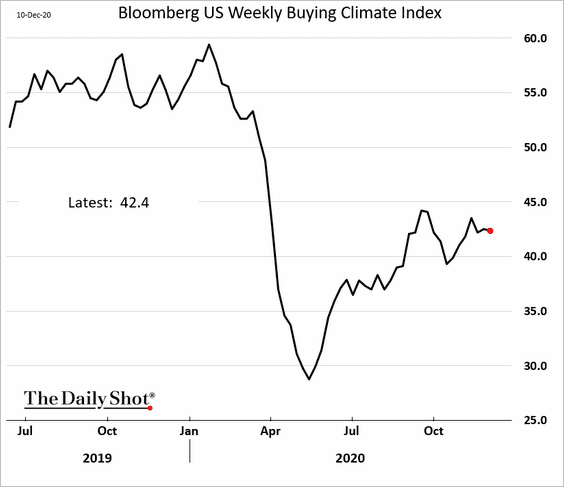
3. Bloomberg’s consumer buying climate index has stalled.
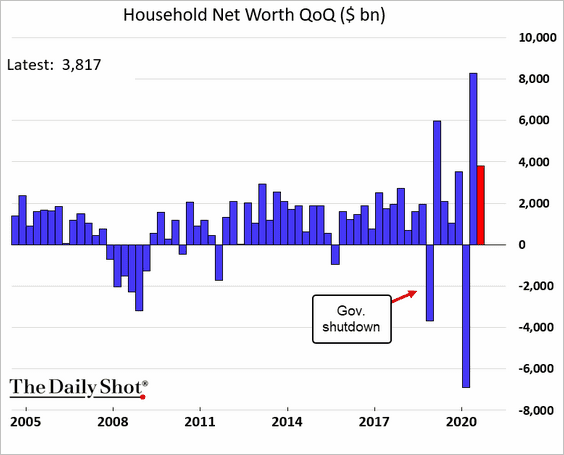
4. US household net worth rose sharply last quarter amid strong gains in home prices and stocks.
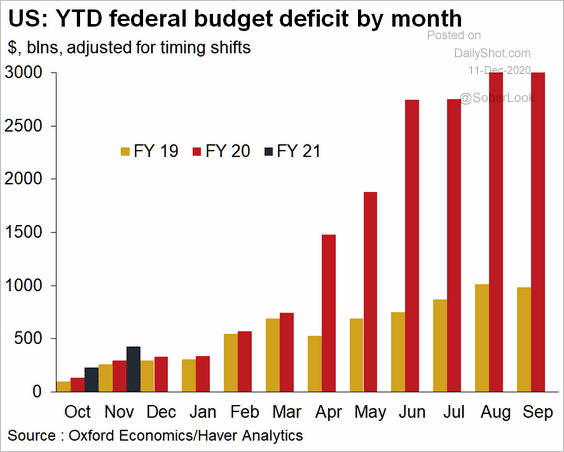
5. Here is the current federal budget deficit vs. fiscal 2019 and 2020.
 Source: Oxford Economics
The United Kingdom
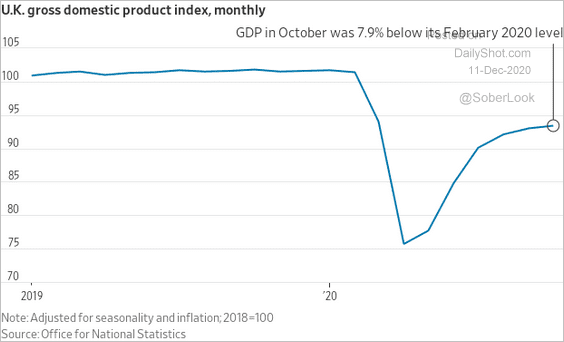
1. The GDP recovery slowed further in October.
 Source: Reuters Read full article
 Source: @jeffsparshott
Below is a comparison to previous downturns.
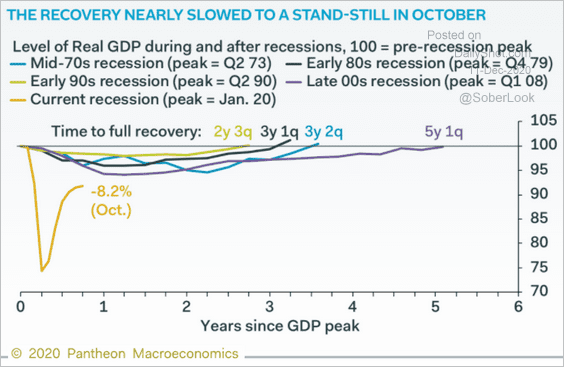 Source: Pantheon Macroeconomics
——————–
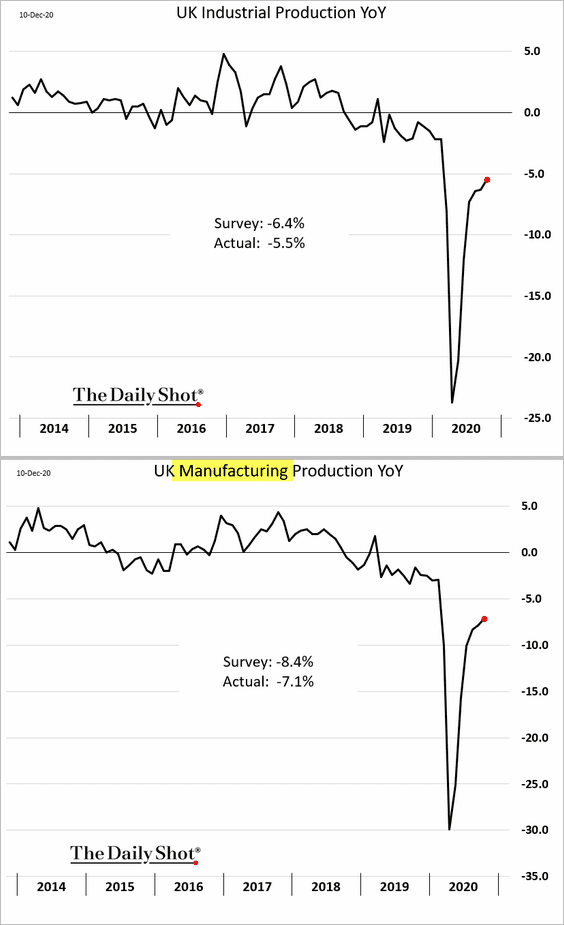
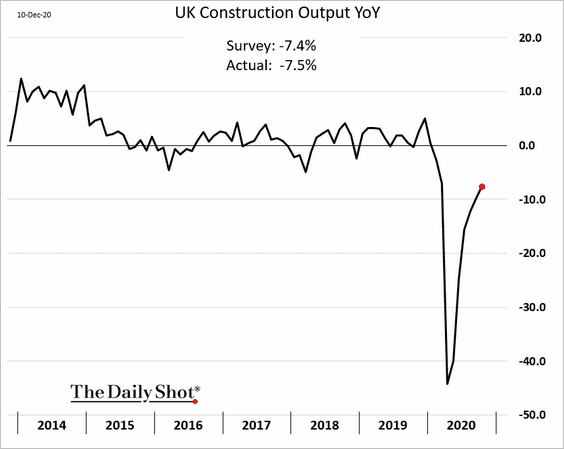
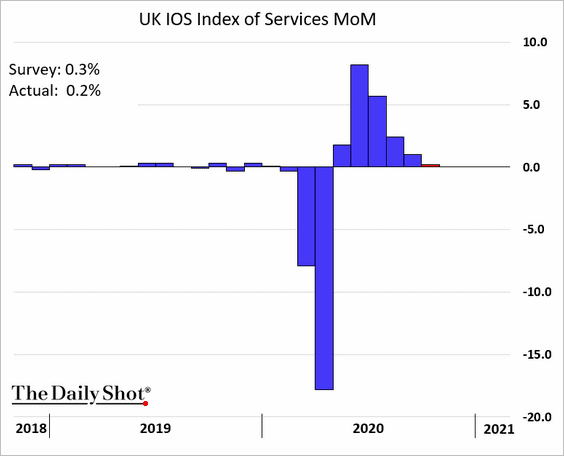
2. Here are the key components of economic activity.
• Industrial production:
• Construction output:
• Services (month-over-month):
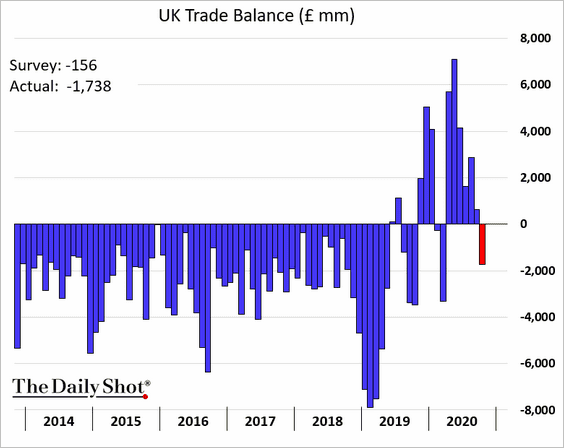
The trade balance swung into deficit, but this indicator has been noisy due to Brexit uncertainty (periods of inventory building).
——————–
3. This chart shows the UK Google searches in 2020.
 Source: Statista
The Eurozone
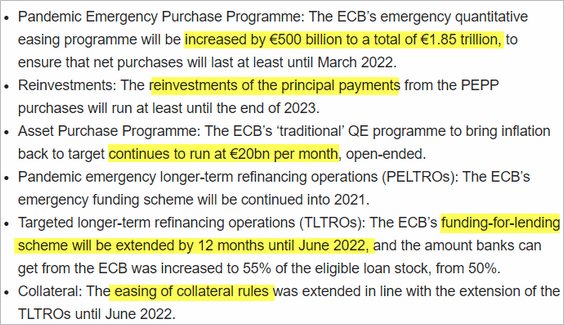
1. The ECB added €500 billion to its QE program, which was extended for nine months. Why nine? Apparently, it was a compromise between those who wanted six vs. another group who insisted on twelve. Hopefully, Europe will have achieved herd immunity by then.
There will also be more TLTRO financing for banks. Here is a summary from ING.
 Source: ING Read full article
• Below is a projection of the cumulative emergency QE balances over time.
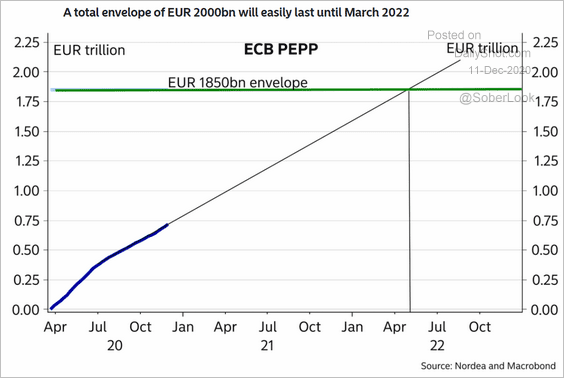 Source: Nordea Markets
And this chart shows the pace of purchases.
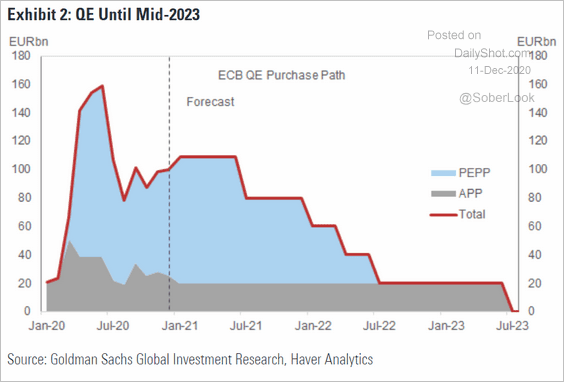 Source: Goldman Sachs
The ECB’s net purchases are now higher than the net supply of government paper.
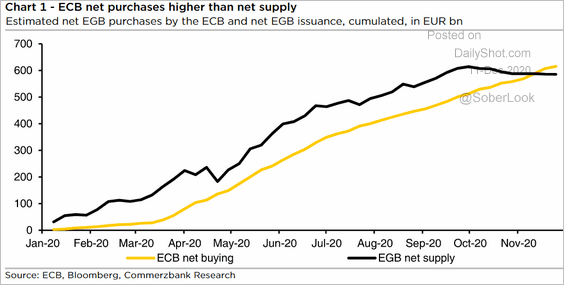 Source: Commerzbank Research
——————–
• The ECB downgraded its core CPI forecast and shifted more GDP recovery into 2022.
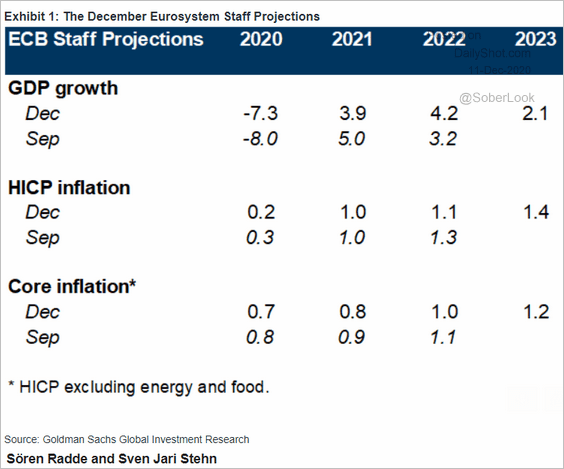 Source: Goldman Sachs
The ECB’s inflation forecasts have persistently overshot the actual outcomes.
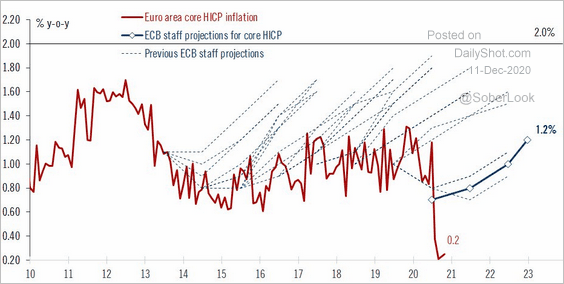 Source: @fwred
But the central bank may be undershooting in its current short-term forecast.
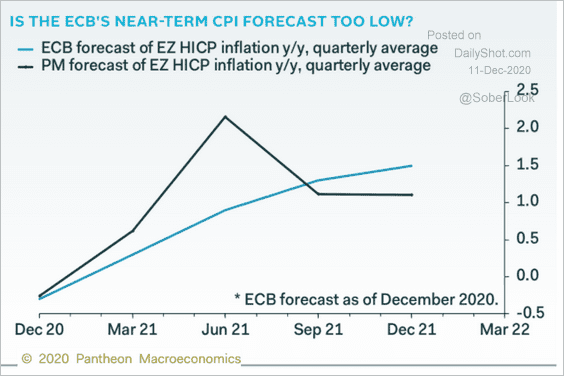 Source: Pantheon Macroeconomics
——————–
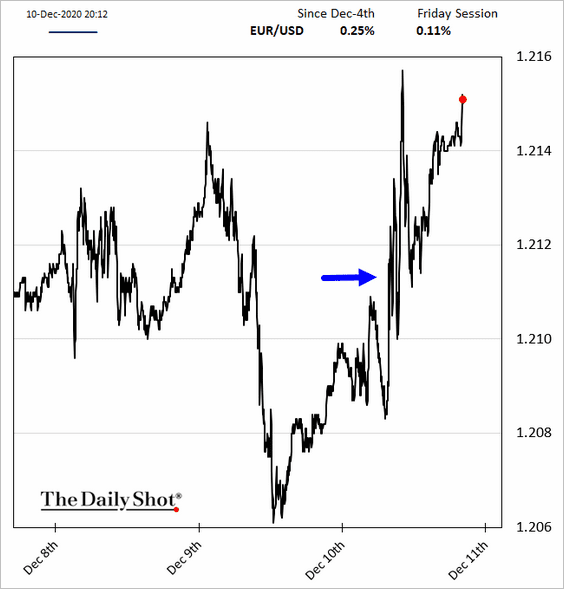
2. The markets were a bit disappointed in the ECB’s announcement – it wasn’t quite the bazooka some were hoping to see (markets wanted a faster pace of monthly purchases). The euro jumped.
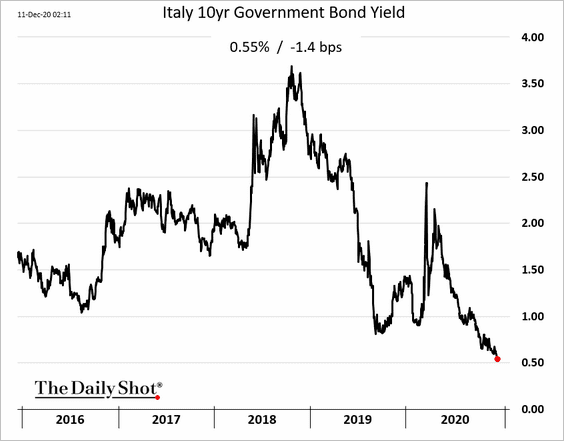
3. Italian bond yields declined further.
The ECB’s purchases of Italian debt have been higher than the capital key.
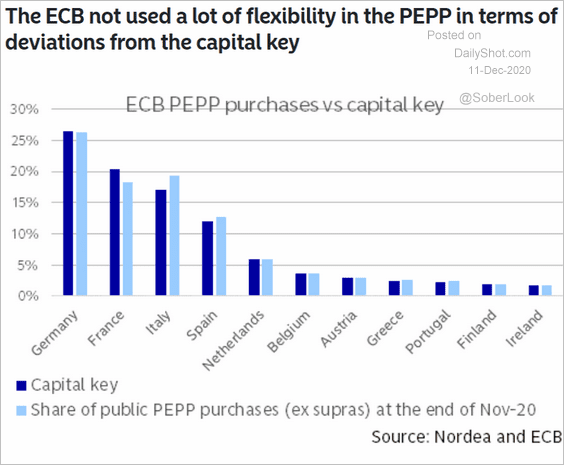 Source: Nordea Markets
——————–
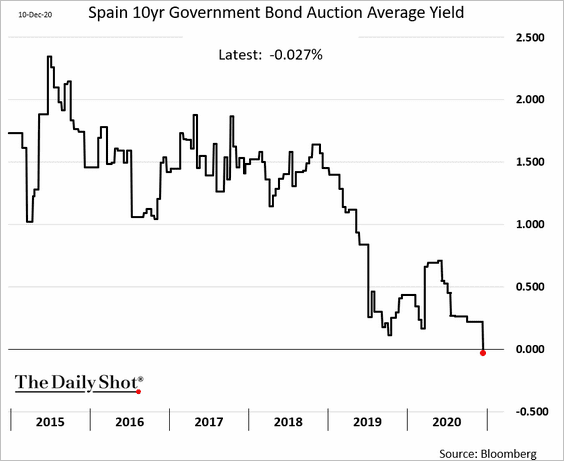
4. Spain issued a 10-year bond with a negative yield.
5. Here are some updates on France.
• Industrial production (through October):

• Mobility:
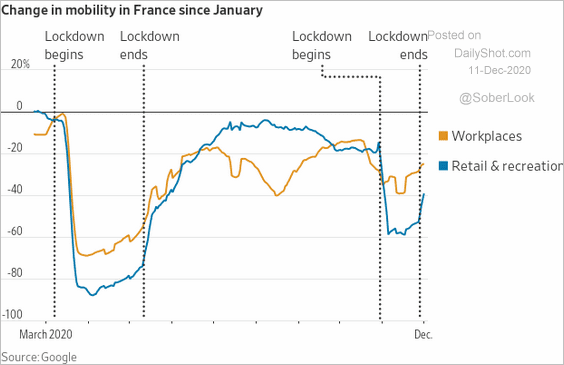 Source: @WSJ Read full article
• COVID cases and fatalities:
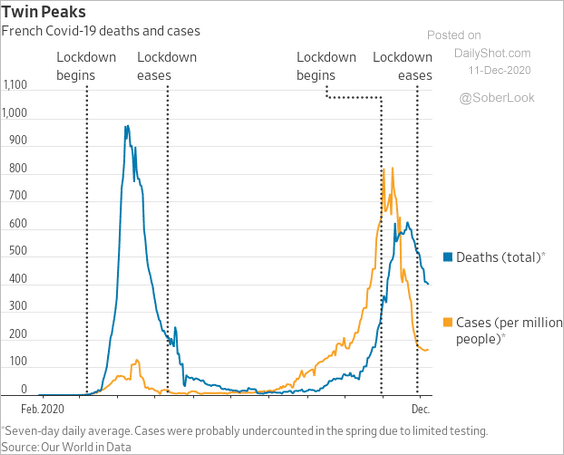 Source: @WSJ Read full article
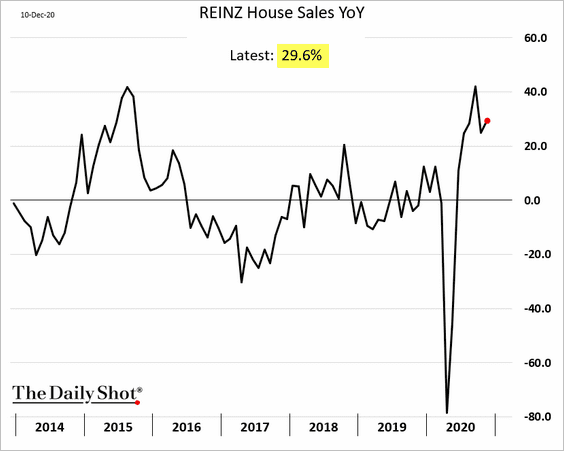
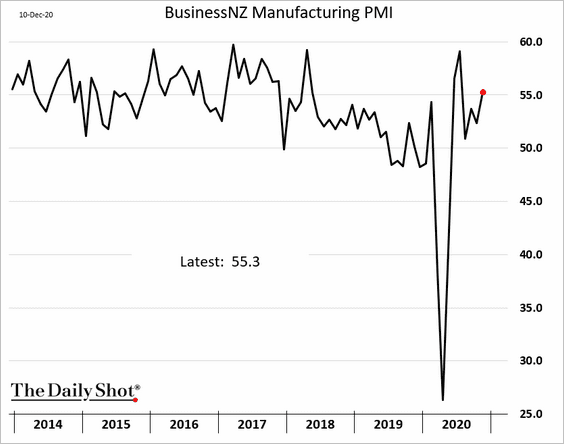
New Zealand
1. The central bank will not be explicitly including the housing market in its policy goals.
 Source: @WSJ Read full article
2. The housing market has been running hot, which is why the government wanted that policy change. Home sales are up 30% from a year ago.
3. Factory activity continued to expand last month.
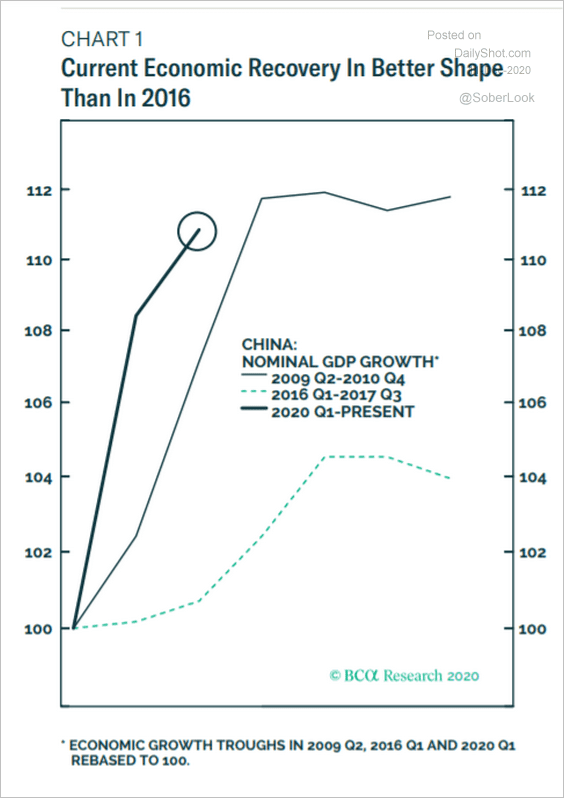
China
1. The current recovery is stronger than the one in 2016.
 Source: BCA Research
The recent spike in credit growth should keep the recovery going over the next couple of quarters.
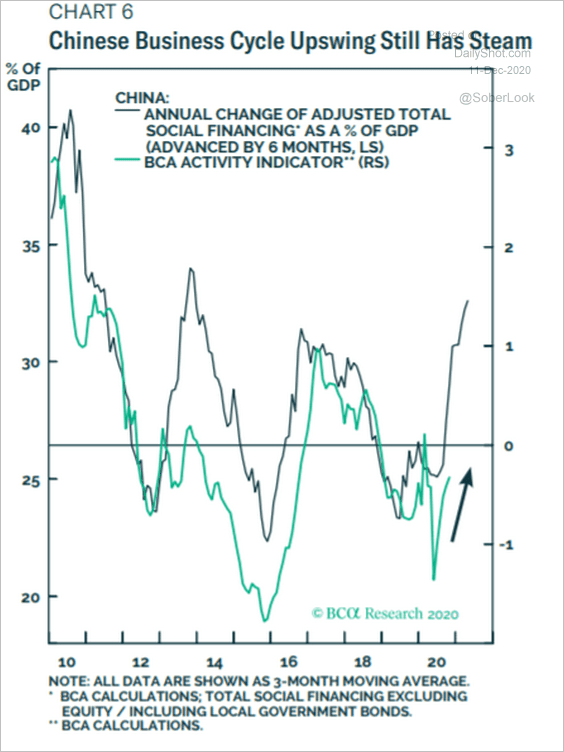 Source: BCA Research
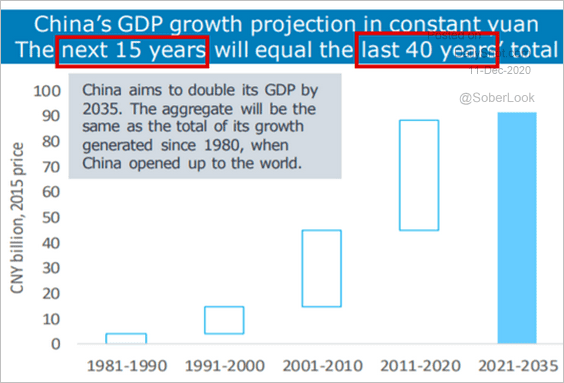
The next 15 years of growth will be equivalent to the last 40 (the y-axis should say ‘trillion’).
 Source: ANZ Research
——————–
2. The benchmark stock index is testing uptrend support.
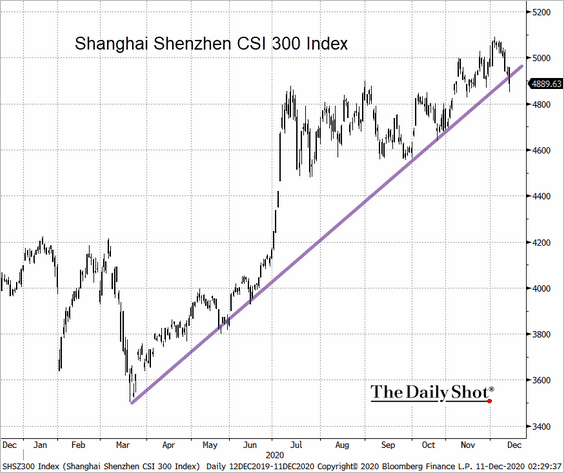 Source: @TheTerminal, Bloomberg Finance L.P.
3. China’s urbanization rate has plenty of room to catch up to developed countries.
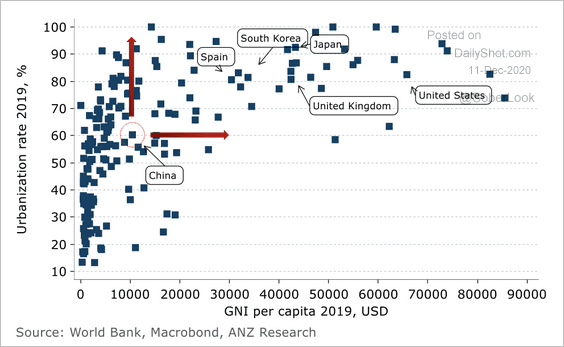 Source: ANZ Research
Emerging Markets
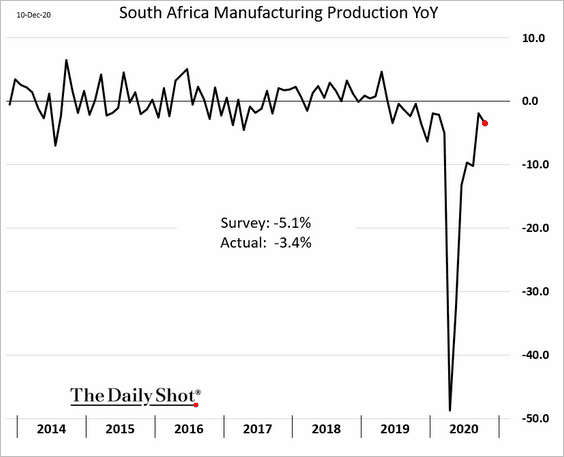
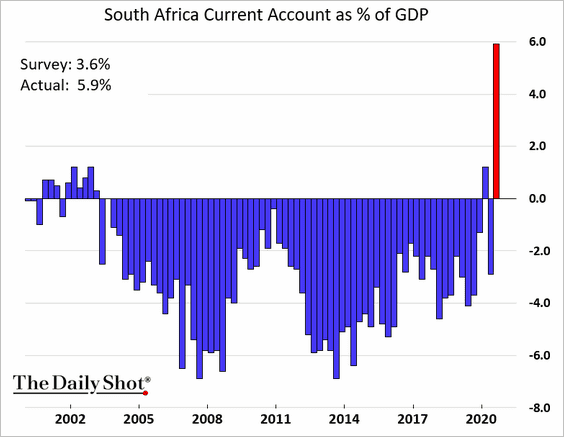
1. Let’s begin with South Africa.
• Manufacturing production continues to recover.
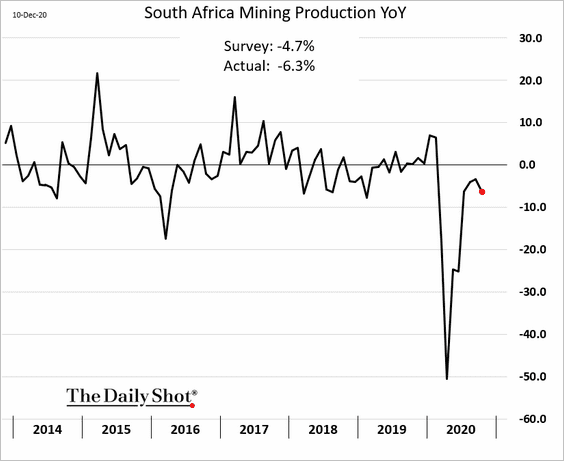
• Mining output stalled in October.
• South Africa’s current account hit a record surplus last quarter. Higher gold prices and stronger agricultural exports helped. After foreigners dumped the nation’s stocks and bonds earlier in the year, there was less dividend and interest to pay. See this story for more detail.
——————–
2. Goldman boosted its inflation forecast for Russia.
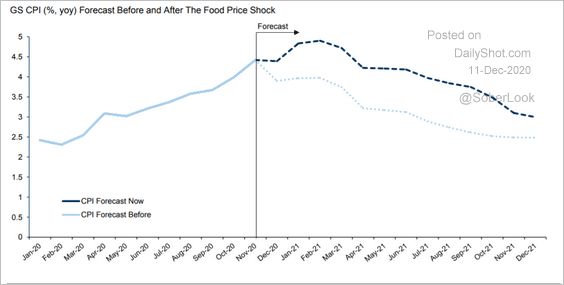 Source: Goldman Sachs
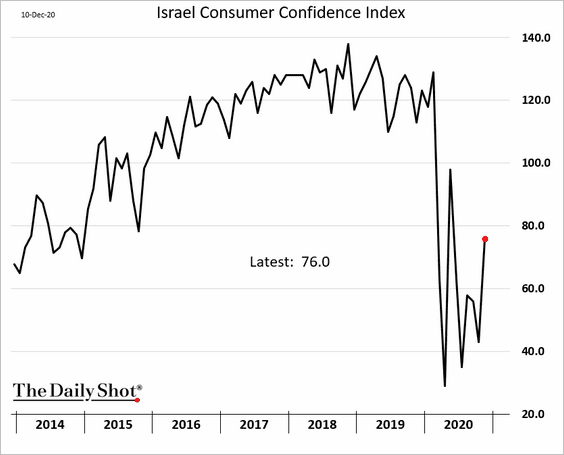
3. Israel’s consumer confidence is starting to recover.
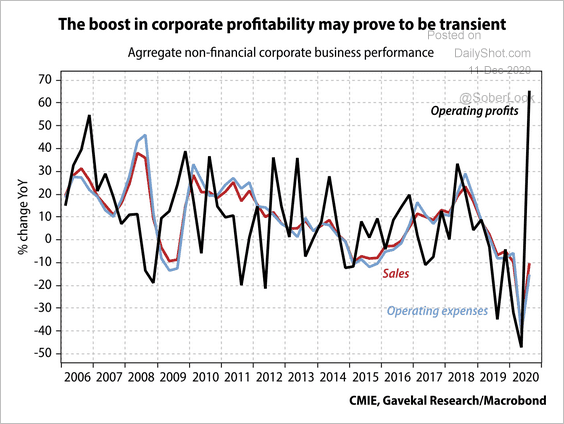
4. Here are some updates on India.
• The surge in corporate profits does not reflect a commensurate rebound in sales. This is due to reductions in operating expenses such as labor and raw materials, according to Gavekal.
 Source: Gavekal
• Equity valuations appear stretched.
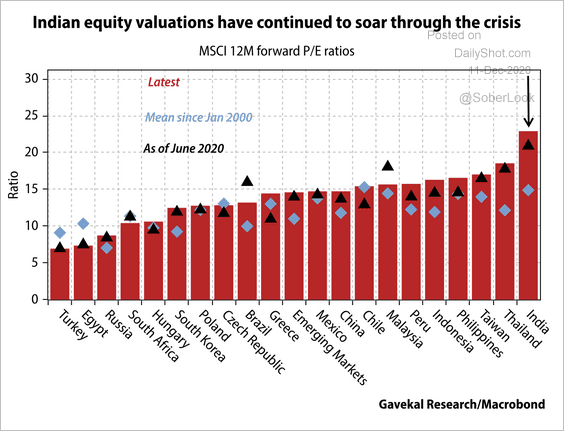 Source: Gavekal
• The 10-year government bond yield remains elevated despite the RBI’s accommodative stance. Will we see further rate cuts next year?
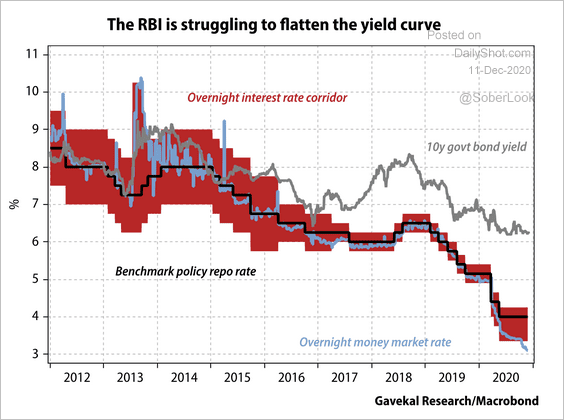 Source: Gavekal
——————–
5. The Malaysian ringgit continues to strengthen. USD/MYR is testing support.
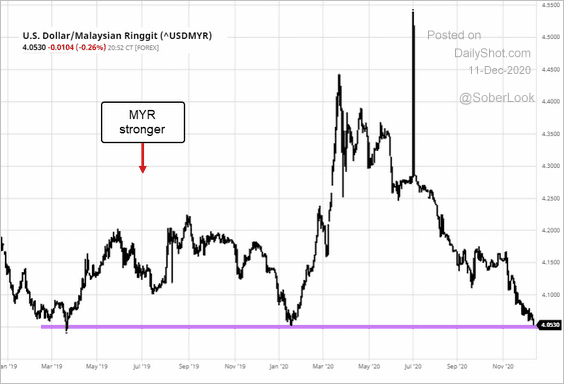 Source: barchart.com
6. Next, we have a couple of updates on Brazil.
• Retail sales have been impressive, but they diverged from consumer confidence (second chart).
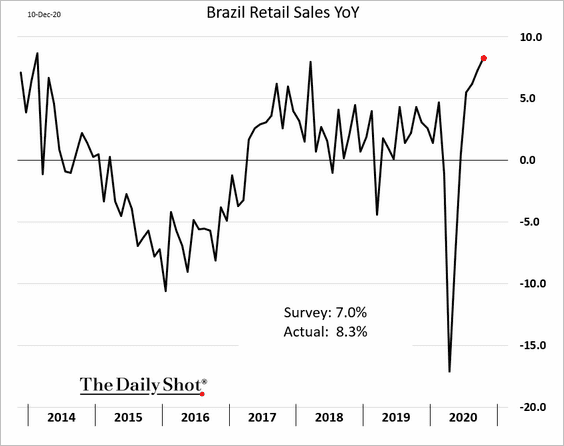
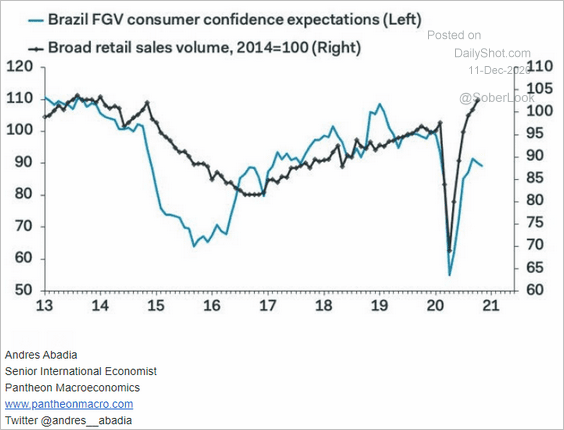 Source: Pantheon Macroeconomics
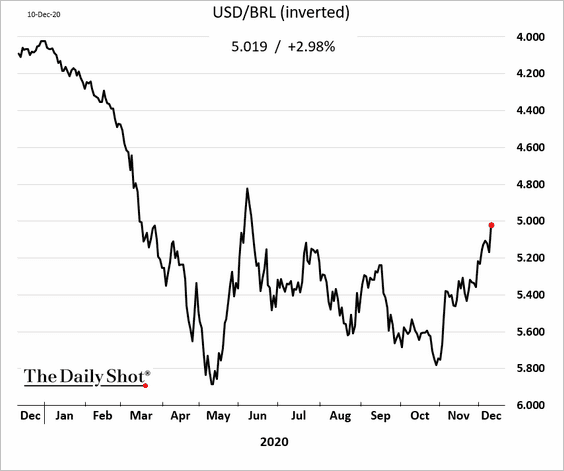
• The real is recovering:
——————–
7. The largest EM equity ETF (EEM) has rallied sharply but is not getting capital inflows. More upside for EM stocks?
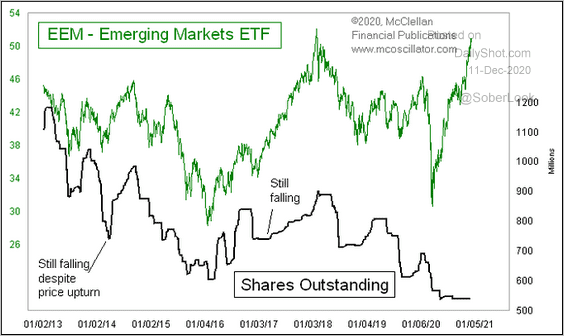 Source: @McClellanOsc
Cryptocurrency
Bitcoin is back below $18k amid some profit-taking.
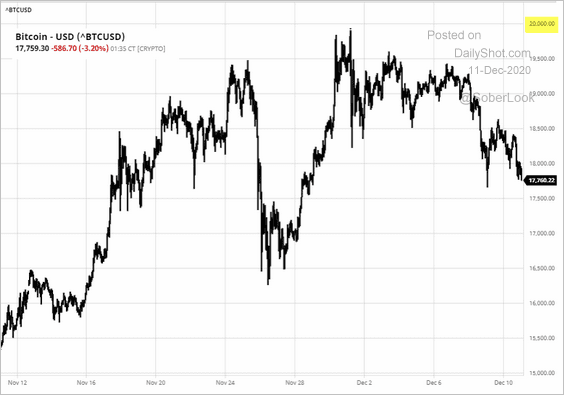 Source: barchart.com
Commodities
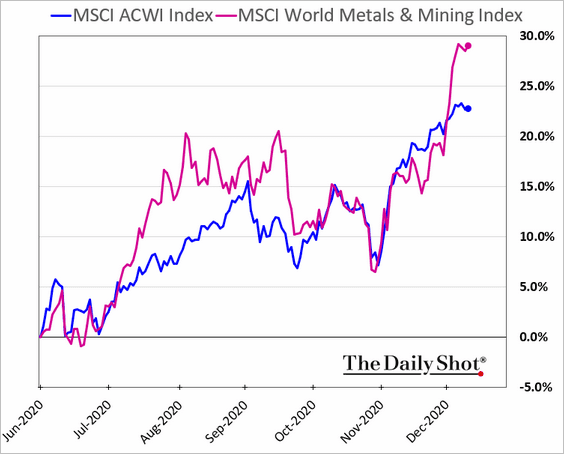
1. Global metals & mining shares are outperforming.
2. Bloomberg’s commodity index hit a multi-year high.
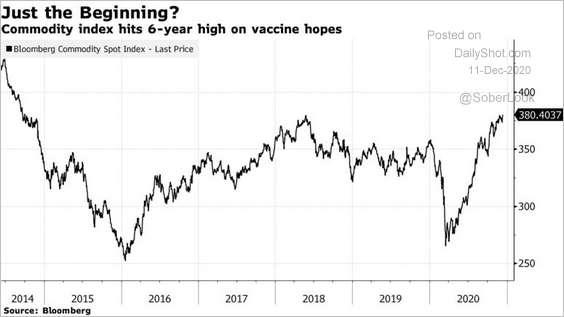 Source: @markets Read full article
And there may be more gains ahead.
 Source: @WSJ Read full article
——————–
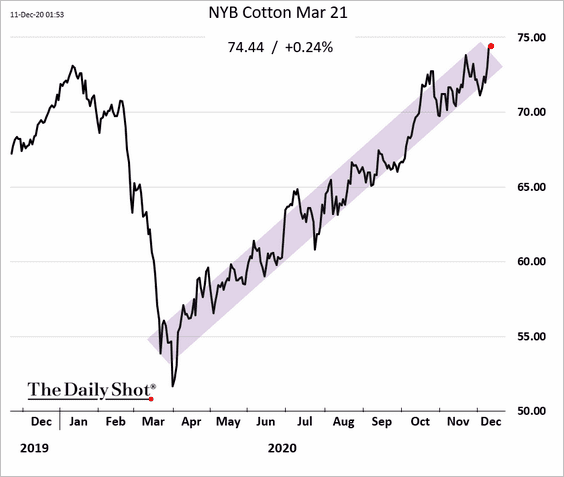
3. US cotton futures continue to rally, with the latest gains driven by a government report estimating lower-than-expected global stockpiles.
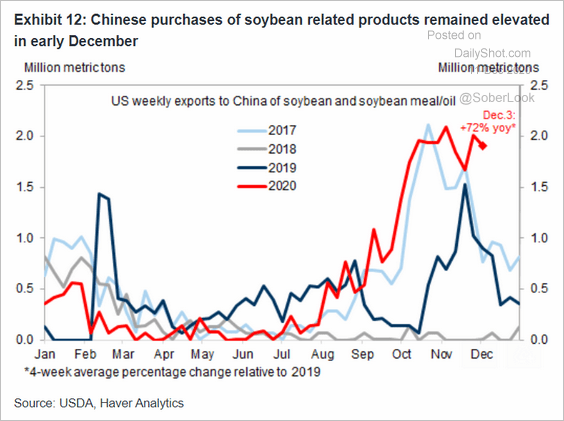
4. China’s imports of US soy products are well above the levels we saw in recent years. China needs to feed its rapidly growing pig herd.
 Source: Goldman Sachs
Energy
1. Brent futures are above $50/bbl, with the RSI indicator in overbought territory.
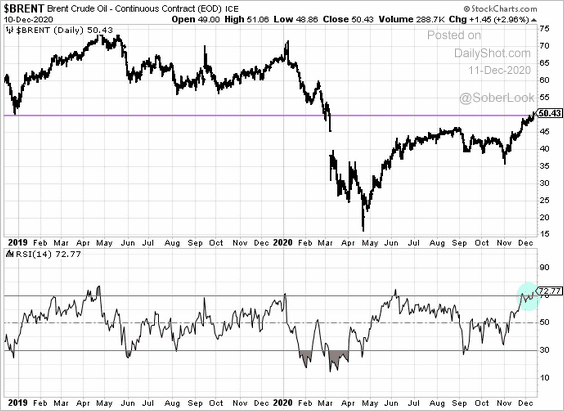
• Oil prices have been strong despite renewed lockdown measures in the US and Europe.
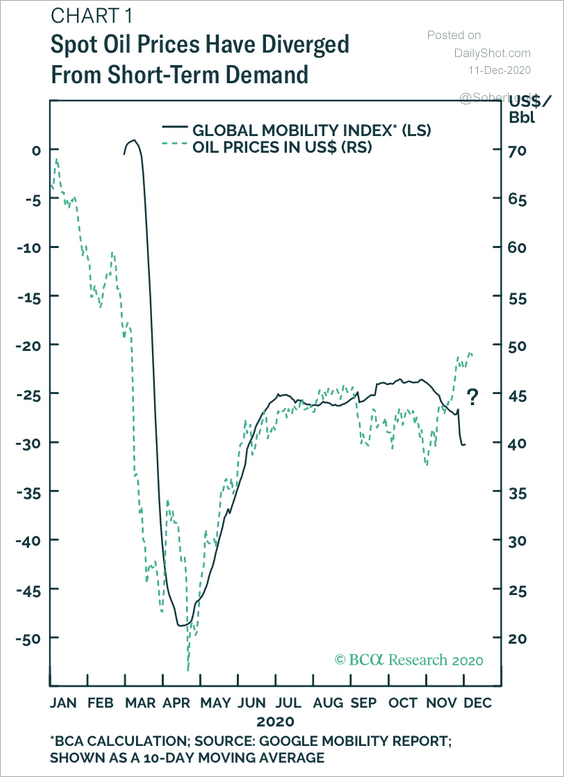 Source: BCA Research
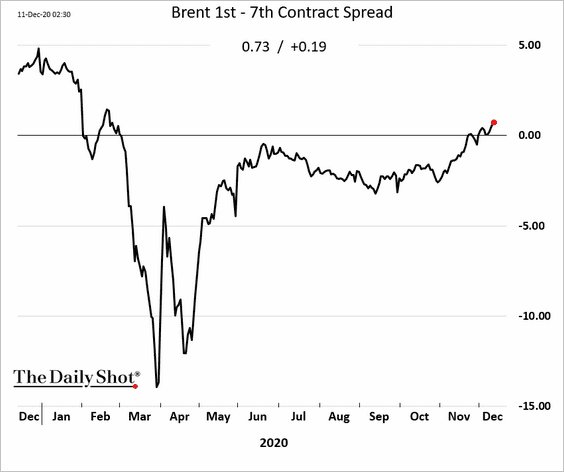
• The Brent curve is moving deeper into backwardation (negatively-sloping).
——————–
2. US gasoline demand has been deteriorating.
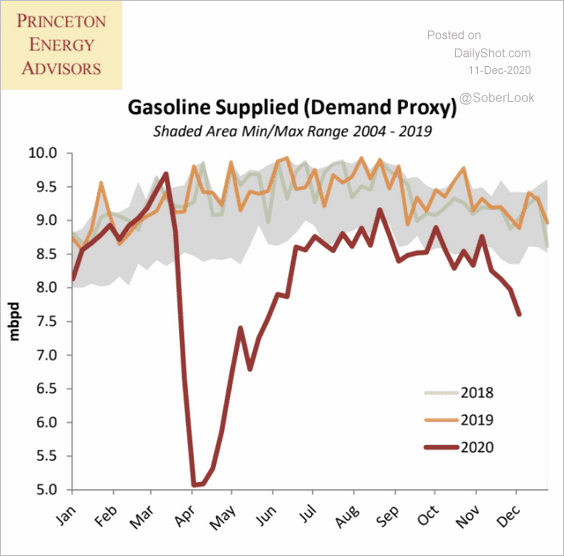 Source: Princeton Energy Advisors
And refinery inputs remain soft.
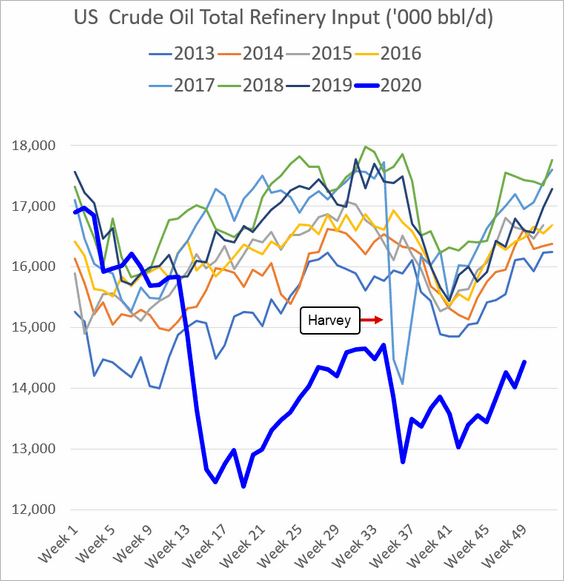
——————–
3. Oil inventories popped last week.
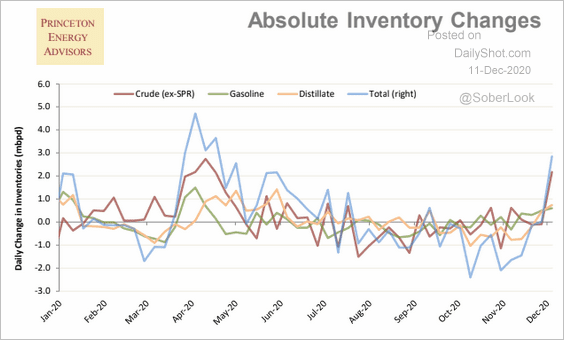 Source: Princeton Energy Advisors
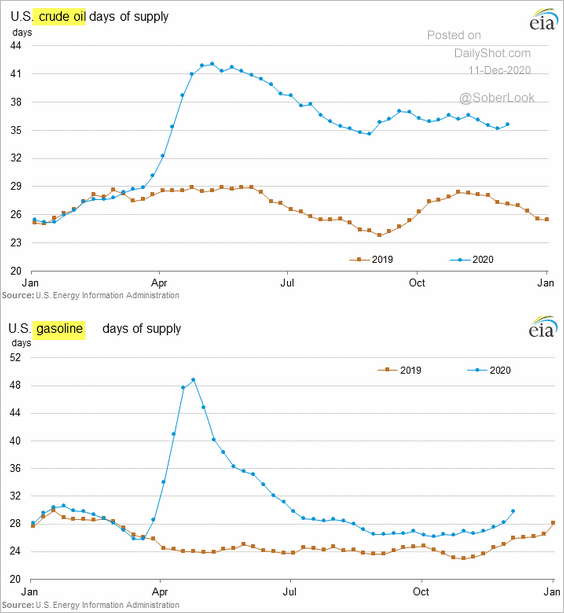
Here are the inventory trends measured in days of supply.
——————–
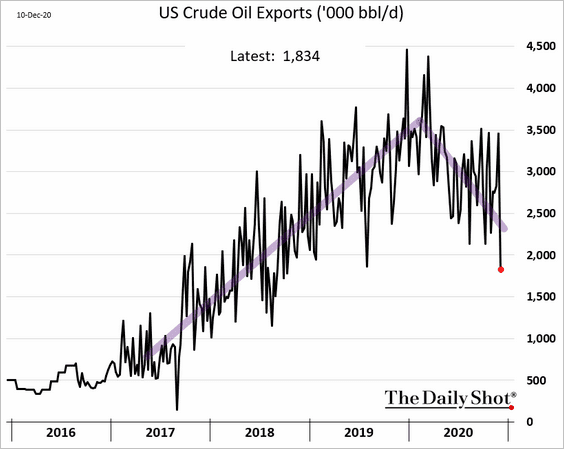
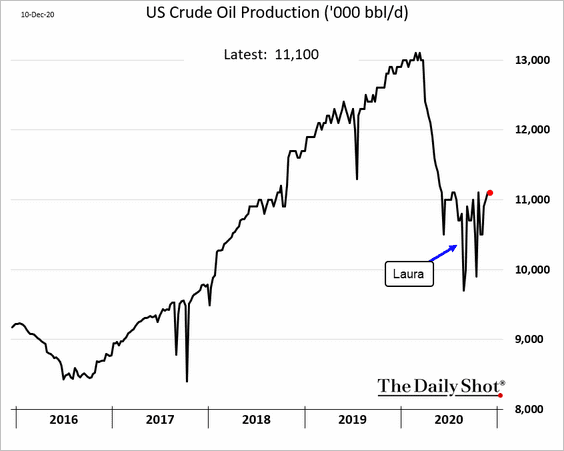
4. US gross oil exports continue to trend lower.
5. Will US oil production start recovering?
Equities
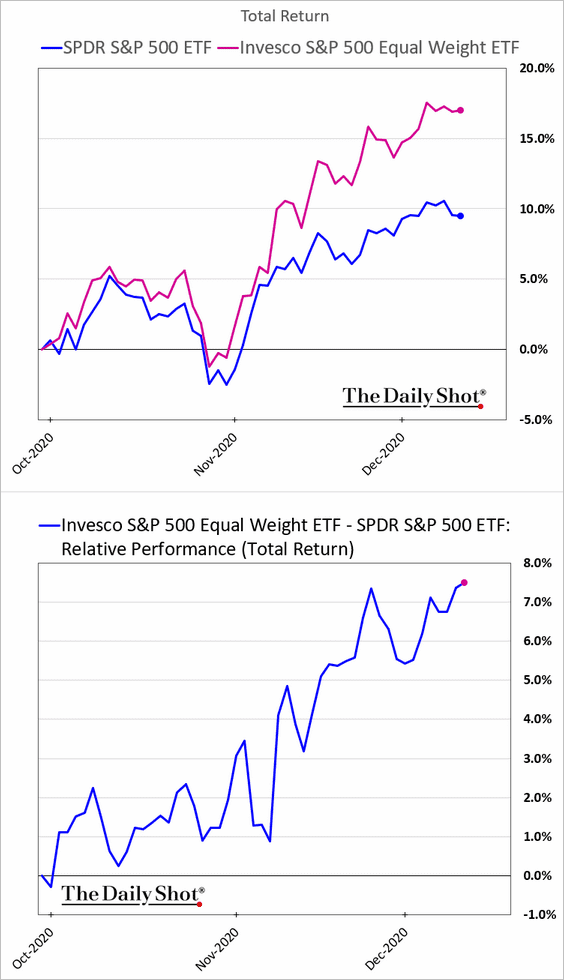
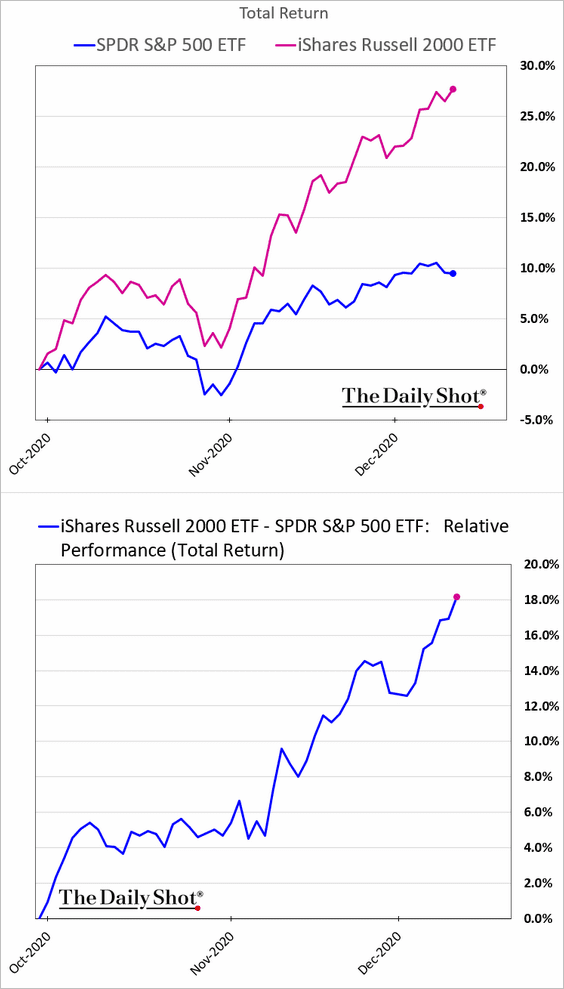
1. The rotation into smaller stocks continues.
• Equal-weight S&P 500:
• Small caps:
——————–
2. The post-IPO basket of stocks is up nearly 120% this year.
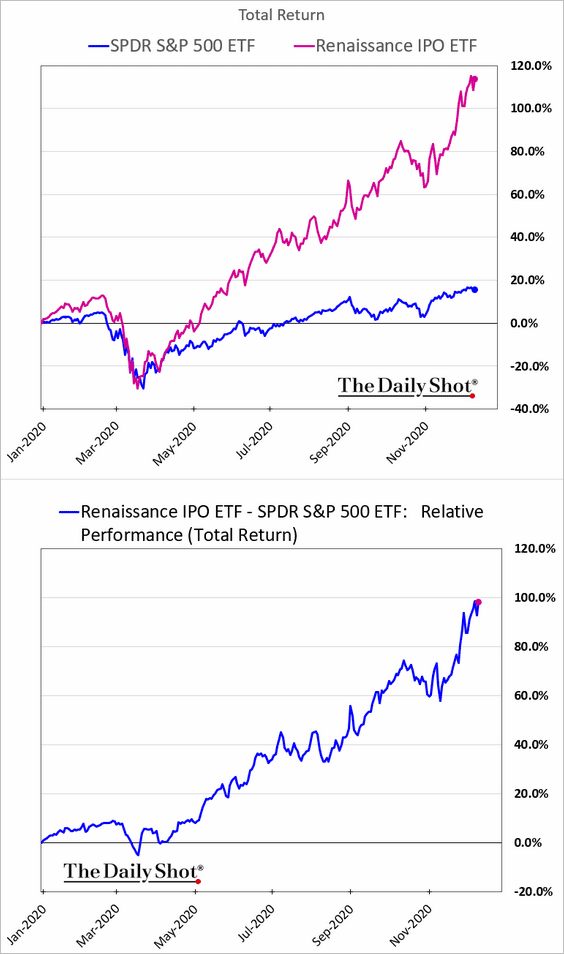
And the index of stocks loved by retail investors is up over 80%.
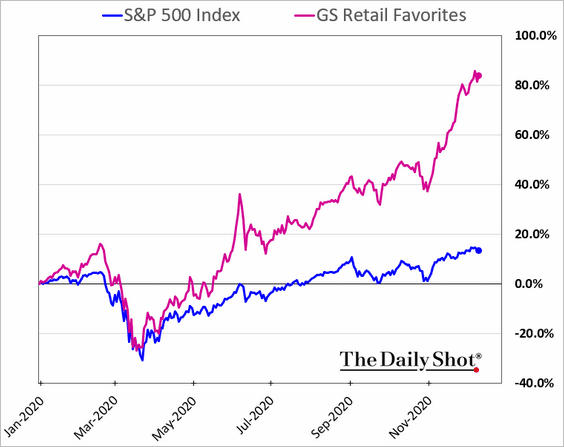
——————–
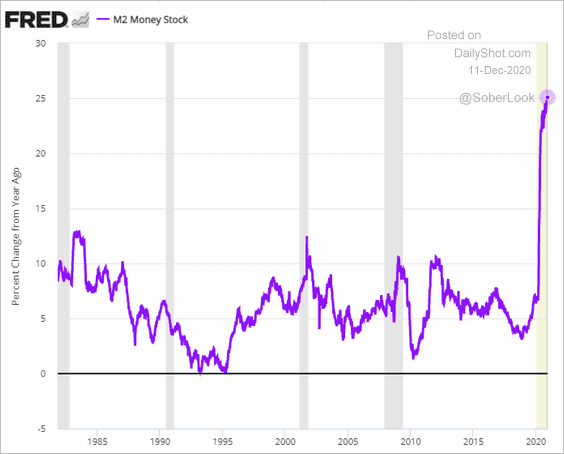
3. The US broad money supply is up 25% from a year ago. Many analysts believe that this is a key reason for the dramatic stock market rally this year. Of course, large numbers of young investors working or studying from home (after receiving government checks this spring) also helped.
Moreover, the money supply growth spike has been global.
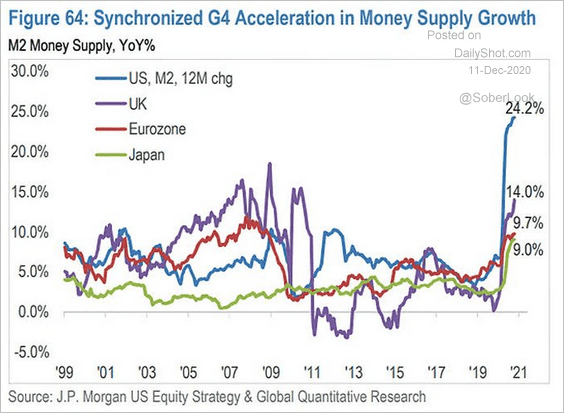 Source: @ISABELNET_SA, @jpmorgan
But will a slowdown in global money supply weigh on equities next year?
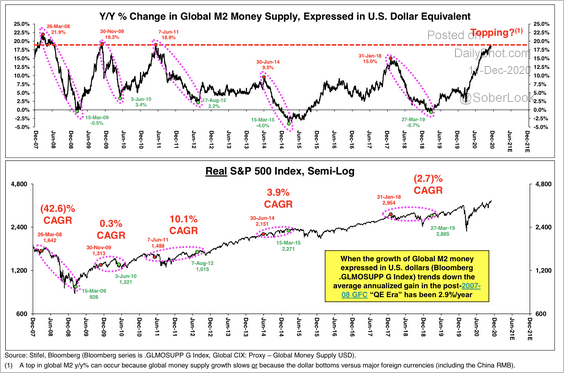 Source: Stifel
——————–
4. Tesla’s addition to the S&P 500 will meaningfully boost the forward P/E ratio of the index.
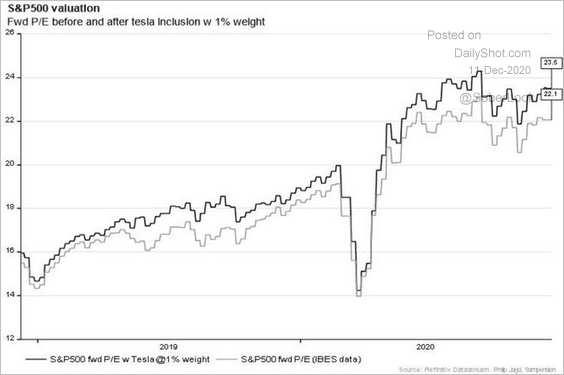 Source: @PhilipJagd
5. A backup in US real yields could pose a risk for earnings.
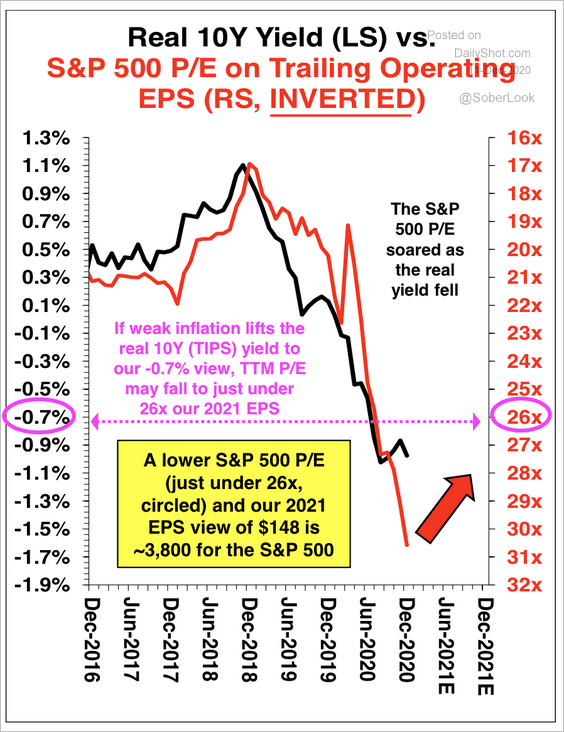 Source: Stifel
6. Despite the rally in value stocks, the value-growth forward P/E (valuation) gap is still massive.
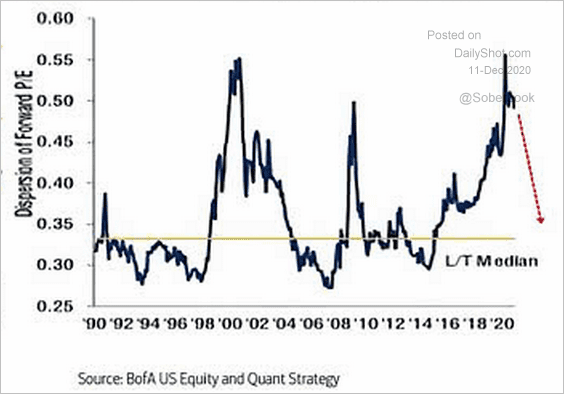 Source: @ISABELNET_SA, @BofAML
7. The put-call ratio remains near extreme levels.
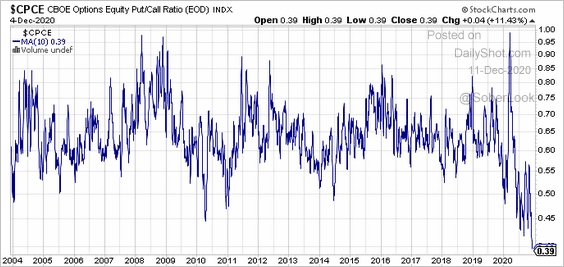 Source: @CapitalObserver
8. Here is a nice overview of the K-shape recovery concept from Liz Ann Sonders.
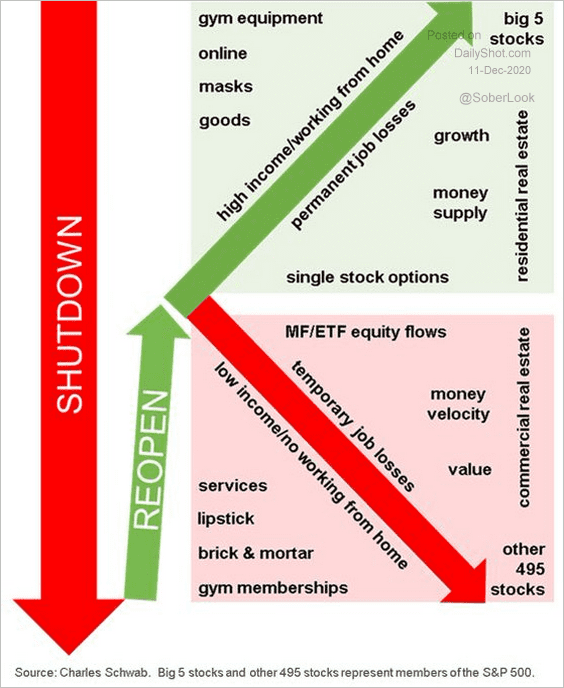 Source: @LizAnnSonders
Global Developments
1. The composite Markit PMI index points to a rapid GDP rebound.
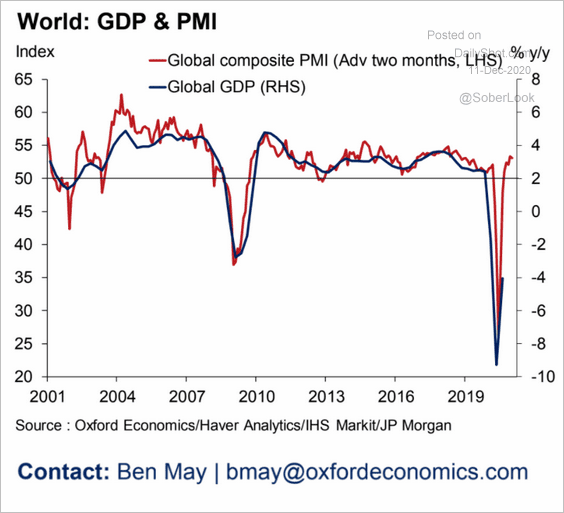 Source: Oxford Economics
2. Markets worldwide (stocks, bonds, commodities, etc.) have rapidly become expensive this year.
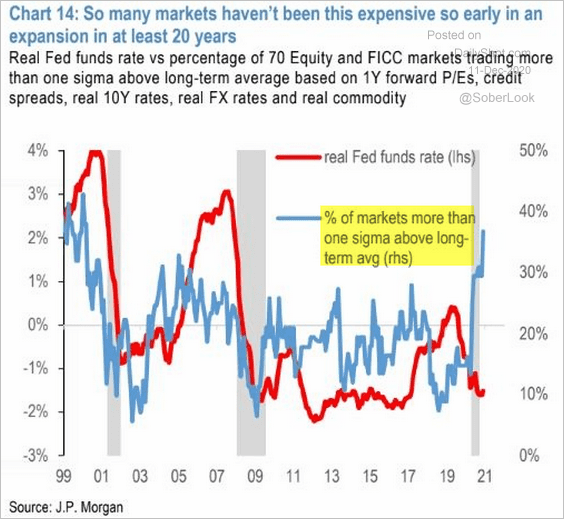 Source: JP Morgan
3. Employees expect to work from home more in the post-COVID world.
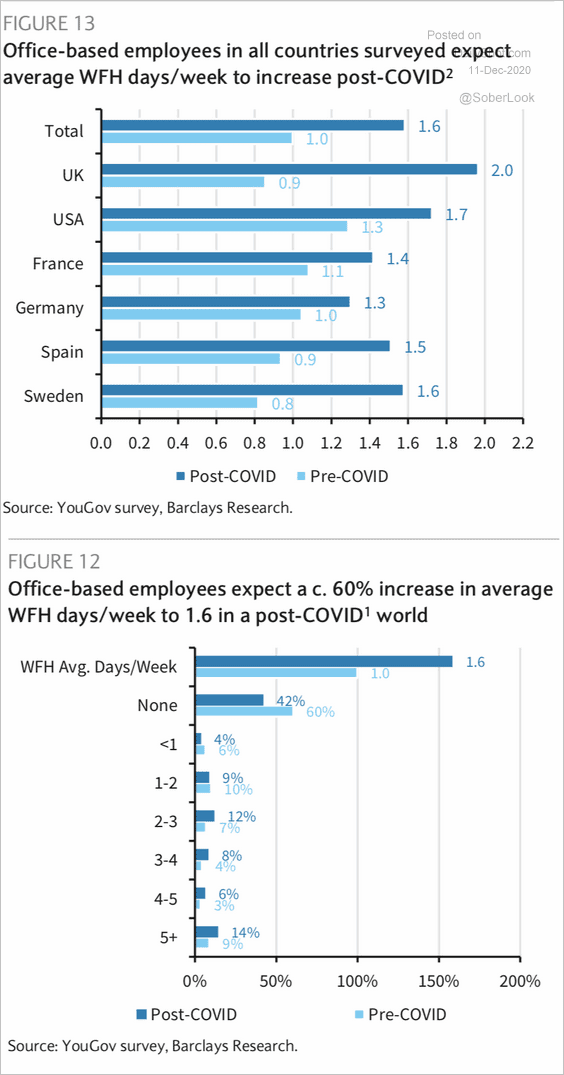 Source: Barclays Research
——————–
Food for Thought
1. Which countries are at ease with having women in charge?
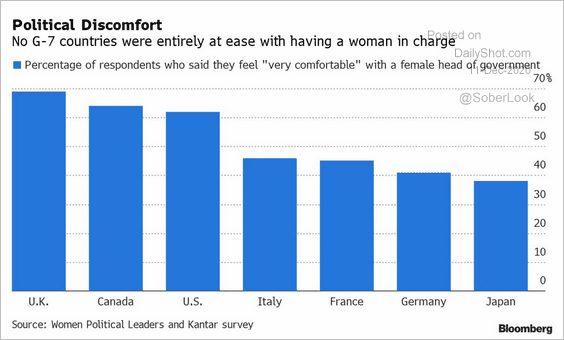 Source: @BloombergQuint Read full article
2. Americans’ concerns about the pandemic:
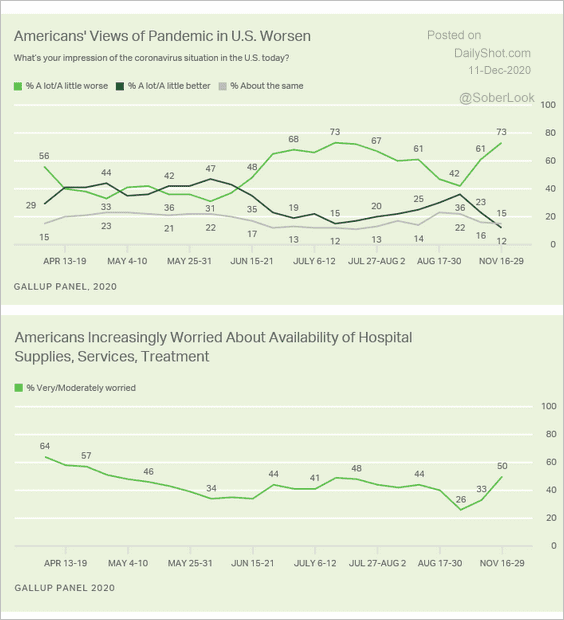 Source: Gallup Read full article
3. Going hungry:
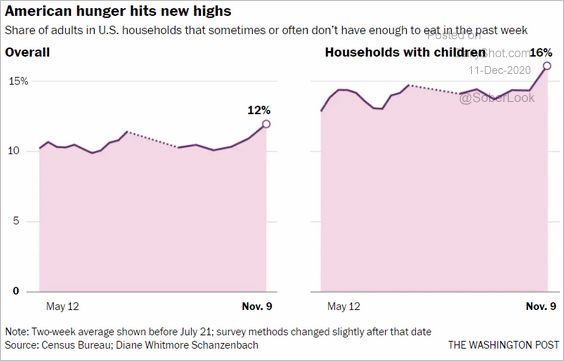 Source: The Washington Post Read full article
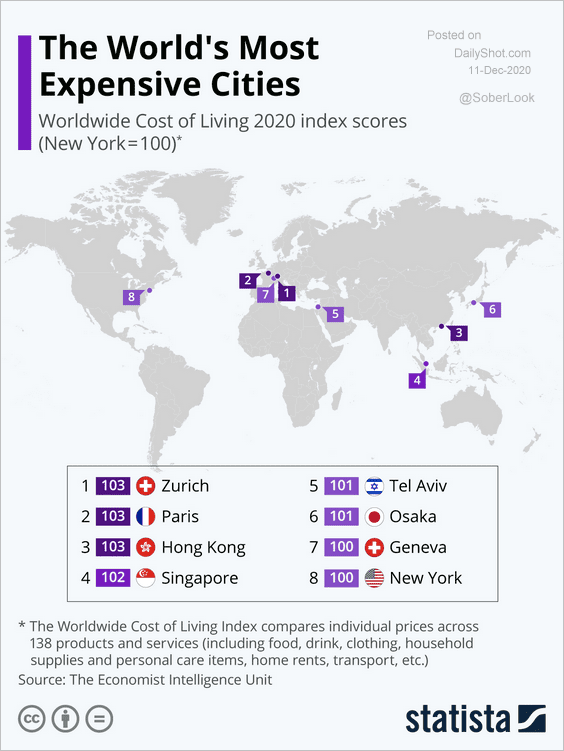
4. The world’s most expensive cities (2 charts):
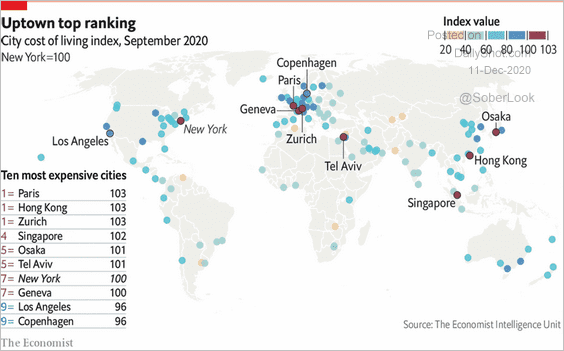 Source: The Economist Read full article
 Source: Statista
——————–
5. US manufacturing and nonmanufacturing employment:
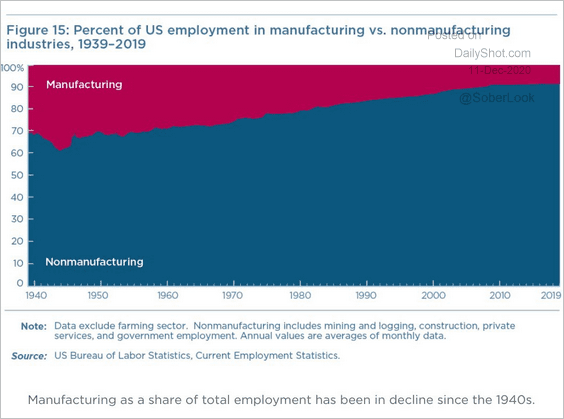 Source: @adam_tooze, @PIIE Read full article
6. The decline in foot traffic (vs. last year) at different types of retail properties:
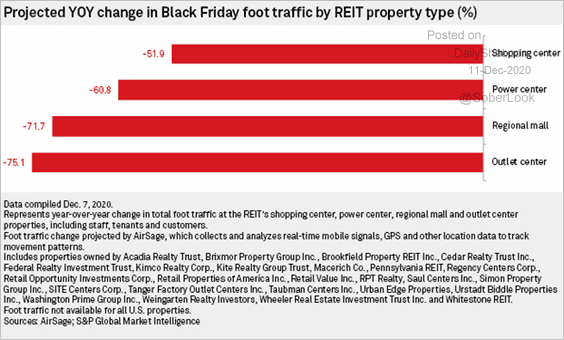 Source: S&P Global Market Intelligence
7. DoorDash’s market value vs. the same for several large restaurant chains (combined):
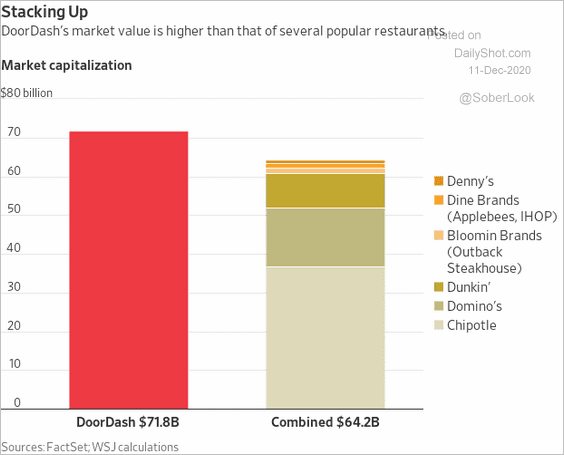 Source: @WSJ Read full article
8. Interest in shows/movies about serial killers:
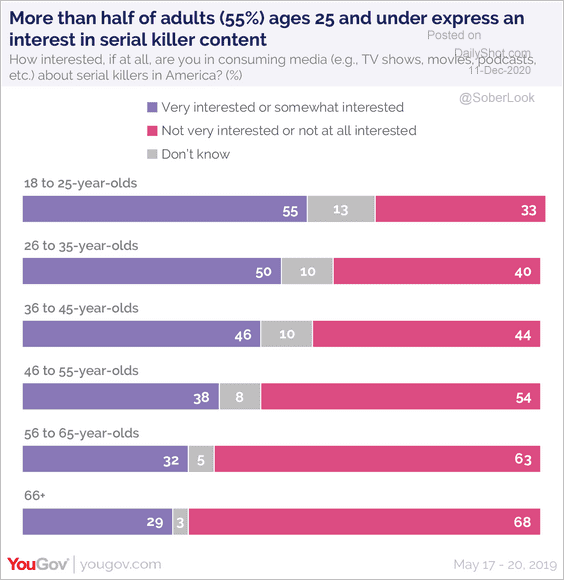 Source: YouGov Read full article
9. Each state’s favorite quarantine activity:
 Source: @mattsurely
——————–
Have a great weekend!