The Daily Shot: 17-Dec-20
• The United States
• The United Kingdom
• The Eurozone
• Asia – Pacific
• Emerging Markets
• Cryptocurrency
• Commodities
• Energy
• Equities
• Credit
• Global Developments
• Food for Thought
The United States
1. The Fed provided guidance for its asset purchases on Wednesday, with language suggesting that QE could continue for some time.
FOMC: … the Federal Reserve will continue to increase its holdings of Treasury securities by at least $80 billion per month and of agency mortgage-backed securities by at least $40 billion per month until substantial further progress has been made toward the Committee’s maximum employment and price stability goals.
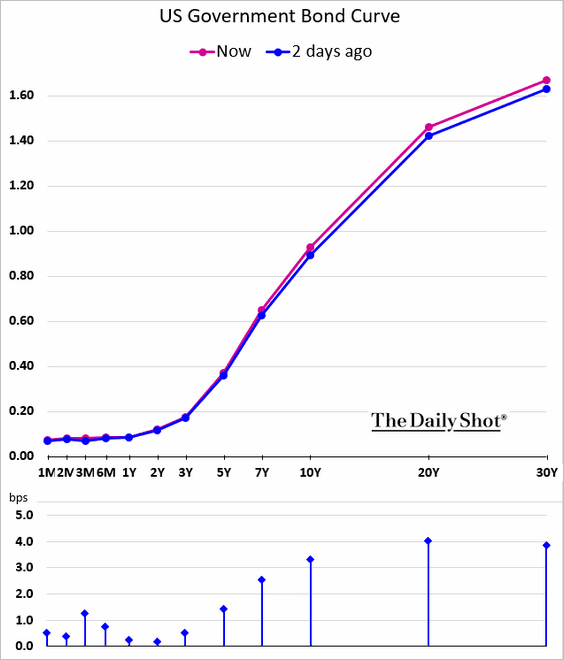
The market was a bit disappointed, with some expecting the central bank to boost the average maturity of bonds purchased. The yield curve steepened slightly in response.
• According to the FOMC’s dot plot, the fed funds rate will remain near zero through the end of 2023.
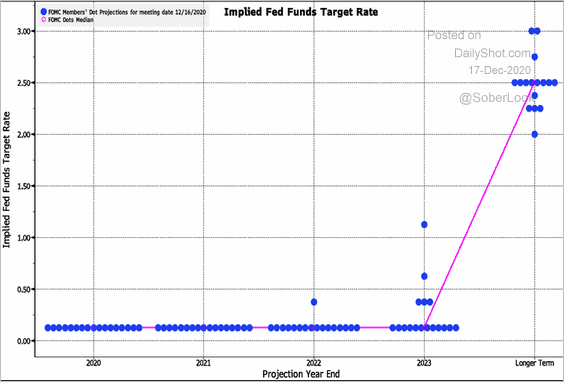 Source: @TheTerminal, Bloomberg Finance L.P.
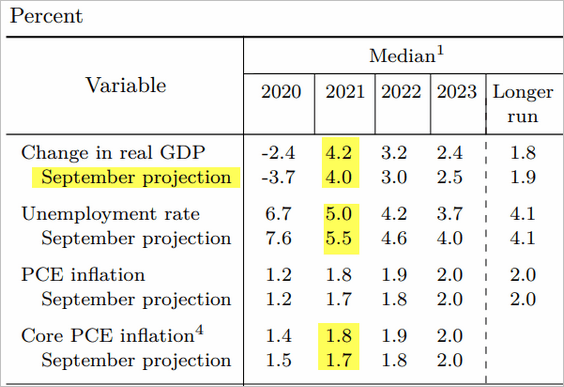
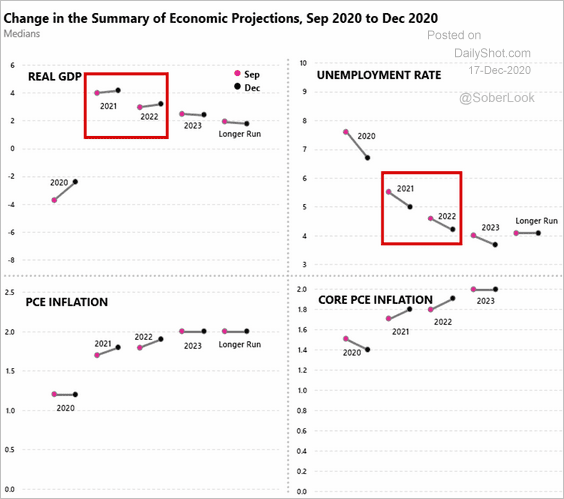
• The Fed boosted its projections for next year’s GDP growth and inflation while reducing the expected unemployment rate.
 Source: FOMC Read full article
 Source: @ernietedeschi
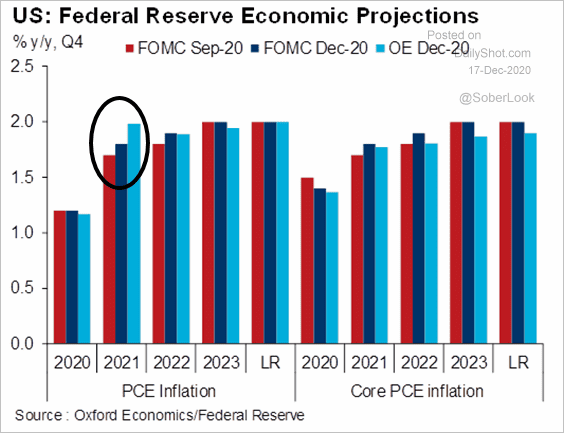
• With the lofty projection of 4.2% GDP growth next year, could the Fed get an inflation surprise? Here is a forecast from Oxford Economics (“OE”).
 Source: @GregDaco
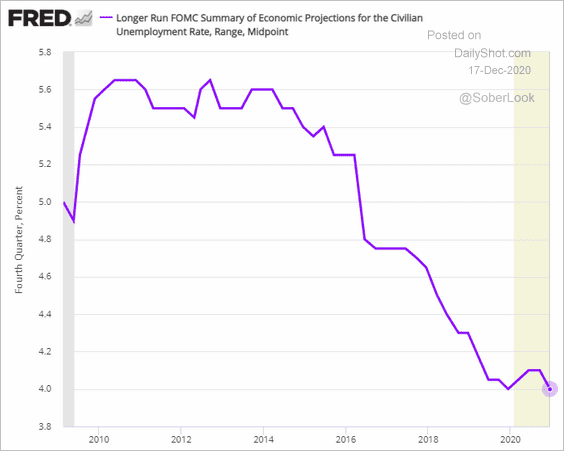
• The FOMC still sees the “long-run” unemployment rate at 4%.
——————–
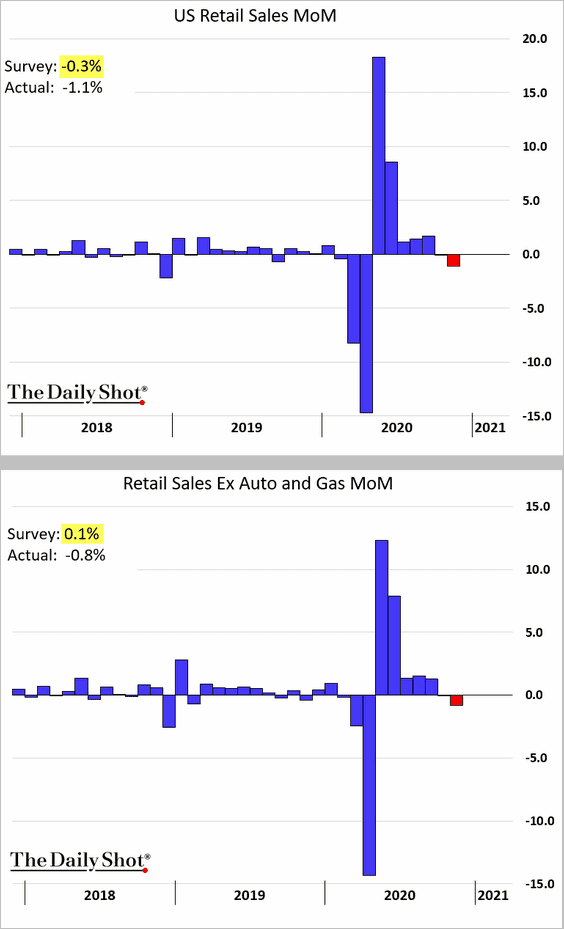
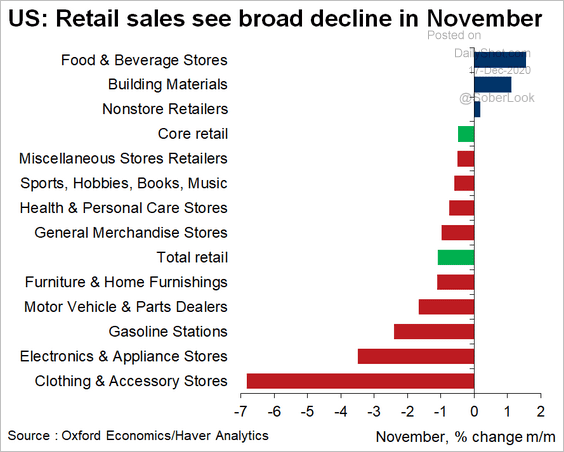
2. After a massive post-lockdown rebound, retail sales pulled back last month. The report came in well below market expectations.
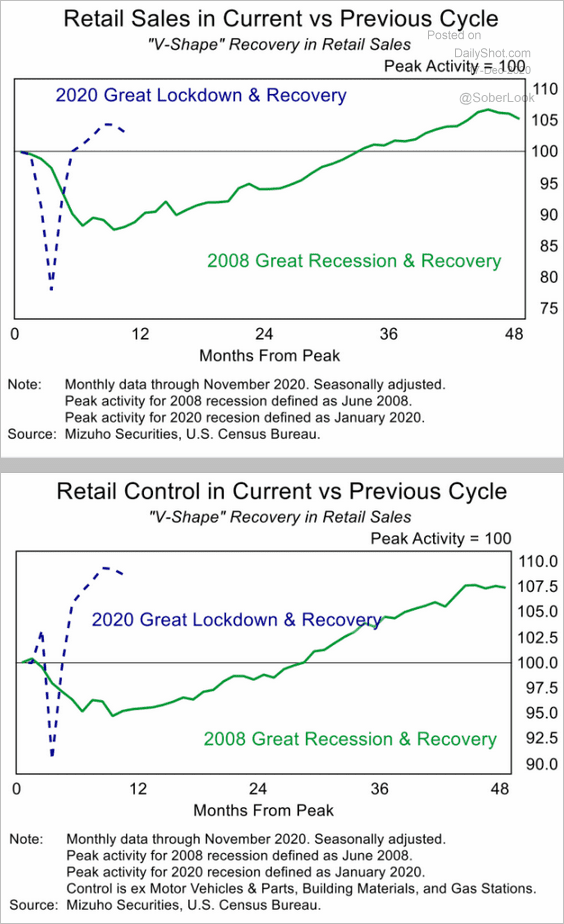
• Here is the trajectory vs. the 2008 recession (the “control group” excludes autos, gasoline, and construction materials).
 Source: Mizuho Securities USA
• The November decline in retail sales was broad.
 Source: Oxford Economics
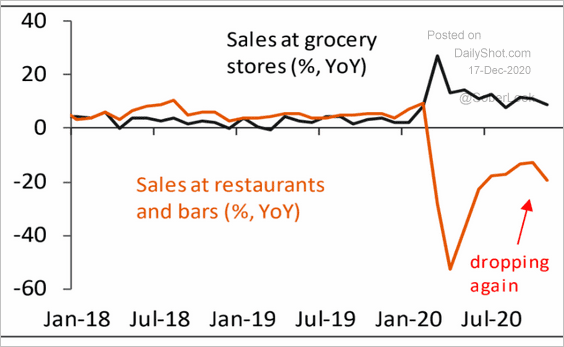
• Restaurants took a hit.
 Source: Piper Sandler
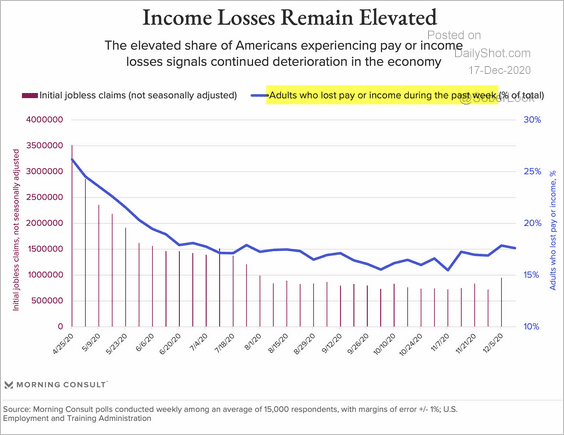
• Retail sales were pressured by lost income …
 Source: Morning Consult
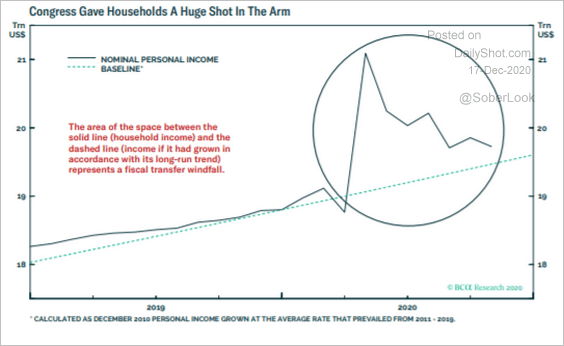
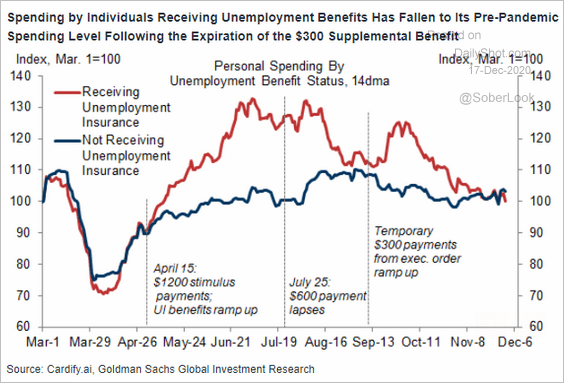
… and declining government support.
BCA Research: – It is perfectly reasonable to be concerned about the fading household income windfall. … the fiscal thrust is unequivocally fading. Oftentimes in markets, the direction of a variable is more impactful than its level.
 Source: BCA Research
This chart shows personal spending by Americans with and without unemployment benefits.
 Source: Goldman Sachs
——————–
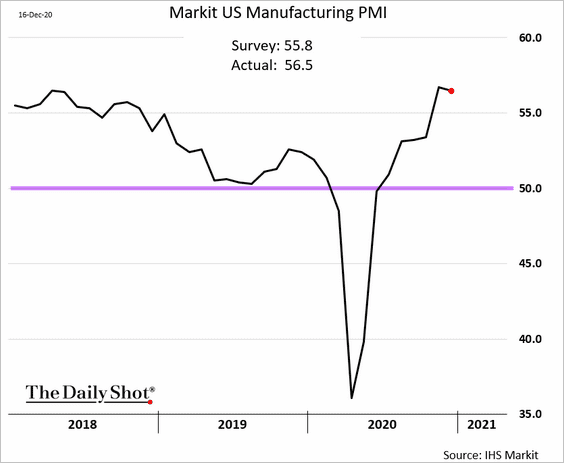
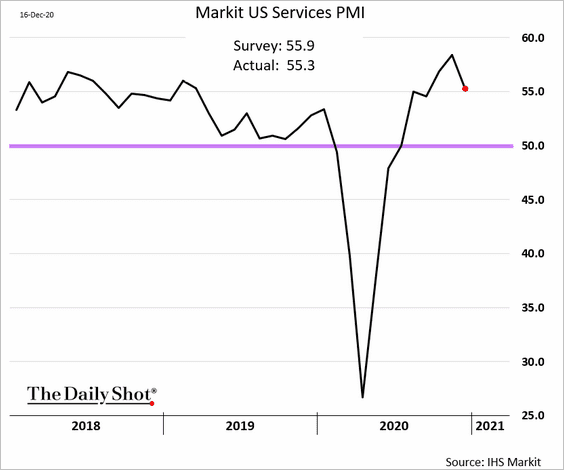
3. Business activity remained resilient in December. Here are the Markit PMI trends (PMI has been well above 50, which indicates growth).
• Manufacturing:
• Services:
——————–
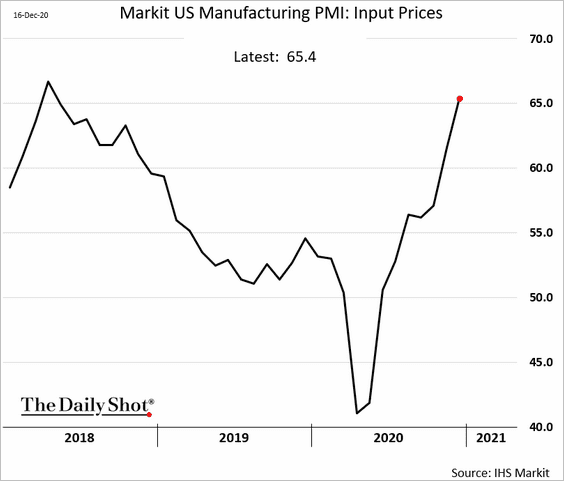
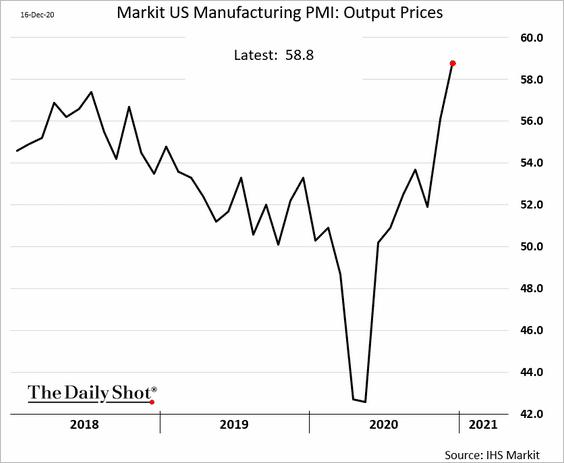
4. Manufacturers are increasingly feeling price pressures, and they seem to be passing those higher costs on to their customers.
• Input prices PMI:
• Output prices PMI:
——————–
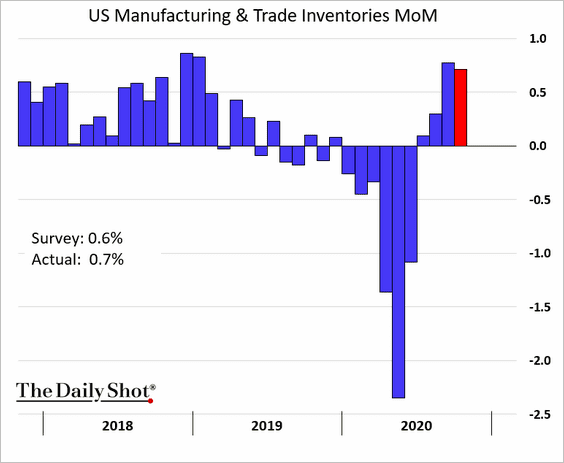
5. Inventory rebuilding continues.
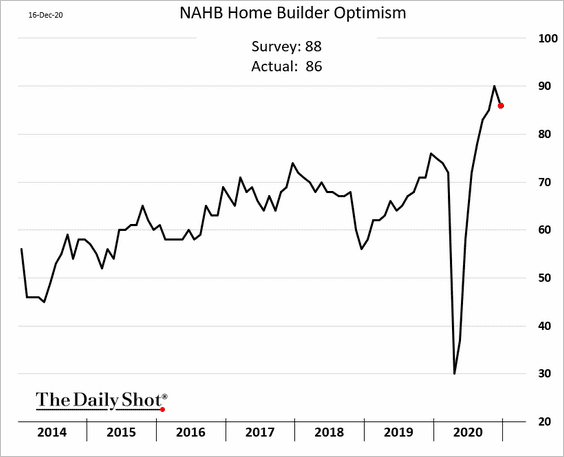
6. The NAHB homebuilder optimism index came off its record high but is still elevated.
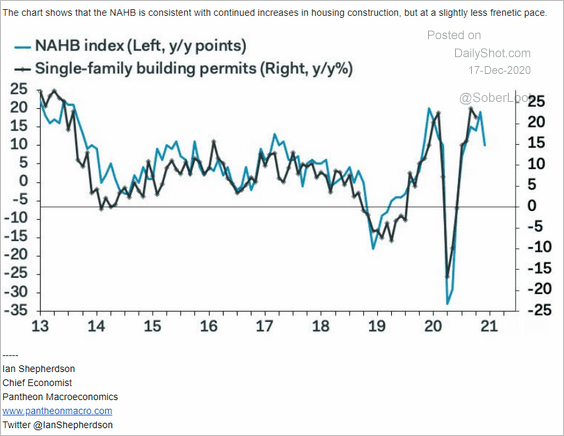
Residential construction growth is expected to stay robust.
 Source: Pantheon Macroeconomics
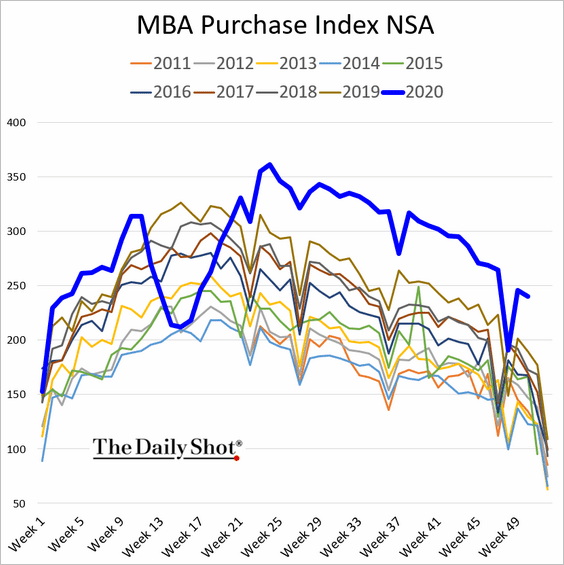
Mortgage applications remain strong for this time of the year.
The United Kingdom
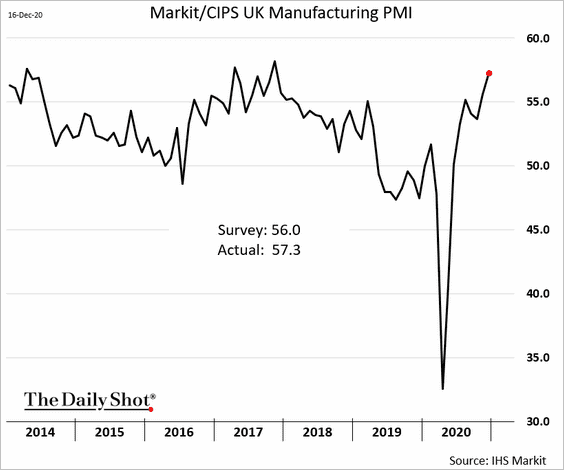
1. The December flash manufacturing PMI report was impressive.
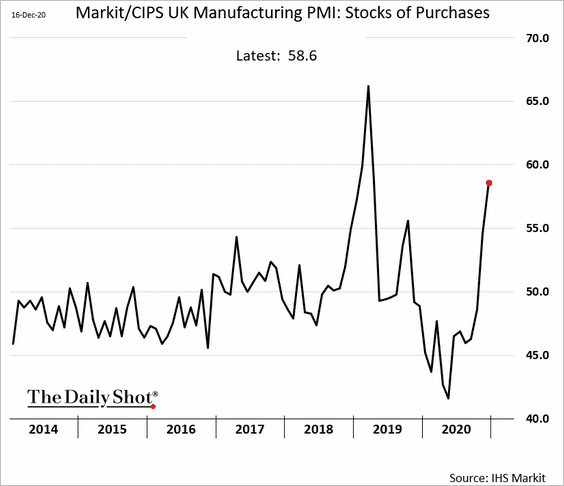
However, a great deal of this improved activity has been due to pre-Brexit inventory accumulation.
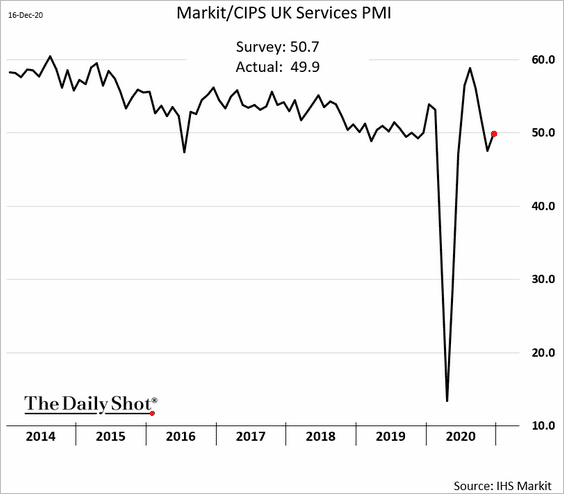
Here is the Markit services PMI.
——————–
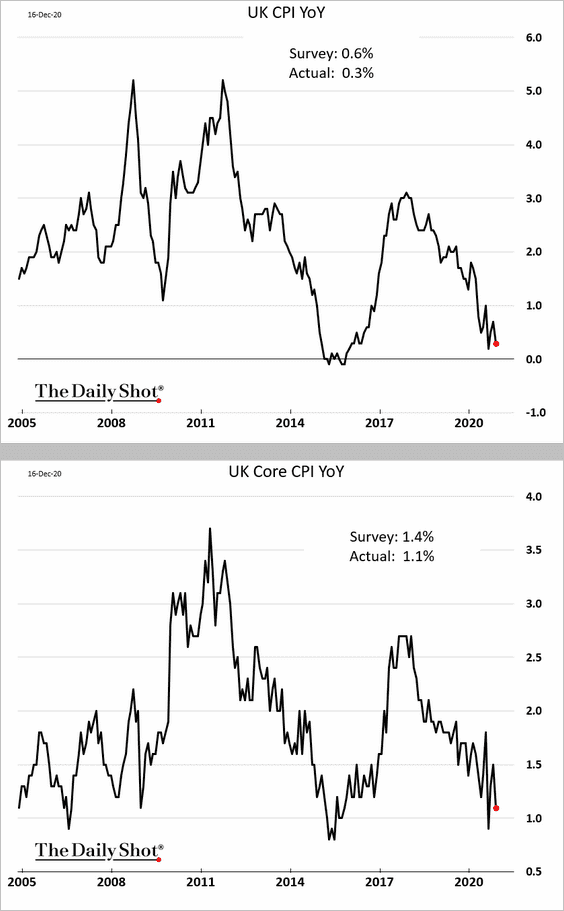
2. The CPI surprised to the downside.
 Source: Reuters Read full article
 Source: The Guardian Read full article
Below is a forecast from Pantheon Macroeconomics.
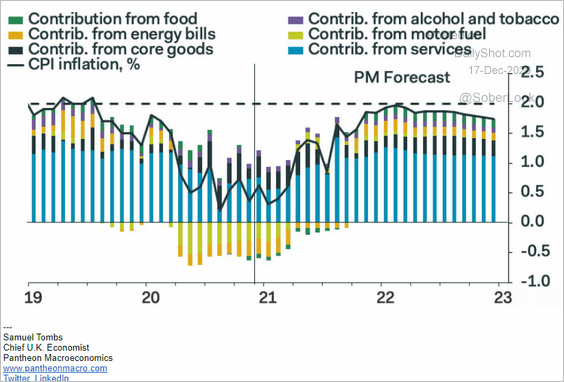 Source: Pantheon Macroeconomics
——————–
3. Savings declined the most among self-employed workers.
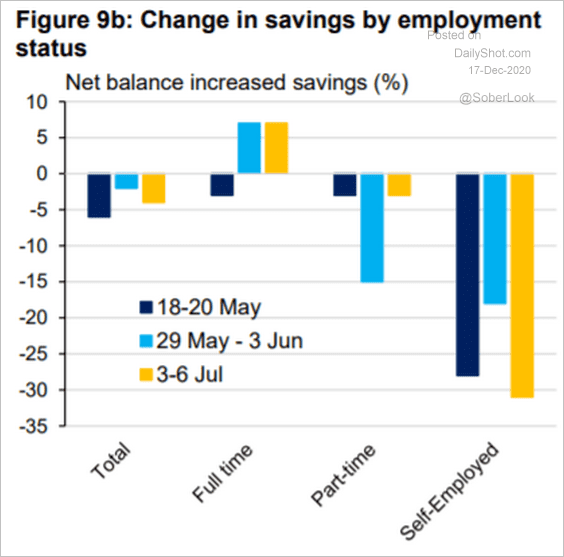 Source: BOE Read full article
4. UK offices are nearly empty.
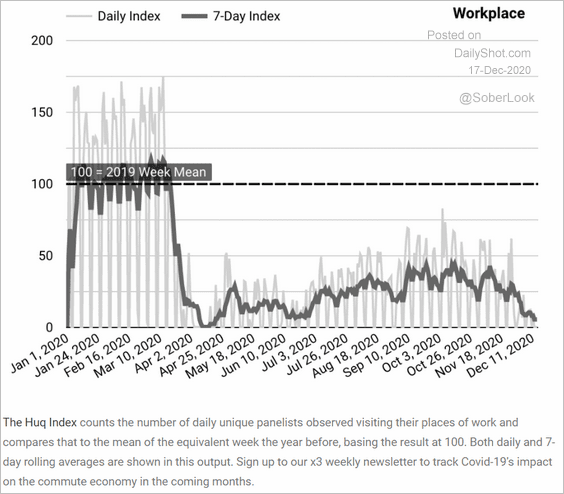 Source: Huq
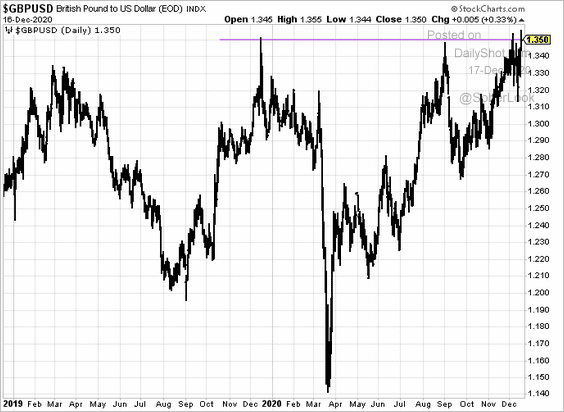
5. The pound continues to probe the $1.35 level.
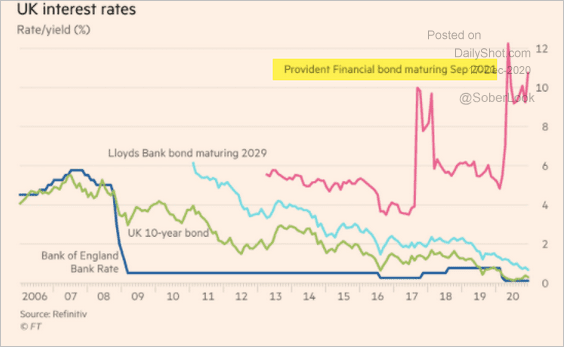
6. Subprime lenders face funding pressures as they try to meet the rising demand for mortgages.
 Source: Reuters Read full article
For example, Provident Financial’s Sep 2021 bond yield has been elevated.
 Source: @financialtimes Read full article
The Eurozone
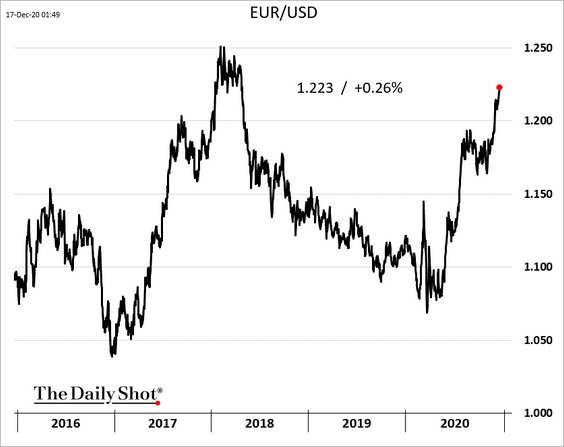
1. The euro is soaring vs. USD.
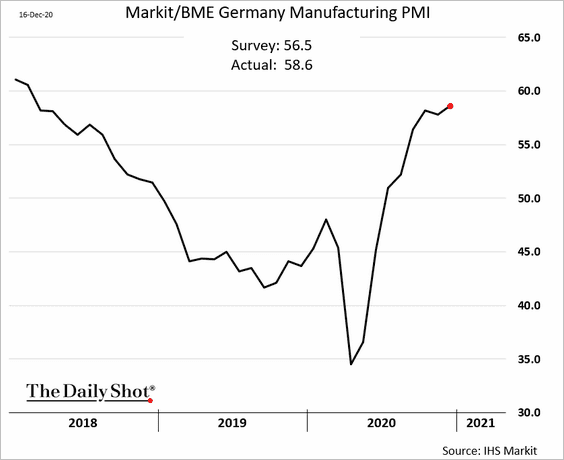
2. Next, let’s take a look at the preliminary PMI report, which showed that the Eurozone business activity has been resilient this month.
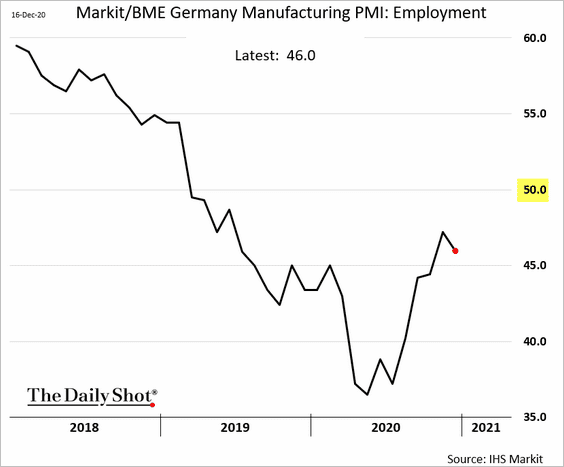
• German manufacturing PMI:
Manufacturing employment remains soft.
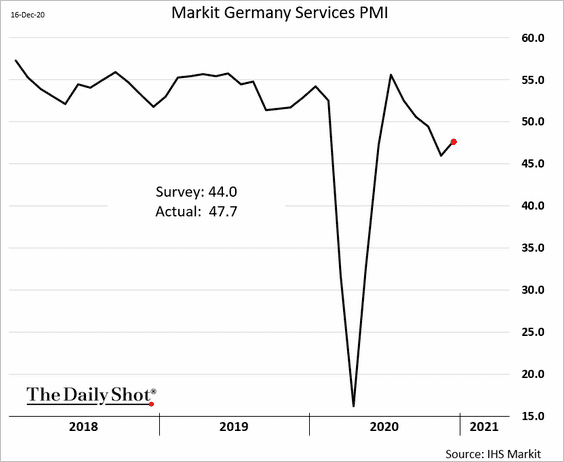
• German services PMI (still in contraction but better than expected):
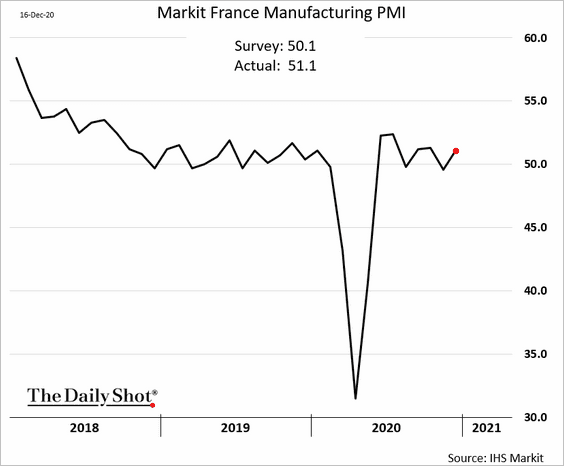
• French manufacturing PMI:
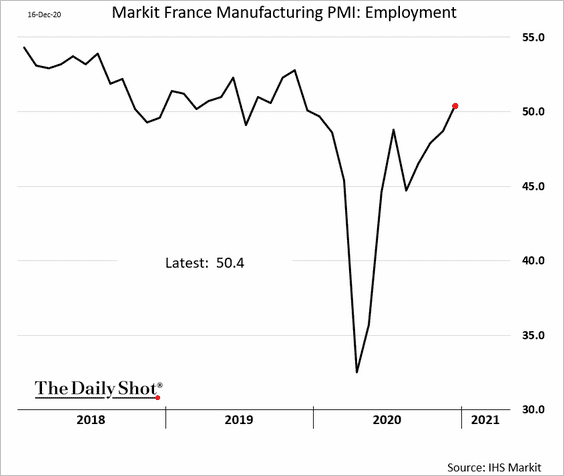
Manufacturing employment has stabilized.
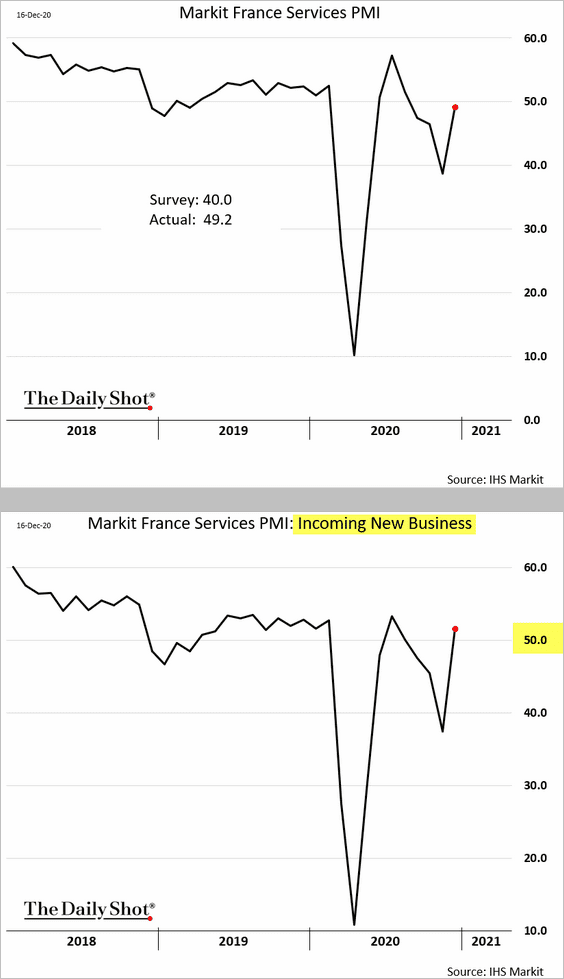
• French services PMI (a massive upside surprise):
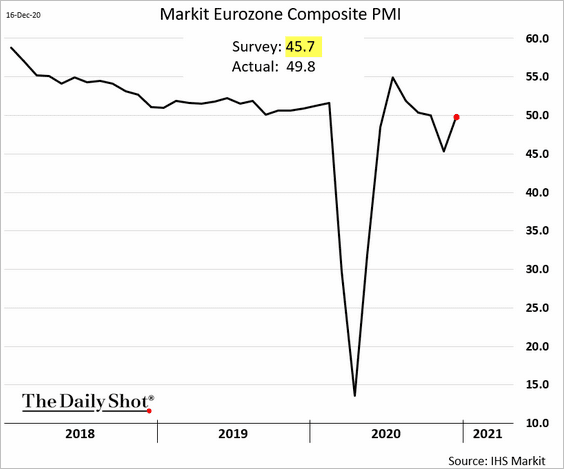
• Eurozone composite PMI:
——————–
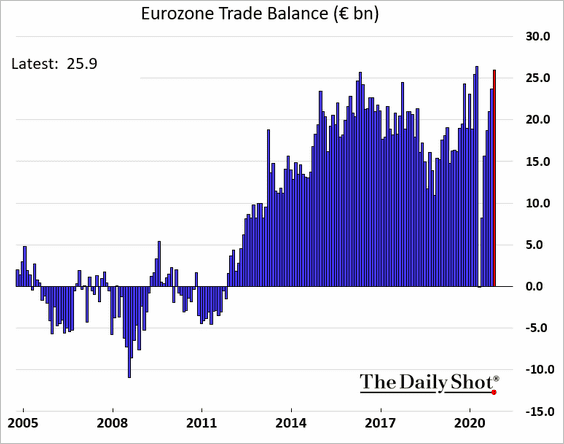
3. The euro-area trade surplus is back near record highs.
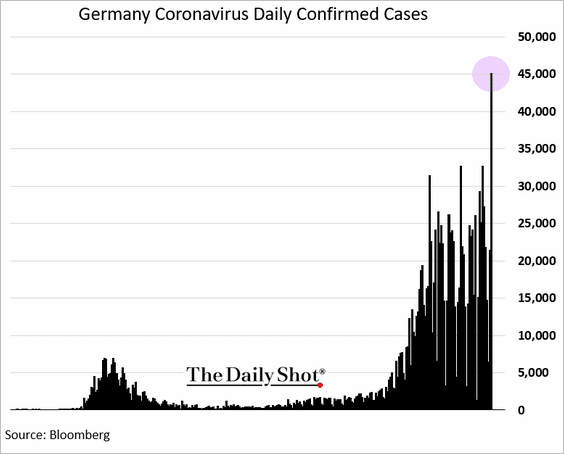
4. Germany’s COVID cases are exploding.
Asia – Pacific
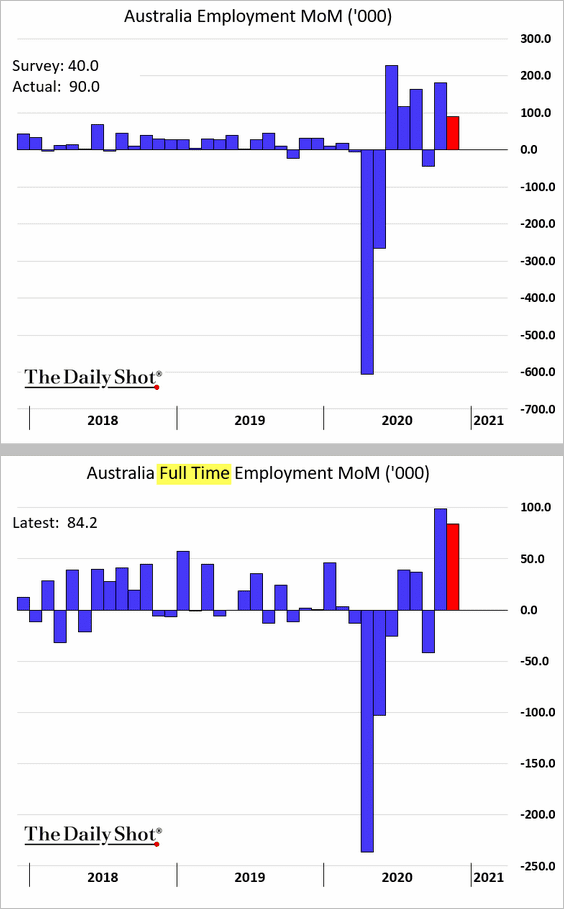
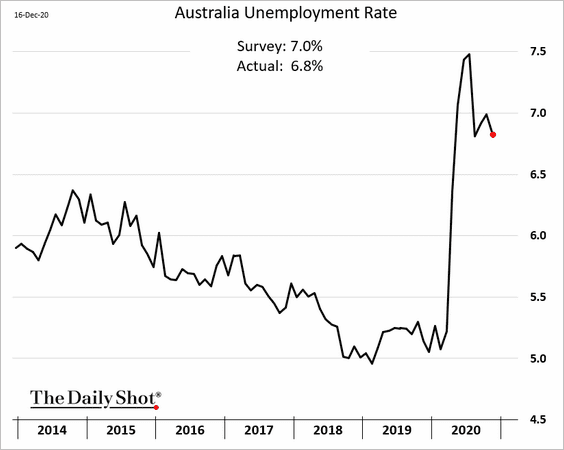
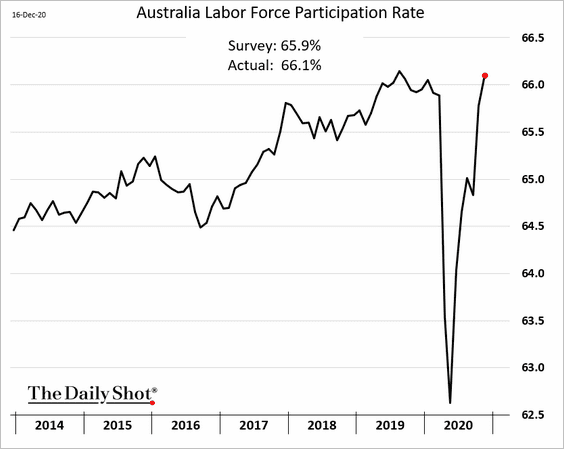
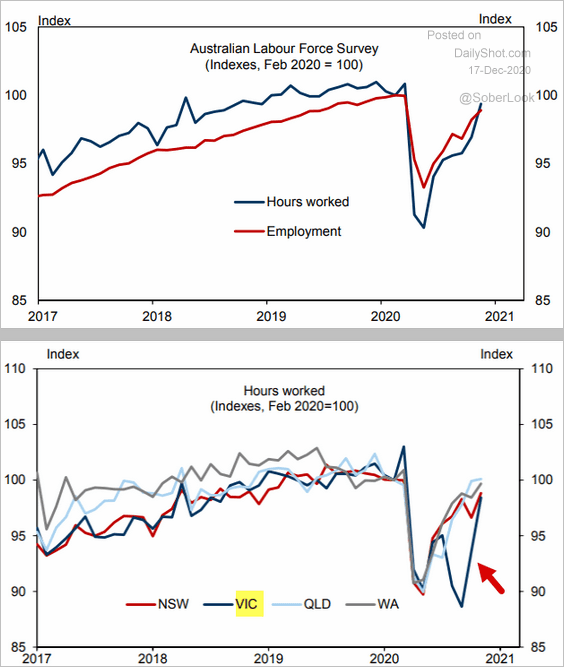
1. Australia’s employment report surprised to the upside.
• New payrolls (driven by full-time jobs):
• The unemployment rate:
• The participation rate:
• Hours worked (take a look at Victoria):
 Source: Goldman Sachs
——————–
2. New Zealand’s GDP is now back at last year’s levels – a V-shaped recovery.
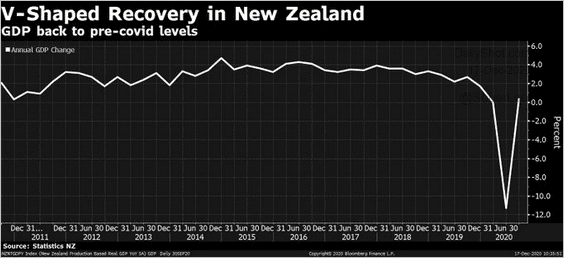 Source: @tracyalloway, @tracywwithers Read full article
The Kiwi dollar continues to climb.
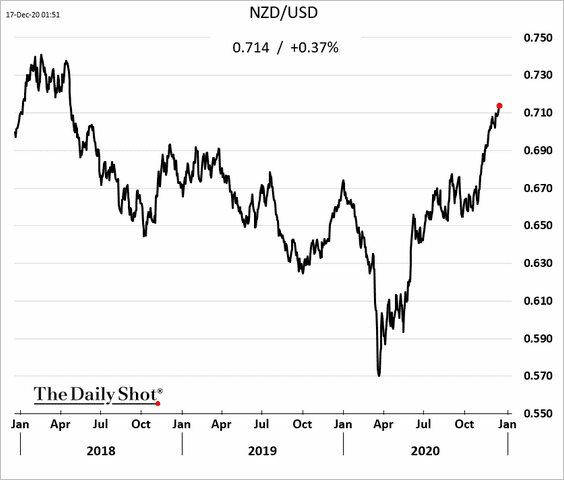
——————–
3. Singapore’s exports deteriorated last month.
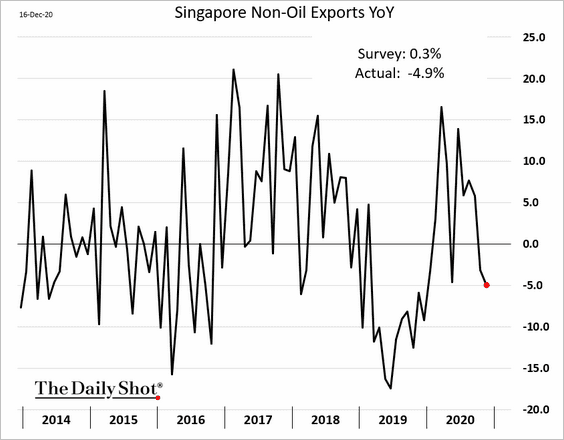
Emerging Markets
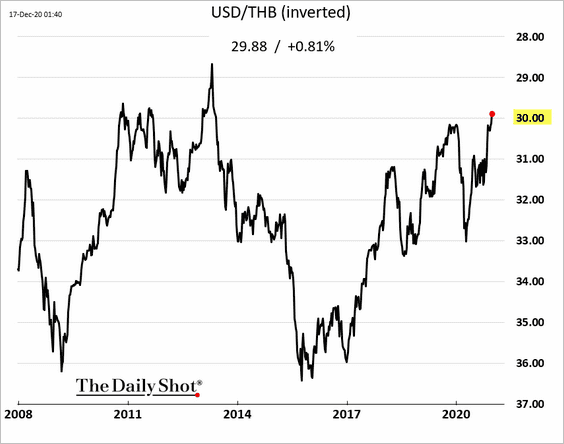
1. Asian currencies continue to rally.
• The Malaysian ringgit (USD/MYR breached support):
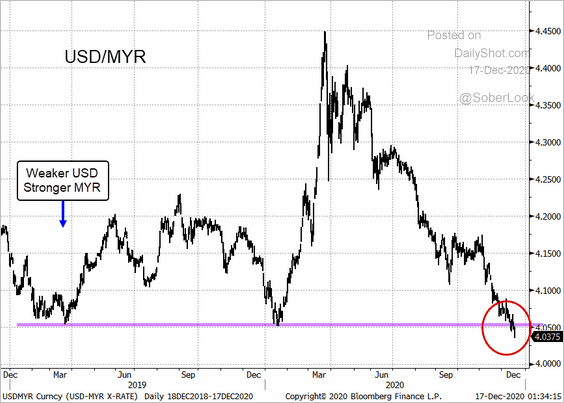 Source: @TheTerminal, Bloomberg Finance L.P.
• The Thai baht (longer-term chart):
——————–
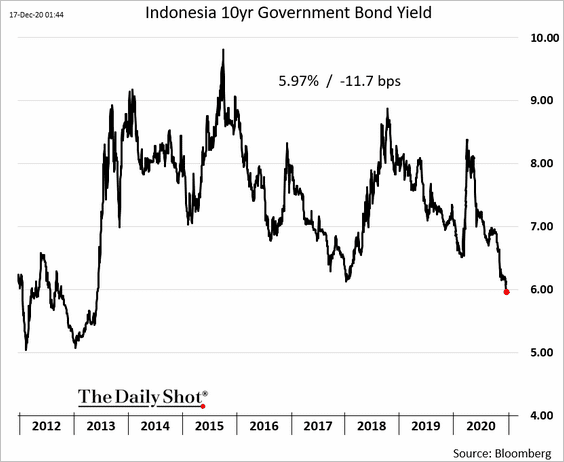
2. The Indonesian 10yr local-currency bond yield dipped below 6% for the first time since 2013 (taper tantrum).
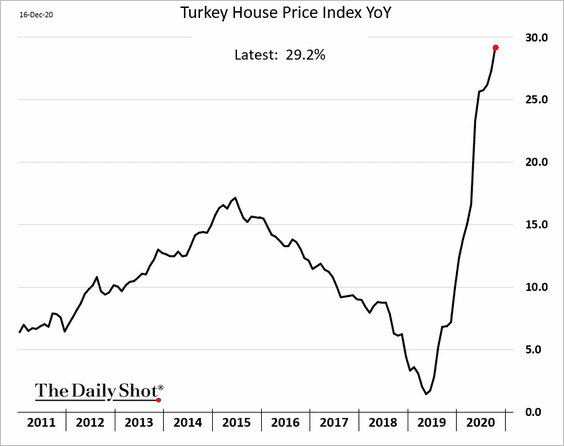
3. Turkish home prices are 29% above last year’s levels.
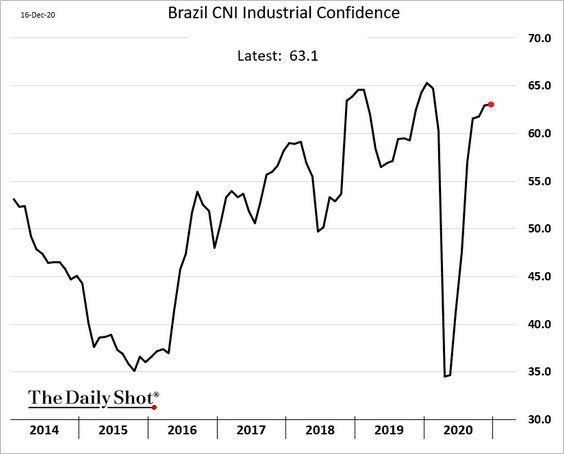
4. Brazil’s industrial confidence remains elevated.
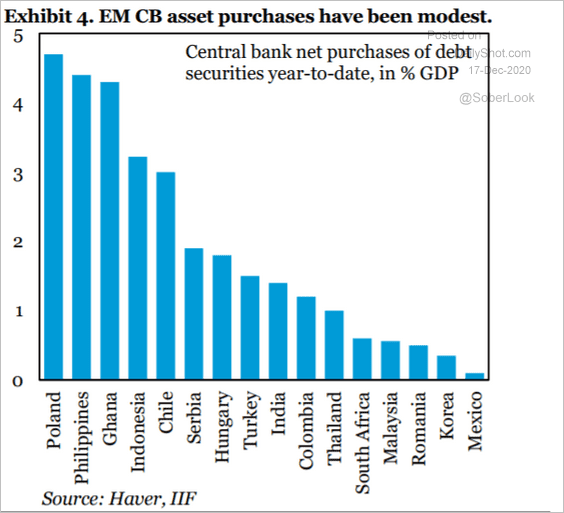
5. EM central banks’ asset purchases have been modest relative to advanced economies.
 Source: IIF
Cryptocurrency
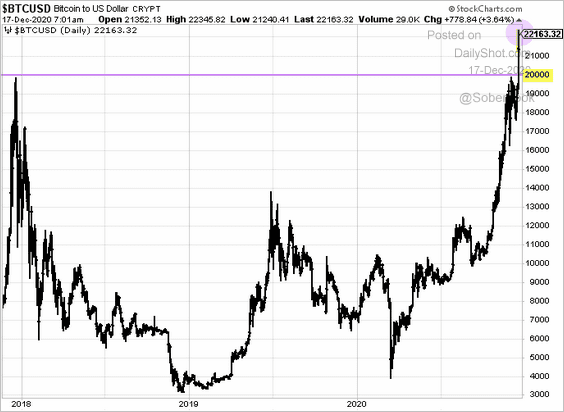
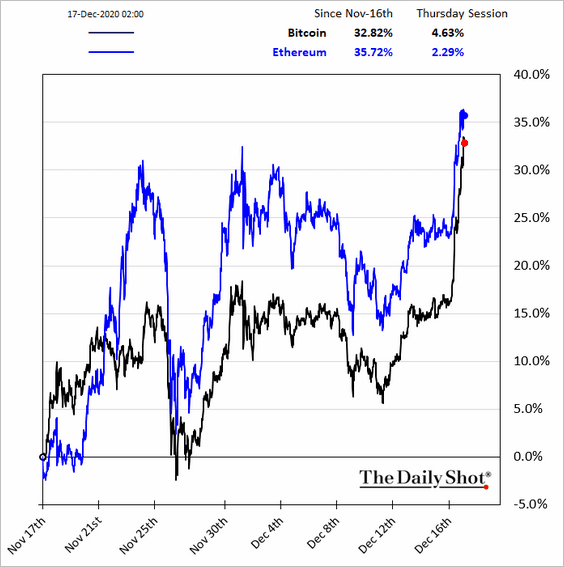
1. Bitcoin breached $20k and just kept going. This print shows Bitcoin above $22k.
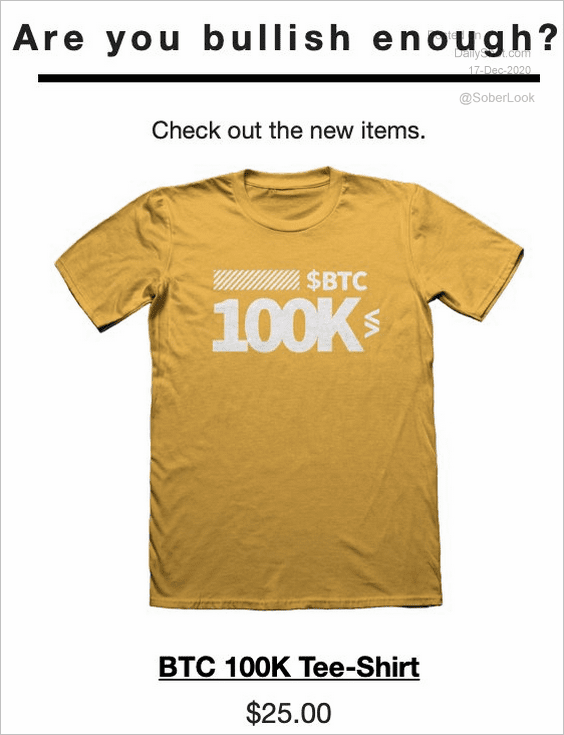
• How far will it go? There is no shortage of wild forecasts.
 Source: @jessefelder, @Stocktwits
 Source: @markets Read full article
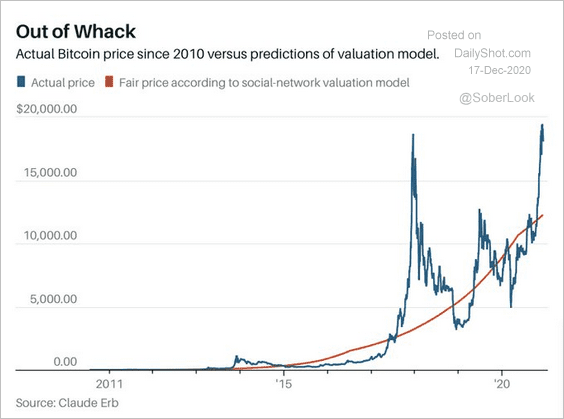
• But what is Bitcoin’s fair value? Here is an estimate.
 Source: @jessefelder, @MktwHulbert Read full article
——————–
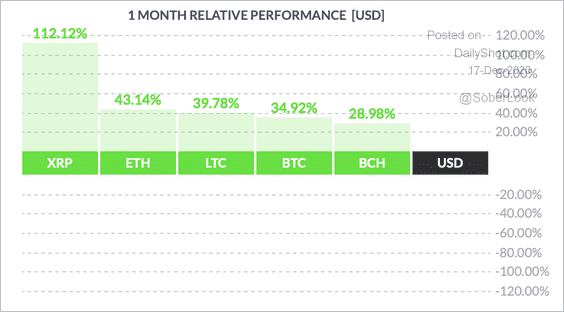
2. Below is the relative performance.
Ripple’s XRP massively outperformed other major cryptocurrencies over the past month.
 Source: FinViz
——————–
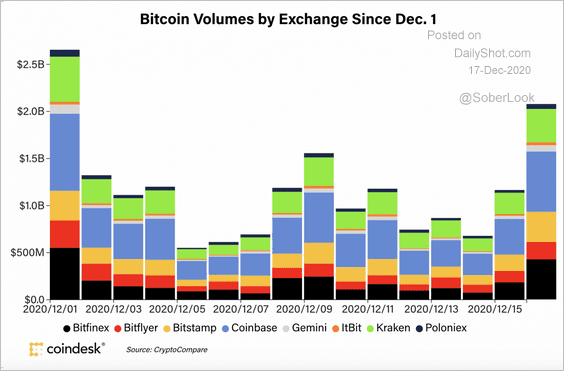
3. Bitcoin’s volume across major exchanges is the strongest since December 1.
 Source: CoinDesk Read full article
Commodities
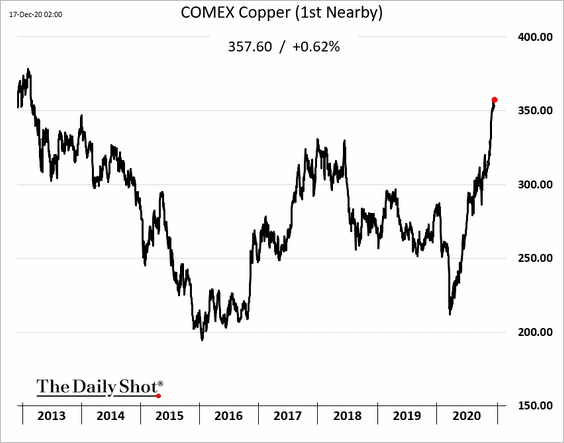
1. Copper continues to grind higher.
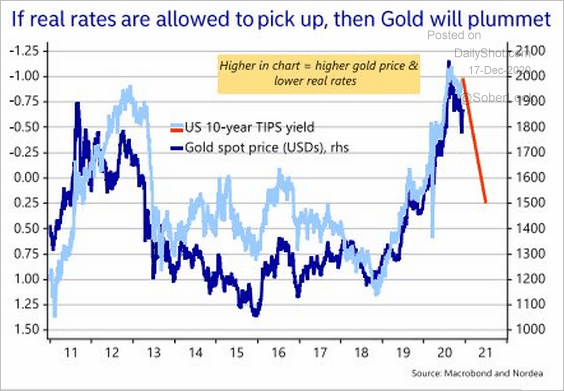
2. Will gold come under pressure if real rates climb next year?
 Source: @AndreasSteno
Energy
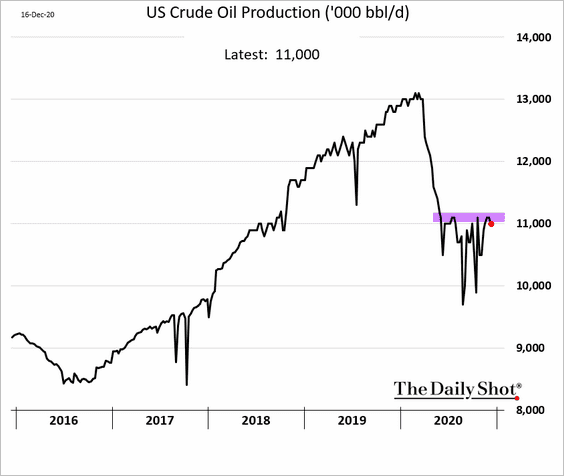
1. US oil production has been stuck around 11 million barrels per day.
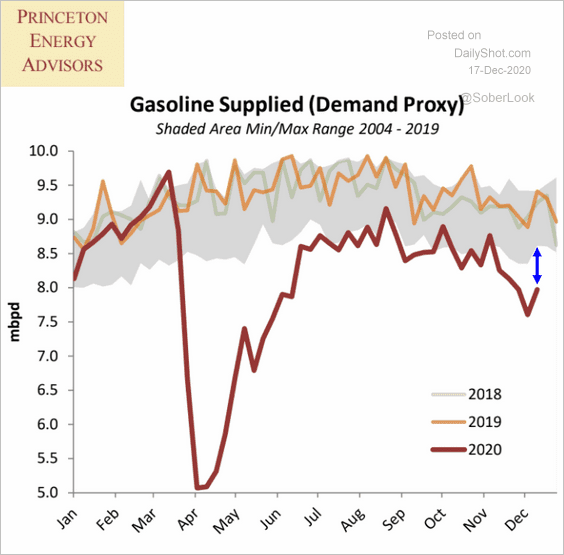
2. US gasoline demand remains soft.
 Source: Princeton Energy Advisors
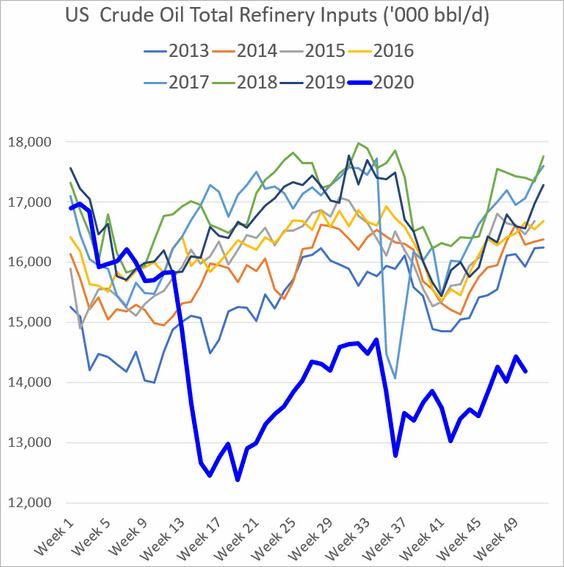
Refinery runs are also relatively weak.
——————–
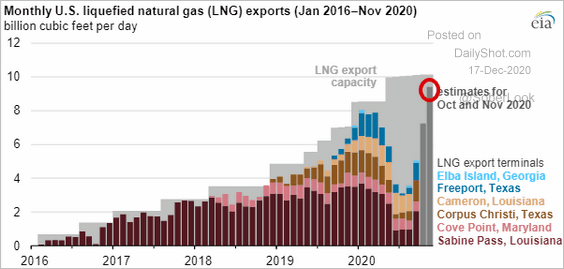
3. US LNG exports hit a record high and are expected to stay robust as prices in Asia rebound.
 Source: EIA
Equities
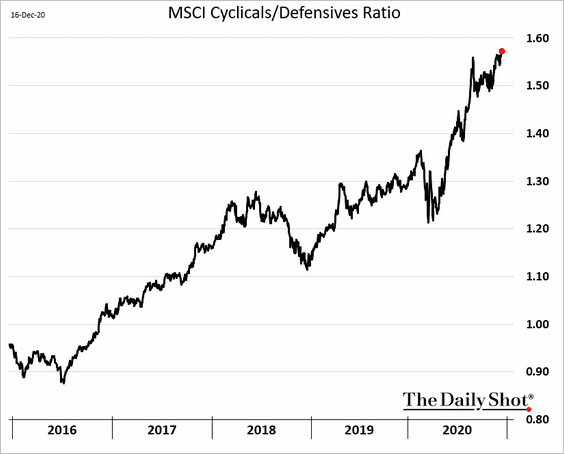
1. Cyclical shares have resumed their outperformance over defensives. The market is pricing in strong global economic growth ahead.
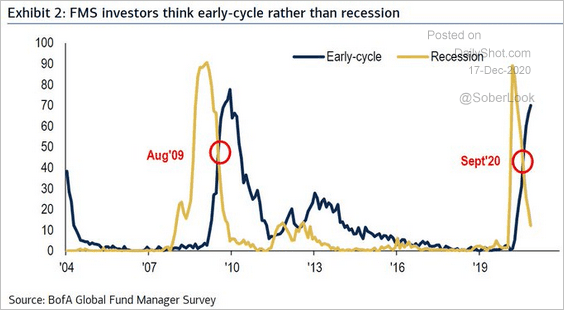
2. Fund managers now see “early-cycle” (the rebound phase of the economic cycle) rather than recession.
 Source: BofA Global Research, @jsblokland
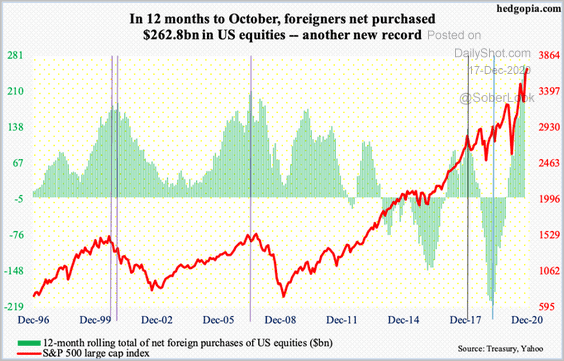
3. Foreigners have accelerated their purchases of US equities.
 Source: @hedgopia Read full article
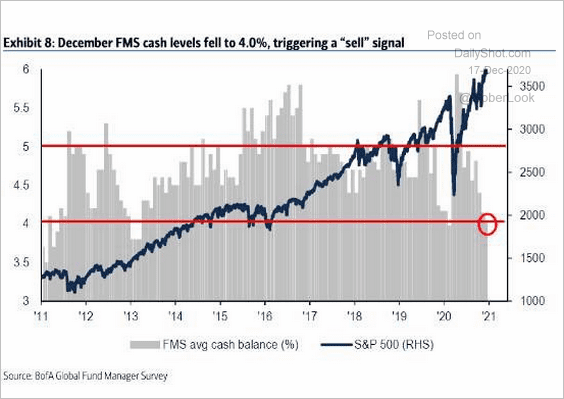
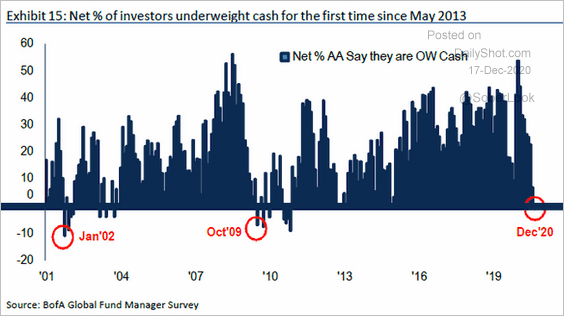
4. Fund managers are all-in, with cash levels at multi-year lows (2 charts).
 Source: @LizAnnSonders, @BankofAmerica
 Source: @ISABELNET_SA, @BofAML
——————–
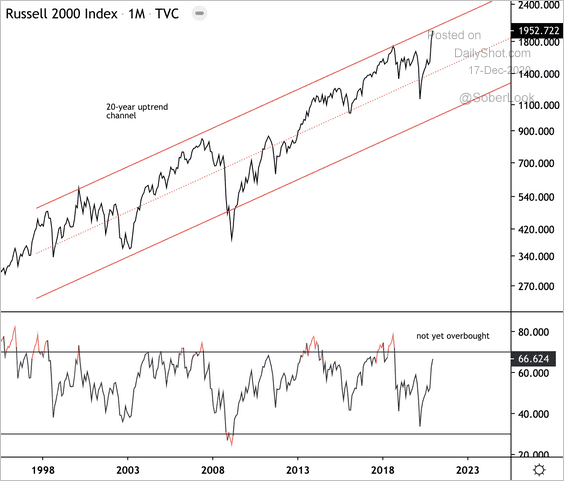
5. The Russell 2,000 index is at long-term resistance. Will we see a breakout?
 Source: @DantesOutlook
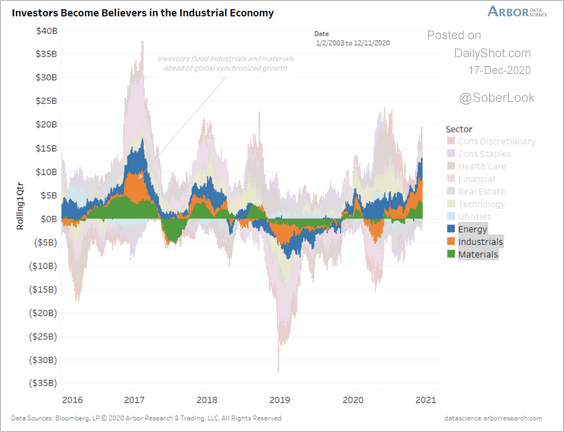
6. Flows into US equities have been heavily focused on energy, industrials, and materials.
 Source: Arbor Research & Trading
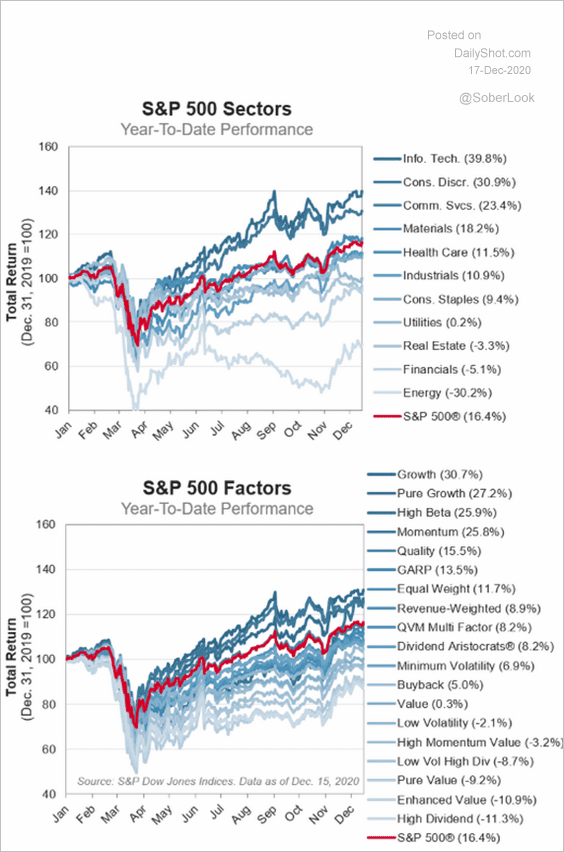
7. Here is the year-to-date relative performance of US sectors and equity factors.
 Source: S&P Global Market Intelligence
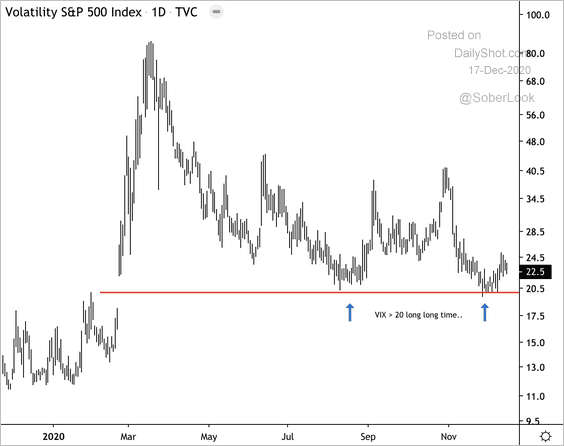
8. VIX has remained above 20 for most of the year.
 Source: @DantesOutlook
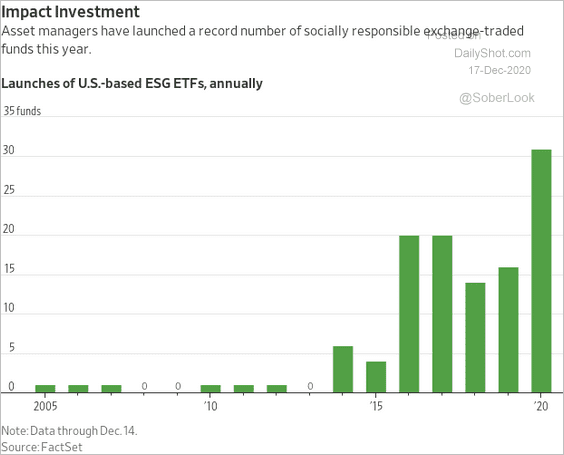
9. ESG ETFs are hot.
 Source: @WSJ Read full article
Credit
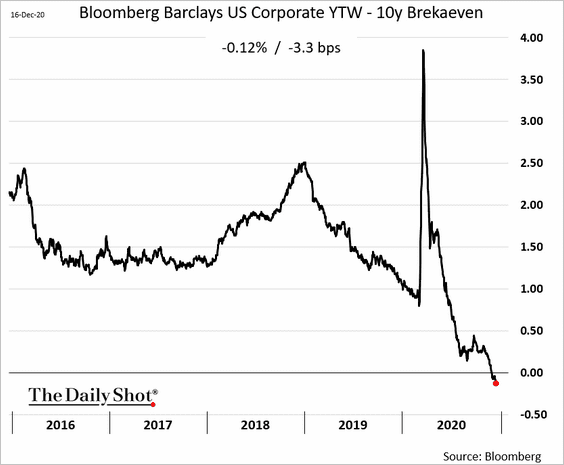
1. US real investment-grade yields are negative based on market-implied inflation expectations.
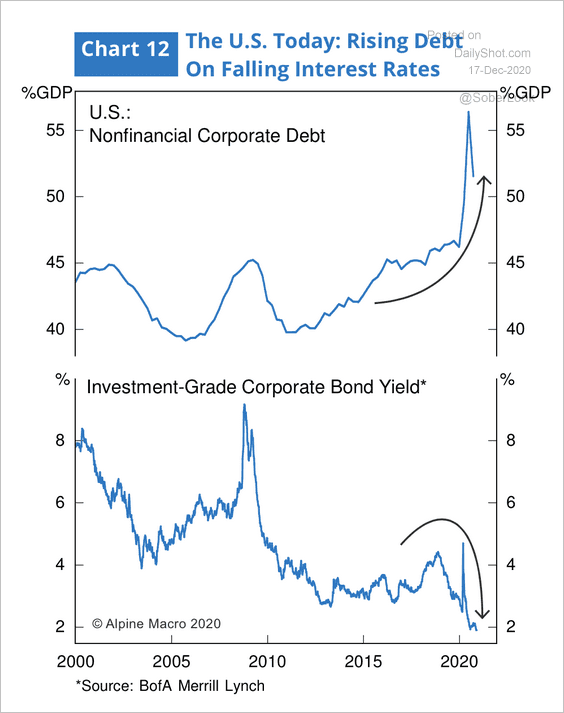
2. Is US investment-grade credit priced for perfection?
 Source: Alpine Macro
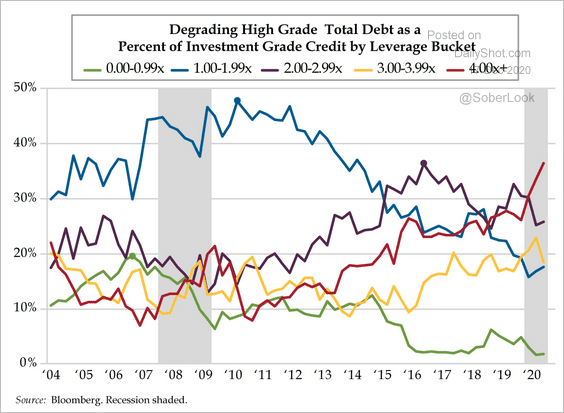
3. Corporate debt with more than 4x leverage makes up 36% of the US investment-grade market, which is almost double 2004 levels.
 Source: The Daily Feather
Global Developments
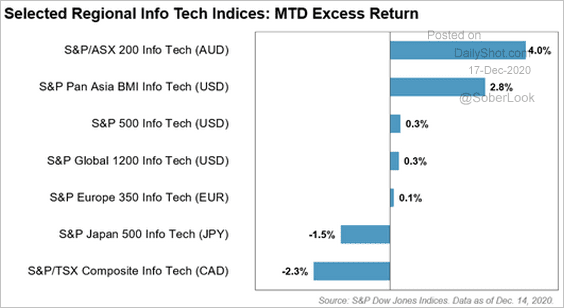
1. The tech sector has slowed its ascent in the US but has continued to climb in Australia. Here is a breakdown by select regions.
 Source: S&P Global Market Intelligence
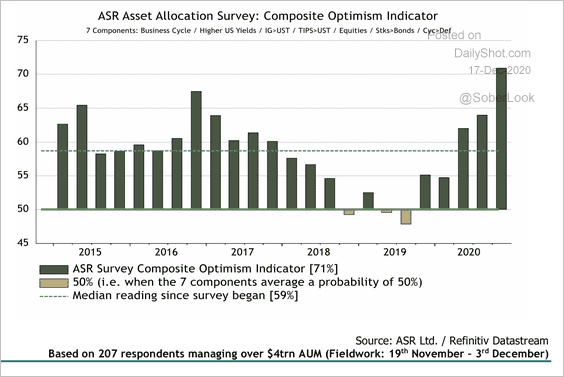
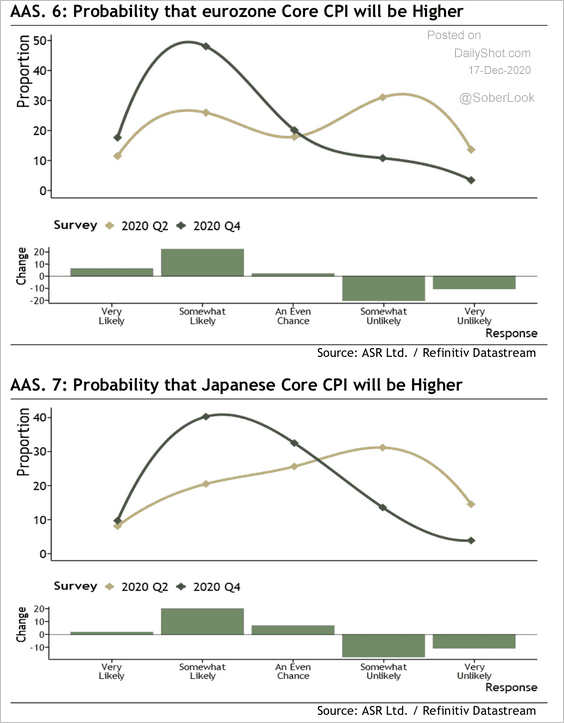
2. Investor optimism is at the highest level in four years, according to a survey by Absolute Strategy Research.
 Source: Absolute Strategy Research
Expectations of a full-on global reflation are evident throughout the survey, especially in Europe and Japan.
 Source: Absolute Strategy Research
——————–
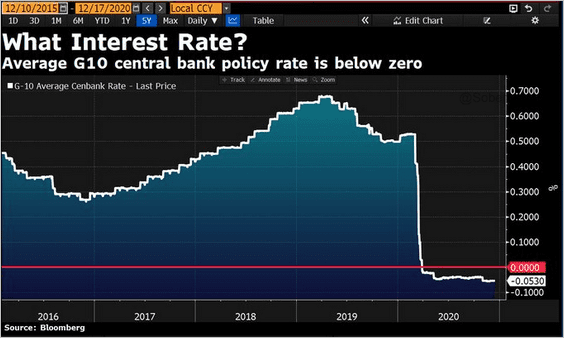
3. Here is the average G10 policy rate.
 Source: @DavidInglesTV
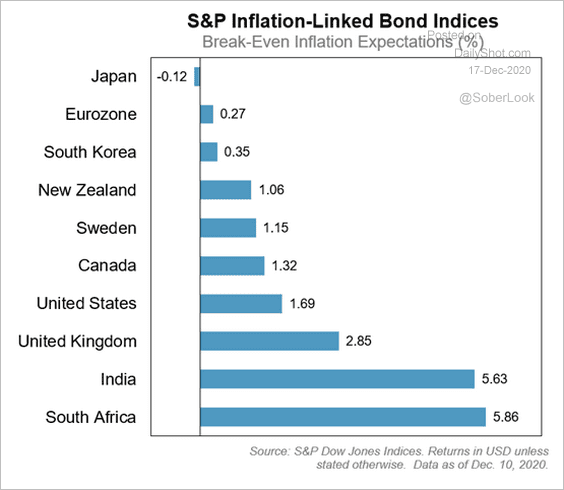
4. The chart below provides a proxy for inflation expectations (breakeven = the spread between sovereign inflation-linked bond indices and the equivalent duration-weighted sovereign yields).
 Source: S&P Global Market Intelligence
——————–
Food for Thought
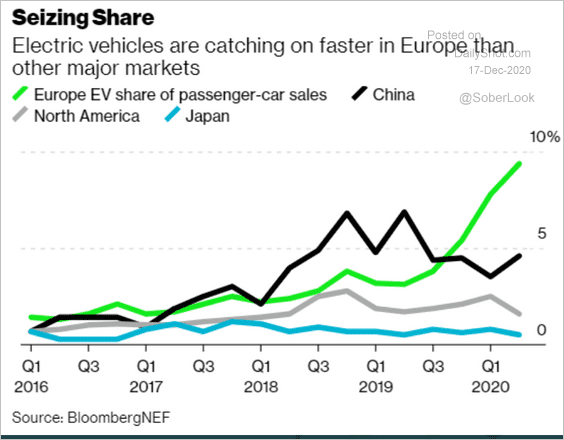
1. Electric vehicle sales (market share):
 Source: @business Read full article
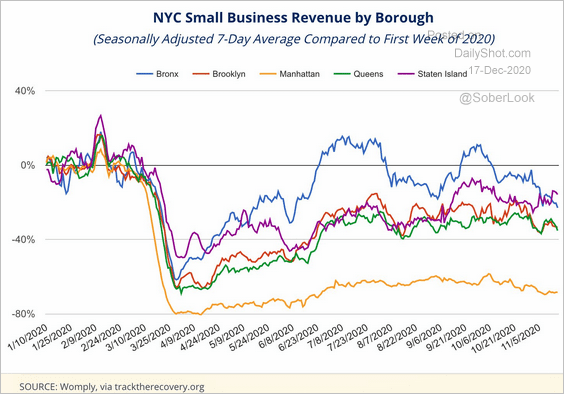
2. Small business revenues by NYC borough:
 Source: Office of the New York City Comptroller, @adam_tooze Read full article
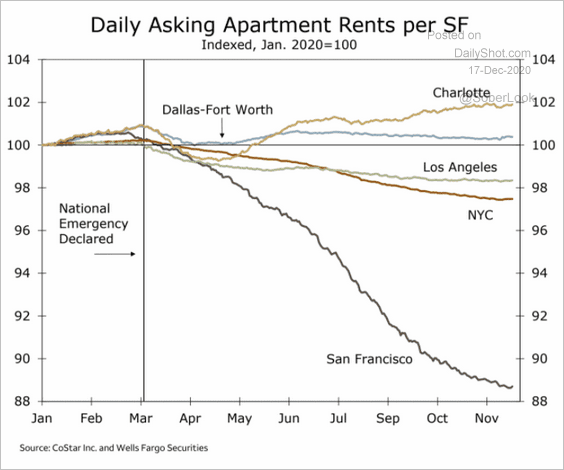
3. Apartment rents in select cities:
 Source: Wells Fargo Securities
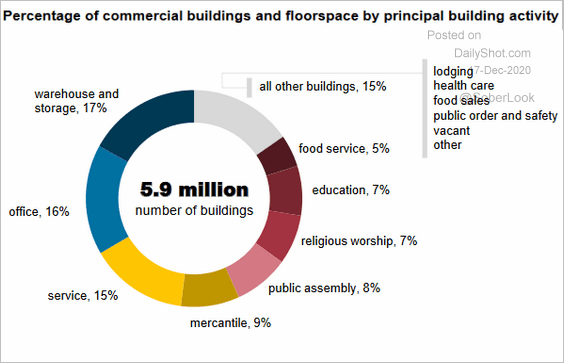
4. Commercial buildings floorspace by principal activity:
 Source: @EIAgov Read full article
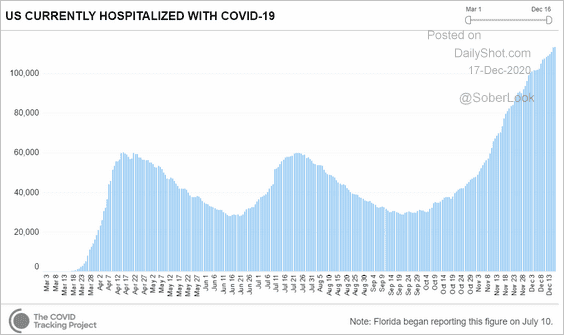
5. US COVID-related hospitalizations.
 Source: CovidTracking.com
6. US COVID case projections:
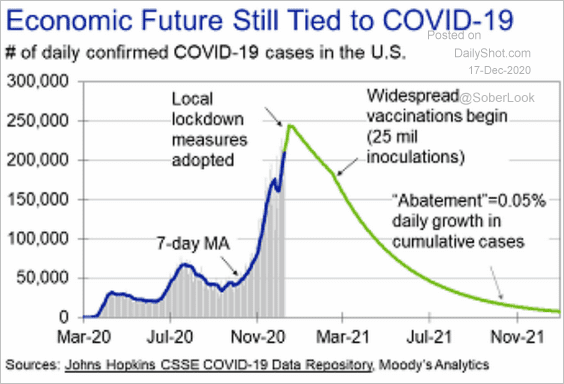 Source: Moody’s Analytics
7. Views on income inequality:
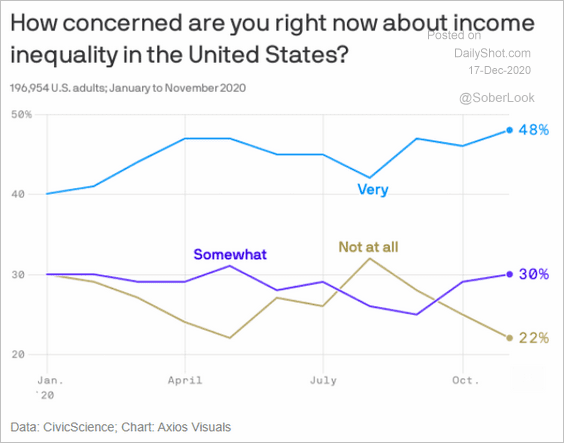 Source: @axios Read full article
8. Presidential vote in US counties with the highest median income:
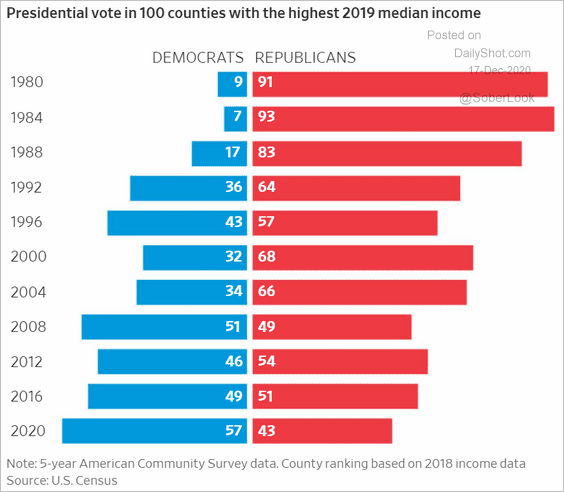 Source: @WSJGraphics Read full article
9. US cheese consumption:
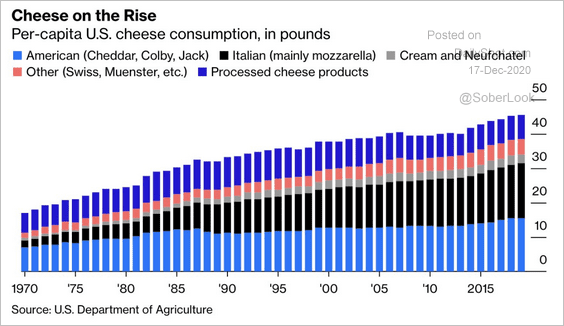 Source: @bopinion Read full article
——————–
