
The Daily Shot: 18-Dec-20
• China
• Asia – Pacific
• The Eurozone
• Europe
• The United Kingdom
• Canada
• The United States
• Emerging Markets
• Cryptocurrency
• Commodities
• Equities
• Credit
• Food for Thought
China
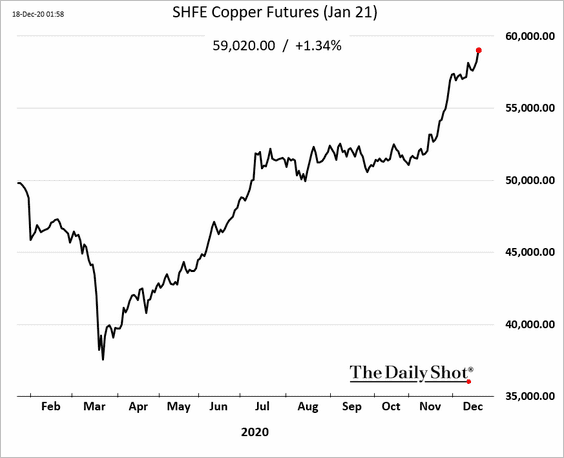
1. The nation’s manufacturing surge is fueling industrial commodities markets. Here are iron ore, steel, and copper futures traded in China.
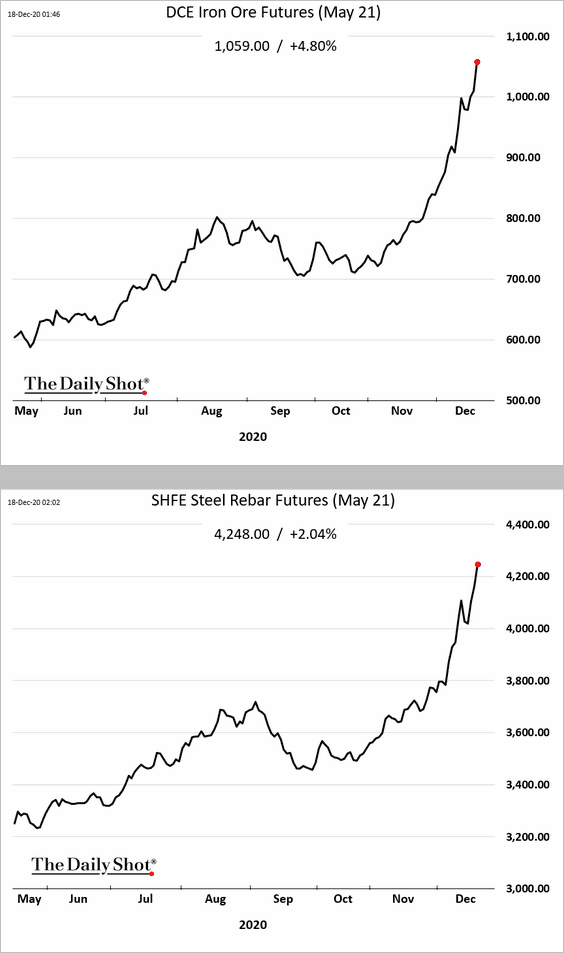
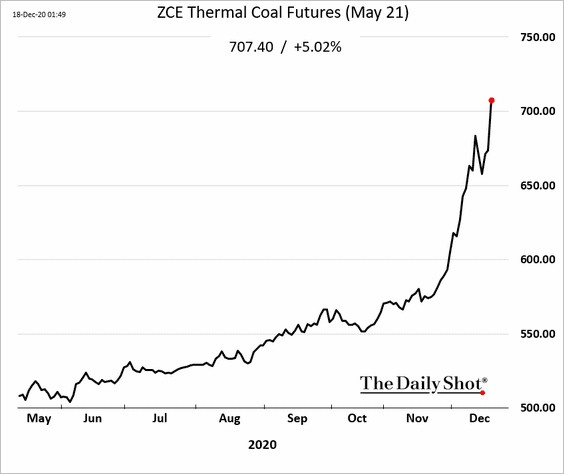
Industrial demand and cold weather are straining the power supply.
 Source: Platts Read full article
Thermal coal futures have gone vertical. The Australian coal ban is exacerbating the situation.
——————–
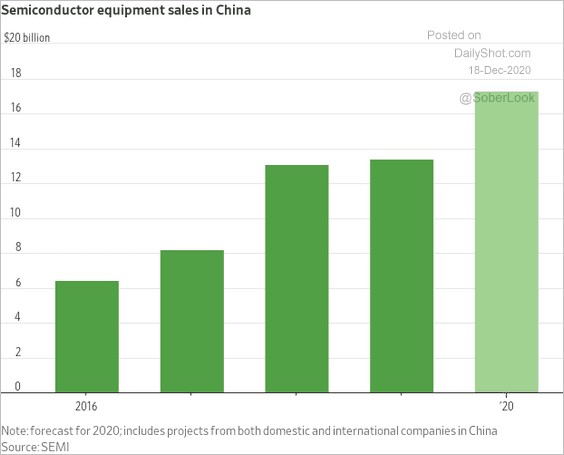
2. Semiconductor equipment sales are up sharply as China strives to become self-sufficient in this sector.
 Source: @WSJ Read full article
3. Vehicle sales growth is outpacing production.
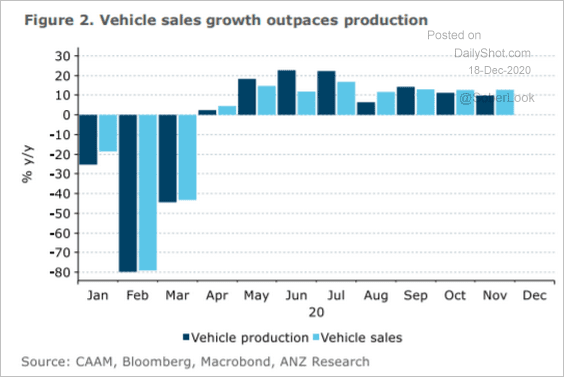 Source: ANZ Research
Electric vehicle stocks have rallied this year.
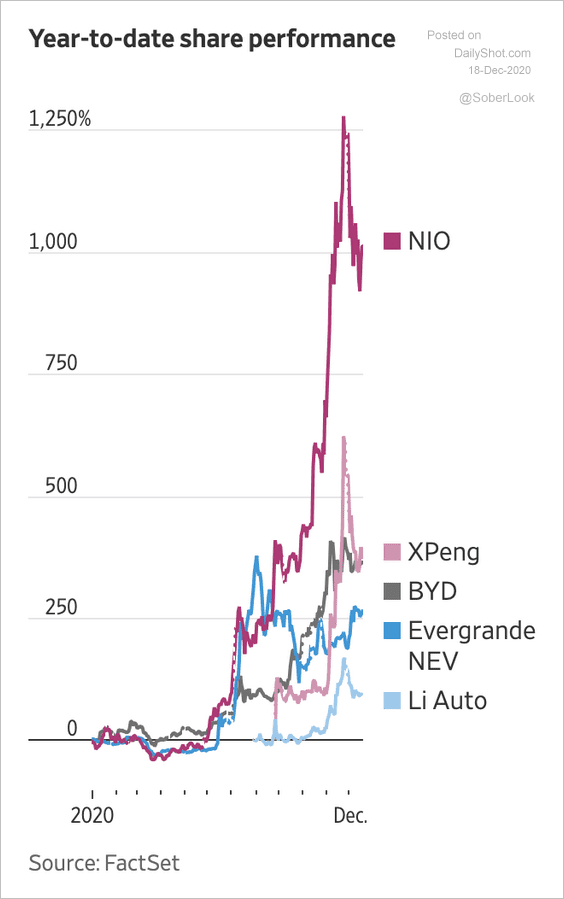 Source: @WSJ Read full article
——————–
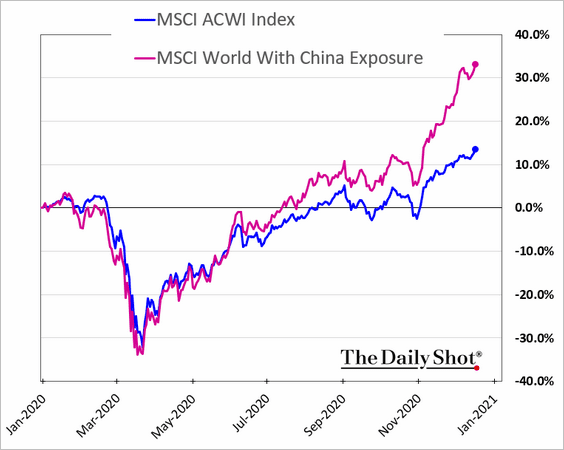
4. Global companies with significant sales in China have massively outperformed this year.
5. Below is an illustration of China’s rising dominance in global trade.
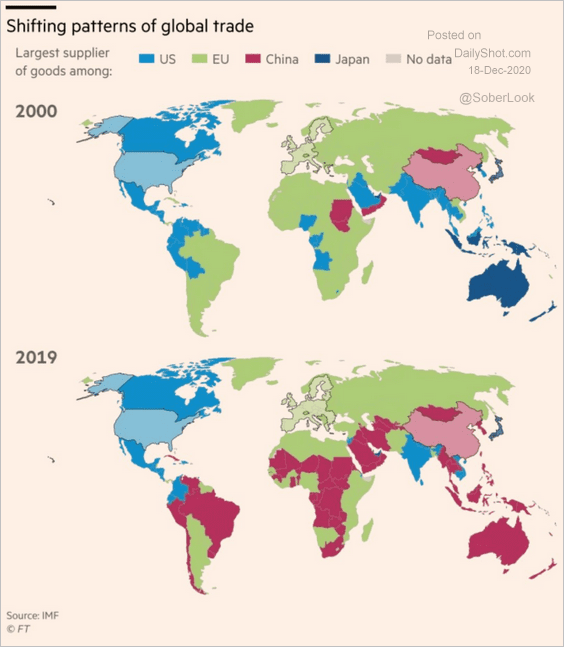 Source: @adam_tooze, @financialtimes Read full article
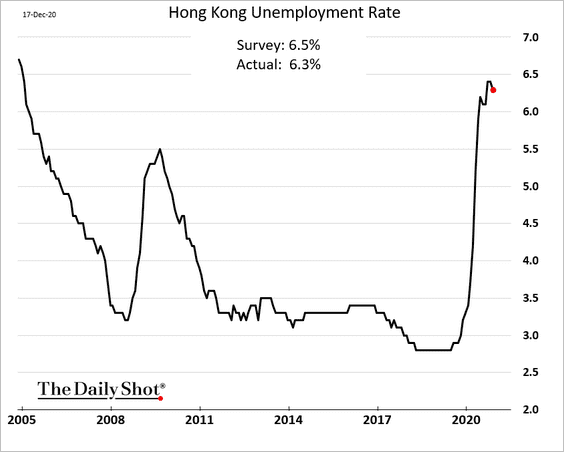
6. Hong Kong’s unemployment rate appears to have peaked.
Asia – Pacific
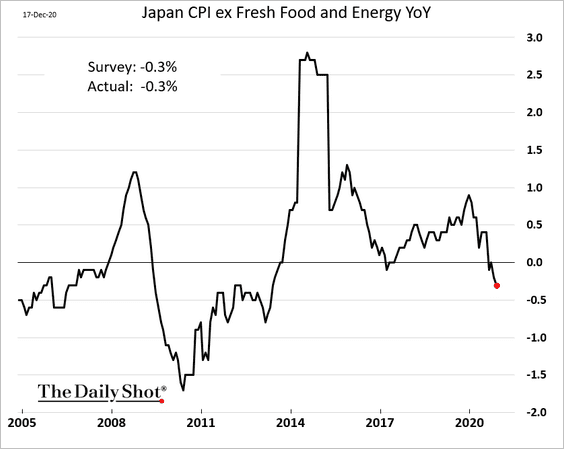
1. Japan is now firmly in deflation.
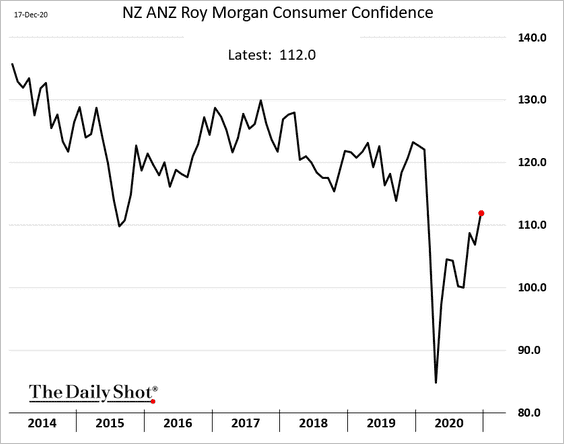
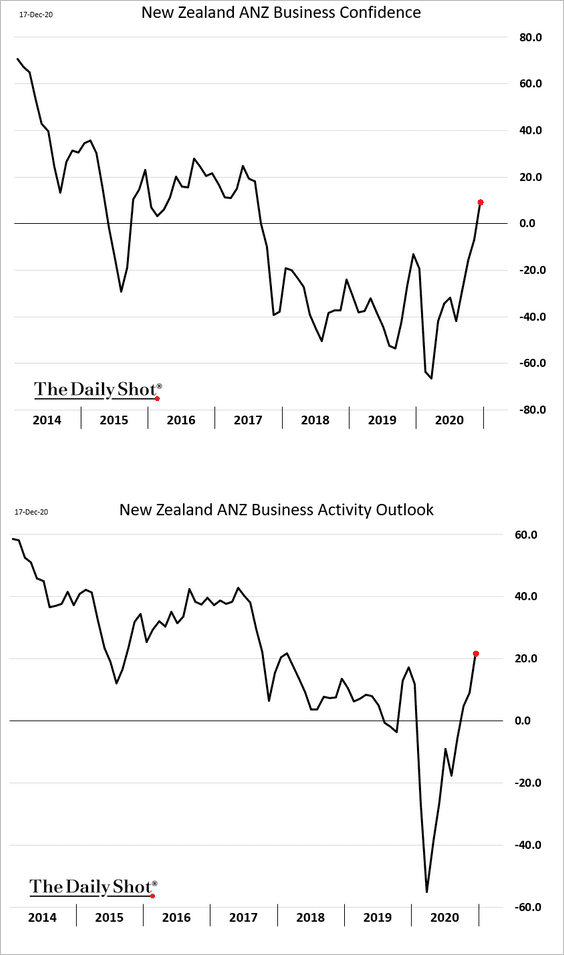
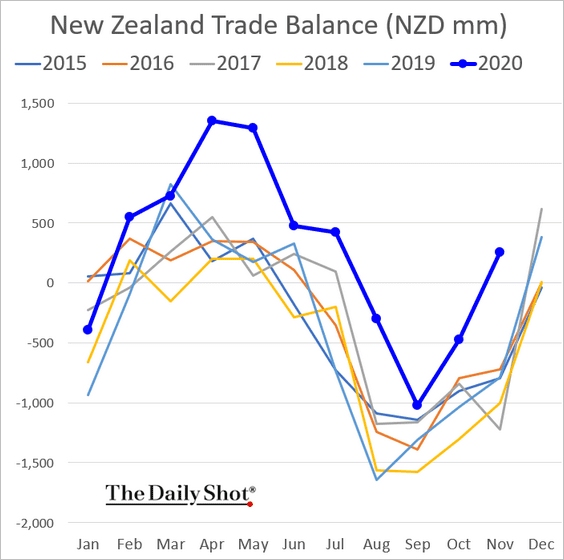
2. Here are a couple of updates on New Zealand.
• Sentiment indicators are rebounding.
– Consumer confidence:
– Business confidence:
• New Zealand’s trade surplus remains well above last year’s levels.
The Eurozone
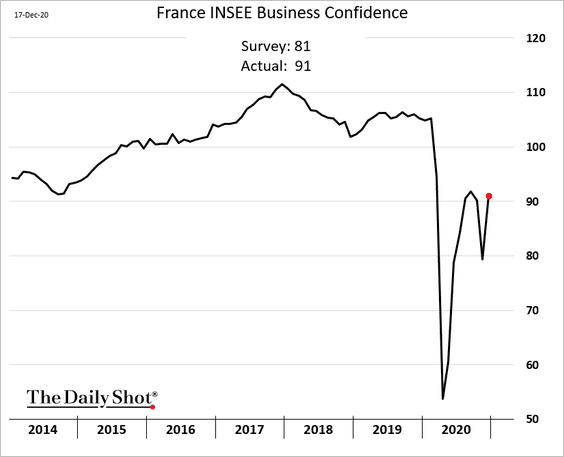
1. French business confidence unexpectedly jumped this month.
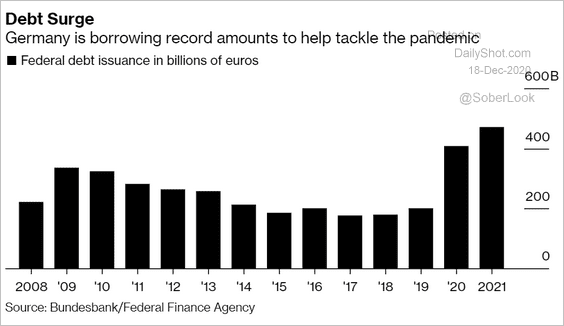
2. Germany’s government borrowing spiked this year and will be even higher in 2021. Of course, borrowing at negative rates is good business.
 Source: @markets Read full article
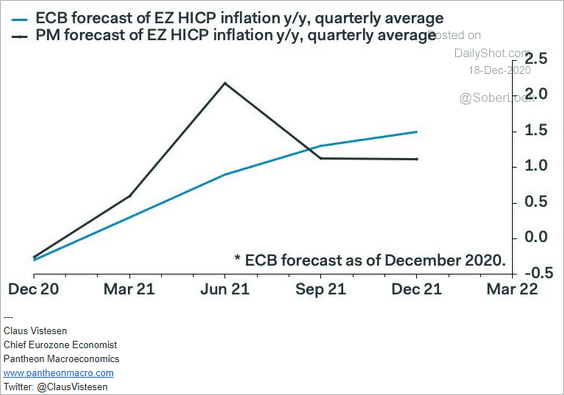
3. Energy base effects will boost inflation next year, overshooting the ECB’s forecast.
 Source: Pantheon Macroeconomics
4. Construction activity remains below pre-COVID levels.
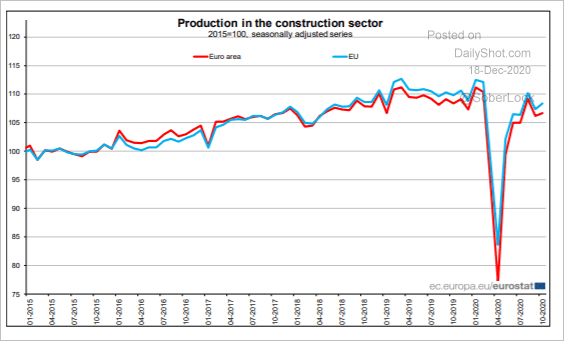 Source: Eurostat Read full article
5. Repo rates tumbled amid bond shortages, as the ECB vacuums up government debt.
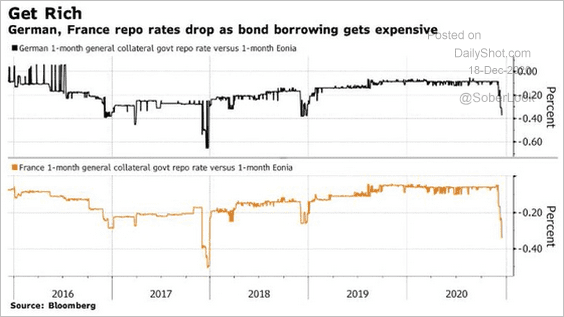 Source: @StephenSpratt, @markets
Europe
1. Let’s begin with Norway.
• Norges Bank revised up the expected trajectory of the policy rate.
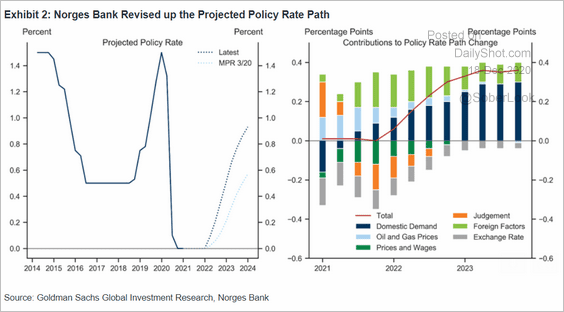 Source: Goldman Sachs
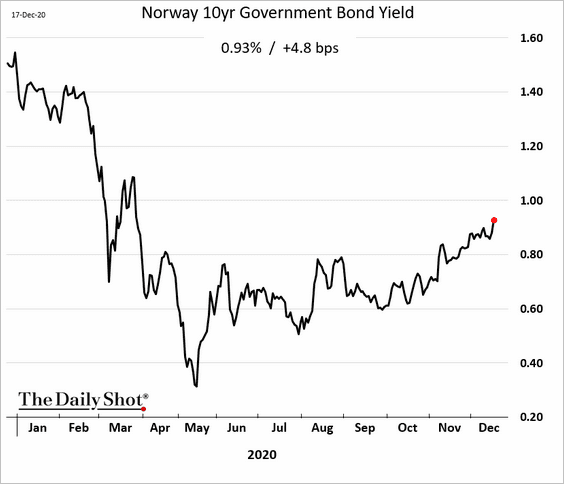
• Bond yields are climbing.
• Economists expect higher wage growth in Norway next year …
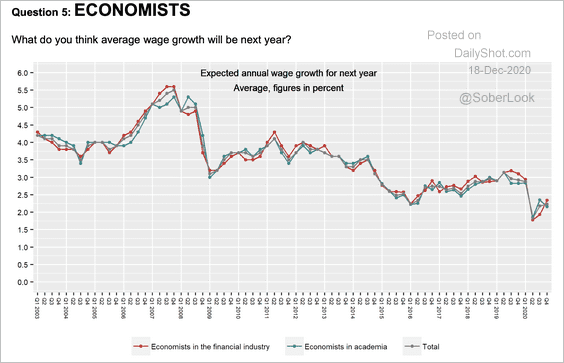 Source: Norges Bank
… but Norwegian households are increasingly pessimistic about wage growth.
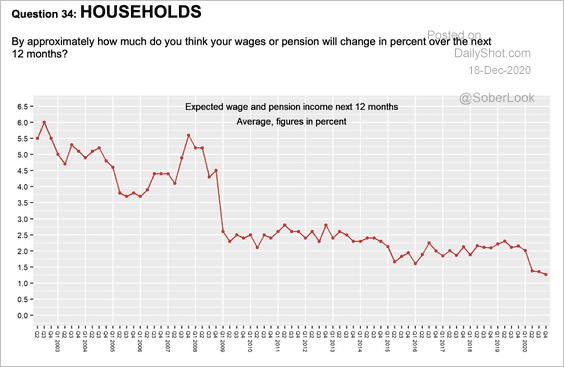 Source: Norges Bank
• Economists expect the Norwegian krone to appreciate next year.
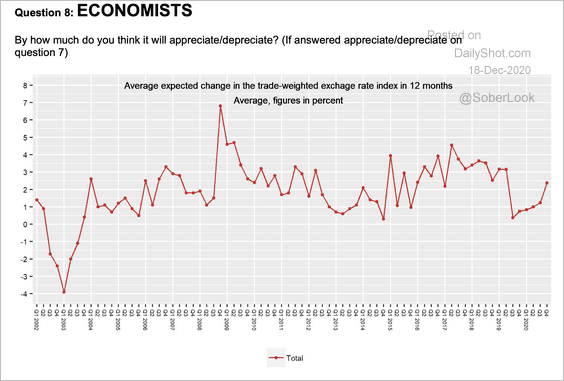 Source: Norges Bank
——————–
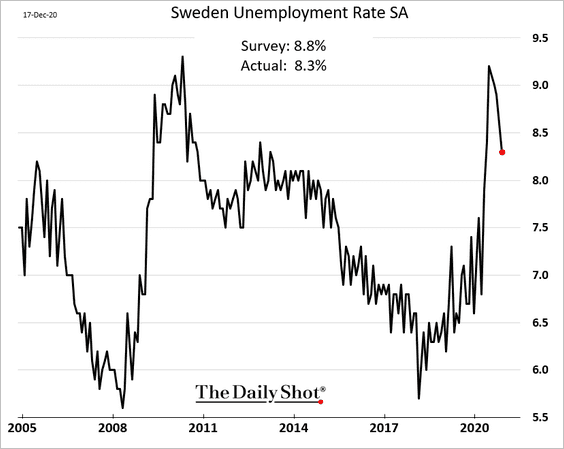
2. Sweden’s unemployment rate declined more than expected.
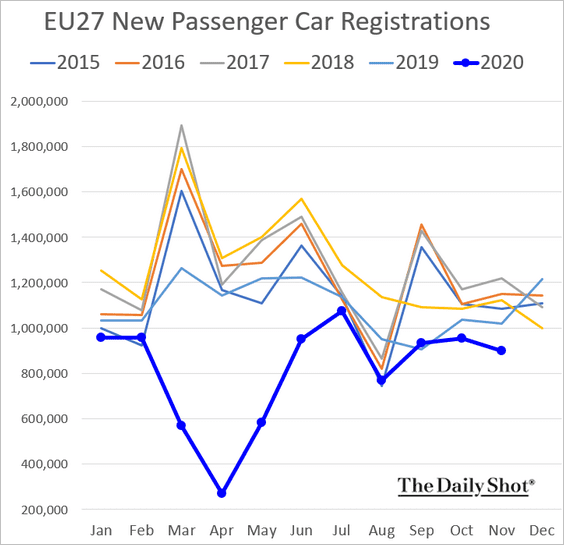
3. New vehicle registrations in the EU weakened last month.
4. This chart shows EU emissions by sector.
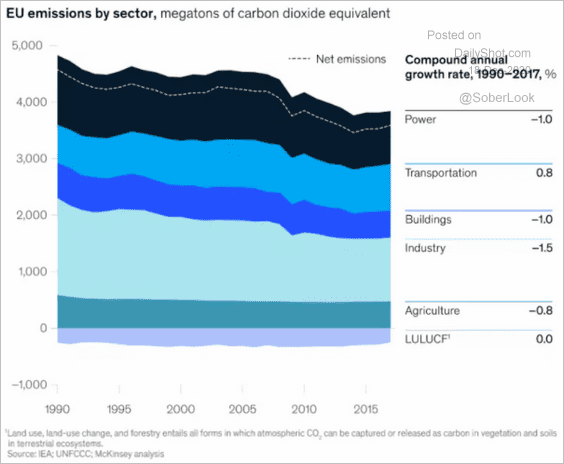 Source: WEF Read full article
5. Here is an illustration of how globalization impacted Europe.
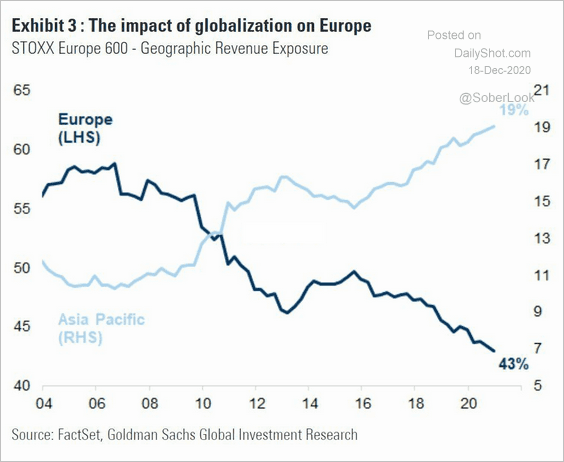 Source: Goldman Sachs, @PriapusIQ, Octavian Adrian Tanase
The United Kingdom
1. The MPC is standing by to ease in the event of no-deal (probably boosting QE rather than taking rates into negative territory).

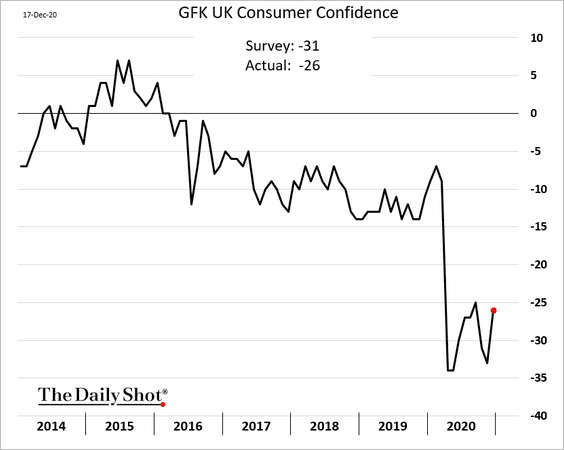
2. Consumer confidence bounced from the lows.
3. This chart shows the recent changes in household savings by income category.
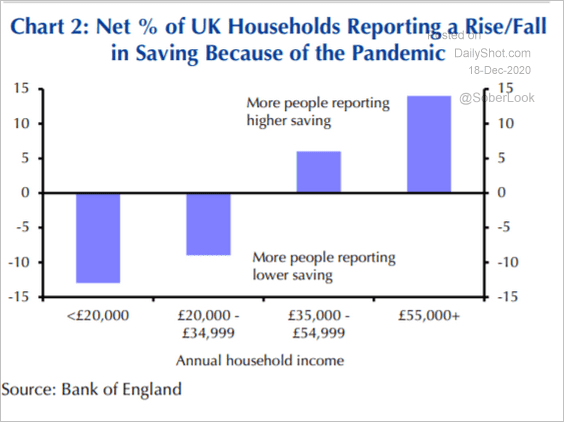 Source: Capital Economics
4. Although UK cash payments have declined, the value of notes in circulation has increased over time …
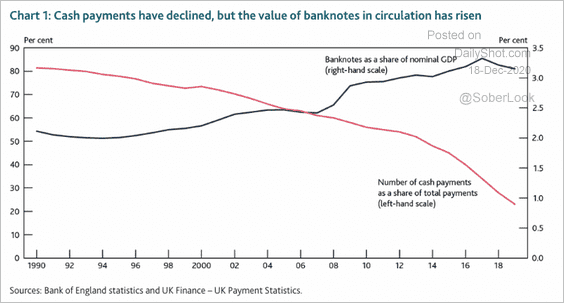 Source: BoE
… and the demand for banknotes continues to rise.
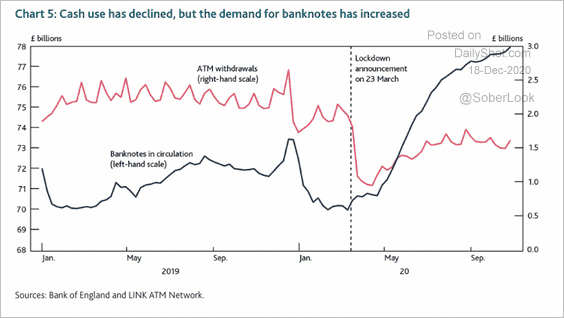 Source: BoE
ATM withdrawals have had a sharp downturn relative to previous years.
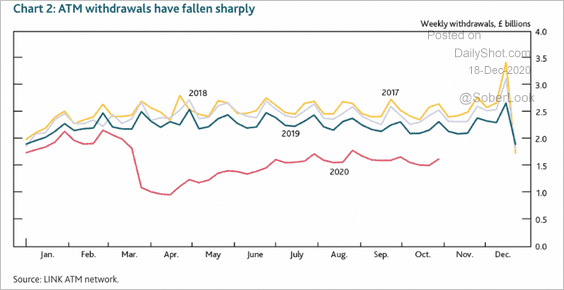 Source: BoE
——————–
5. Vaccinations continue.
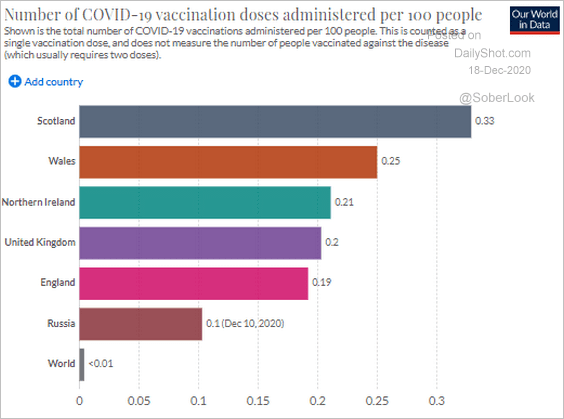 Source: Our World in Data Read full article
Canada
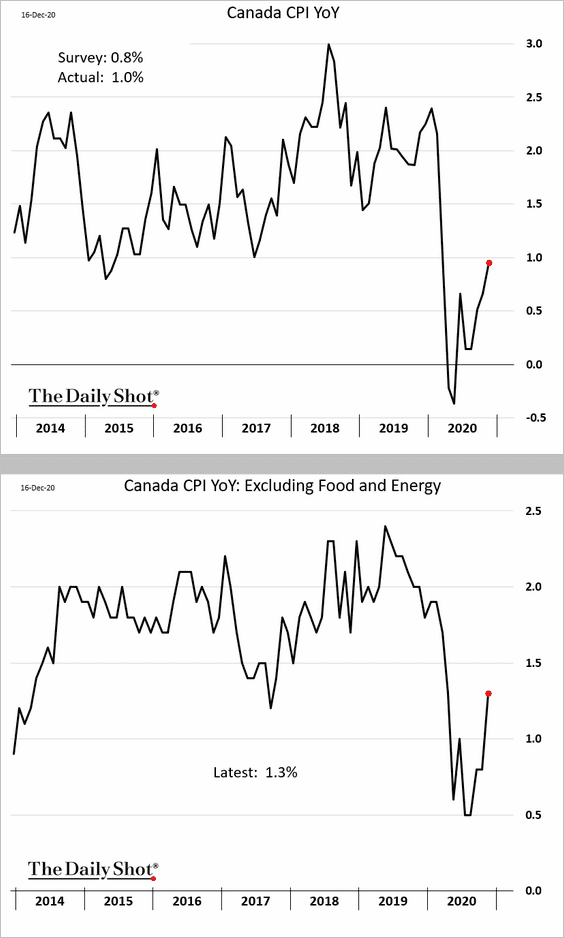
1. Inflation firmed up last month, topping forecasts.
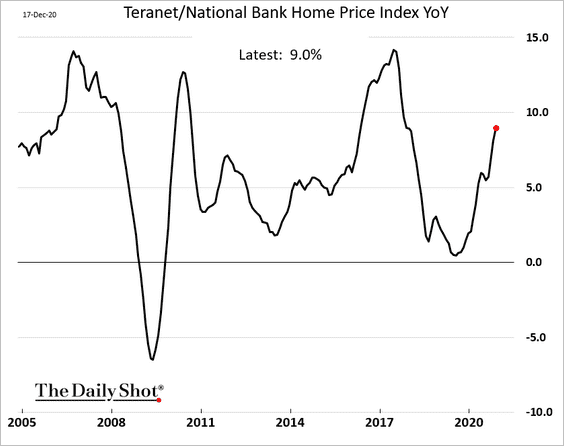
2. Home prices are up 9% from a year ago.
3. The spread between the overnight money market financing rate and the BoC’s overnight rate has risen in recent months (tighter funding conditions).
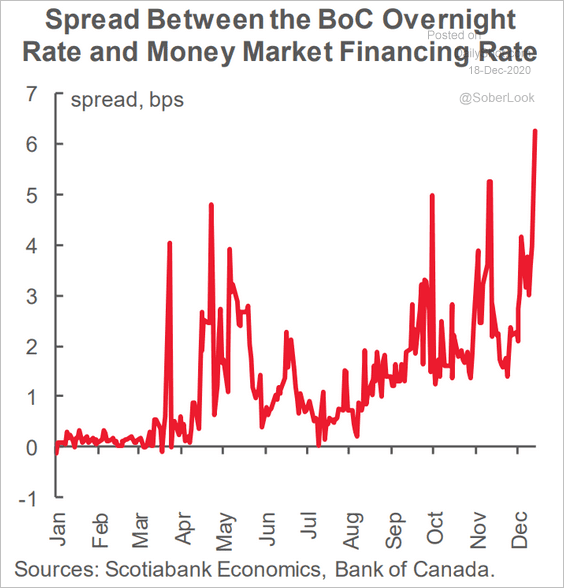 Source: Scotiabank Economics
The United States
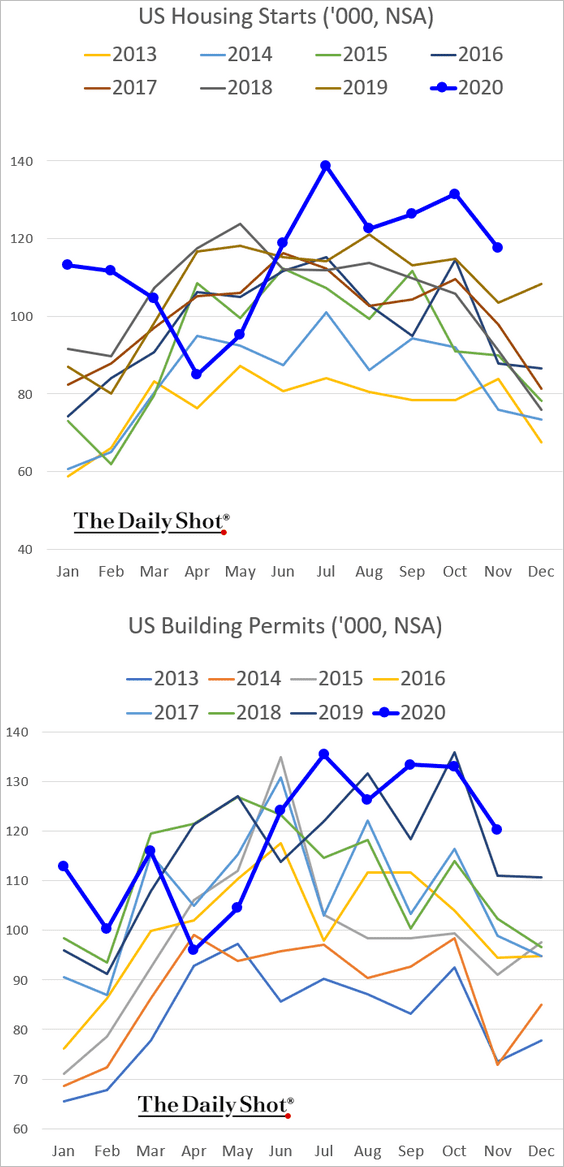
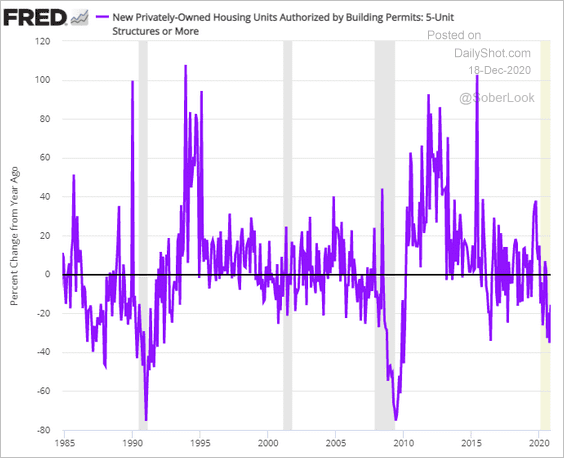
1. Residential construction remains vibrant.
• Total housing starts and building permits:
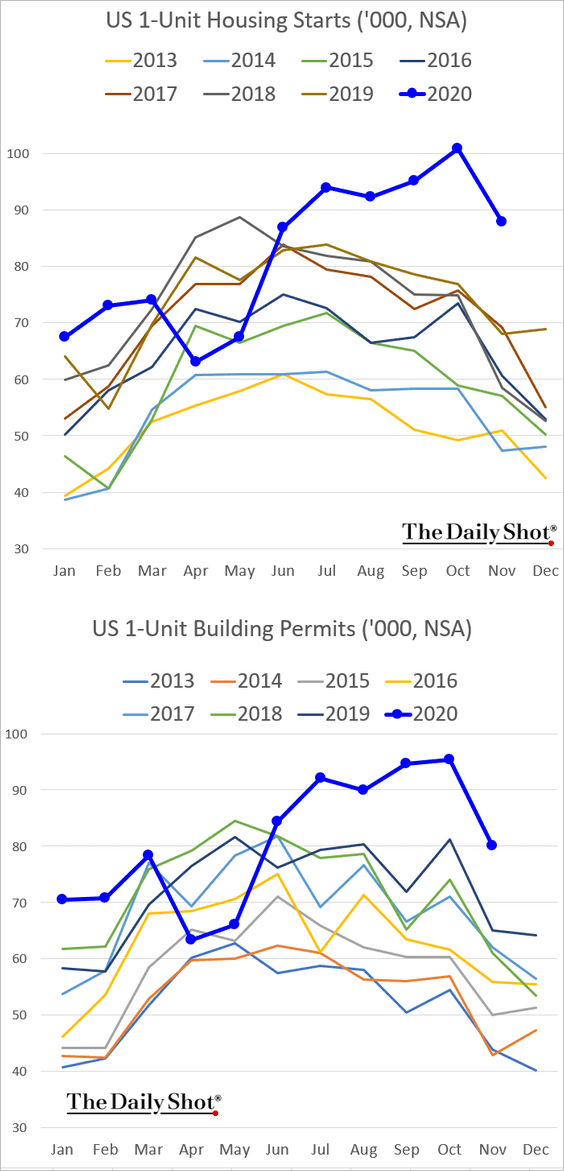
• Single-family housing:
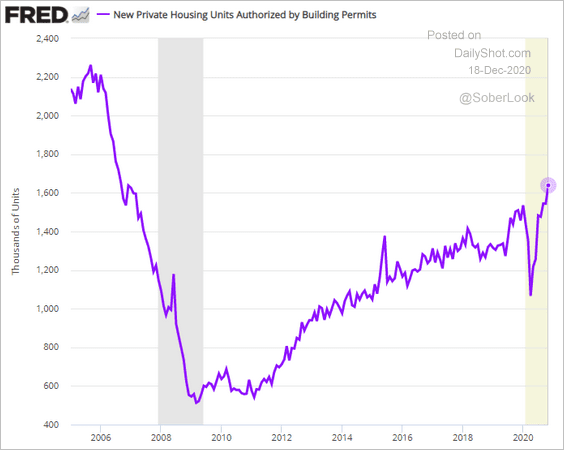
• Seasonally-adjusted building permits:
• Single-family starts vs. the 2008 cycle:
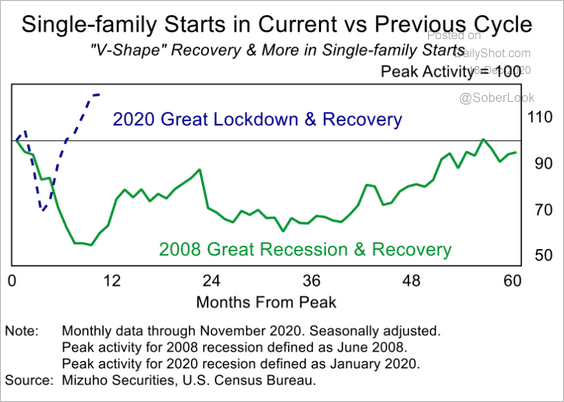 Source: Mizuho Securities USA
• Year-over-year changes in multi-family (apartment) construction permits:
——————–
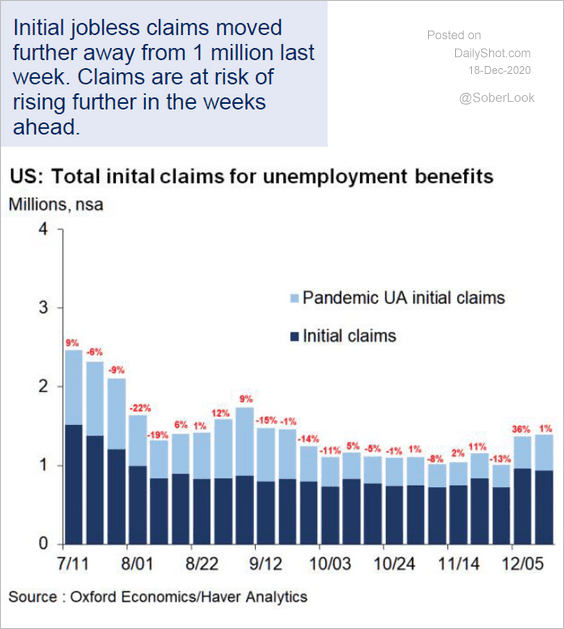
2. Initial jobless claims remain elevated …
 Source: Oxford Economics
… and could rise further in the months ahead.
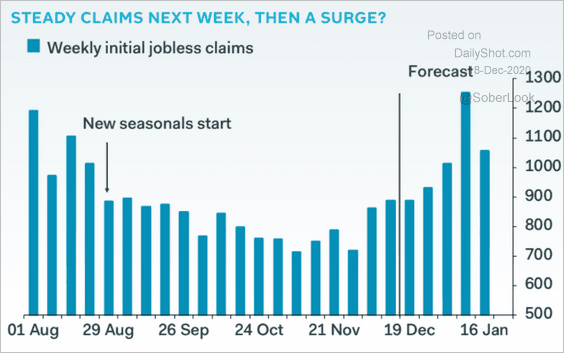 Source: Pantheon Macroeconomics
This chart shows the total number of Americans currently receiving unemployment – with many rolling into “extended” benefits.
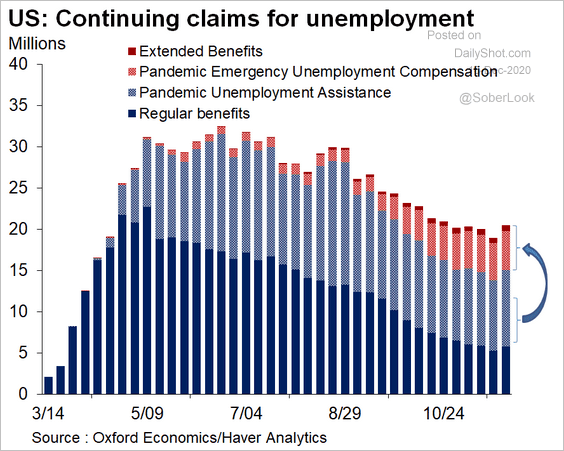 Source: @GregDaco, Oxford Economics
——————–
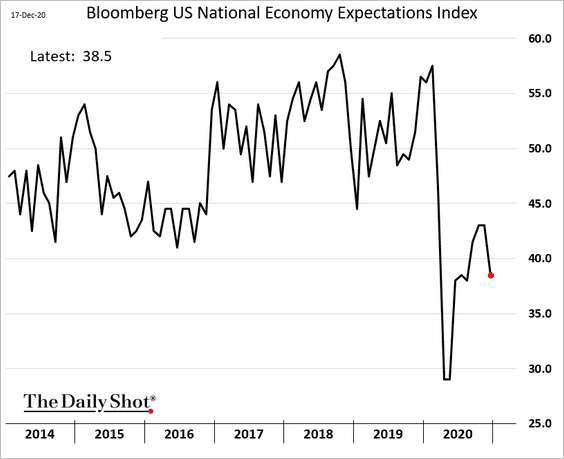
3. Confidence in the economy has deteriorated.
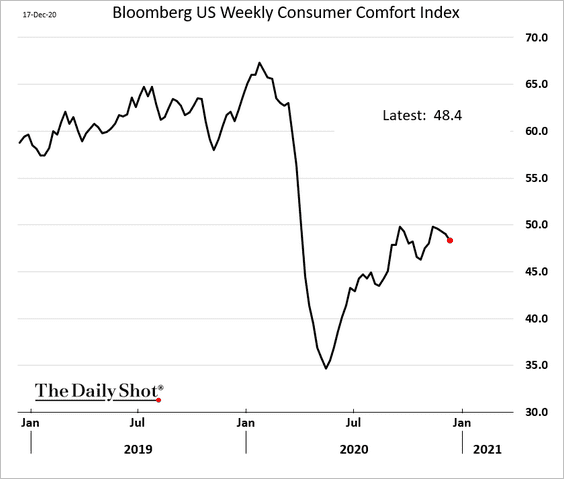
Here is Bloomberg’s consumer comfort index.
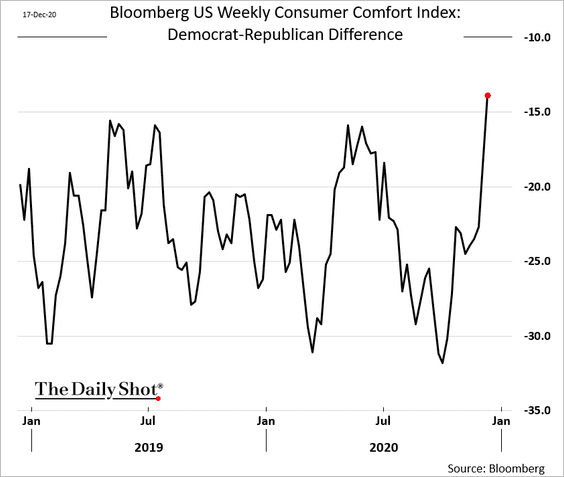
The partisan divide has widened further.
——————–
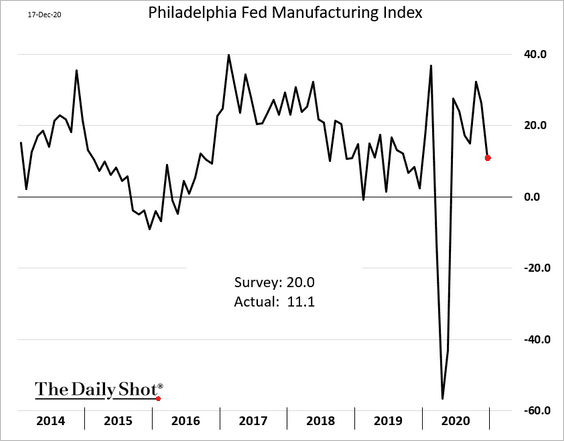
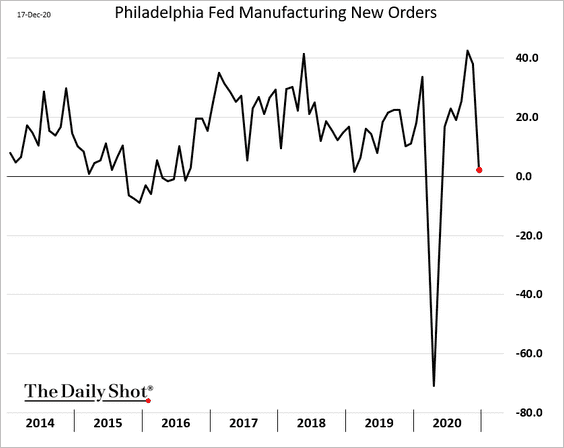
4. The Philly Fed’s regional manufacturing index softened this month as new orders retreated (2nd chart).
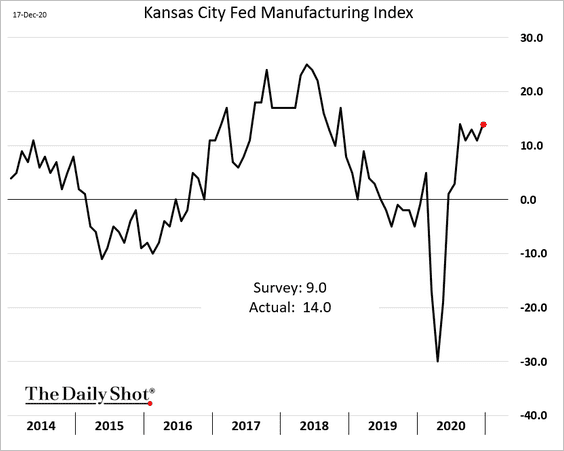
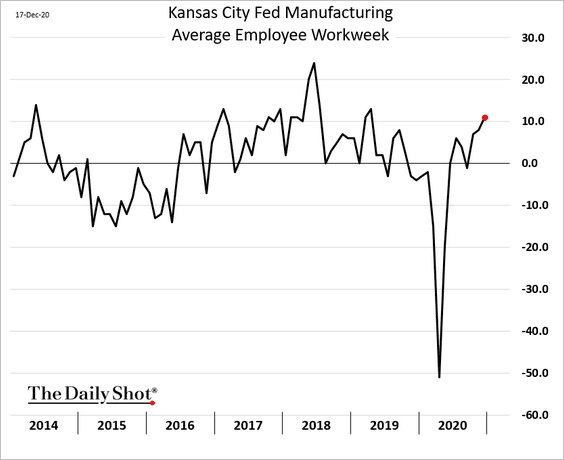
On the other hand, the Kansas City Fed’s regional index strengthened further.
——————–
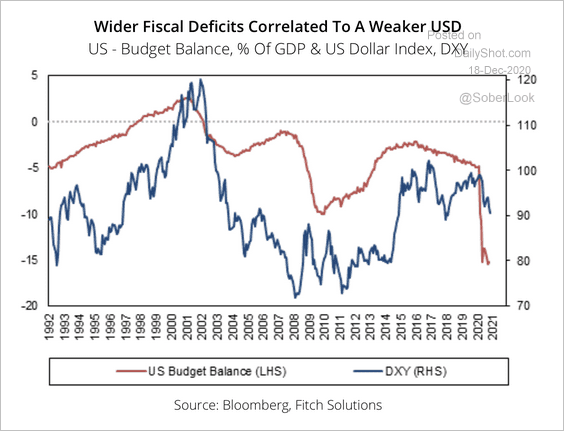
5. A wider US budget deficit has typically been associated with a weaker dollar.
 Source: Fitch Solutions Macro Research
6. Freight activity is now up on a year-over-year basis.
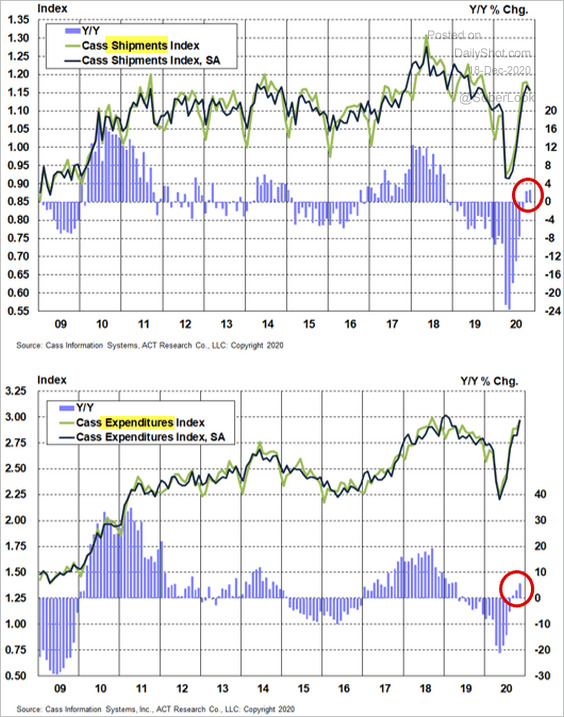 Source: Cass Information Systems
7. Next, we have some updates on the COVID situation.
• New cases:
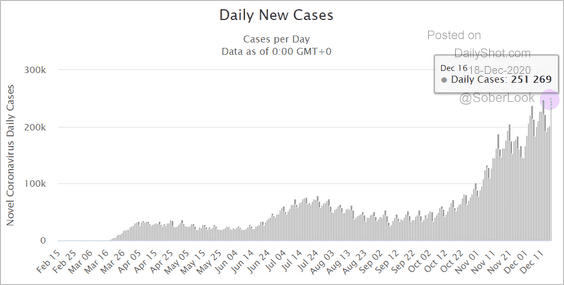 Source: WorldOMeter
• Hospital stress:
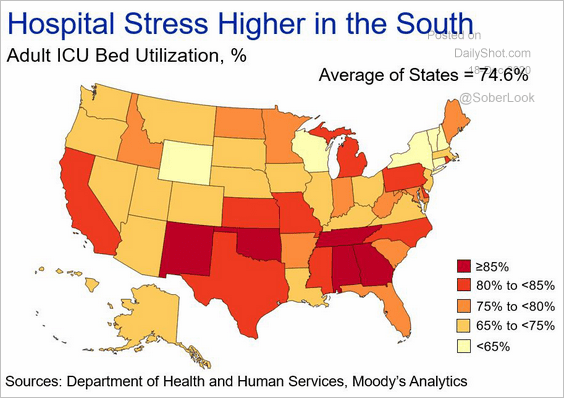 Source: Moody’s Analytics
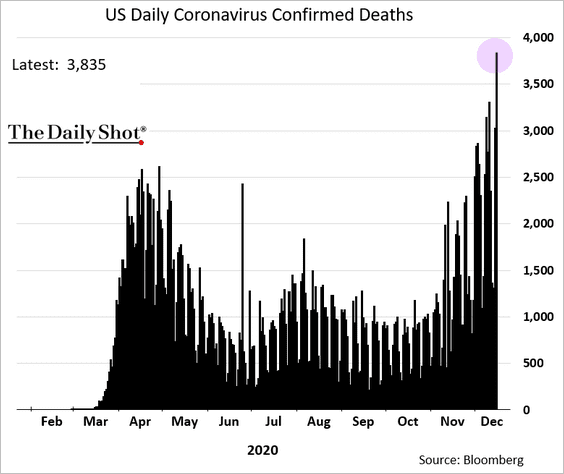
• Daily fatalities:
Emerging Markets
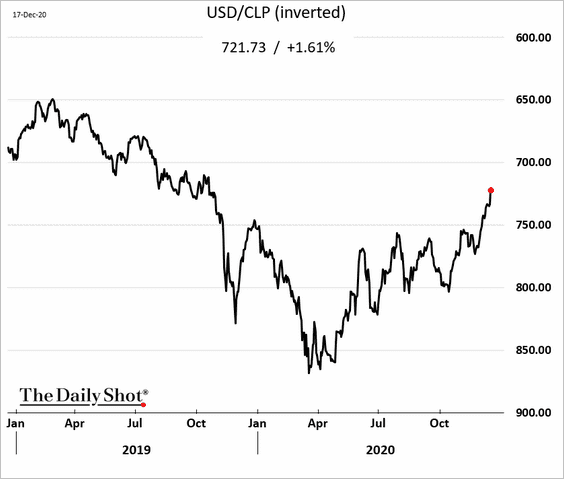
1. The Chilean peso’s recovery is accelerating as copper prices climb.
2. India’s inflation is expected to dip below RBI’s target as food prices ease.
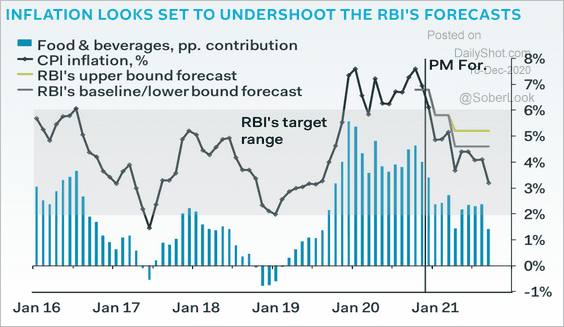 Source: Pantheon Macroeconomics
3. Capital Economics is considerably more dovish on rates than both consensus forecasts and those implied in swap markets (two charts).
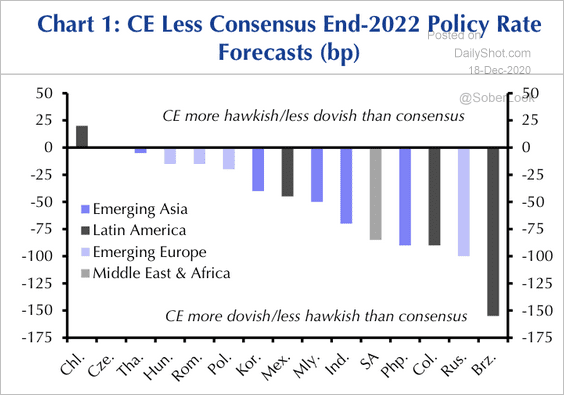 Source: Capital Economics
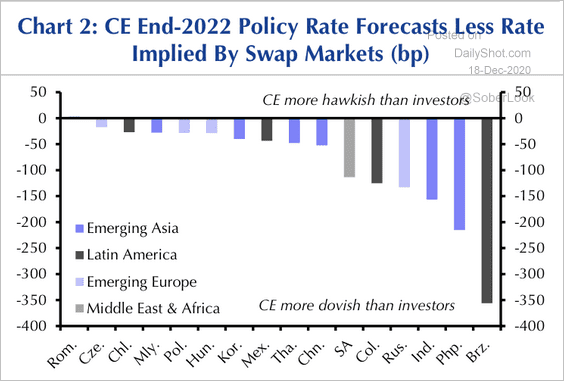 Source: Capital Economics
4. Lockdown restrictions have tightened.
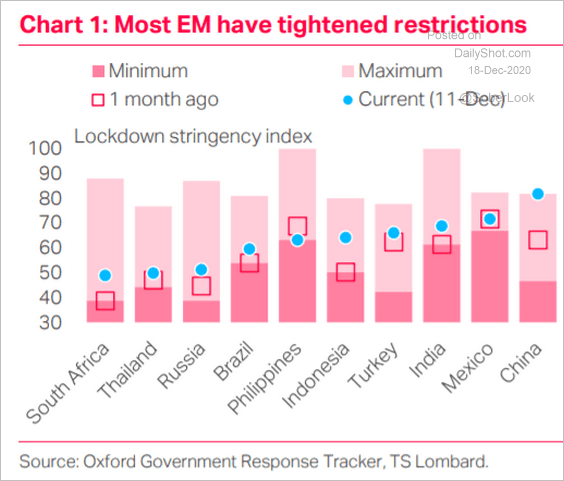 Source: TS Lombard
Cryptocurrency
1. Bitcoin’s surge was stopped at $24k.
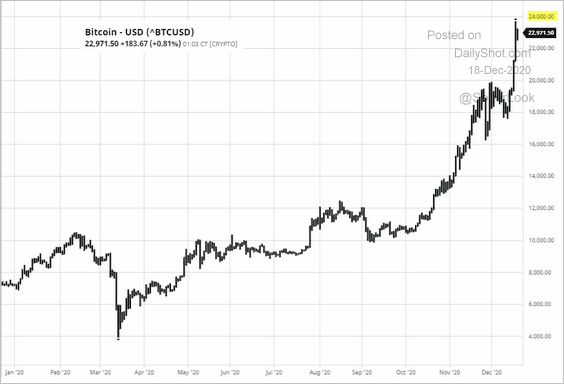 Source: barchart.com
2. The Bitcoin blockchain’s halving in May led to a steep dropoff in the cryptocurrency’s inflation rate.
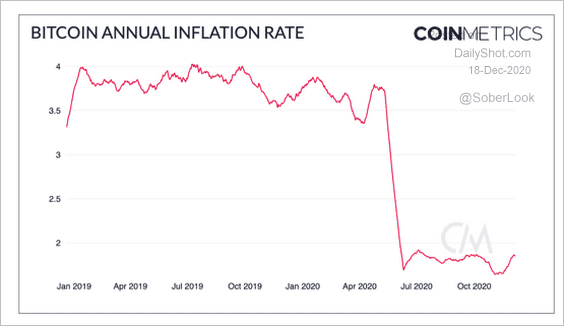 Source: CoinDesk Read full article
3. Here is a ranking of cryptocurrency trends across social media.
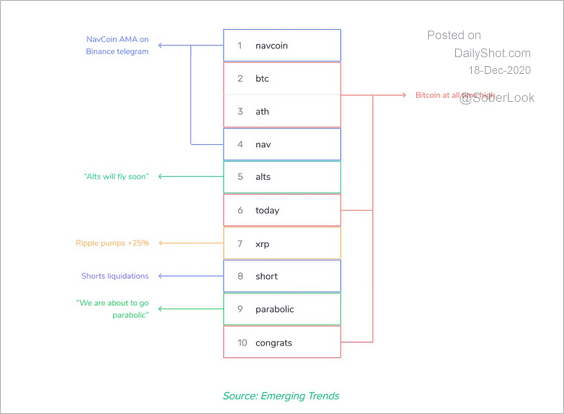 Source: @santimentfeed
4. The stablecoin “monetary base” is growing rapidly.
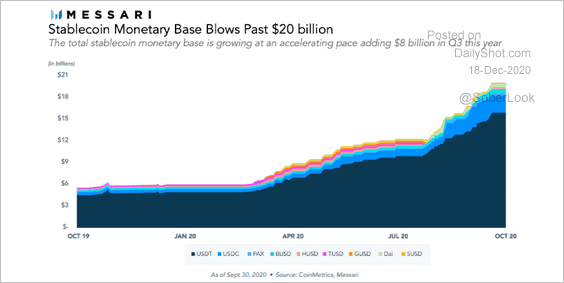 Source: Messari
5. This chart shows Bitcoin vs. FANG+ stocks.
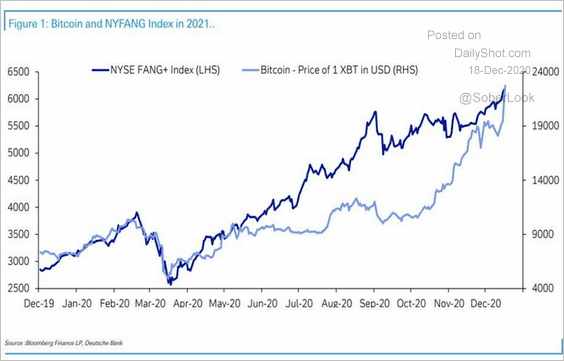 Source: Deutsche Bank Research
Commodities
1. Silver broke resistance.
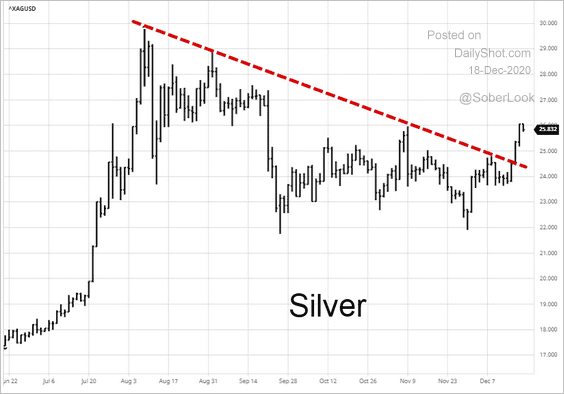 Source: barchart.com
2. Copper inventories have tightened further amid China’s industrial surge (see the China section).
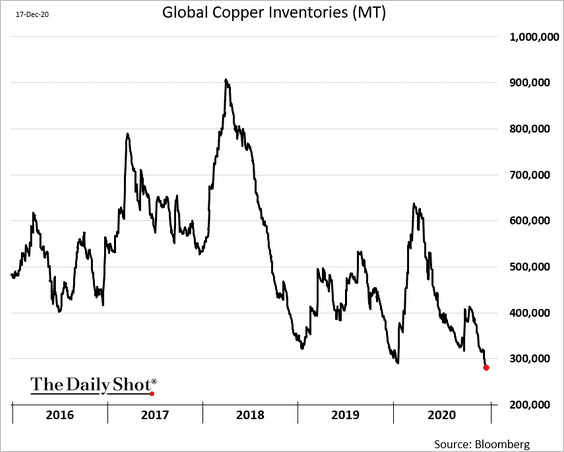 h/t Jake Lloyd-Smith
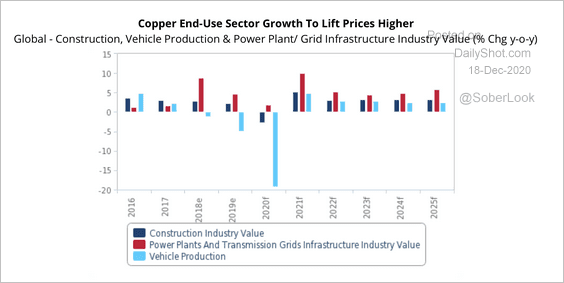
Fitch expects the copper market to remain in a deficit as consumption strengthens, driving prices higher over the coming years (two charts).
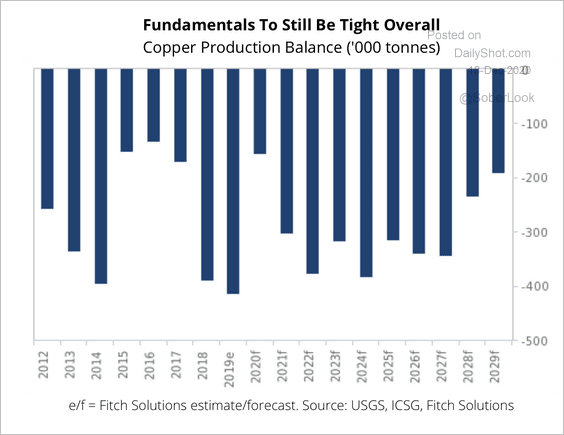 Source: Fitch Solutions Macro Research
 Source: Fitch Solutions Macro Research
——————–
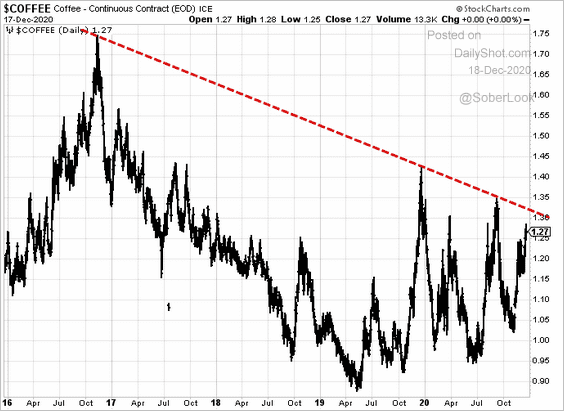
3. Will US coffee futures test resistance?
Equities
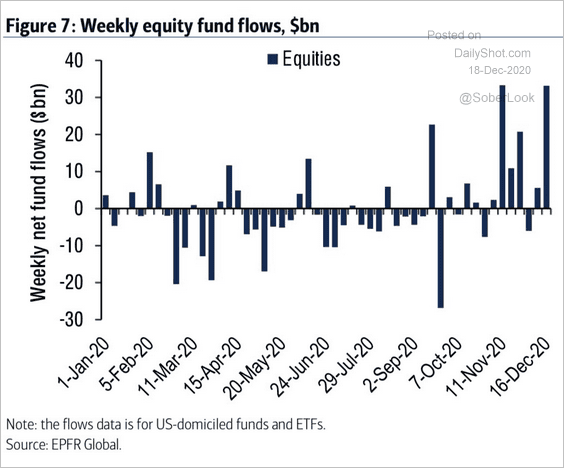
1. Fund inflows remain robust.
 Source: BofA Global Research, @WallStJesus
2. Over 90% of the Russell 3000 (broad market index) members are above their 200-day moving average.
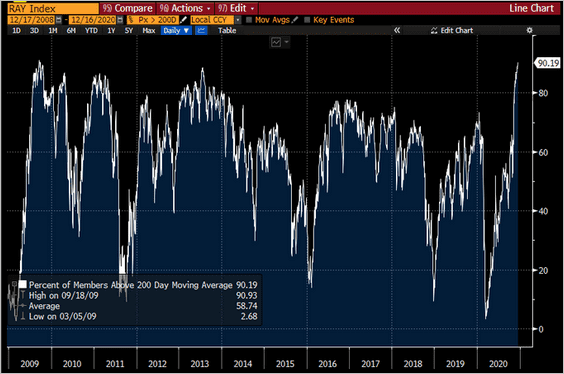 Source: @SarahPonczek
3. It’s been a while since the S&P 500 had this many 1%+ up days.
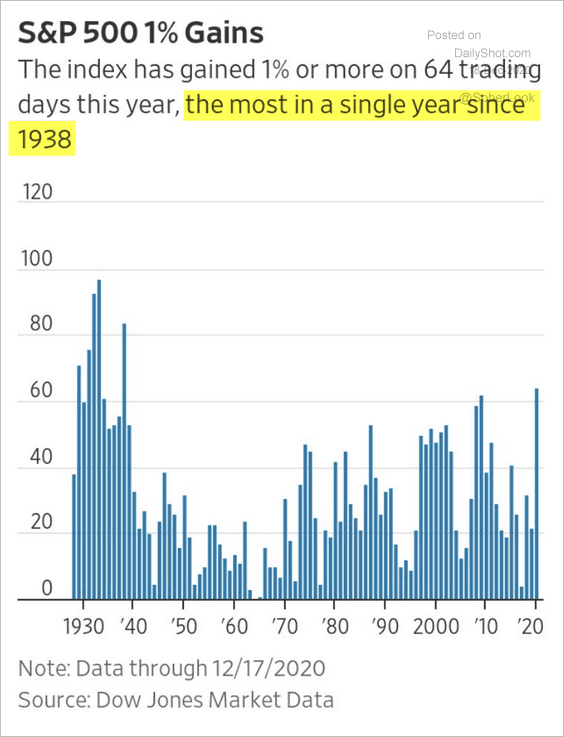 Source: @srussolillo
4. S&P 500 valuations look frothy.
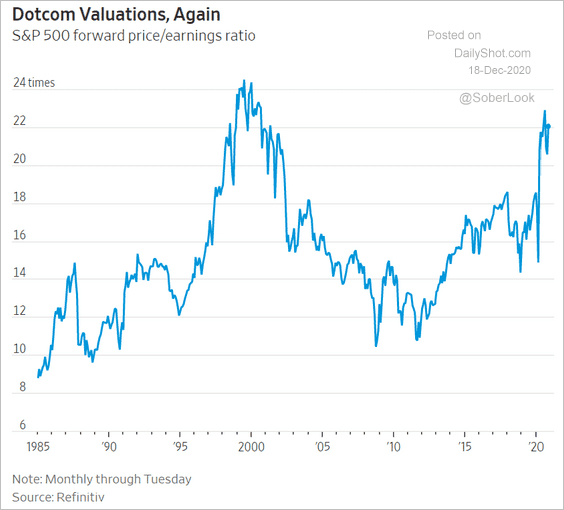 Source: @WSJ Read full article
And the inclusion of Tesla will boost them further.
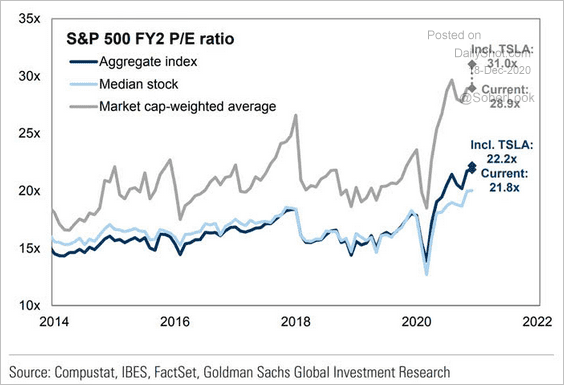 Source: @ISABELNET_SA, @GoldmanSachs
——————–
5. The average ratio of book equity to market cap of FAANG stocks is 8%, which means they have few tangible assets, according to FactorResearch.
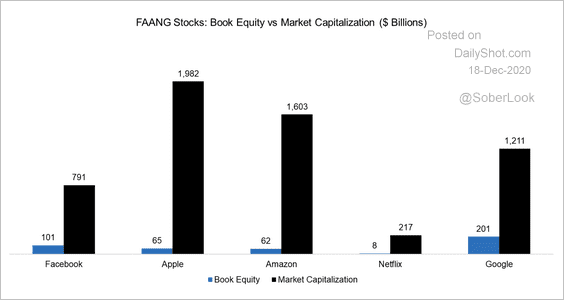 Source: FactorResearch
That’s why intangibles as a percent of market cap are higher in the US than Europe and Japan.
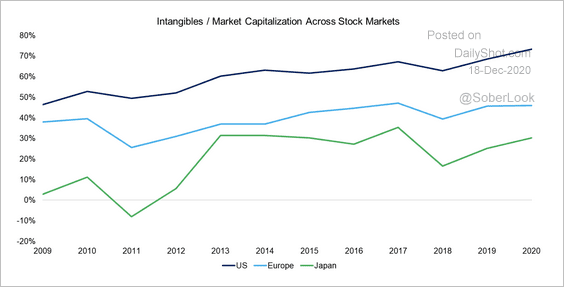 Source: FactorResearch
——————–
6. The sharp rebound in the ISM manufacturing PMI suggests more upside for financial stocks.
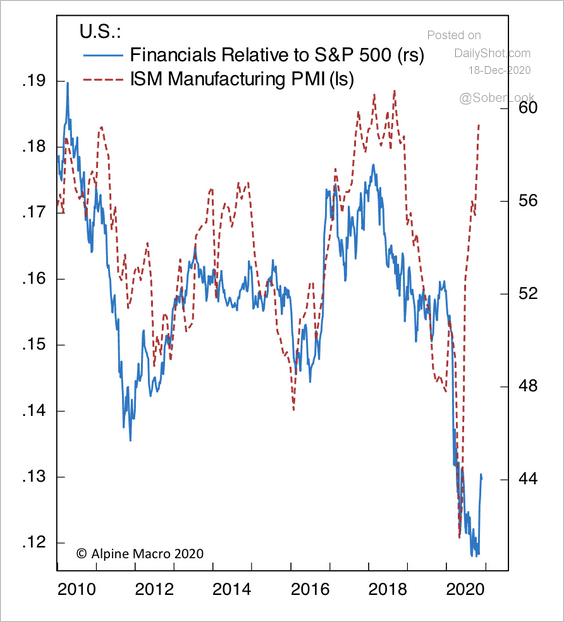 Source: Alpine Macro
7. Cyclical sectors such as banks and energy have massively lagged behind tech over the past few years (relative to the S&P 500).
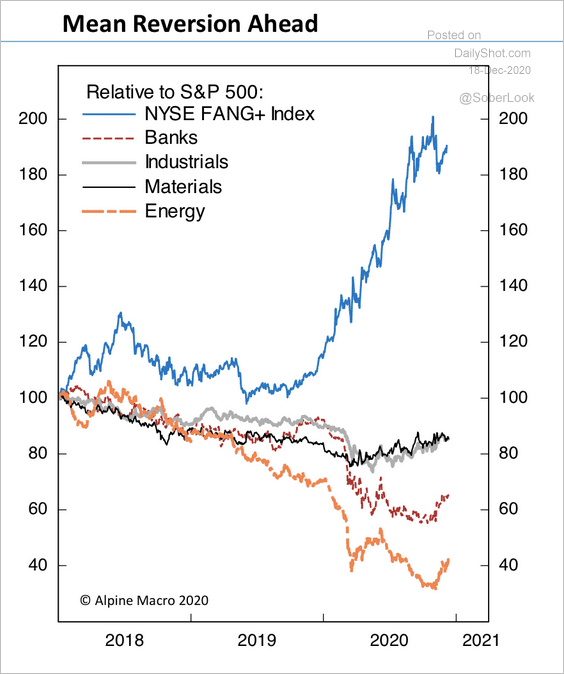 Source: Alpine Macro
8. Here are some updates on the energy sector.
• The sector is trading similarly to past cycles.
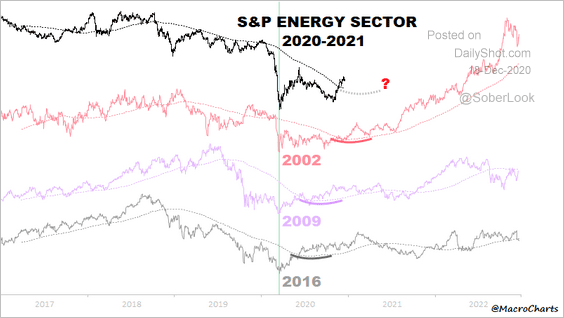 Source: @MacroCharts
• US energy stocks are trading at relatively cheap valuations.
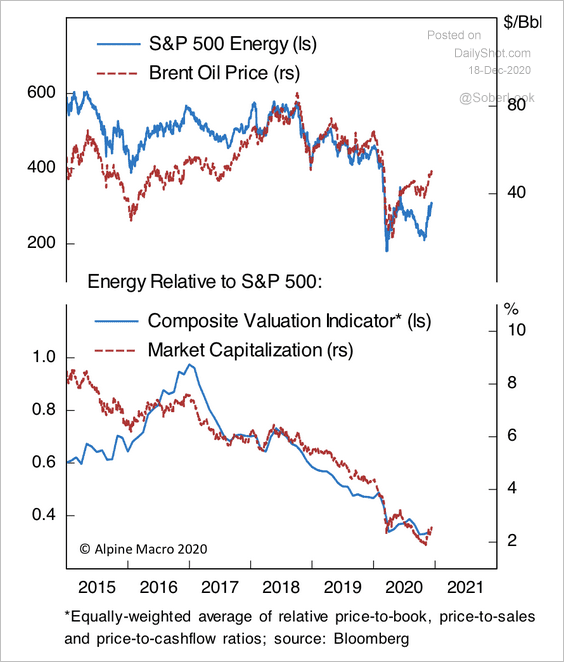 Source: Alpine Macro
• The market cap of global semiconductors has soared past that of the energy sector.
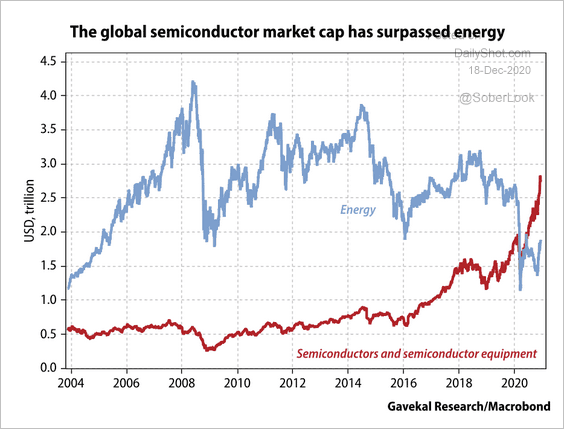 Source: Gavekal Research
——————–
9. Post-IPO stocks had a great year – and not just in the US.
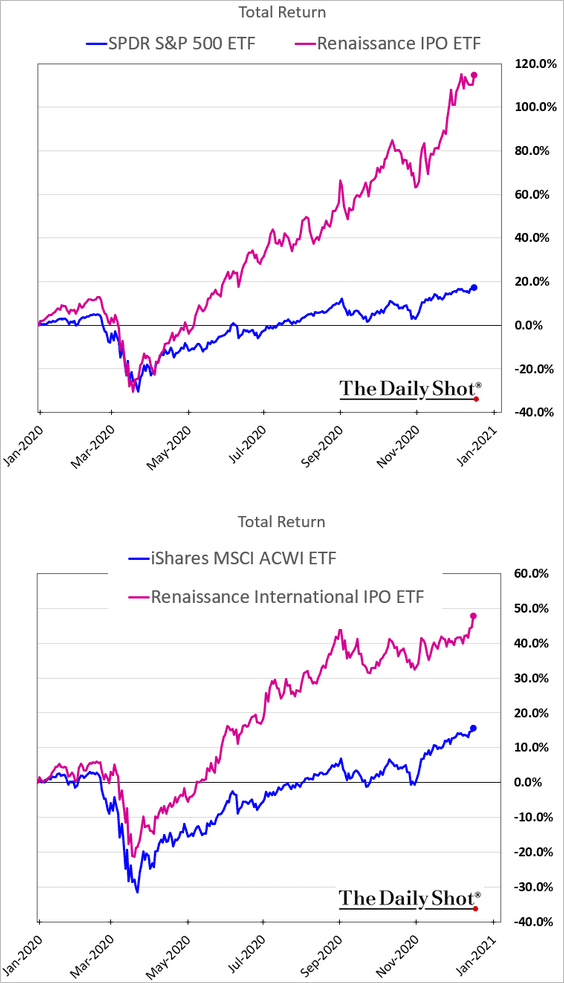 h/t @JPBarnert
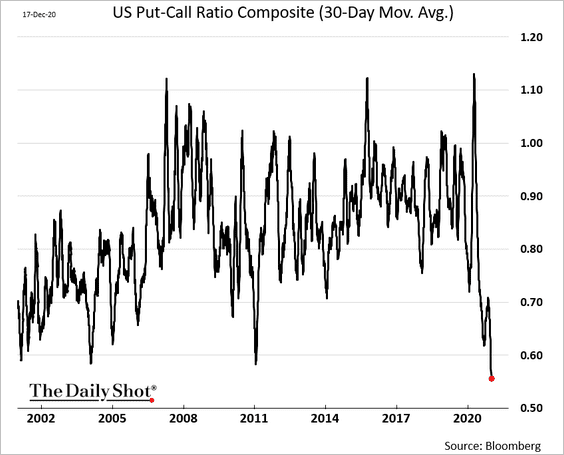
10. Here is a 20-year chart of the put-call ratio (30-day moving average).
Credit
1. US-listed bond ETF flows just broke through $200 billion this year.
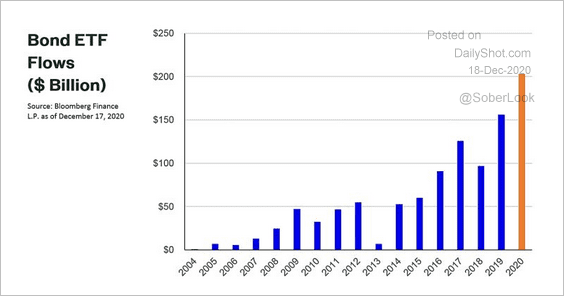 Source: Matthew Bartolini, @mattbartolini, SPDR Americas Research
2. High-yield inflows have been massive.
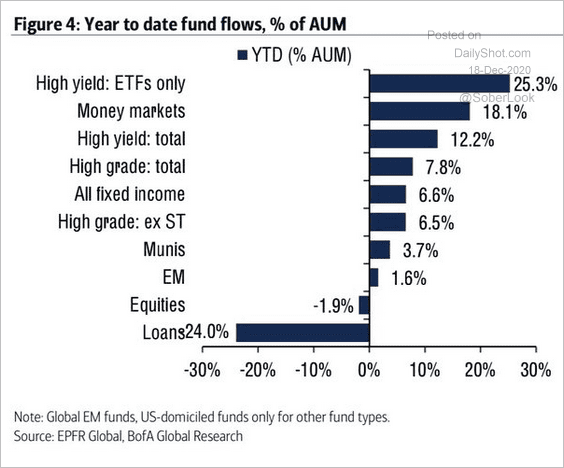 Source: BofA Global Research, @WallStJesus
3. Here is a longer-term chart of investment-grade index duration vs. yield.
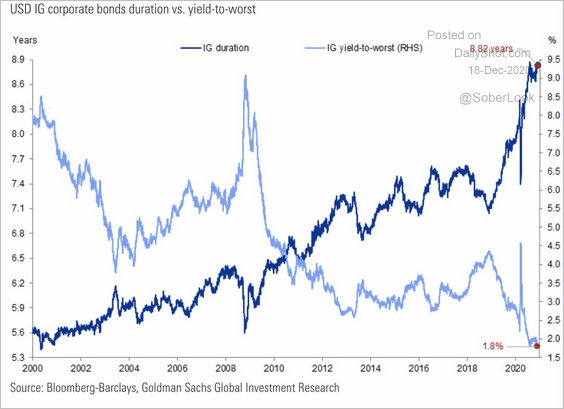 Source: Goldman Sachs
4. So far, US business bankruptcy filings have not followed the rise in unemployment.
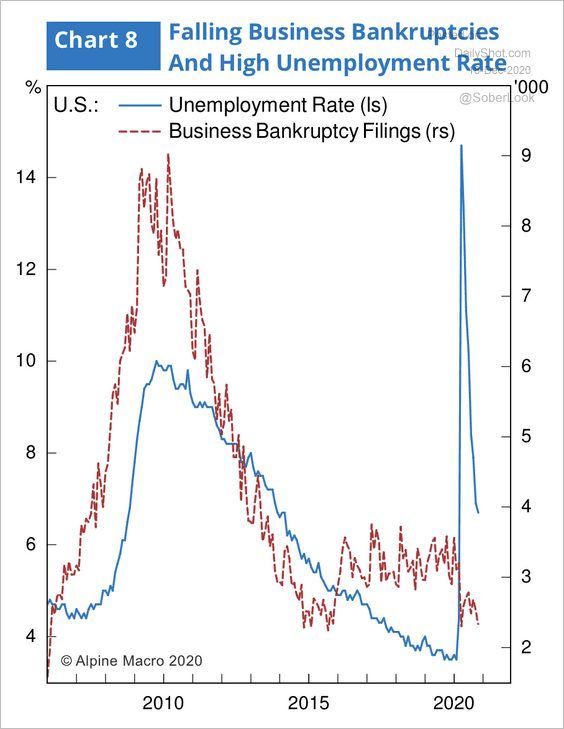 Source: Alpine Macro
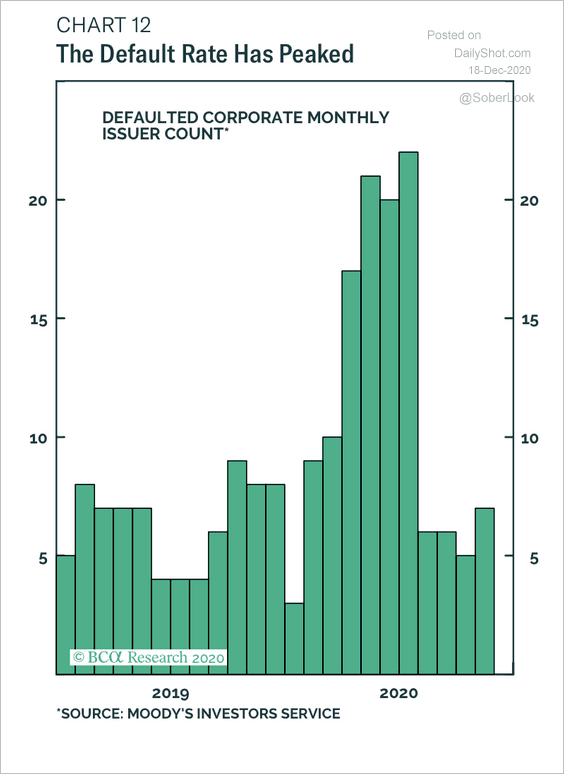
• Has the US speculative-grade default rate peaked (two charts)?
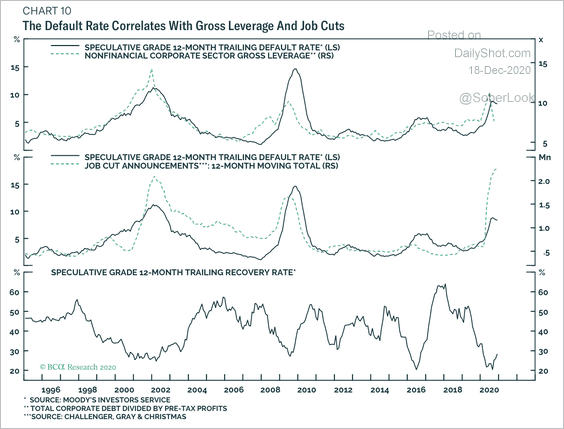 Source: BCA Research
 Source: BCA Research
• Which retail companies are most vulnerable currently?
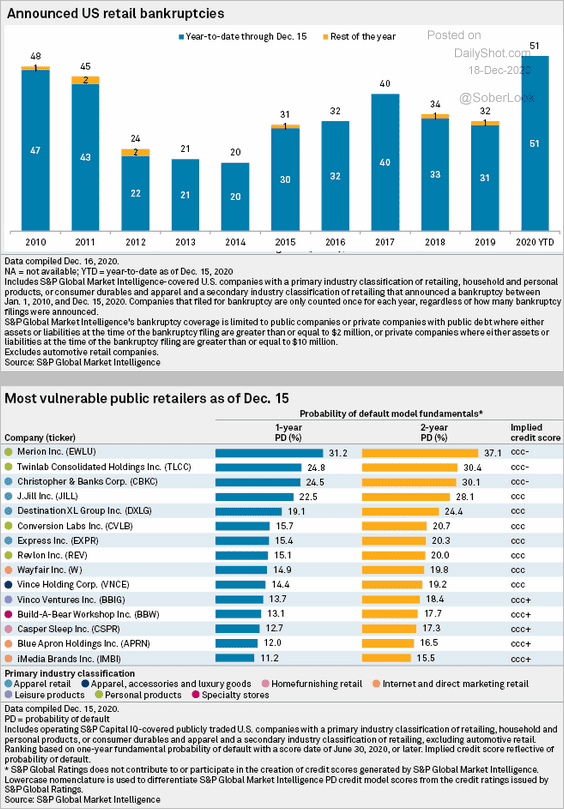 Source: S&P Global Market Intelligence
——————–
Food for Thought
1. US food insecurity:
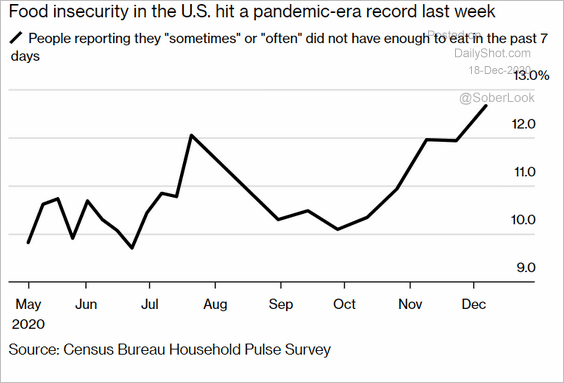 Source: @bpolitics Read full article
2. Where travelers are most concerned about COVID:
 Source: @business Read full article
3. World leaders who had COVID:
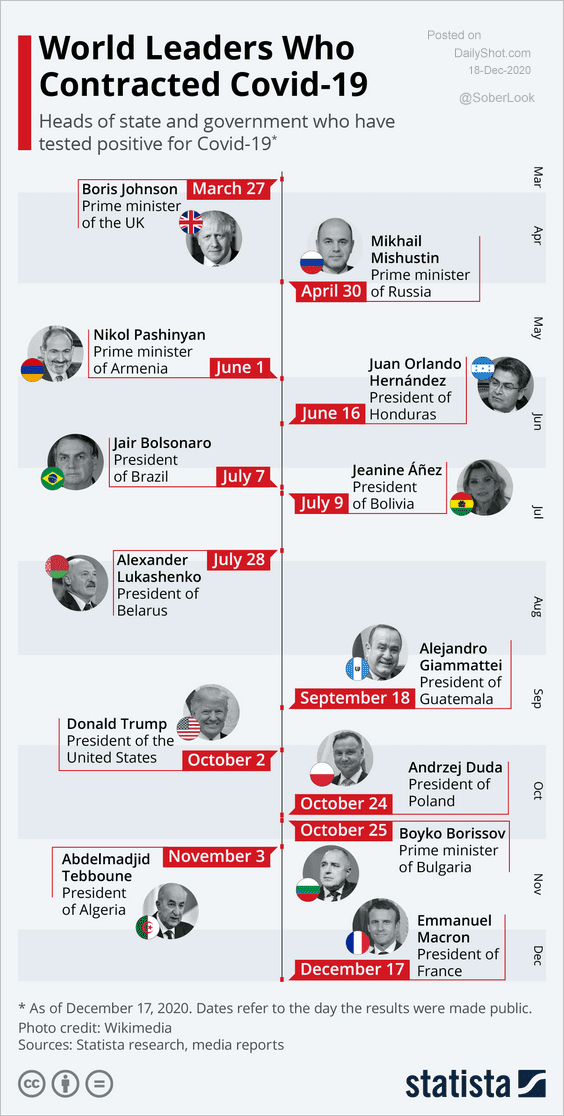 Source: Statista
4. Hardliners back in power in Iran:
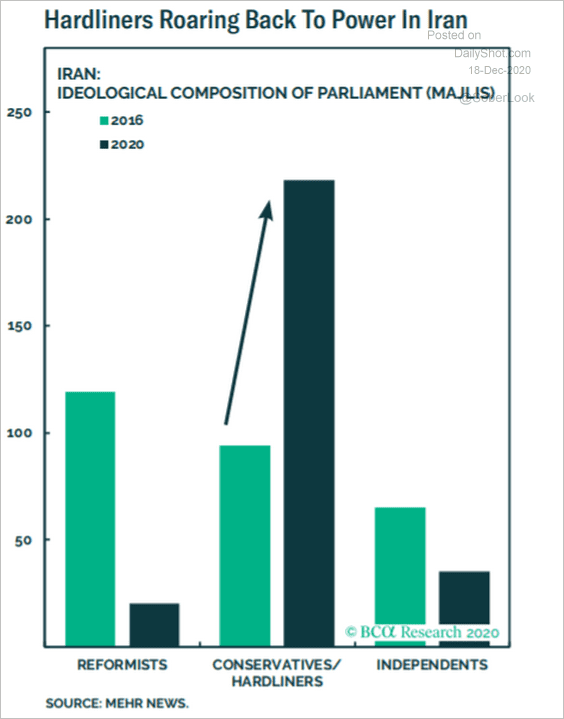 Source: BCA Research
Iran’s uranium stockpile:
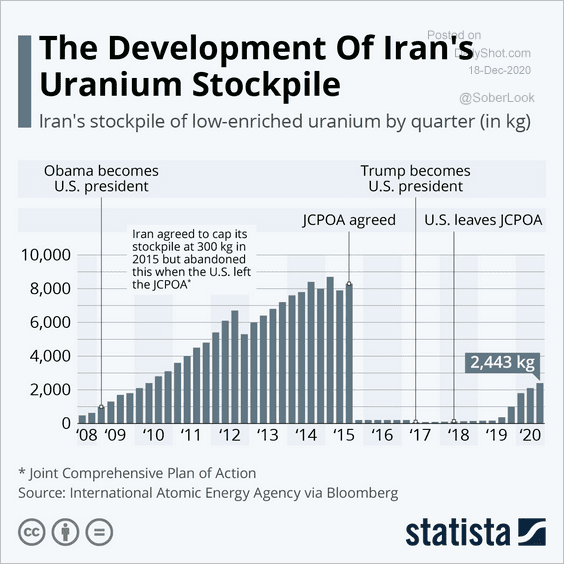 Source: Statista
——————–
5. Office visits:
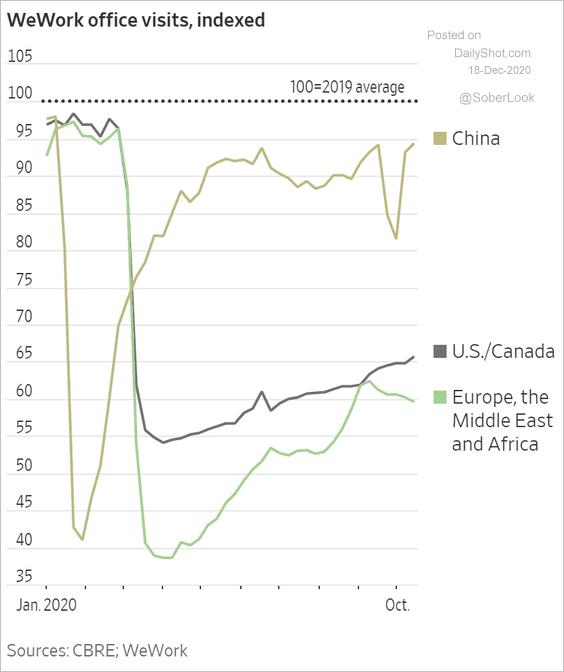 Source: @WSJ Read full article
6. House vs. apartment rents:
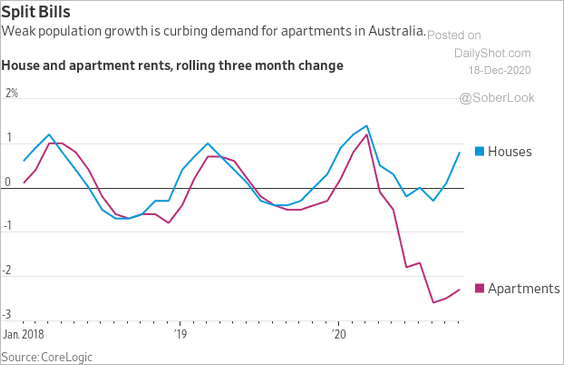 Source: @WSJ Read full article
7. A warm November:
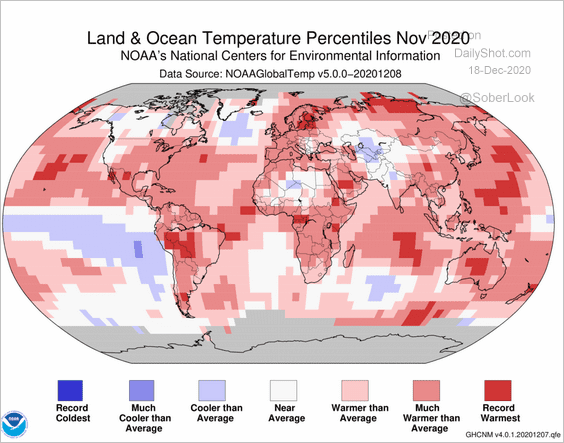 Source: NOAA Read full article
8. Interest in fasting:
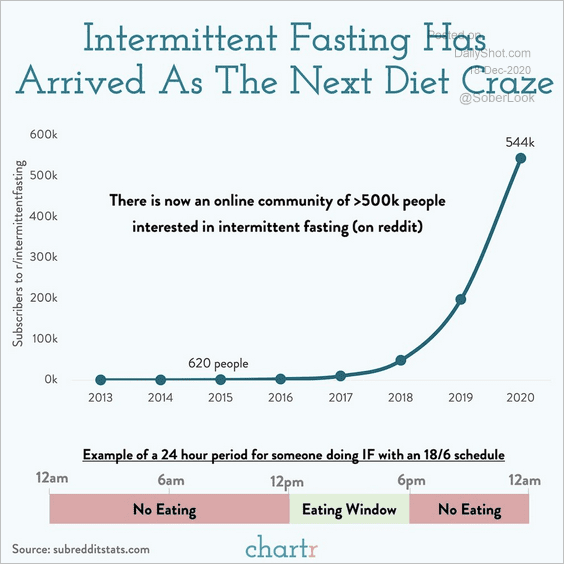 Source: @chartrdaily
9. Popular human names for dogs:
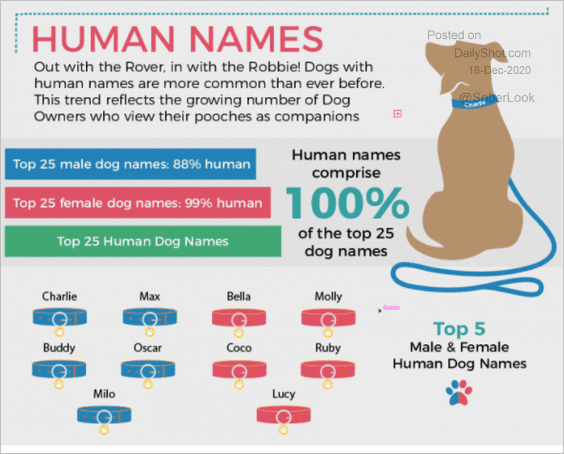 Source: Mad Paws Read full article
——————–
Have a great weekend!