
The Daily Shot: 22-Dec-20
• The United States
• Canada
• The United Kingdom
• The Eurozone
• Asia – Pacific
• China
• Emerging Markets
• Cryptocurrencies
• Commodities
• Equities
• Credit
• Rates
• Global Developments
• Food for Thought
The United States
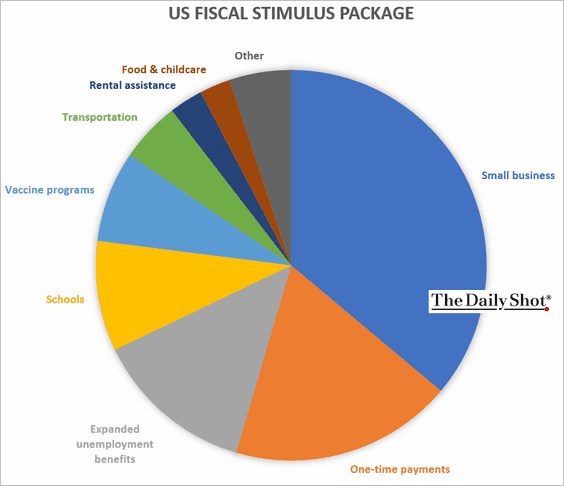
1. Congress finally passed the $900 billion stimulus bill.
 Source: @WSJ Read full article
Below are the key components of the package …
• A one-time $600 payment to most Americans
• Extension of the Pandemic Unemployment Assistance and Pandemic Emergency Unemployment Compensation programs
• Extension of the $300 per week in additional unemployment benefits through mid-March
• $284 billion for the Paycheck Protection Program (PPP) and additional small business funding worth $35 billion
• Extension of the federal eviction moratorium through the end of January plus $25 billion for a rental assistance fund
• Up to $68 billion for vaccine distribution, vaccine administration (making it free), and COVID testing/contact tracing
• A $13 billion increase to SNAP (foods stamps, food banks, etc.)
• $10 billion for childcare assistance
• $10 billion for the USPS
• $45 billion for transportation: highways, airlines, transit systems
• $7 billion for broadband internet for students
• $82 billion for schools (K-12 and colleges)
• $13 billion for agriculture
… and some additional “features.”
• Termination of unused Fed lending programs
• An attempt to end “surprise medical billing”
• Temporary tax cuts on beer, wine, and liquor
• And finally, the cost of meals becomes a deductible business expense.
Here is a rough breakdown of the planned expenditures.
——————–
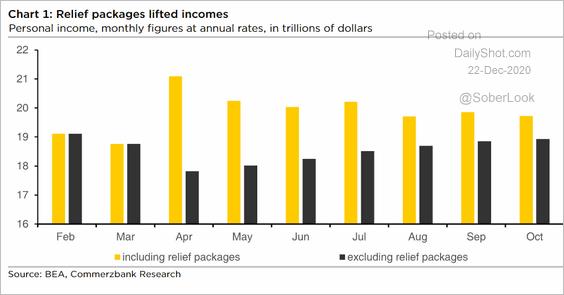
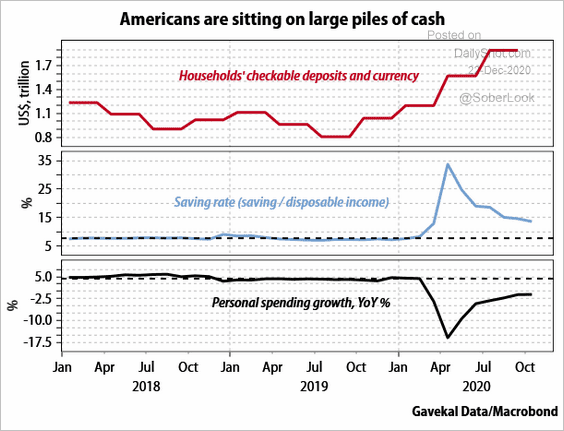
2. The previous relief bill lifted incomes. The $900 billion injection won’t have quite the same impact, but it will keep household incomes elevated for a few months longer. Given that household savings are already high, additional cash could unleash more spending in the spring. We may also see more speculative activity in the stock market.
 Source: Commerzbank Research
 Source: Gavekal Research
——————–
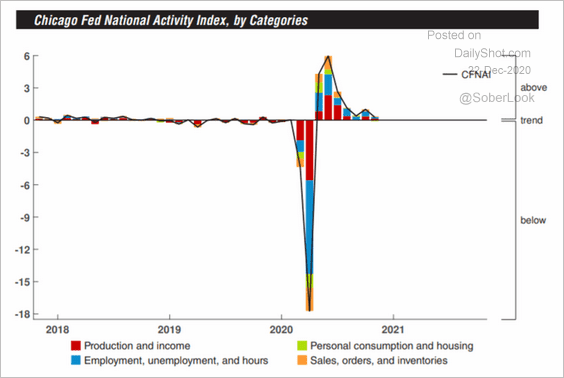
3. While another package may be needed next year, this bill will deliver critical support to combat the pandemic and cushion the economic weakness.
• The Chicago Fed national activity index:
 Source: @GregDaco, @ChicagoFed
• Goldman’s current activity index (negative for the first time since April):
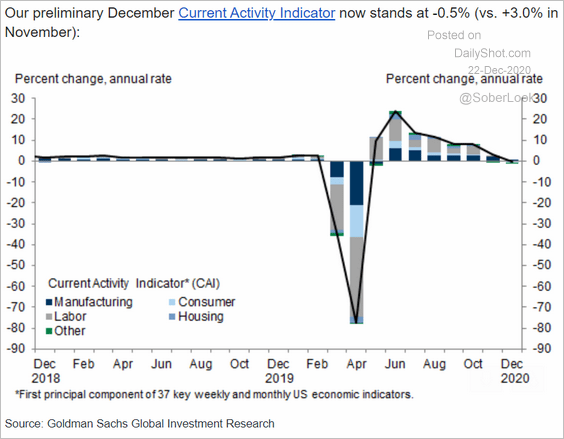 Source: Goldman Sachs
• COVID-related hospitalizations:
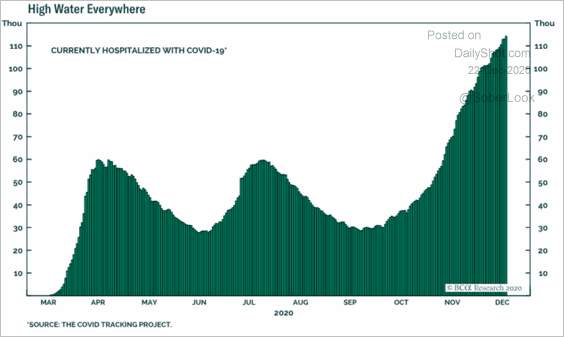 Source: BCA Research
Canada
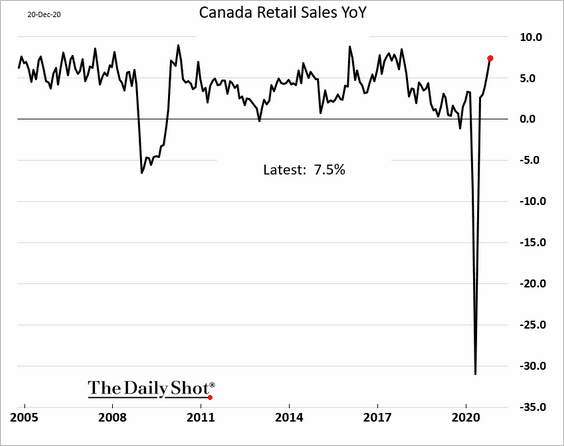
1. Retail sales have rebounded sharply (through October).
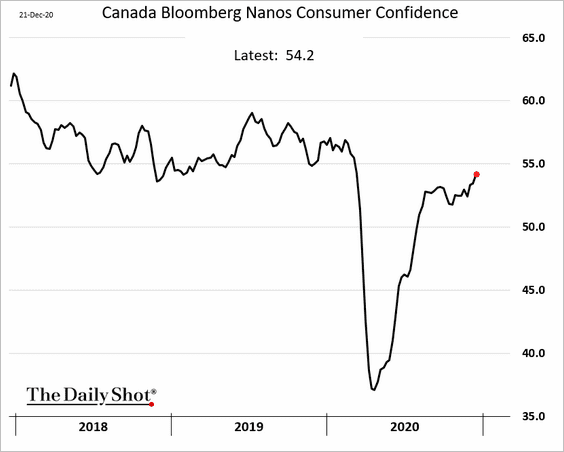
2. Consumer confidence is approaching pre-crisis levels.
The United Kingdom
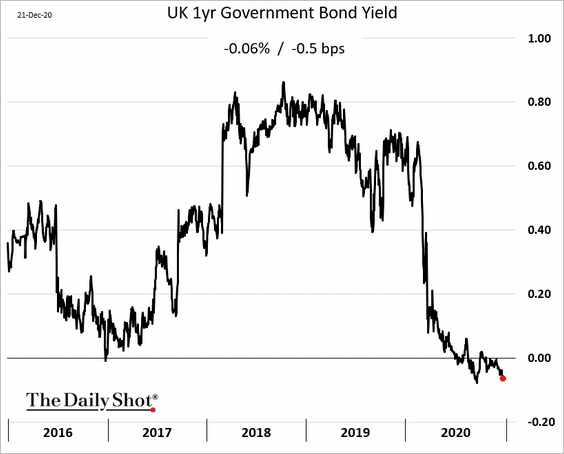
1. Short-term rates have been moving deeper into negative territory.
2. The UK economic underperformance was driven by weak consumer spending.
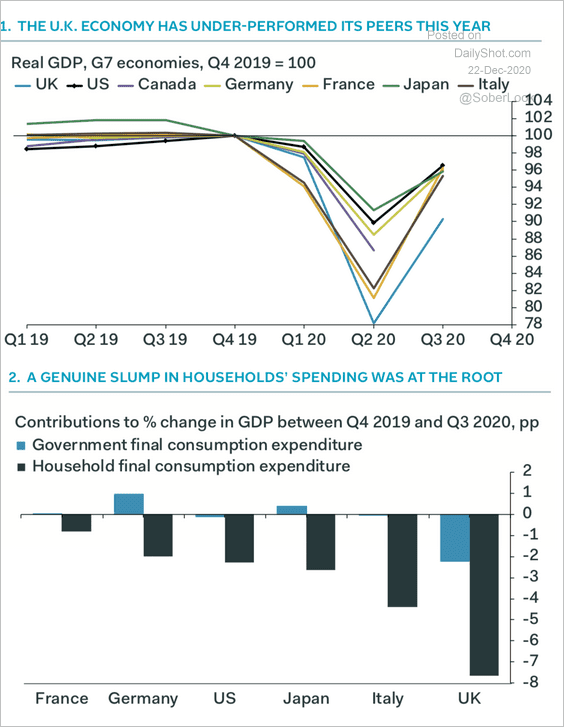 Source: Pantheon Macroeconomics
The Eurozone
1. Consumer confidence rebounded more than expected, …
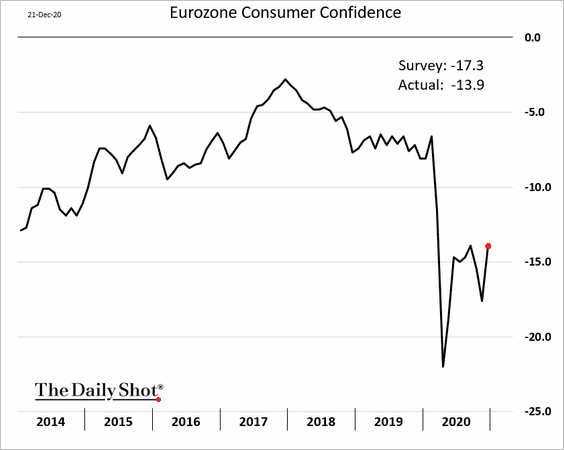
… but it still lags retail sales. Something has to give.
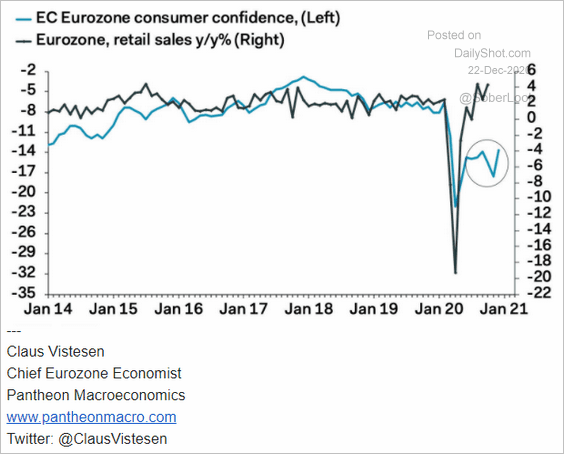 Source: Pantheon Macroeconomics
——————–
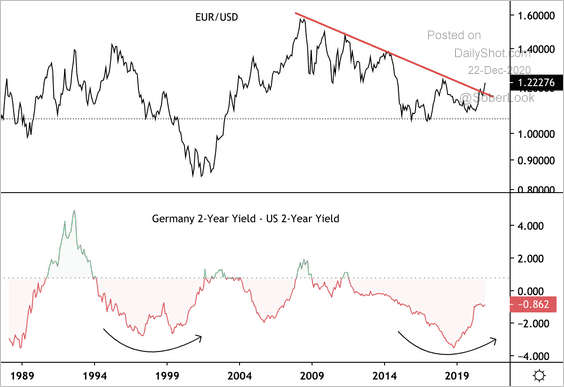
2. Yield differentials suggest a higher EUR/USD.
 Source: @DantesOutlook
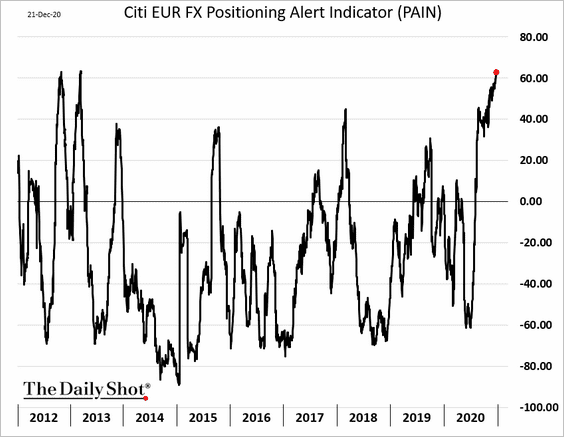
However, long-euro has become a crowded trade. Here is the Citi positioning indicator tracking active F/X traders.
——————–
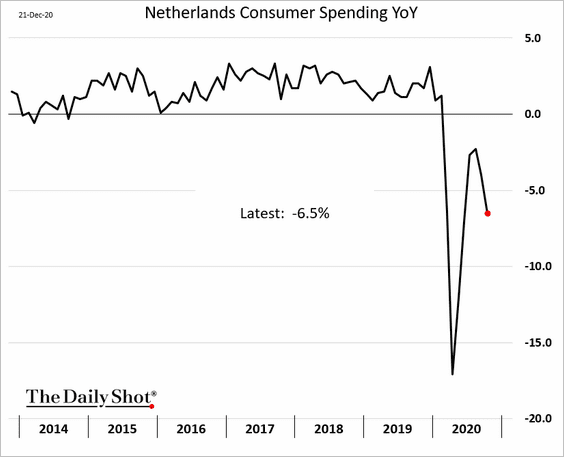
3. Netherlands consumer spending tumbled in October.
4. Italy and Spain are the largest beneficiaries of the €47.5 billion REACT-EU package (€37.5bn allocated in 2021 and €10bn in 2022.)
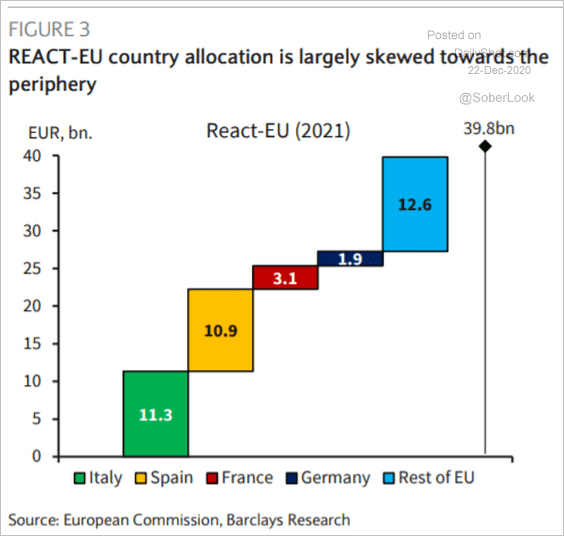 Source: Barclays Research
But other fiscal measures will be rolling off.
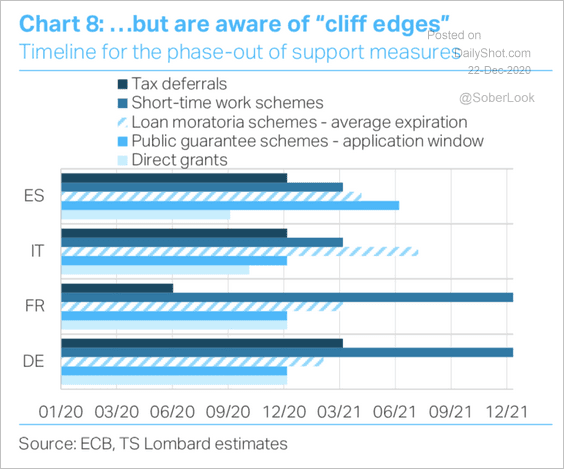 Source: TS Lombard
——————–
5. European stocks have broken below a decade-long downtrend relative to the US. Deutsche Bank expects a reversal next year.
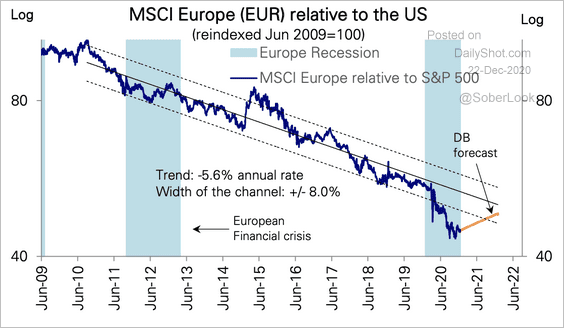 Source: Deutsche Bank Research
Asia – Pacific
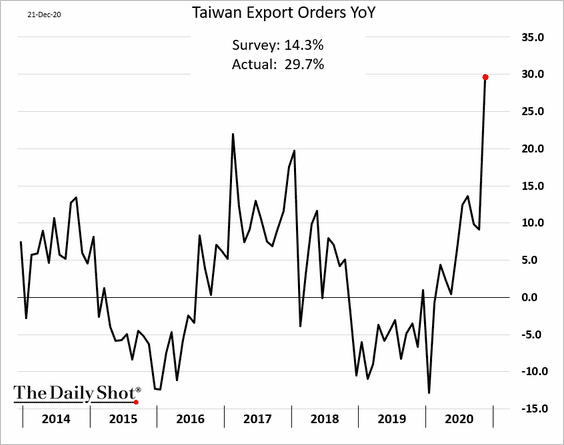
1. Taiwan’s export orders are up 30% vs. the same time last year.
2. South Korea’s equities have lagged Taiwan’s by a large margin over the past year.
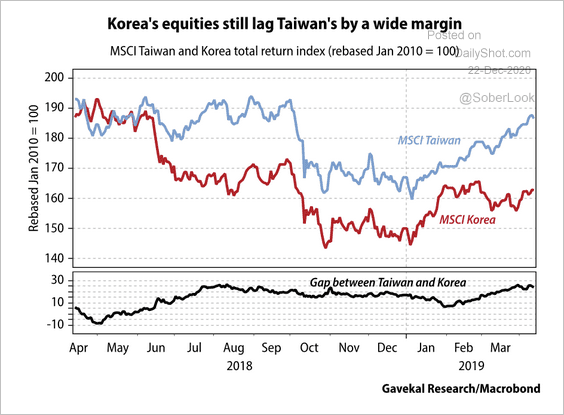 Source: Gavekal Research
3. South Korea’s memory chip export prices are at a decade-low, pressuring manufacturers.
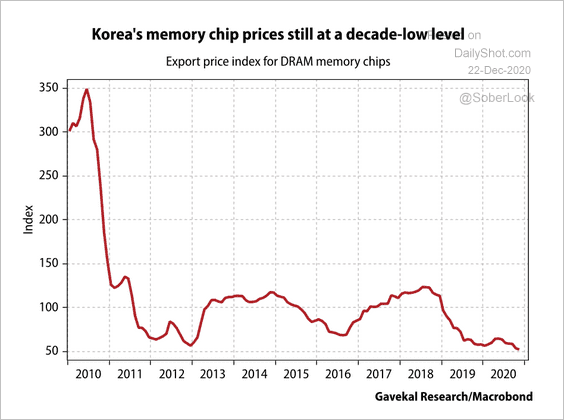 Source: Gavekal Research
4. Australia’s 2020 bushfire damage was unprecedented in recent decades.
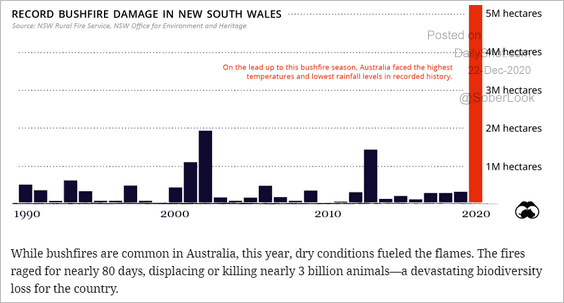 Source: Visual Capitalist Read full article
China
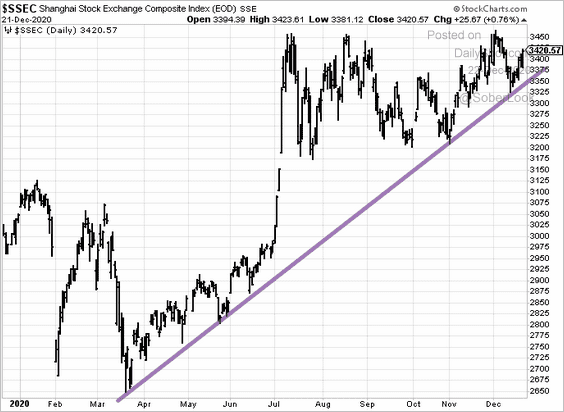
1. The Shanghai Composite is holding support.
2. The pace of business growth has leveled off in December. Here is the World Economics SMI.
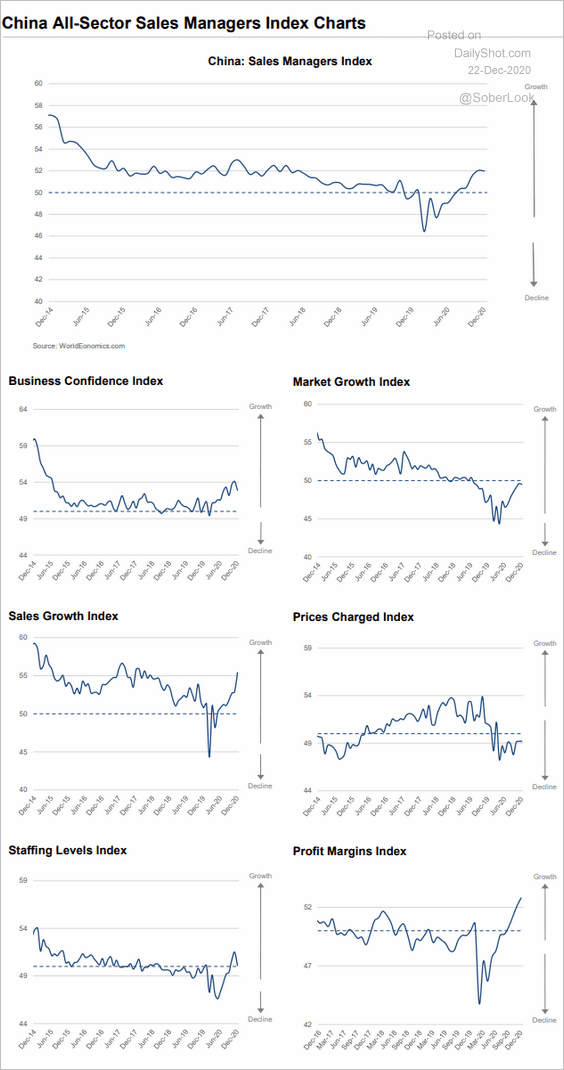 Source: World Economics
3. State ownership of smaller banks has been increasing.
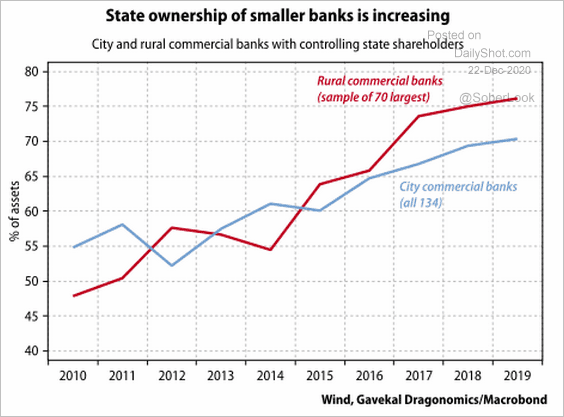 Source: Gavekal Research
Emerging Markets
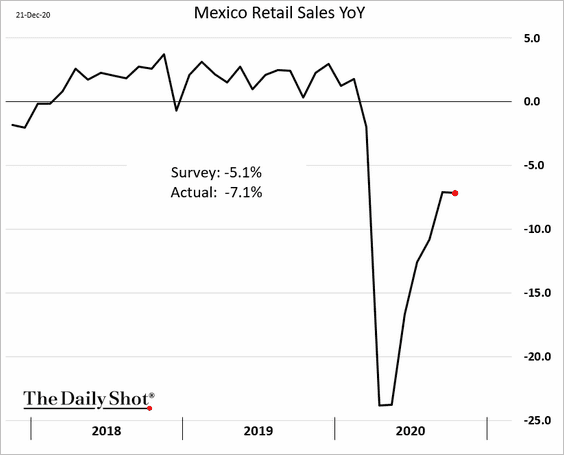
1. The rebound in Mexico’s retail sales stalled in October.
Separately, Mexico’s key fiscal risk in 2021 will be dealing with Pemex credit issues and its oil production targets (according to Barclays Research).
Reuters: – … a combination of declining output, crushing tax obligations and a hefty payroll burden have gradually weakened [Pemex], which is a major source of federal budget revenues.
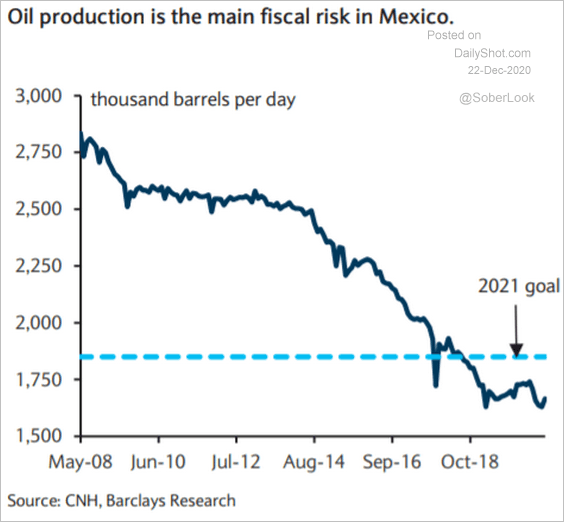 Source: Barclays Research
——————–
2. Latin American currencies have a lot of room to catch-up to EM peers.
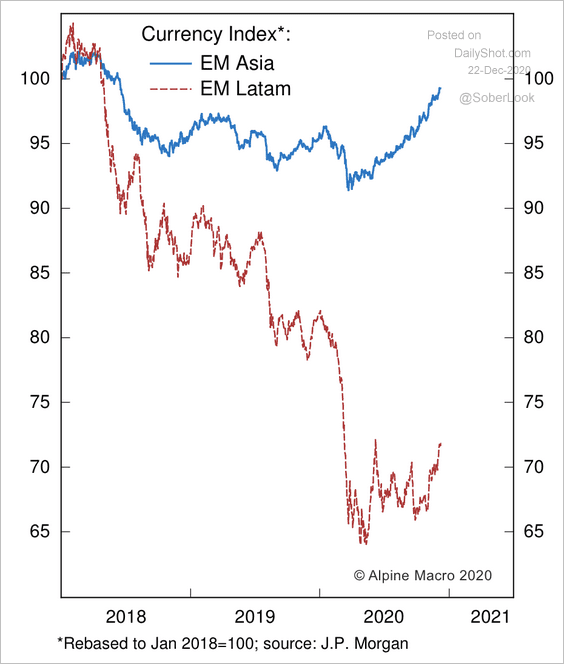 Source: Alpine Macro
3. The rally in EM stocks and currencies is not yet extreme.
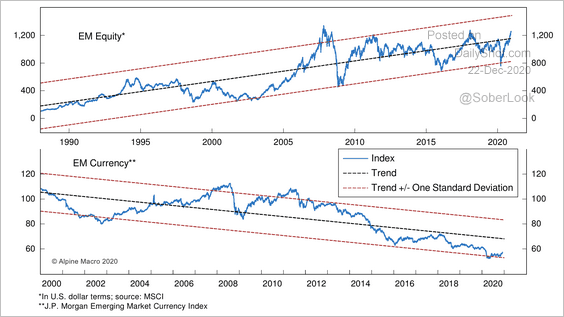 Source: Alpine Macro
4. Investors are upbeat on EM assets.
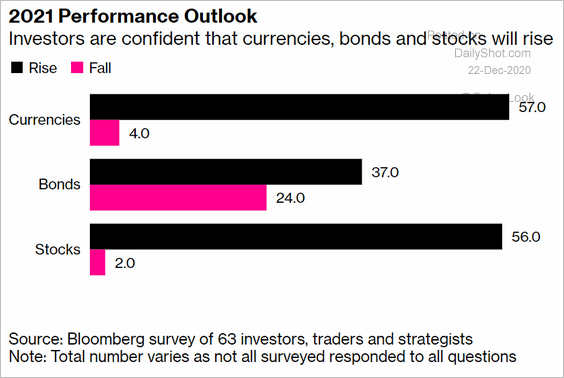 Source: @markets Read full article
5. This scatterplot shows the changes in industrial production vs. retail sales.
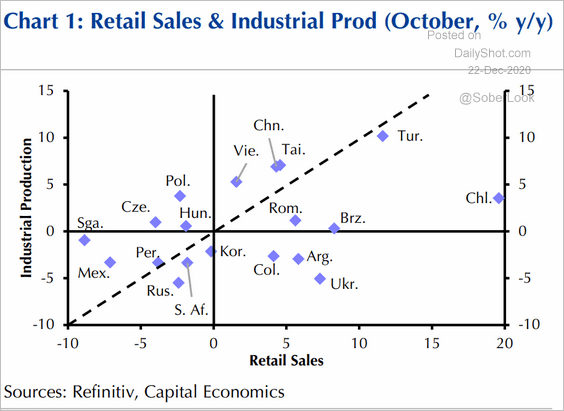 Source: Capital Economics
6. The proportion of euro-denominated sovereign bonds has risen this year.
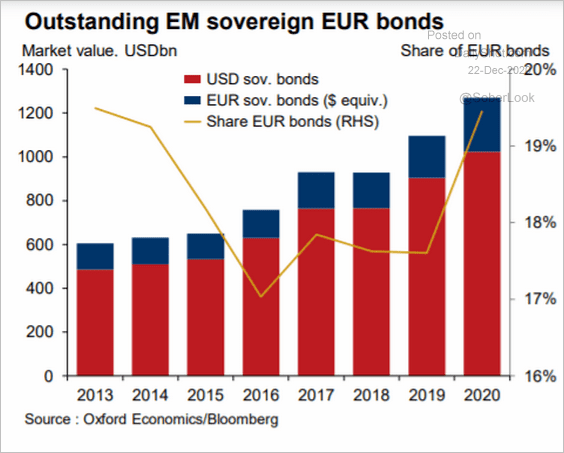 Source: Oxford Economics
Cryptocurrencies
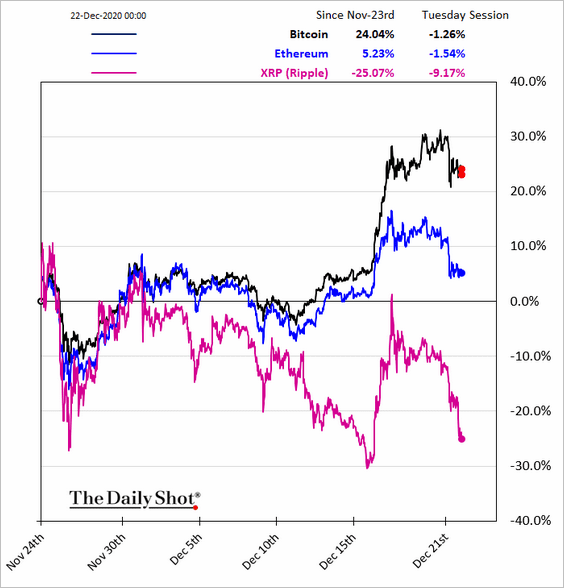
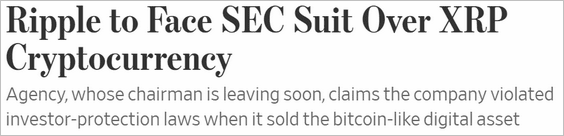
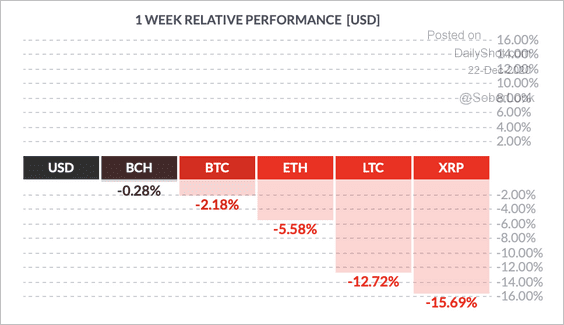
Cryptos pulled back from the highs, with Bitcoin continuing to trade as a risk asset (rather than “safe-haven”). Ripple’s XRP sold off on a pending SEC lawsuit.
 Source: @WSJ Read full article
 Source: CoinDesk
Commodities
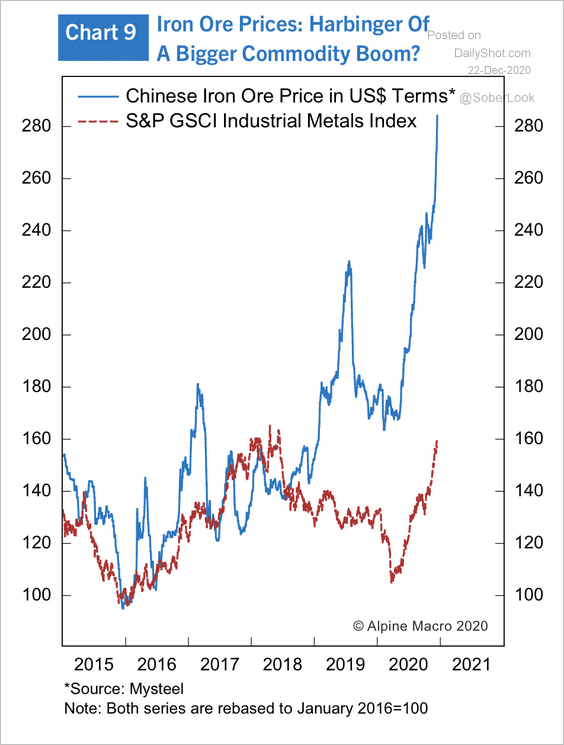
1. Chinese iron ore prices have sharply diverged from the broader industrial metals index.
 Source: Alpine Macro
China accounts for about 70% of global iron ore imports. Strong demand has fueled a rally in iron ore prices this year (exacerbated by the Vale accident).
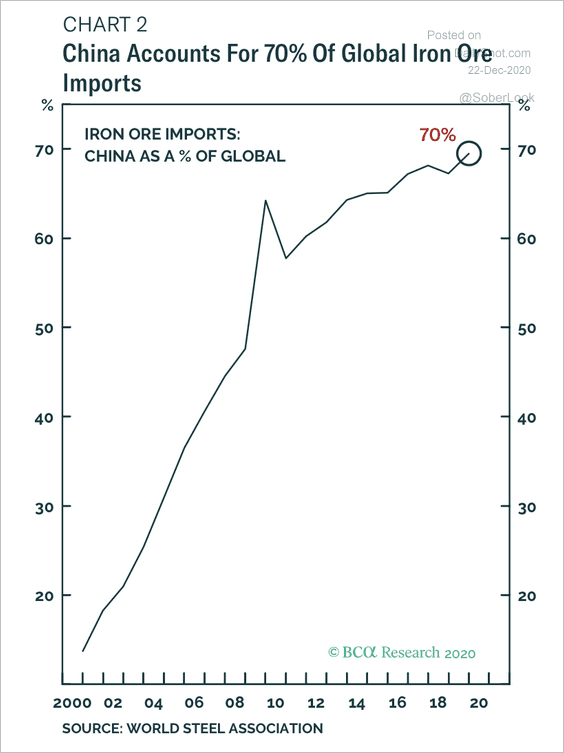 Source: BCA Research
Major iron ore producers are set to increase output next year.
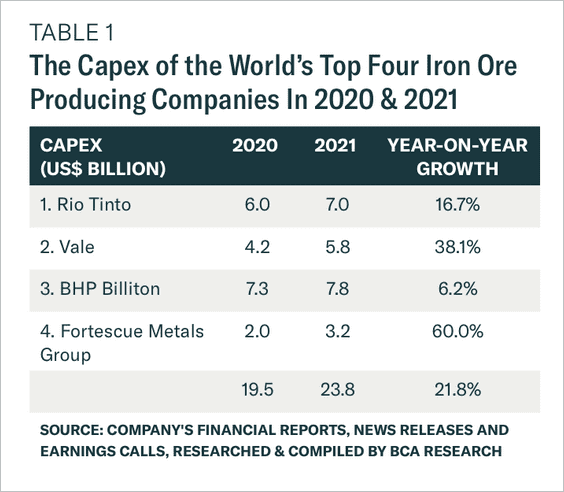 Source: BCA Research
——————–
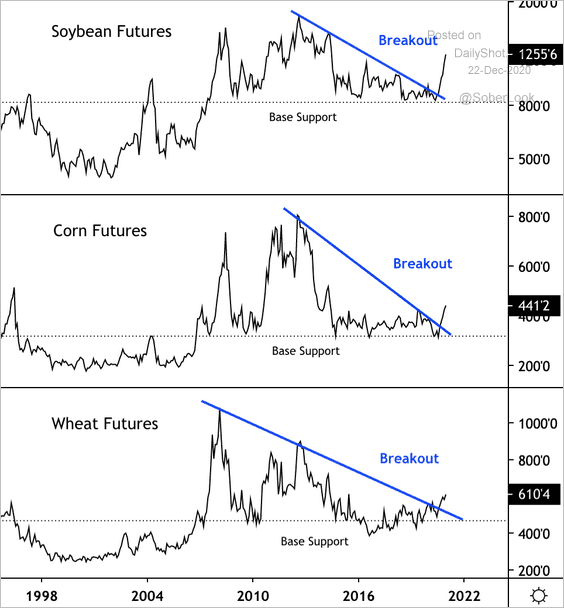
2. The rally in grain futures could just be getting started.
 Source: @DantesOutlook
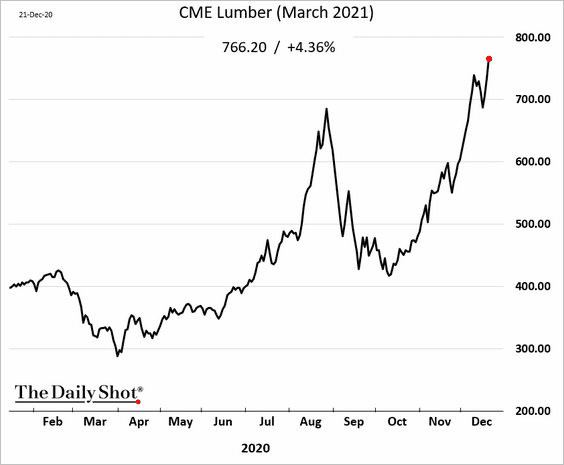
3. March CME lumber futures hit a new high.
 Source: Forbes Read full article
——————–
4. Brent crude held support at $50/bbl.
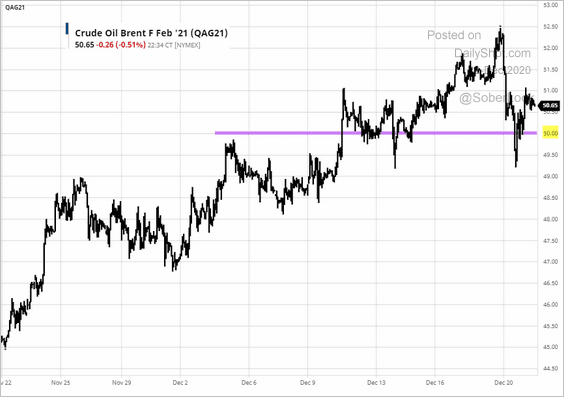 Source: barchart.com
Equities
1. Historically, the last ten trading days of the year have been positive for the S&P 500.
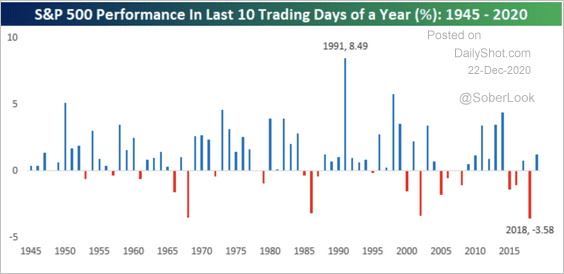 Source: Bespoke Investment Group
2. The rapid rebound in China’s economic activity was helpful for the stock market this year.
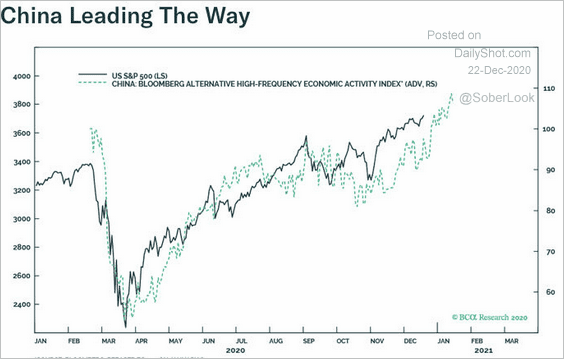 Source: Anastasios Avgeriou, BCA Research
3. How does the stock market respond to rising Treasury yields?
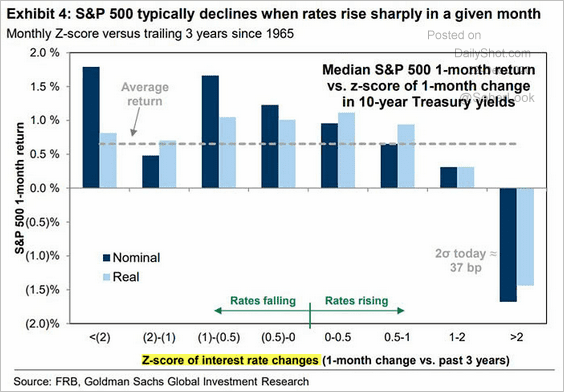 Source: @ISABELNET_SA, @GoldmanSachs
4. Fund managers’ risk appetite is the highest since January of 2018 (after the US tax cut).
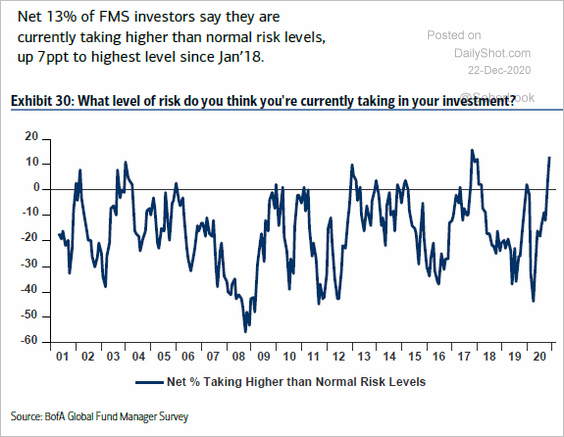 Source: BofA Global Research
5. Assets that perform well during periods of inflation have been attracting a great deal of interest …
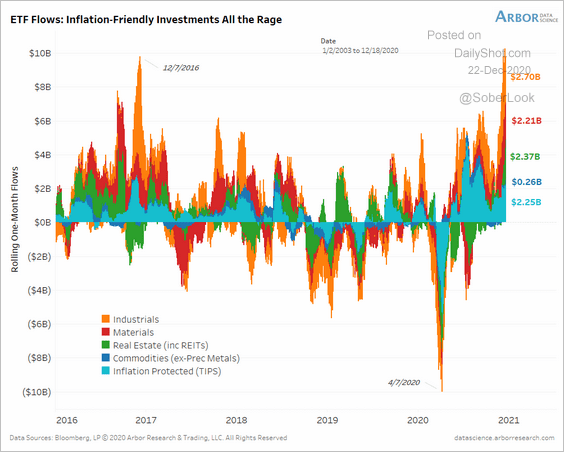 Source: Arbor Research & Trading
… and outperforming.
——————–
6. Here is the composition of the S&P 500 index split into growth, stability, and defense vs. cyclicals (going back to 1925).
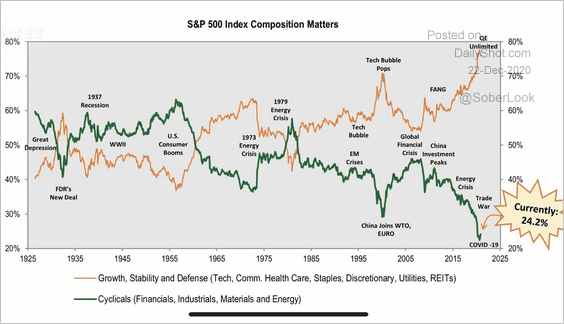 Source: @MichaelKantro
7. Is the Nasdaq Composite following the 1990s pattern? If so, the rally has room to run.
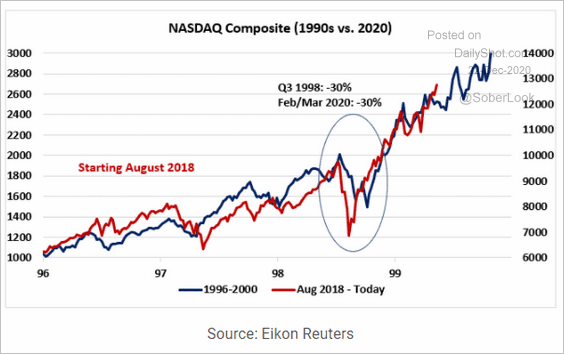 Source: Rothko Research
8. Total equity sales have been impressive this year.
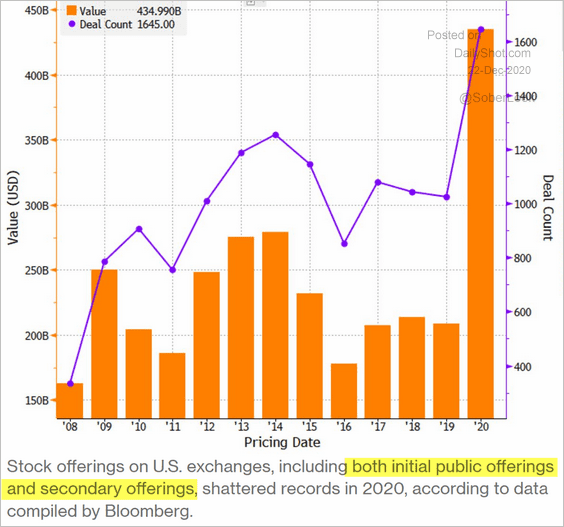 Source: @markets Read full article
There were some large IPO deals.
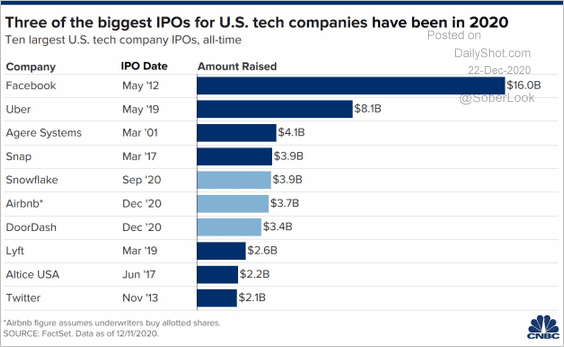 Source: CNBC Read full article
At-the-market offerings hit a record high.
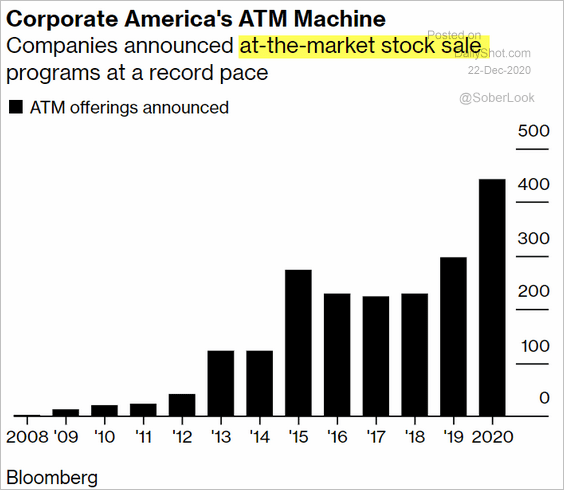 Source: @markets Read full article
——————–
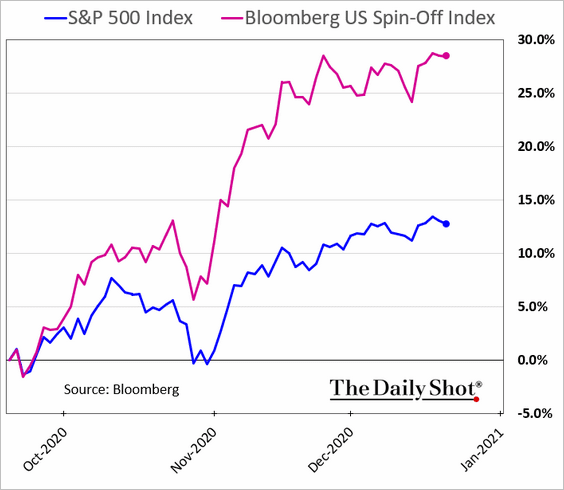
9. Bloomberg’s spin-off index, which tracks large firms spun-off in recent years, has been outperforming.
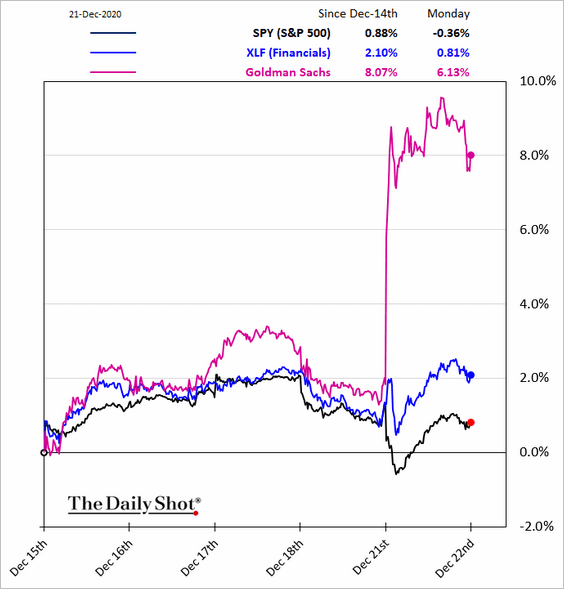
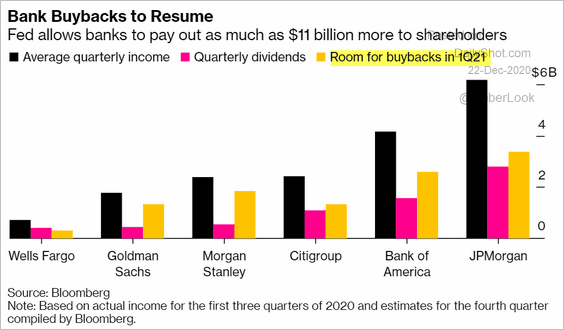
10. Banks performed well on Monday.
 Source: Barron’s Read full article
 Source: @markets Read full article
Credit
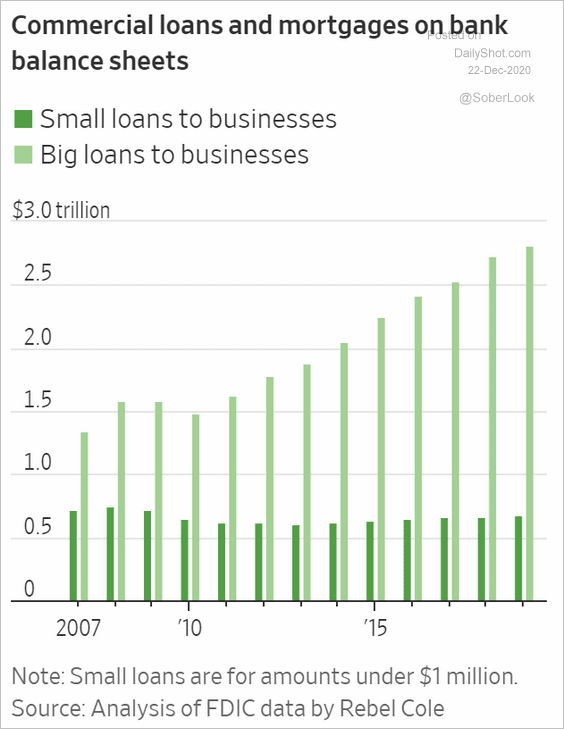
1. Bank lending to US small firms has been lagging this year.
 Source: @WSJ Read full article
2. Here is the 2020 corporate debt overhang in the US and Europe.
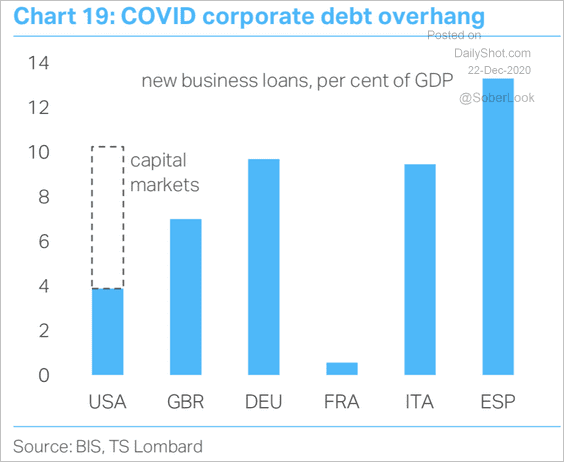 Source: TS Lombard
3. Green bonds have been outperforming.
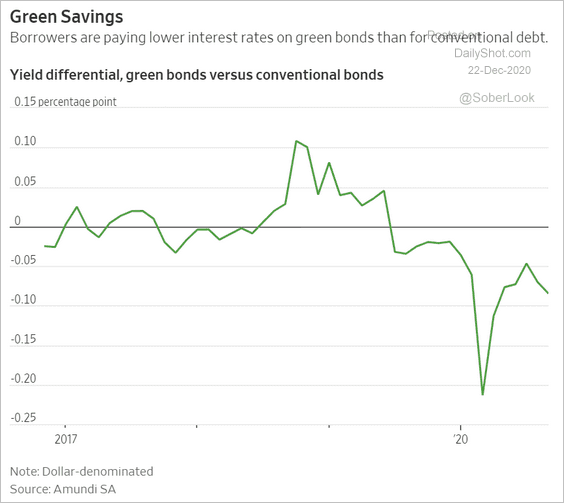 Source: @WSJ Read full article
The overall sustainable debt issuance hit a new record.
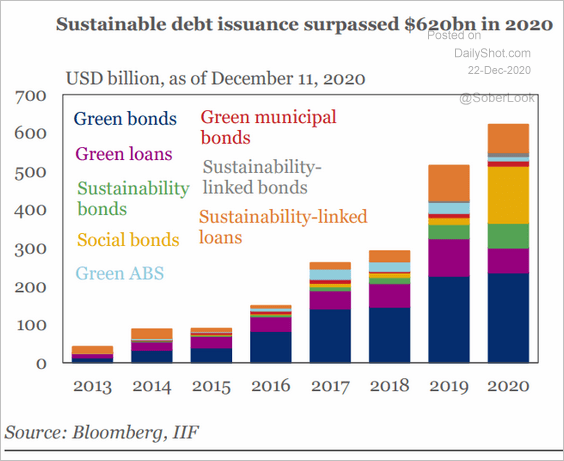 Source: IIF
——————–
4. This infographic shows the size and trading volumes of the largest US structured credit markets.
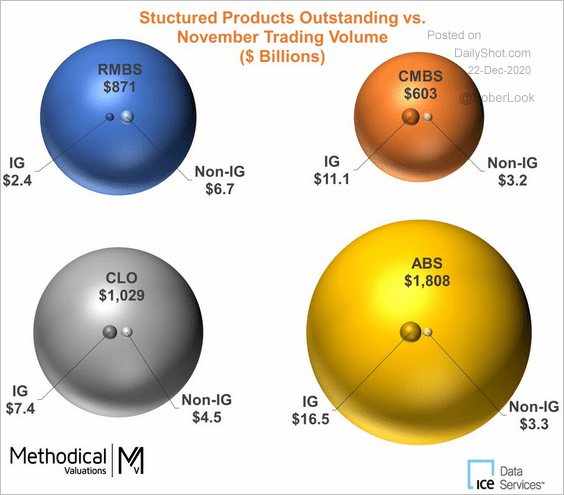 Source: Methodical Valuation and Advisory, ICE Data Services, FINRA
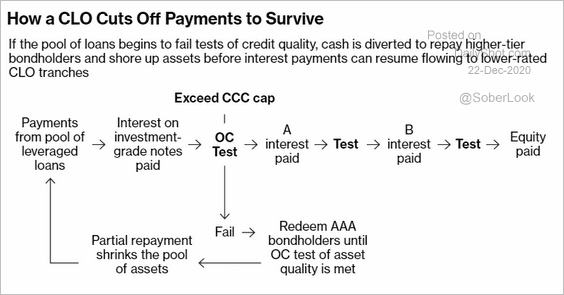
5. Finally, here is an illustration of how CLOs cut off payments and delever when their portfolio CCC holdings exceed the maximum allowed amount (due to downgrades).
 Source: @markets Read full article
Rates
1. The Treasury curve has been steepening.
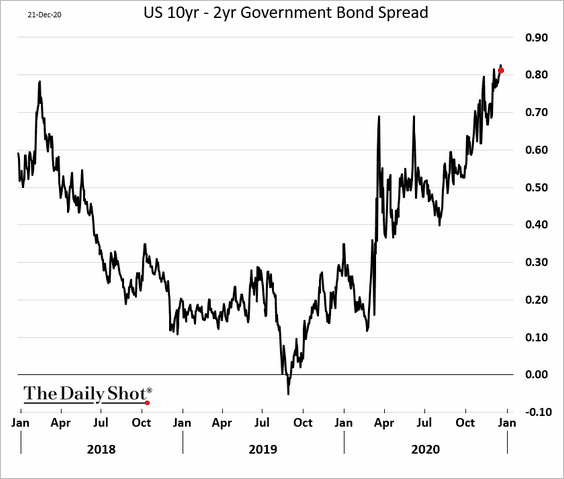
And steepening trends tend to last a while.
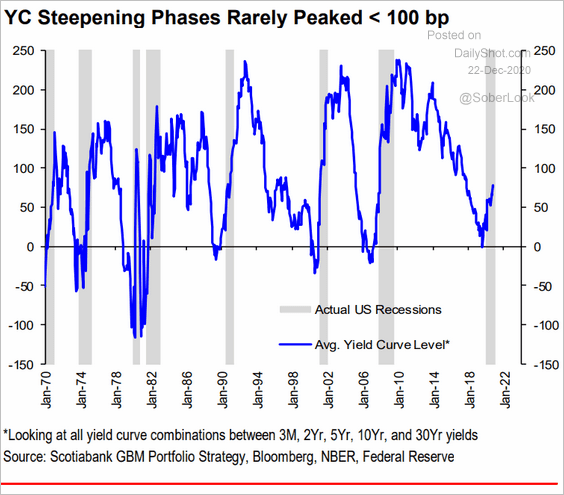 Source: Hugo Ste-Marie, Portfolio & Quantitative Strategy Global Equity Research, Scotia Capital
——————–
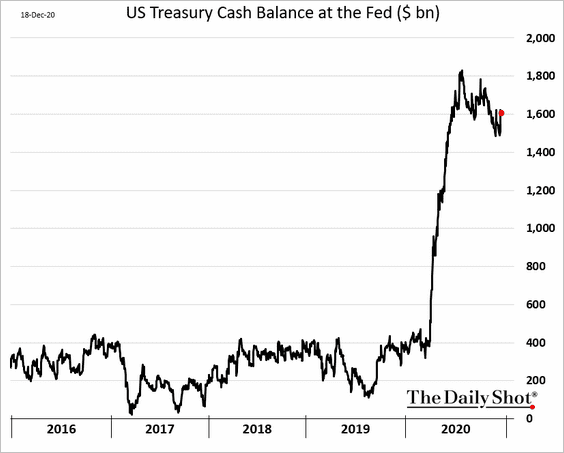
2. The US Treasury is holding $1.6 trillion at the Fed. As it spends a portion of this capital on the new $900 billion stimulus package, liquidity in the private sector will rise, boosting demand for short-term rate assets. Will we see negative T-bill rates again?
3. The Fed has room to buy more TIPS, which would push real rates deeper into negative territory (a positive for gold).
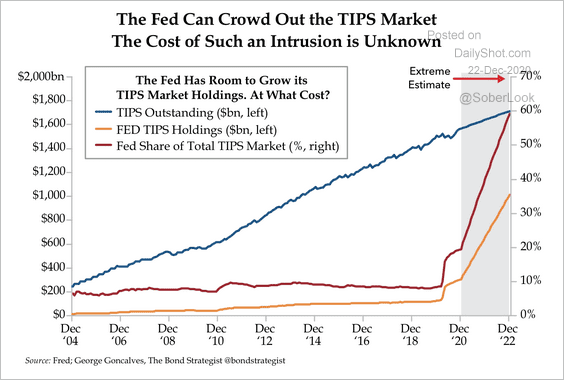 Source: Quill Intelligence
4. Options on inflation swaps are pricing in a higher probability of the US headline CPI exceeding 2.5%.
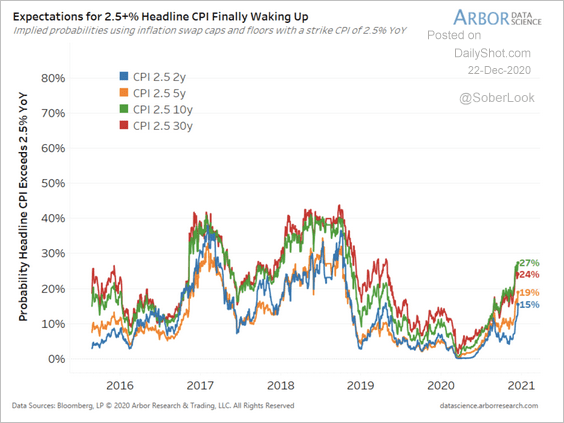 Source: Arbor Research & Trading
Global Developments
1. The dollar is significantly below its 200-day moving average. Will we see a rebound?
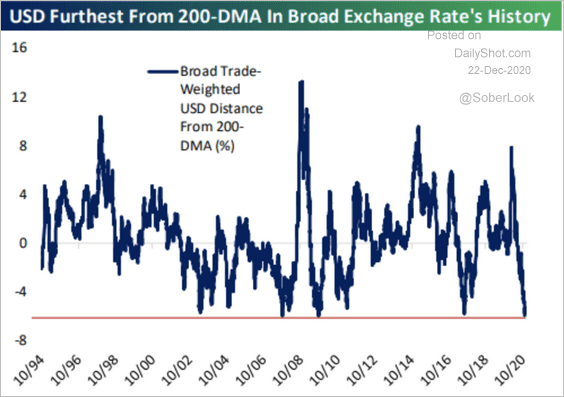 Source: Bespoke Investment Group
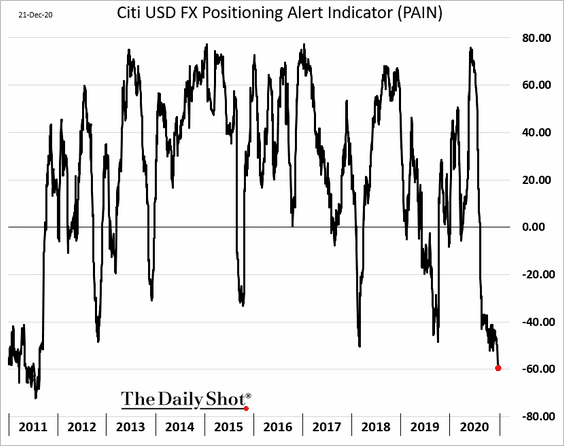
The short-dollar trade looks stretched based on the Citi positioning indicator (tracking active F/X traders).
This has been one of only four years when the dollar has made a two-year high and a two-year low in the same year.
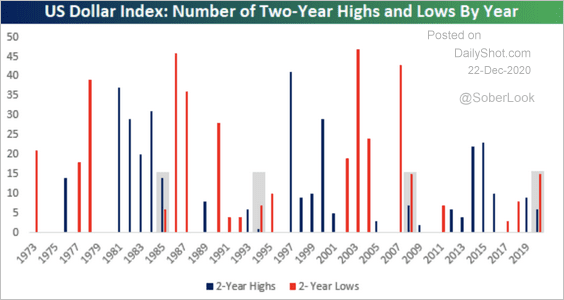 Source: Bespoke Investment Group
——————–
2. The BoJ has lagged other central banks this year in growing its balance sheet (the BoJ’s balance sheet is still larger based on assets-to-GDP).
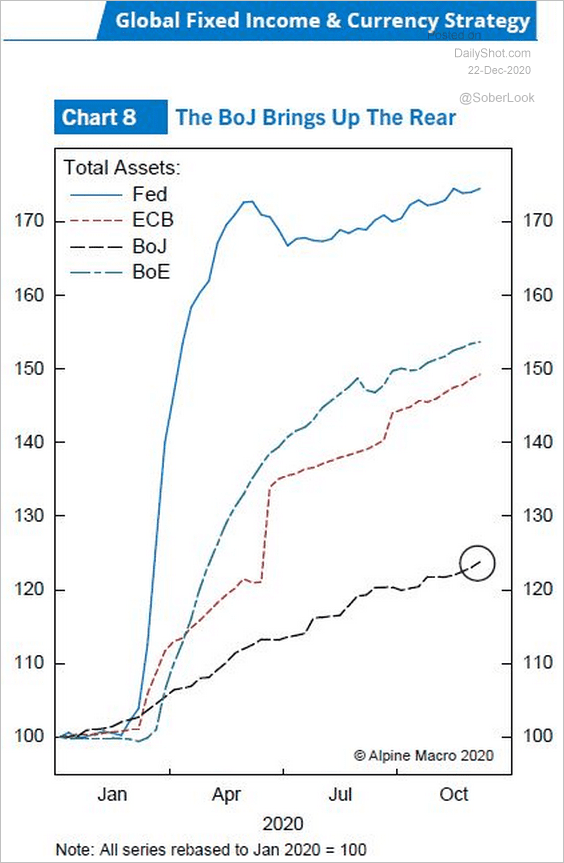 Source: Harvinder Kalirai, Alpine Macro
3. This table shows a comparison of debt levels across select countries.
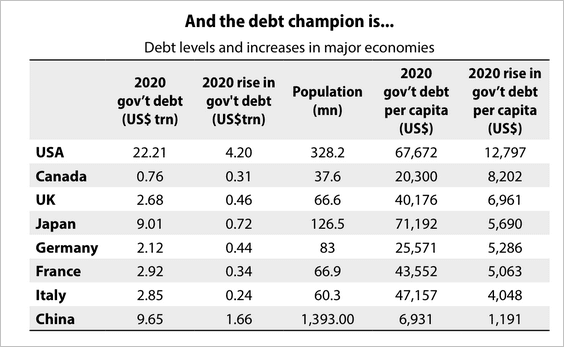 Source: Gavekal Research
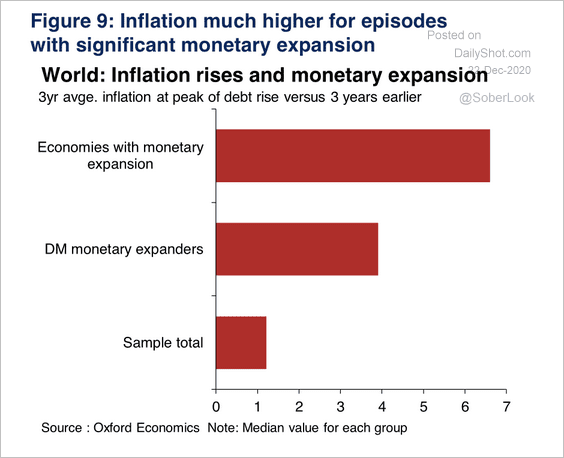
4. Here is a look at inflation outcomes during previous debt build-ups …
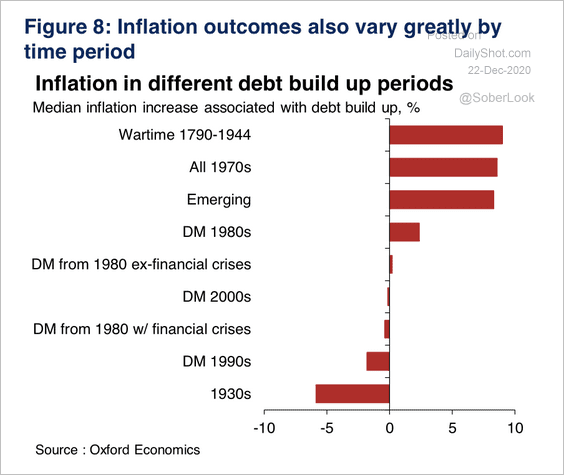 Source: Oxford Economics
… and during monetary expansion.
 Source: Oxford Economics
——————–
5. Economists are forecasting robust growth over the next two years.
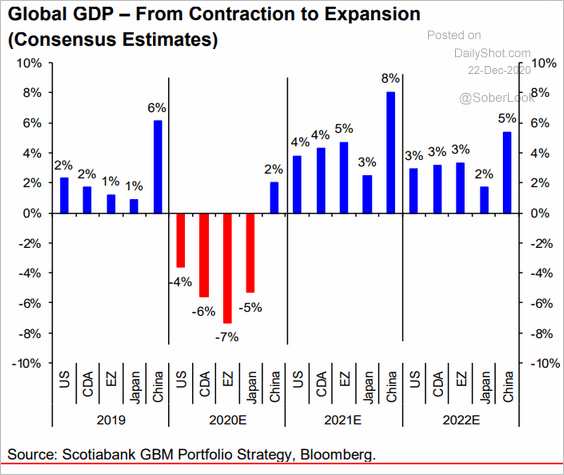 Source: Hugo Ste-Marie, Portfolio & Quantitative Strategy Global Equity Research, Scotia Capital
6. Flows into ESG funds hit a record this year.
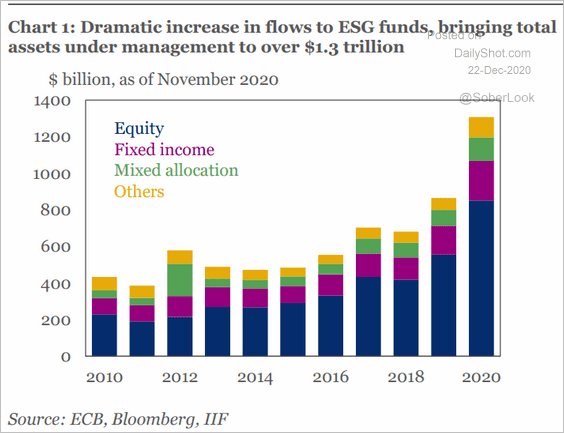 Source: IIF
——————–
Food for Thought
1. Cigarette smuggling vs. cigarette excise tax rates:
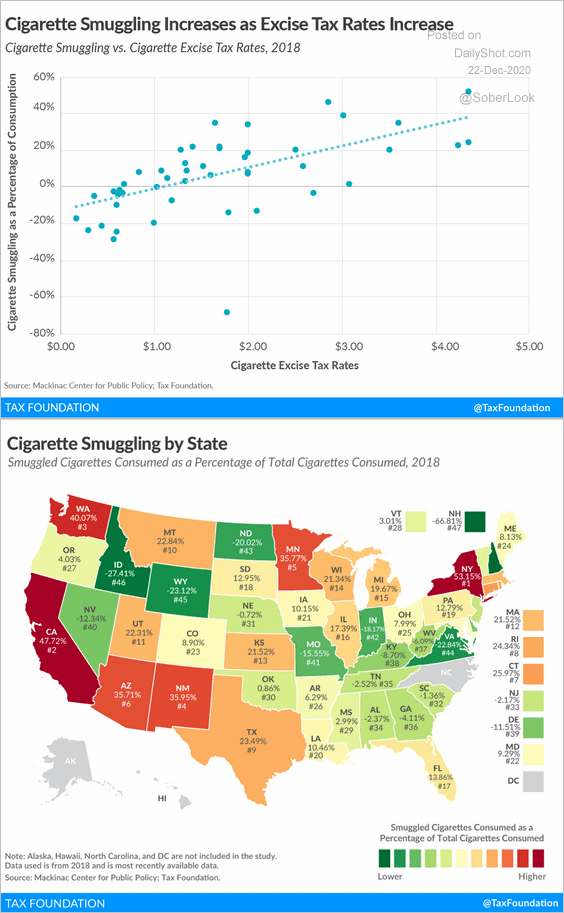 Source: Tax Foundation
2. US tax revenues as a share of the GDP:
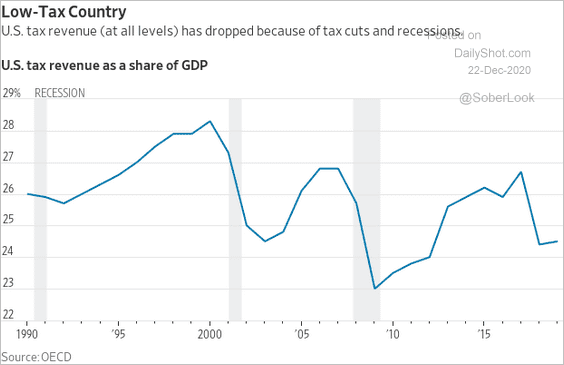 Source: @RichardRubinDC
3. Electric vehicle companies’ market value and valuations:
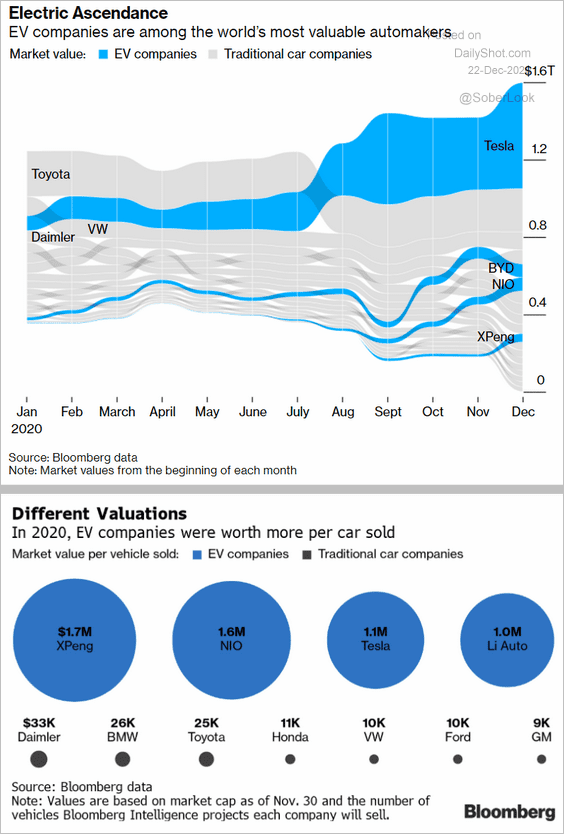 Source: @business, Craig Trudell Read full article
4. Working longer hours from home:
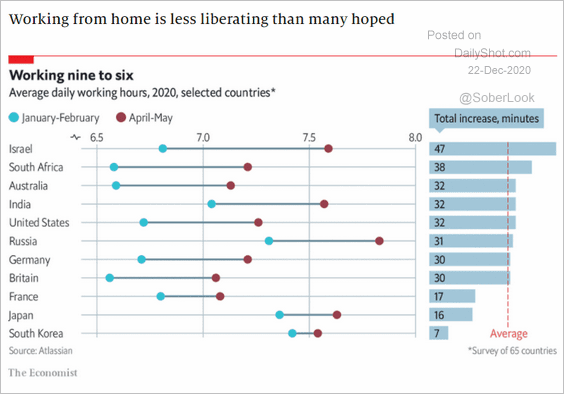 Source: The Economist Read full article
5. Democratic vote share vs. population density:
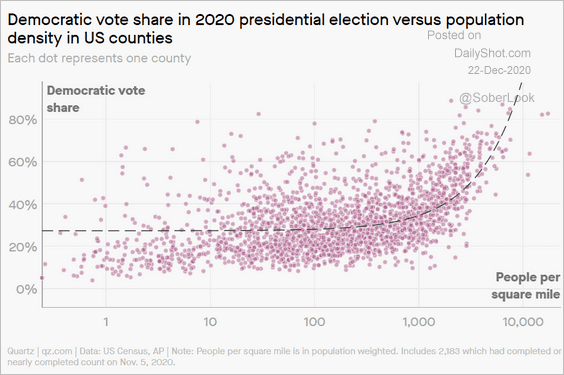 Source: QZ Read full article
6. Greenhouse gas emissions by sector:
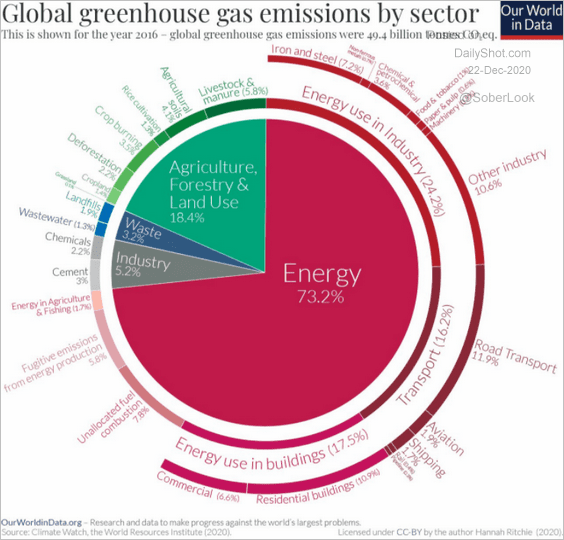 Source: Our World In Data Read full article
7. “Die Hard” is a Christmas movie.
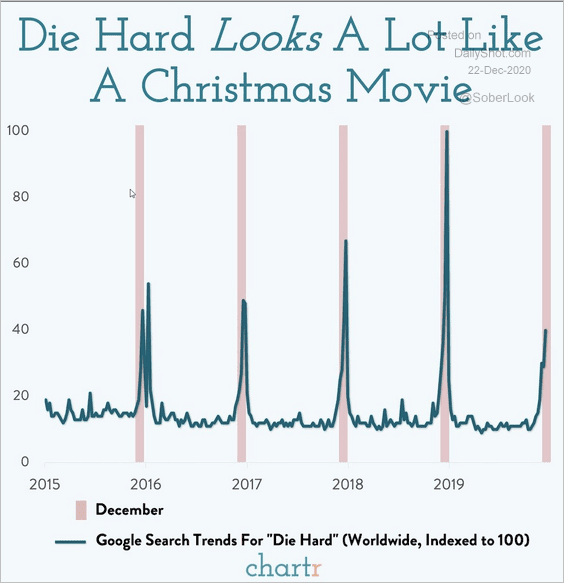 Source: @chartrdaily
8. Wrapping presents:
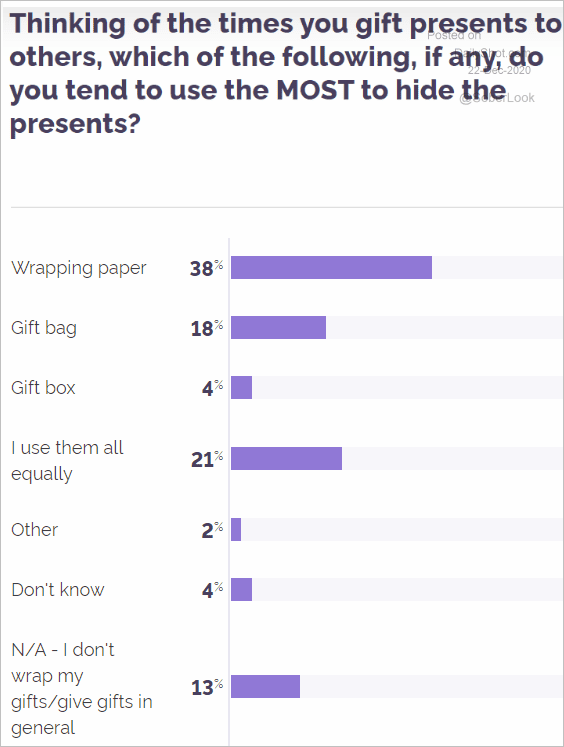 Source: @YouGovAmerica Read full article
9. Opening presents:
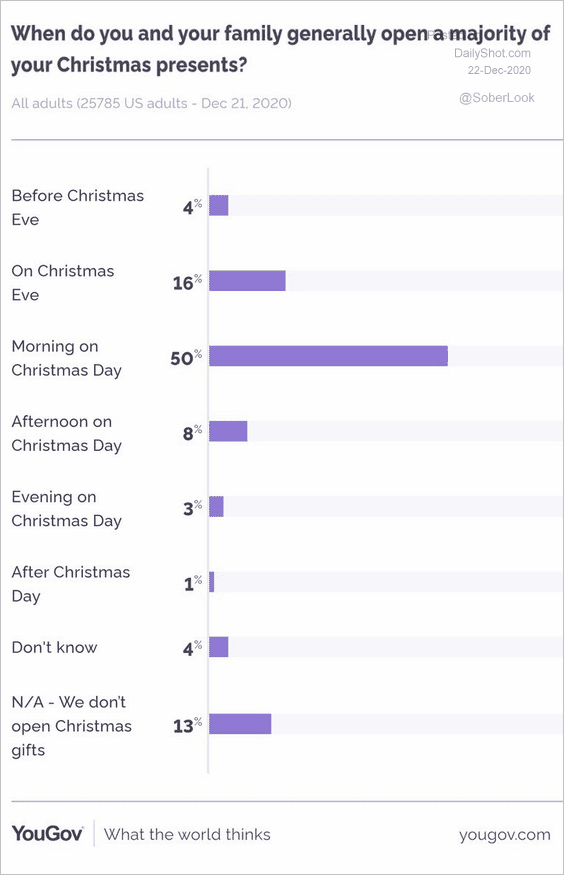 Source: @YouGovAmerica
10. The worst Christmas presents:
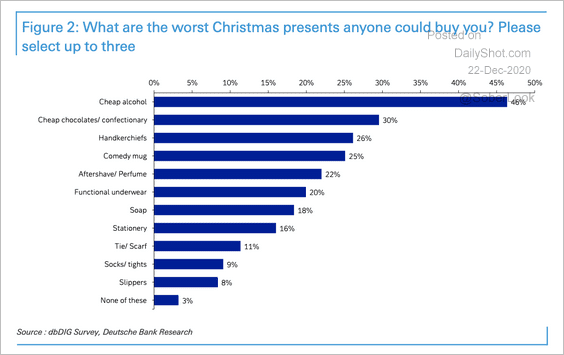 Source: Deutsche Bank Research
——————–
As a reminder, The Daily Shot and Food for Thought will not be published from Thursday, December 24th through Friday, January 1st.