
The Daily Shot: 14-Jan-21
• The United States
• Canada
• The United Kingdom
• The Eurozone
• Europe
• Japan
• China
• Emerging Markets
• Cryptocurrency
• Commodities
• Equities
• Rates
• Global Developments
• Food for Thought
The United States
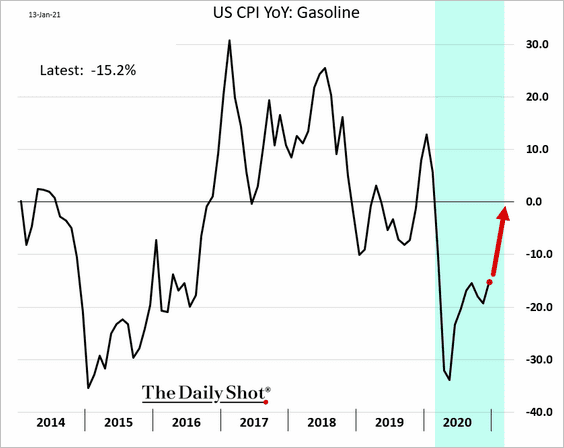
1. The headline CPI ticked higher in December, driven by gasoline prices.
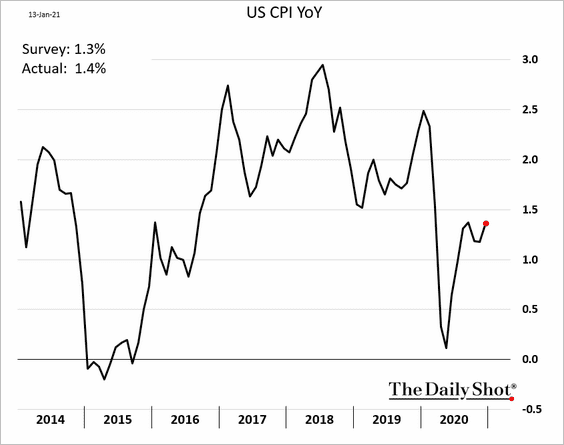
• Energy CPI (year-over-year) will rebound in the coming months due to base effects and higher prices.
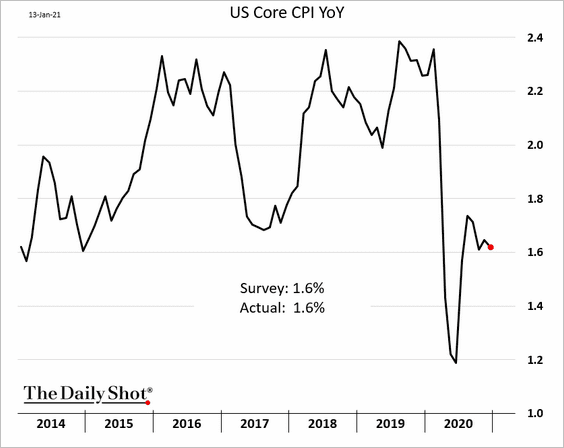
• Core inflation was in line with expectations.
• Shelter has been a drag on the core CPI, …
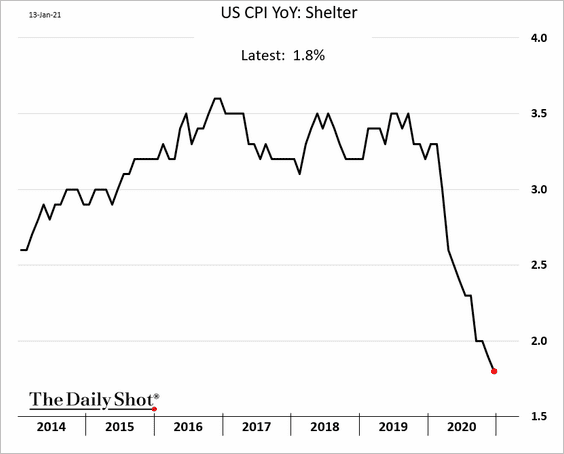
… but that may be changing in the months ahead (OER = owners’ equivalent rent).
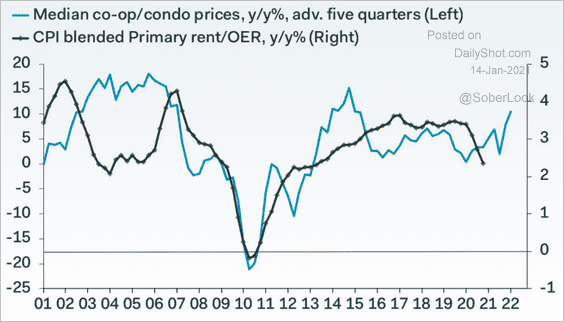 Source: Pantheon Macroeconomics
• Medical care inflation has also been pulling the core CPI lower (driven by the pandemic).
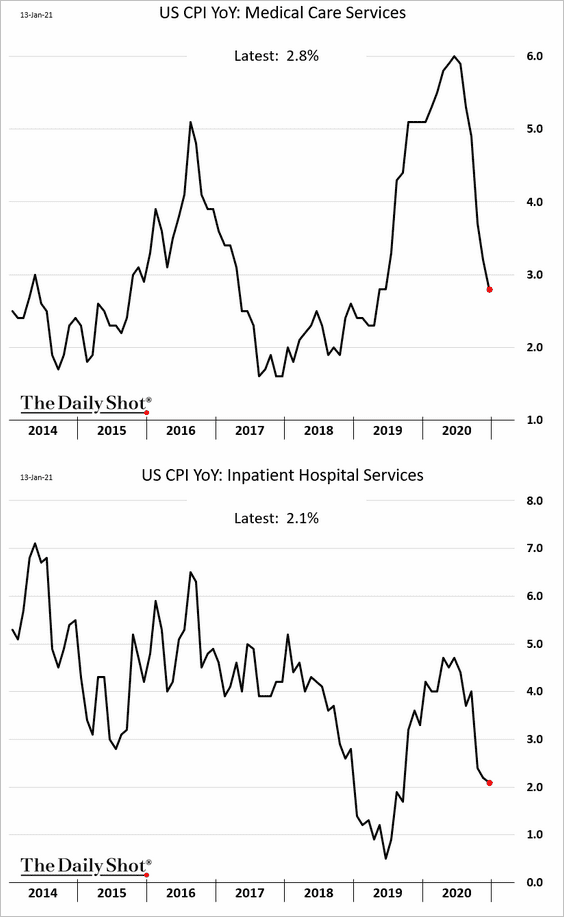
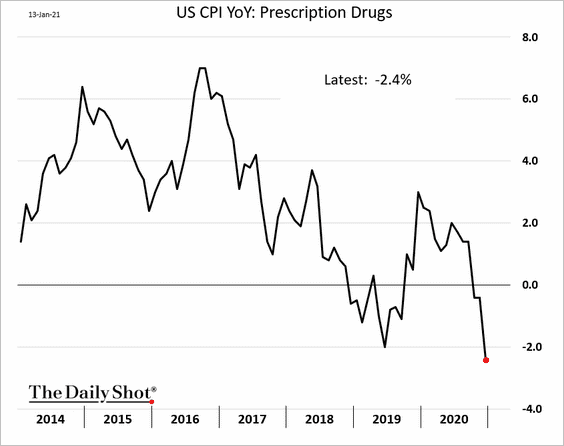
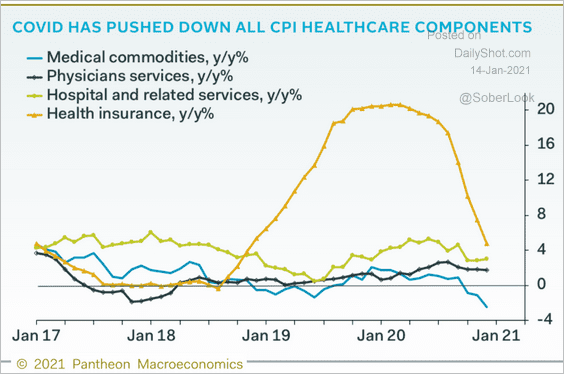 Source: Pantheon Macroeconomics
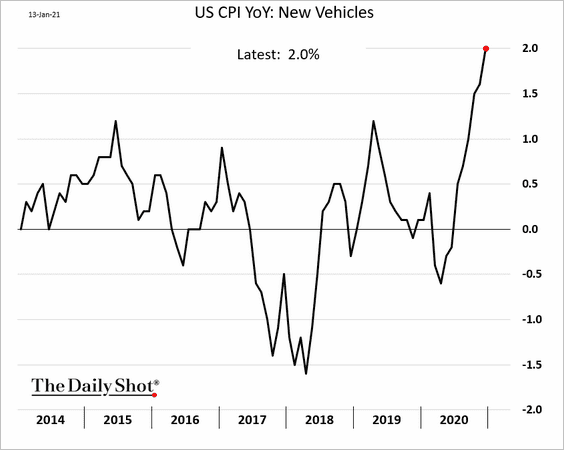
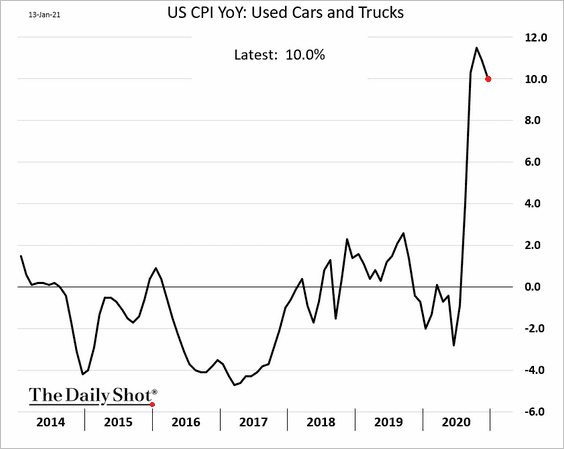
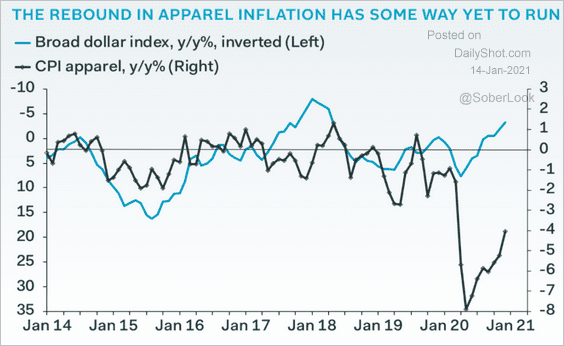
• Here are a few other CPI components.
– New and used vehicles:
– Apparel:
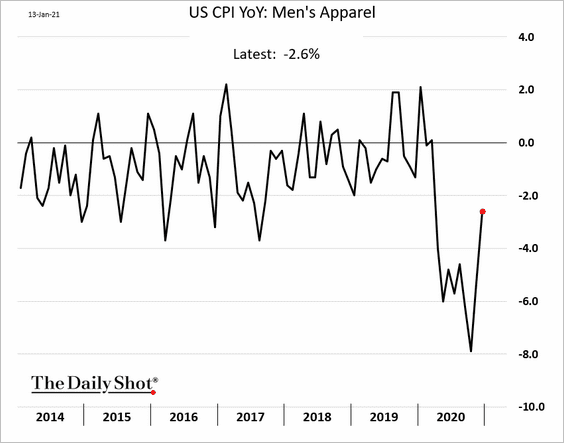
Note that the US dollar weakness should boost apparel prices further (most US apparel is imported).
 Source: Pantheon Macroeconomics
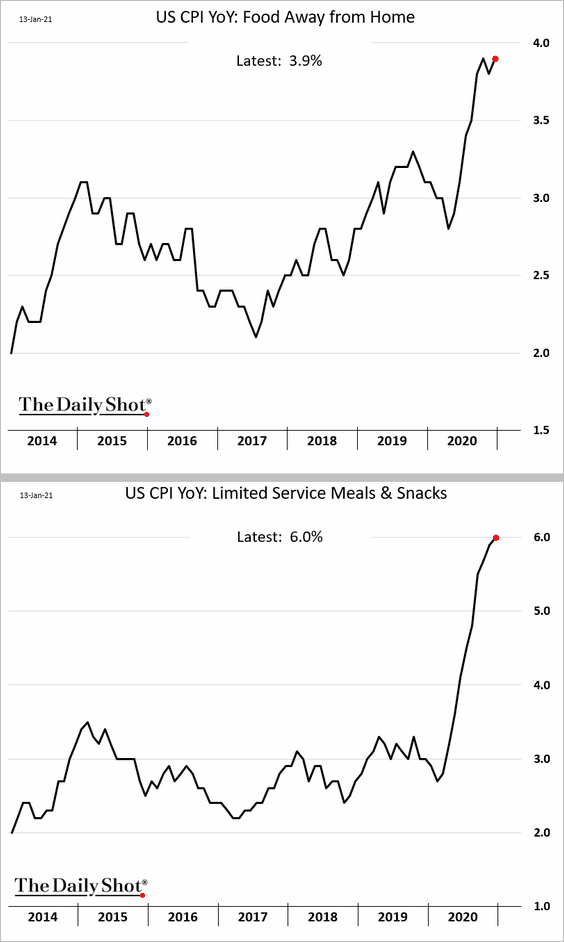
– Restaurants (the second chart shows fast-food inflation):
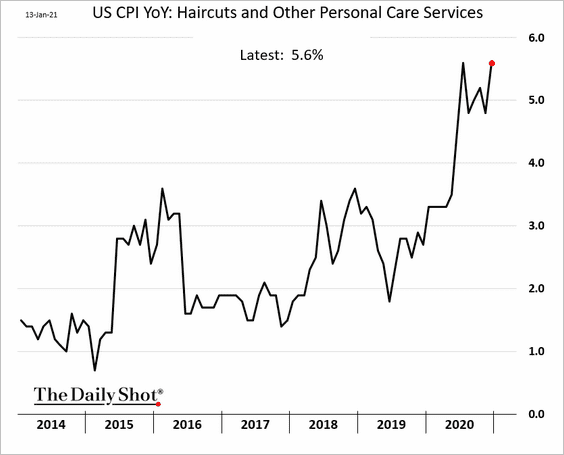
– Haircuts:
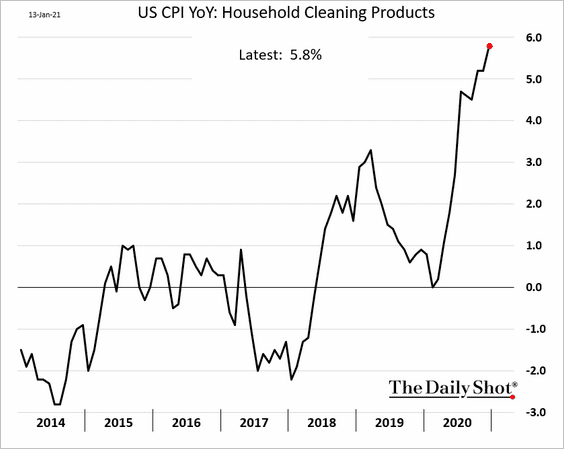
– Cleaning products:
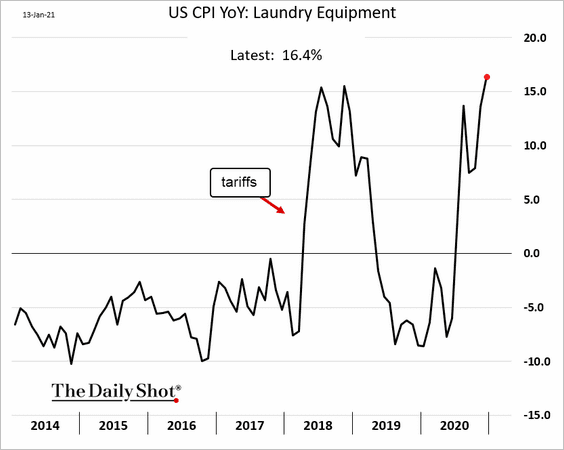
– Washing machines:
• The key pandemic-driven trend in inflation has been the divergence between commodities vs. services CPI.
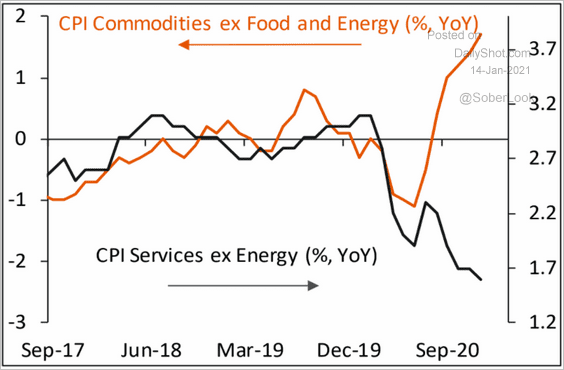 Source: Piper Sandler
——————–
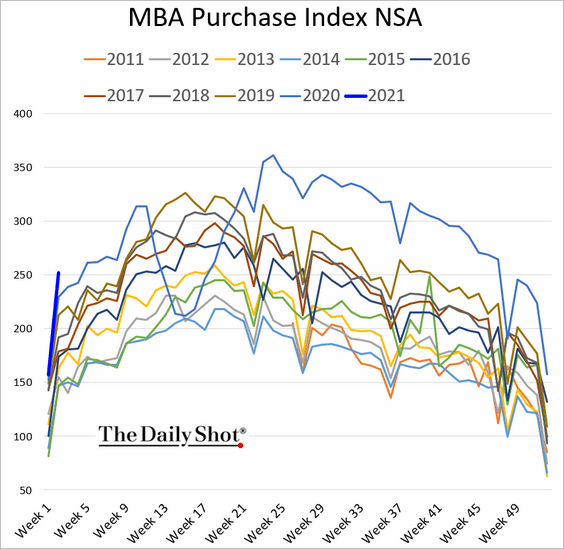
2. Mortgage applications to purchase a home started the year on a strong note.
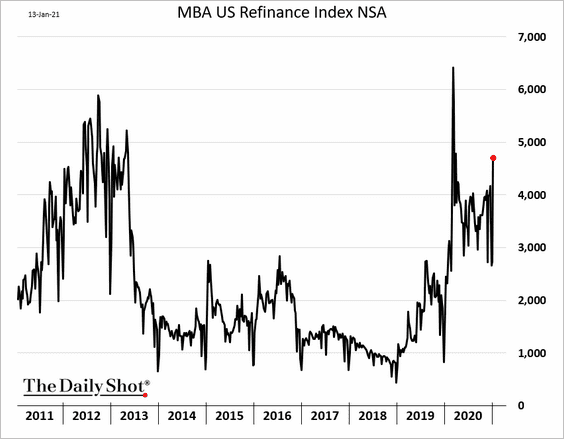
Refinancing activity is also robust.
——————–
3. Here is the distribution of unemployed workers by reason for unemployment.
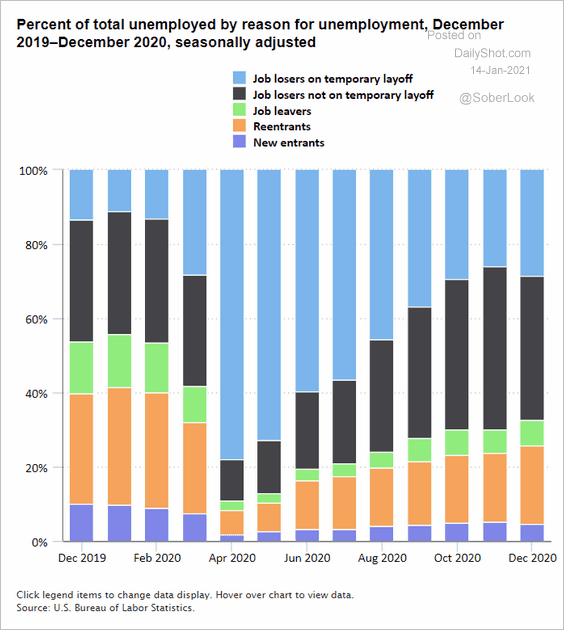 Source: @BLS_gov Read full article
4. US household net worth spiked last year as home prices and stocks soared.
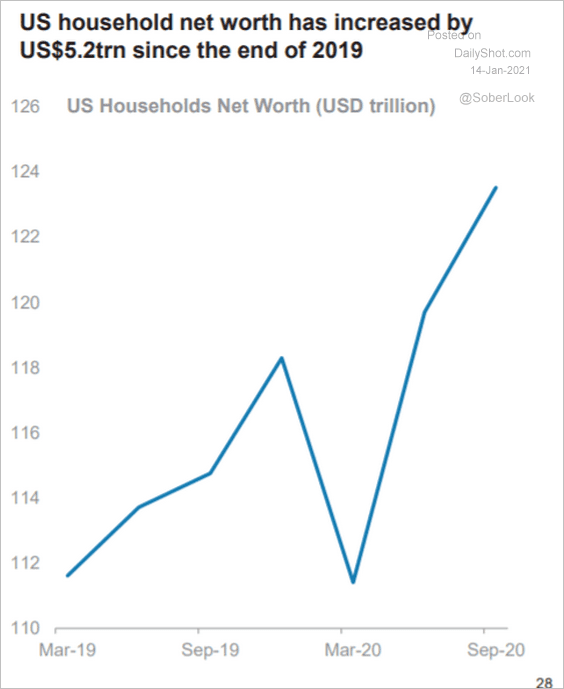 Source: Morgan Stanley Research
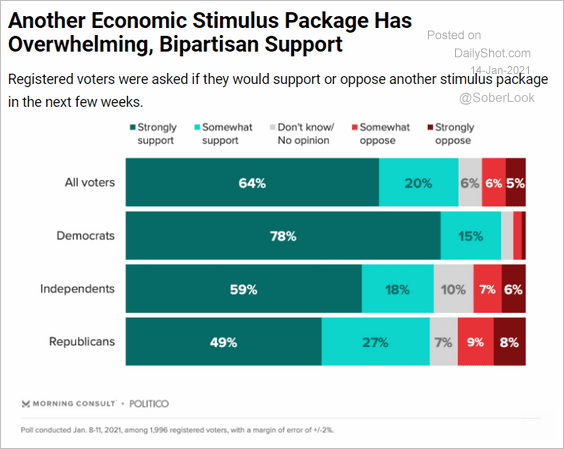
5. The 2021 budget deficit continues to widen, running well above the levels in previous years.
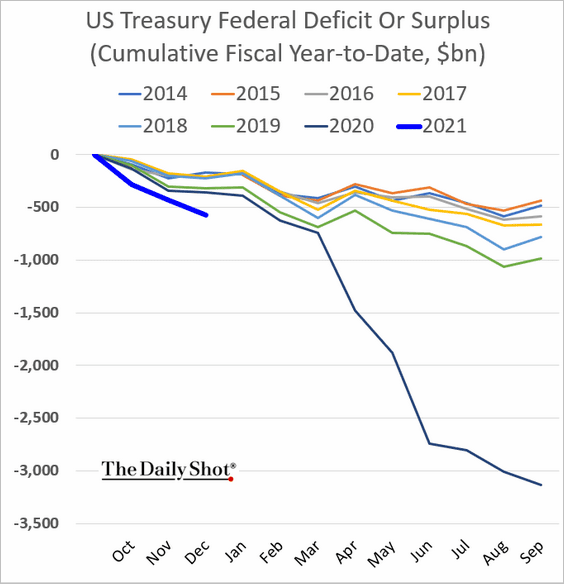
And there is much more spending to come …
 Source: Morning Consult
Entitlement spending is expected to continue higher.
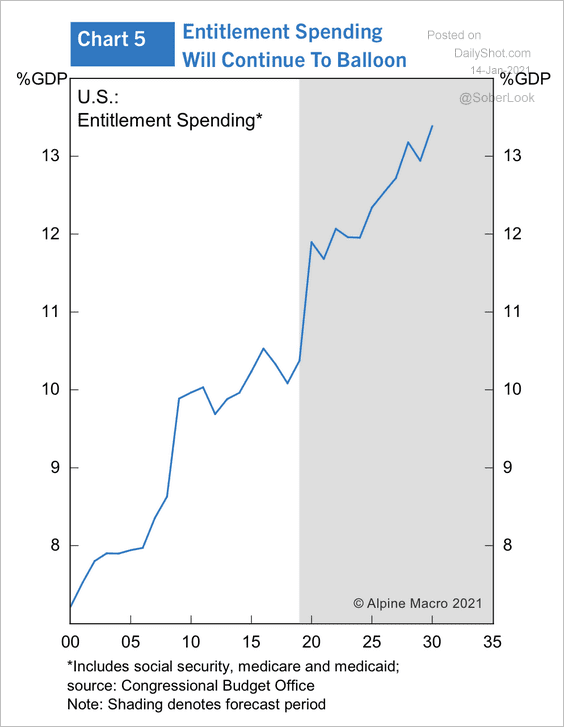 Source: Alpine Macro
——————–
6. Mobility in California is now back to its Apri low due to renewed lockdown measures.
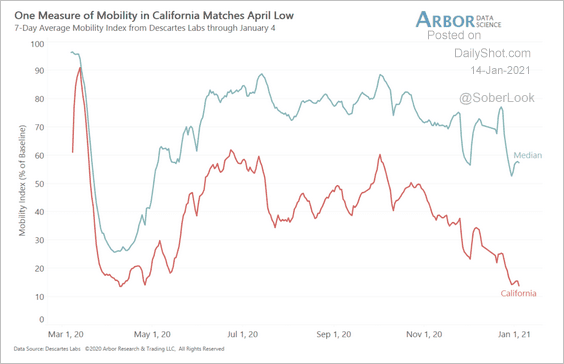 Source: Arbor Research & Trading
7. Finally, we have quarterly and annual GDP growth distributions.
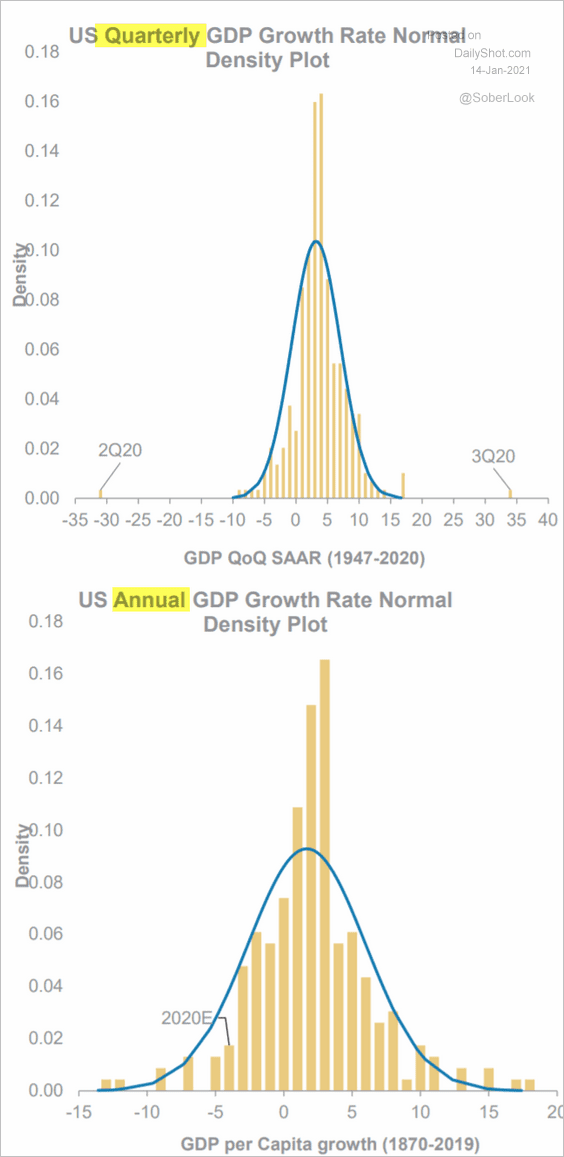 Source: Morgan Stanley Research
Back to Index
Canada
1. The Oxford Economics recovery tracker continues to trend lower, driven mostly by the health situation.
![]() Source: Oxford Economics
Source: Oxford Economics
2. Speculators are now net-long the Canadian dollar for the first time since early last year.
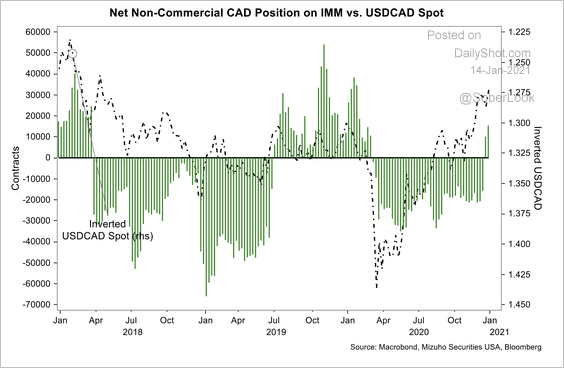 Source: Mizuho Securities USA
USD/CAD is holding long-term resistance.
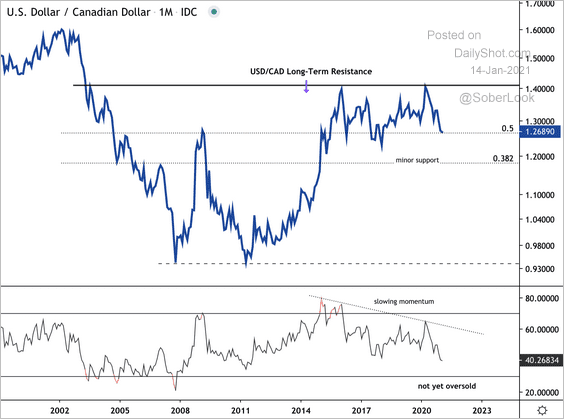 Source: Dantes Outlook
Back to Index
The United Kingdom
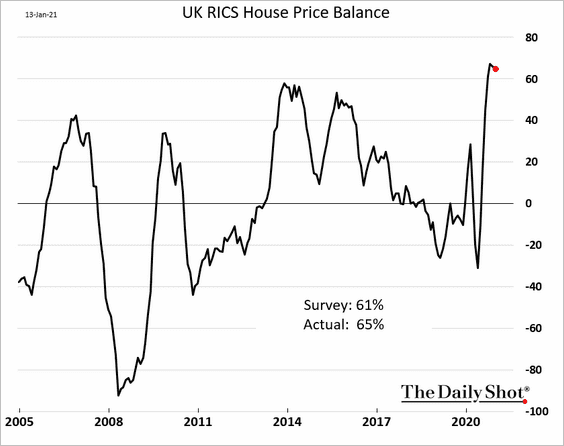
1. The housing market remains hot.
2. UK stocks started the year on a strong note.
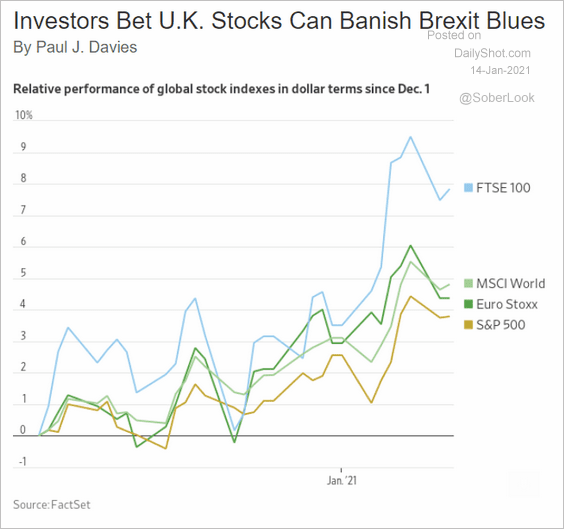 Source: @WSJ Read full article
3. Lockdowns appear to be working.
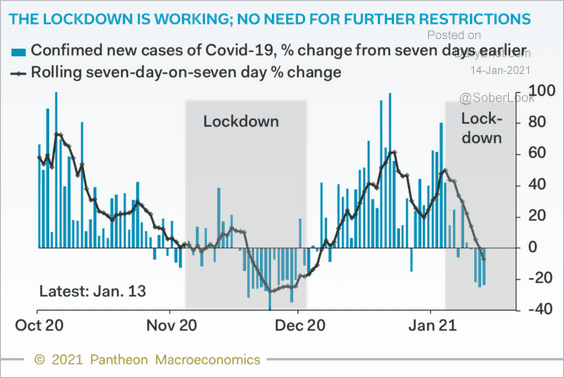 Source: Pantheon Macroeconomics
4. This chart shows the Oxford Street foot traffic (Europe’s busiest shopping street).
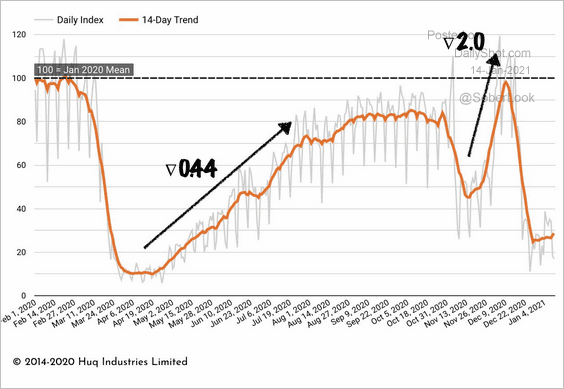 Source: Huq Read full article
5. How do UK hospitals compare to those in other European cities?
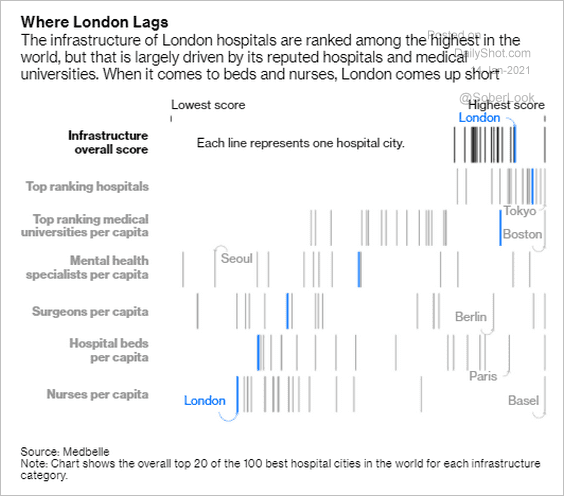 Source: @ThereseRaphael1, @bopinion Read full article
Back to Index
The Eurozone
1. Here we go again …
 Source: Reuters Read full article
The euro weakened in response to the news from Italy.
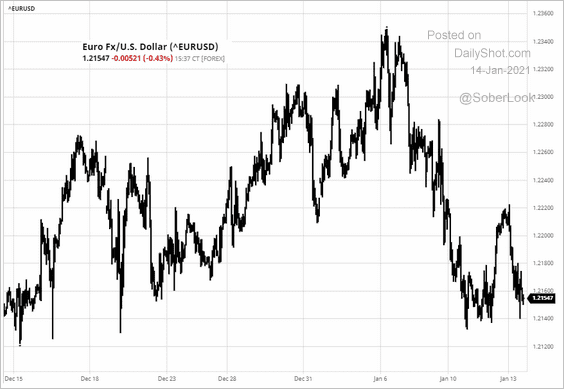 Source: barchart.com
——————–
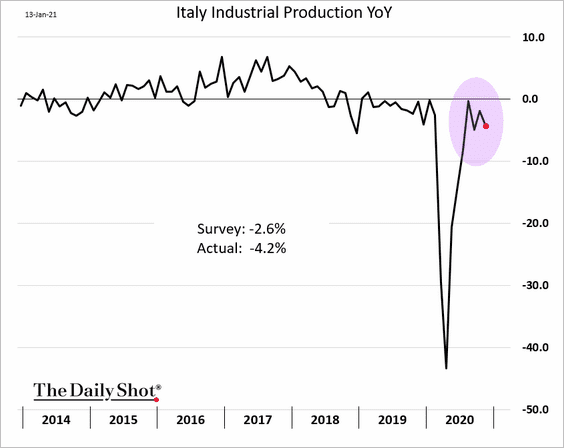
2. Italian industrial output deteriorated in November.
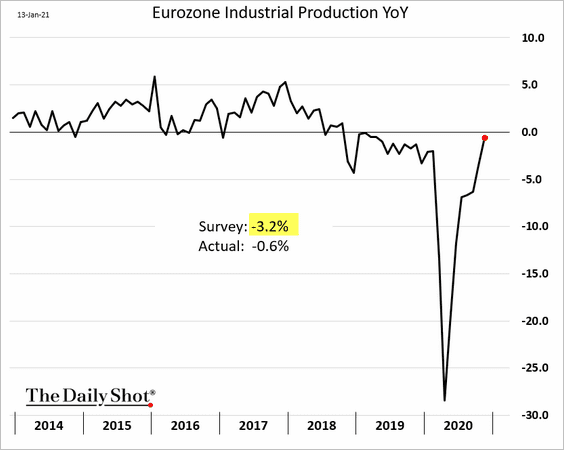
However, industrial production has almost recovered at the Eurozone level.
——————–
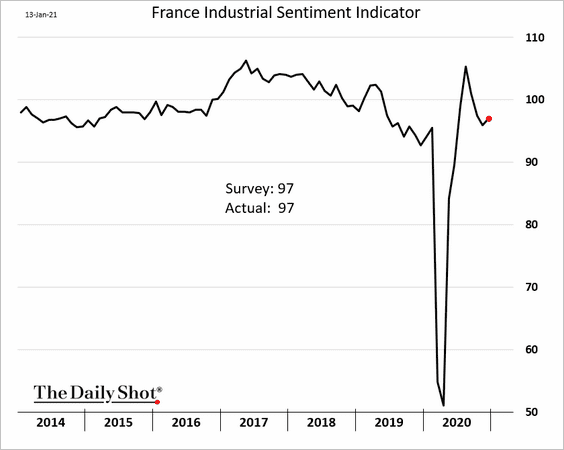
3. French industrial sentiment remains stable.
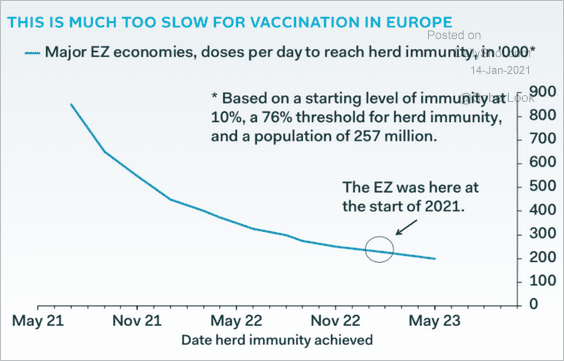
4. At the current rate of vaccinations, the Eurozone won’t reach herd immunity until 2023.
 Source: Pantheon Macroeconomics
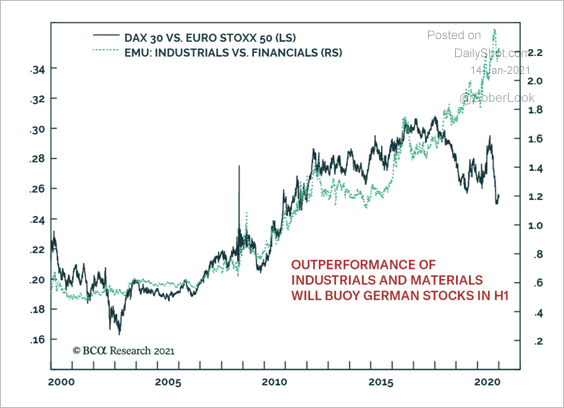
5. Industrials have outperformed financials over the past few years, which is typically a positive for the German DAX relative to the Stoxx 50 index.
 Source: BCA Research
Back to Index
Europe
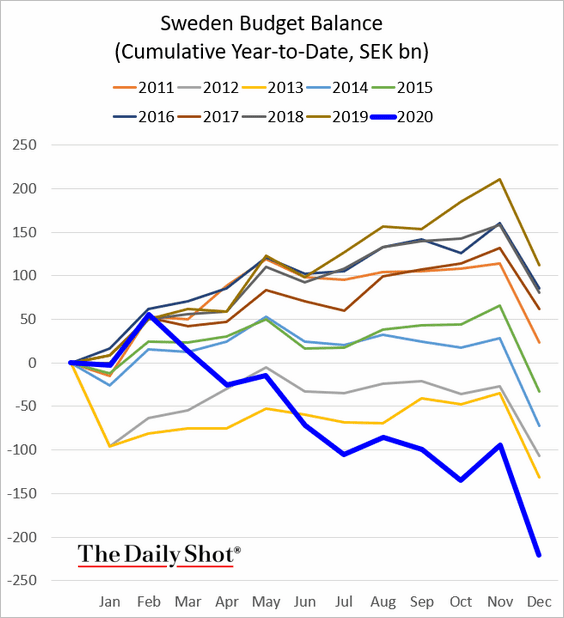
1. Let’s start with Sweden’s government budget balance.
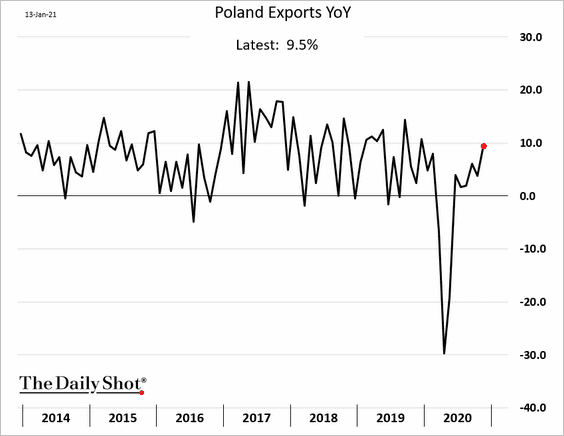
2. Poland’s exports are up nearly 10% from a year ago.
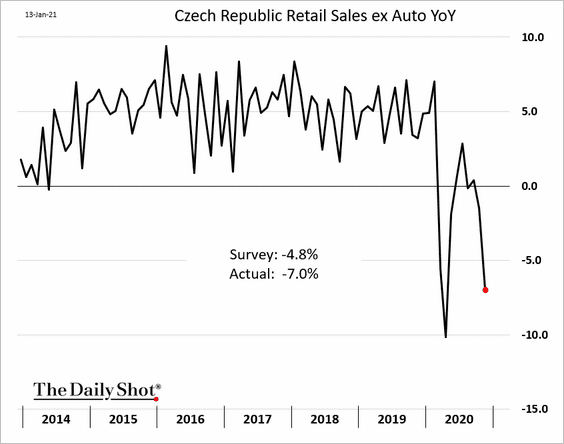
3. Czech retail sales tumbled in November.
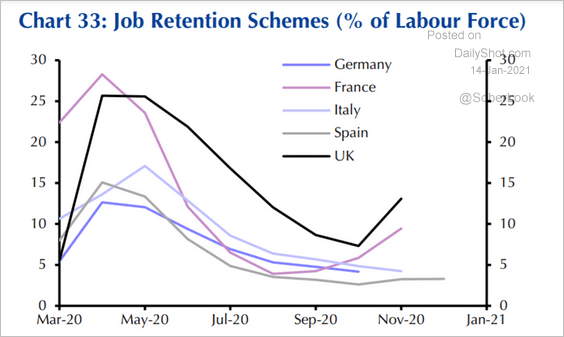
4. This chart shows the reliance on job retention schemes.
 Source: Capital Economics
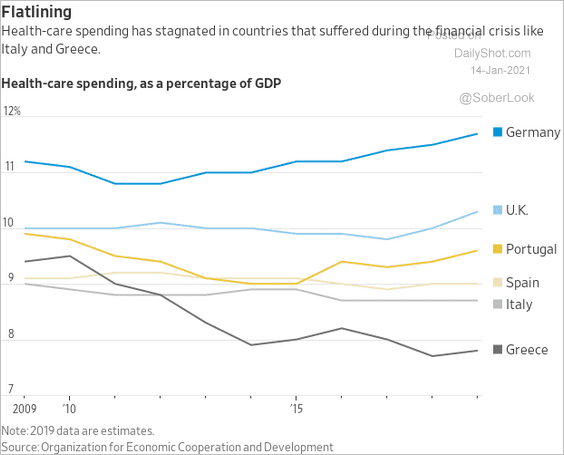
5. What percentage of the GDP do Europeans spend on healthcare?
 Source: @WSJ Read full article
6. Which countries have been hit the hardest by the pandemic (in terms of the number of deaths)?
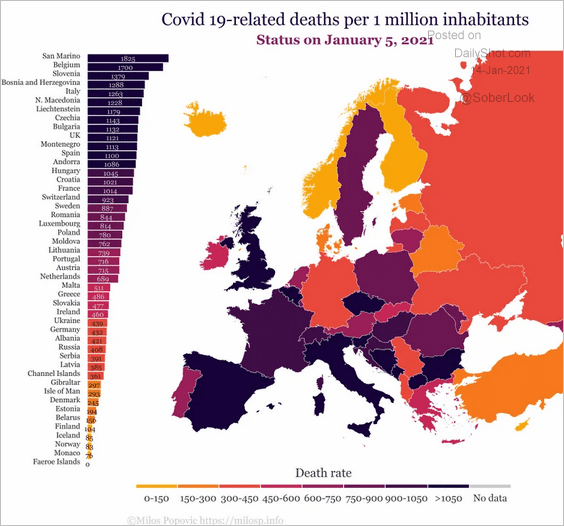 Source: Milos Popovic
7. Europe has been the largest beneficiary of ESG fund flows.
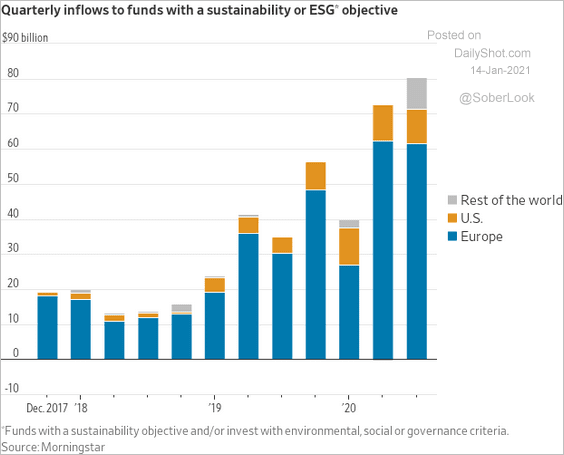 Source: @WSJ Read full article
Back to Index
Japan
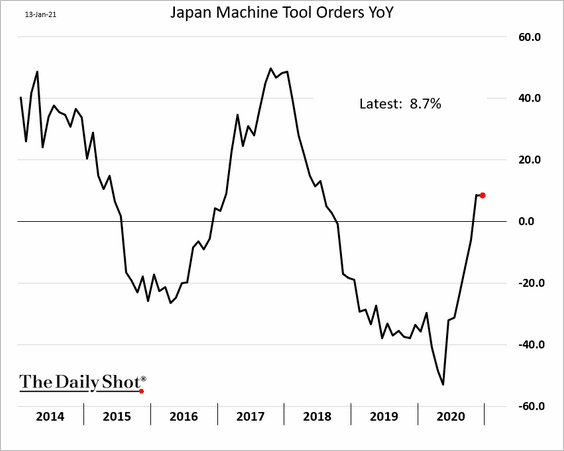
1. Machine tool orders remained robust last month.
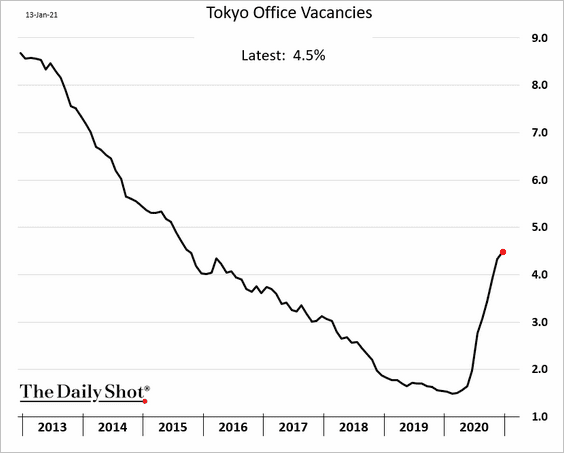
2. Tokyo office vacancies continue to grind higher.
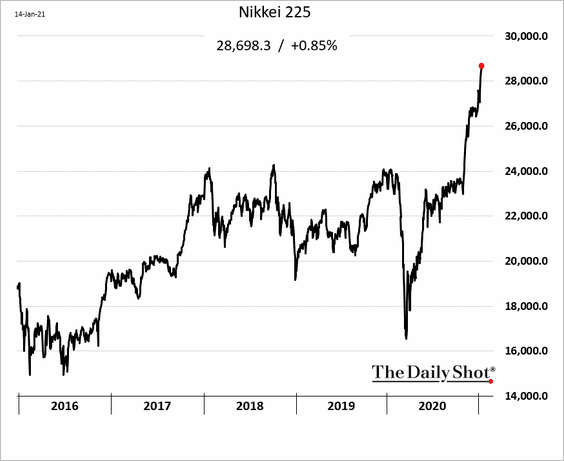
3. The stock market is surging.
Unlike in other developed markets, Japan’s small-caps are underperforming.
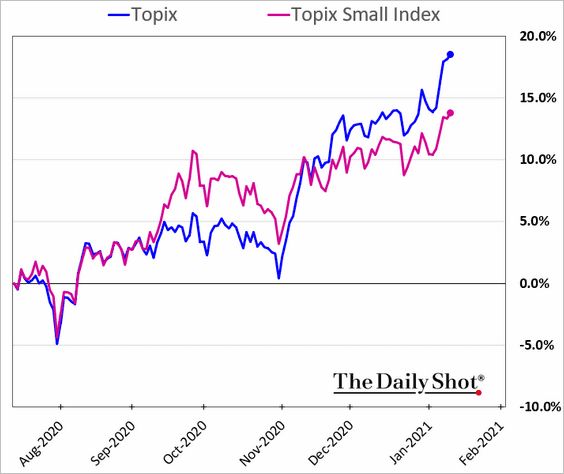 h/t @shoko_oda
——————–
4. Electricity prices have been soaring.
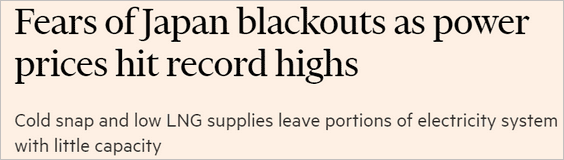 Source: @financialtimes Read full article
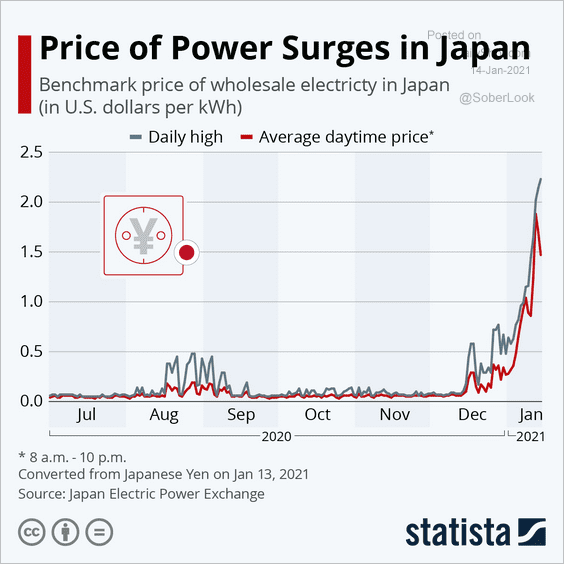 Source: Statista
Back to Index
China
1. The trade surplus hit a record high, …
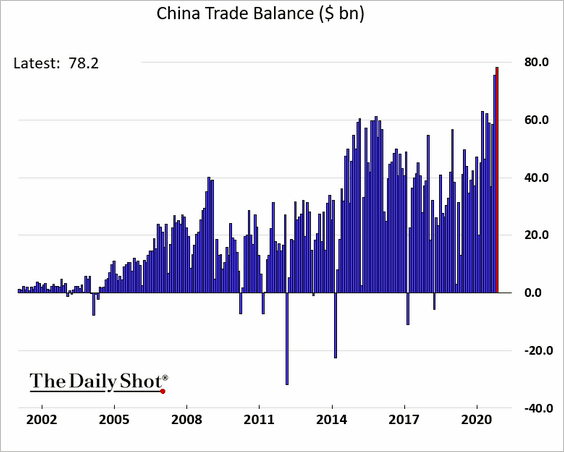
… as exports climb.
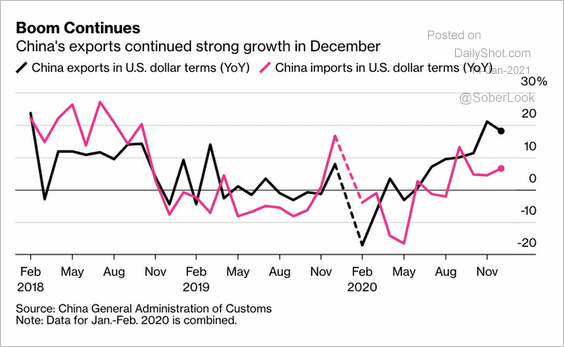 Source: @markets Read full article
——————–
2. The PBoC has been injecting liquidity, which helped power credit expansion and the stock market. It’s a positive trend for emerging markets.
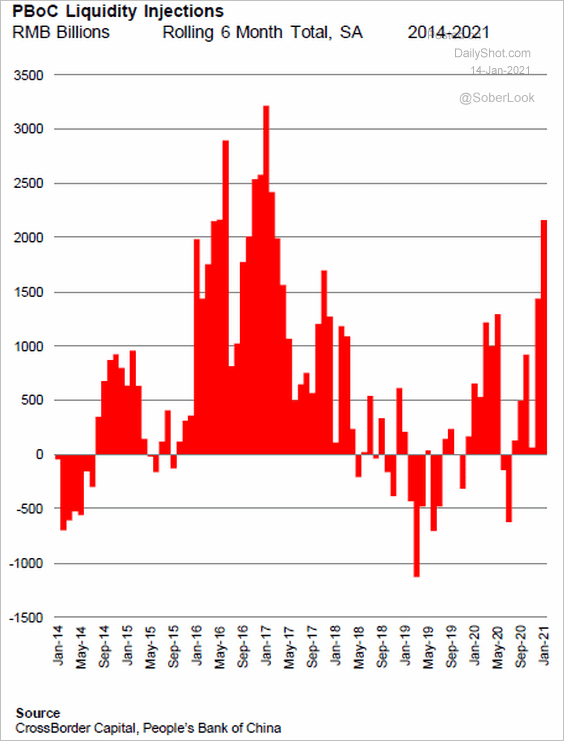 Source: CrossBorder Capital, @johnauthers, @bopinion Read full article
3. The CSI 300 and the Shanghai Composite indices have diverged sharply (the Shanghai Composite has more “old economy” and financial stocks).
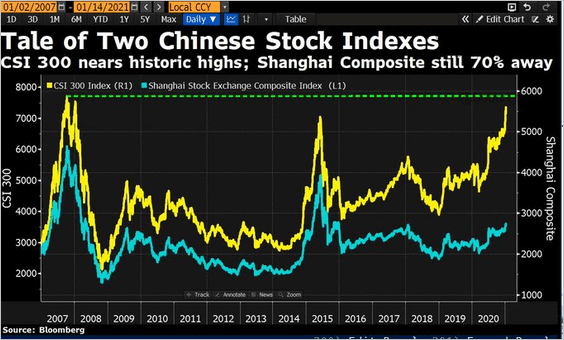 Source: @DavidInglesTV
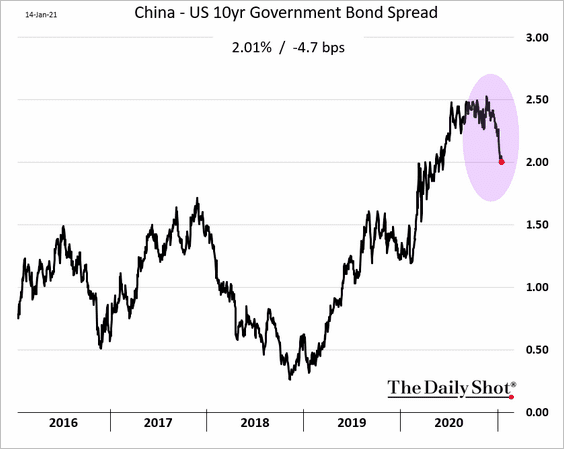
4. China’s 10yr yield spread vs. the US has peaked.
Back to Index
Emerging Markets
1. Brazilian bond yields are rising on concerns that the central bank may shift to a more hawkish posture.
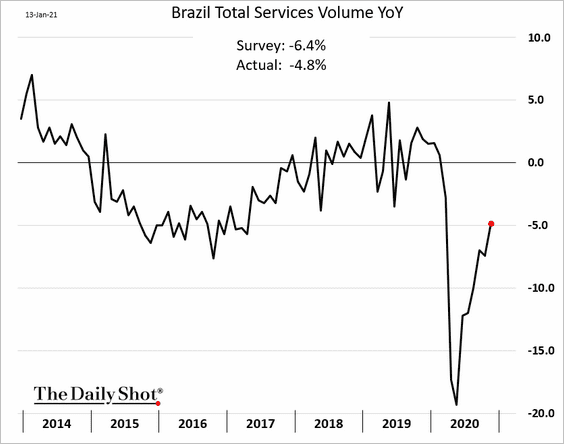
Separately Brazil’s service sector continues to recover.
——————–
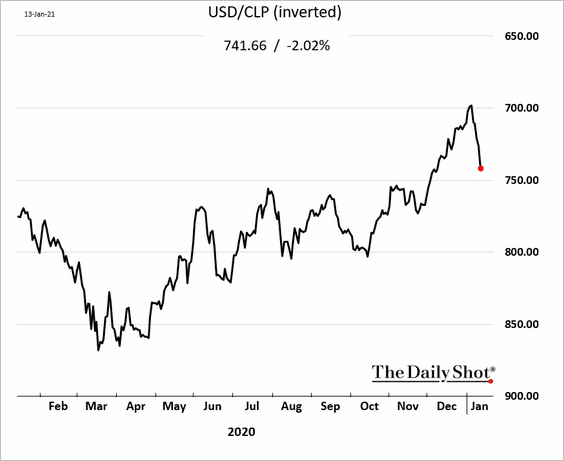
2. The Chilean peso tumbled.
Bloomberg: – Chile’s central bank announced Wednesday that it plans to boost its foreign reserves, buying $40 million a day for more than a year until its holdings reach 18% of gross domestic product.
——————–
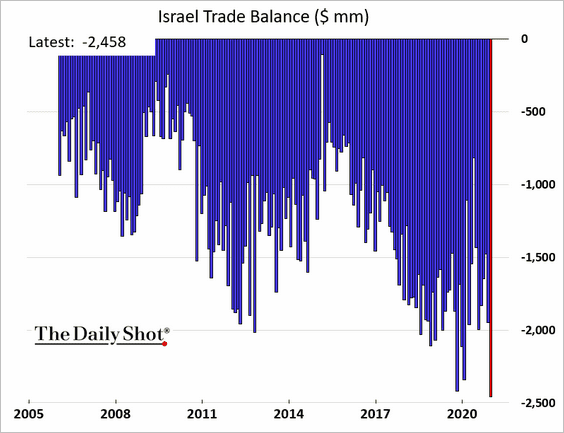
3. Israel’s trade deficit hit a record.
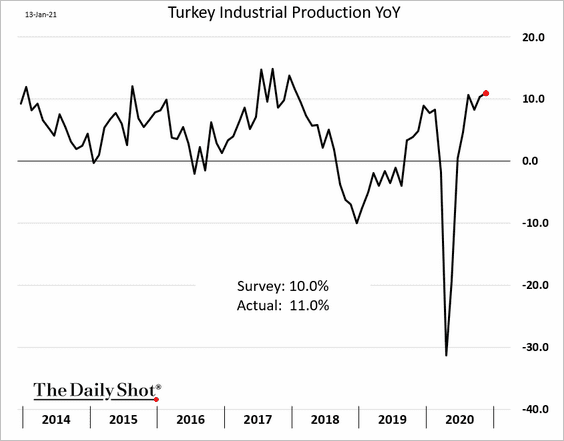
4. Turkey’s industrial production is 11% above last year’s levels.
5. Higher commodity prices bode well for commodity exporters.
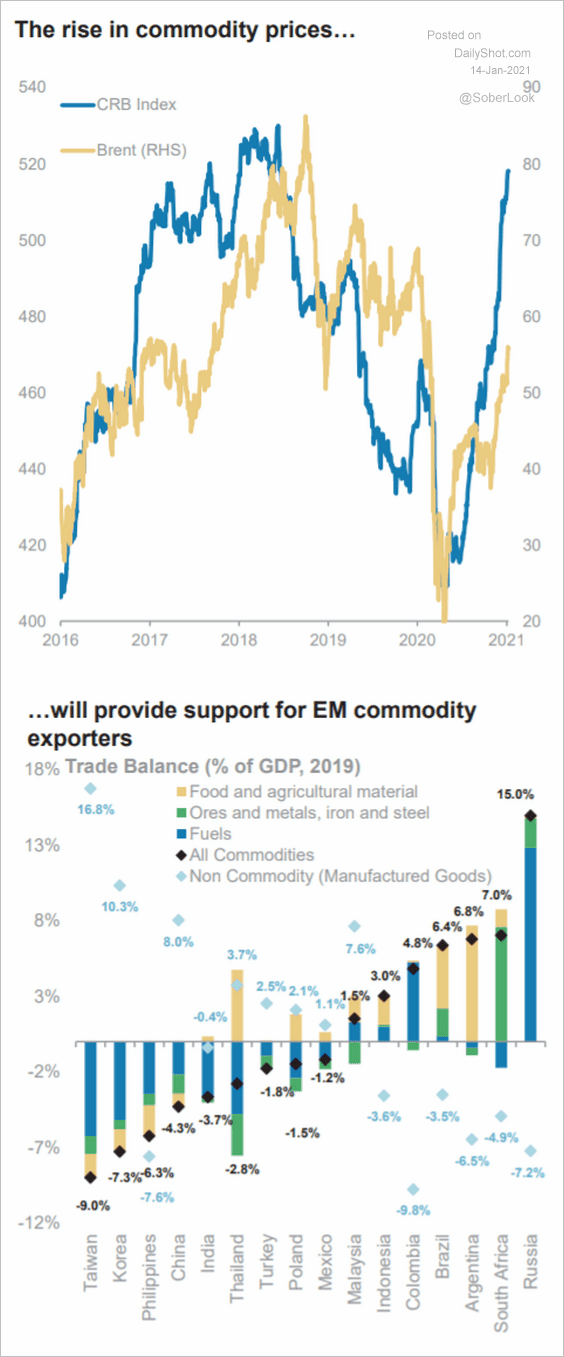 Source: Morgan Stanley Research
Back to Index
Cryptocurrency
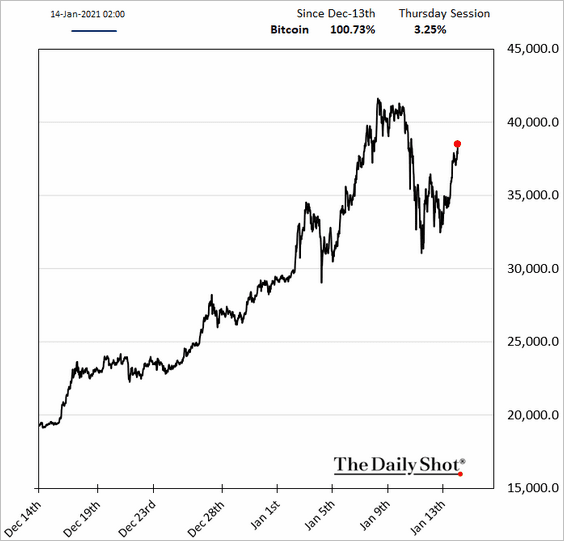
1. Bitcoin is headed toward $40k again.
2. The mother of all bubbles?
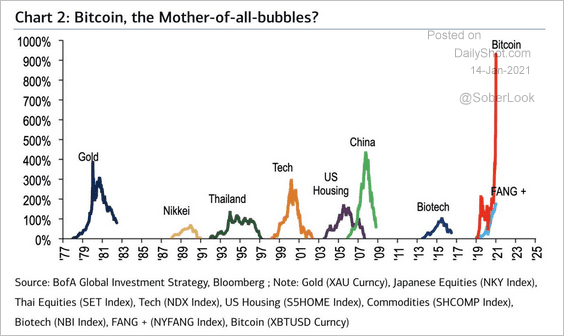 Source: BofA Global Research, @jessefelder Read full article
3. The 60-day correlation between Bitcoin and gold turned negative for the first time in over a year.
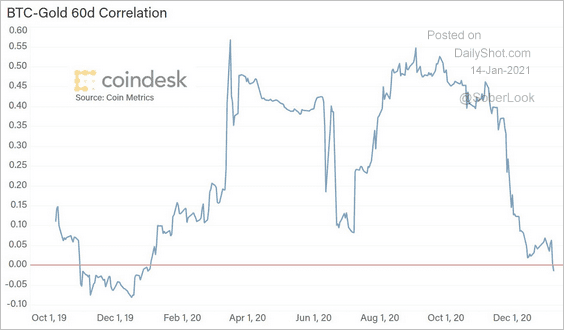 Source: @CoinDeskData
4. Here is the open interest in CME Bitcoin futures.
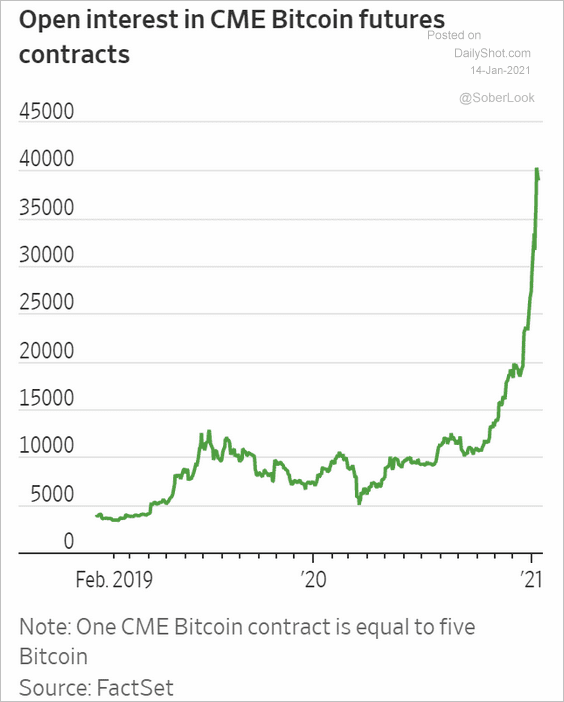 Source: @WSJ Read full article
5. This table shows how far various cryptocurrencies are from all-time-highs. Smaller cryptocurrencies have a long way to go, while BTC and ETH have been in retreat.
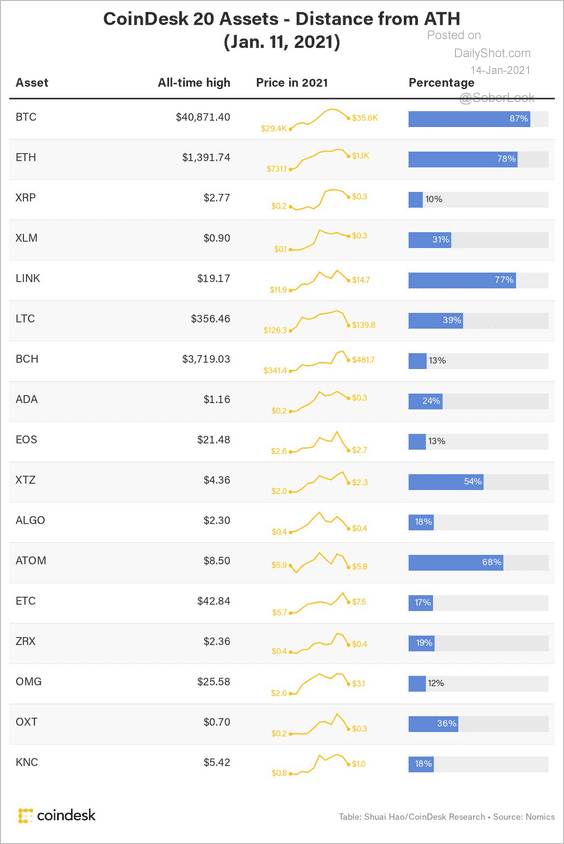 Source: @CoinDeskData
6. Investors have been well compensated for higher volatility in ETH vs. BTC given its outperformance. On the other hand, downside volatility in XRP has been a significant risk.
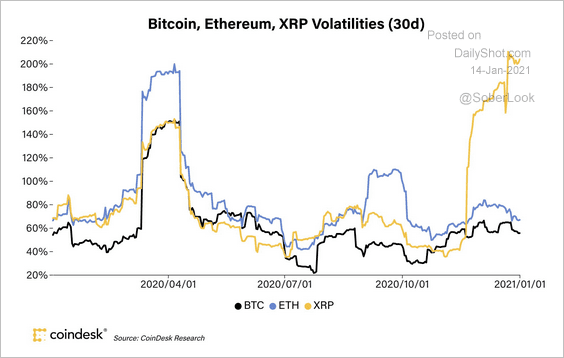 Source: @CoinDeskData
7. Below is a visualization of the top 1000 cryptocurrencies (market cap).
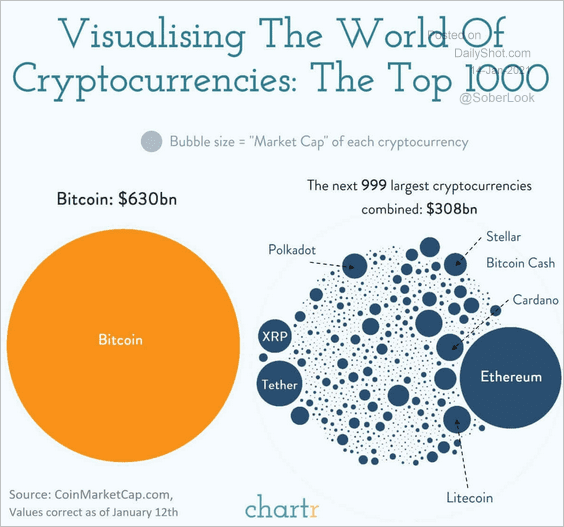 Source: @chartrdaily
Back to Index
Commodities
1. Gold is at support.
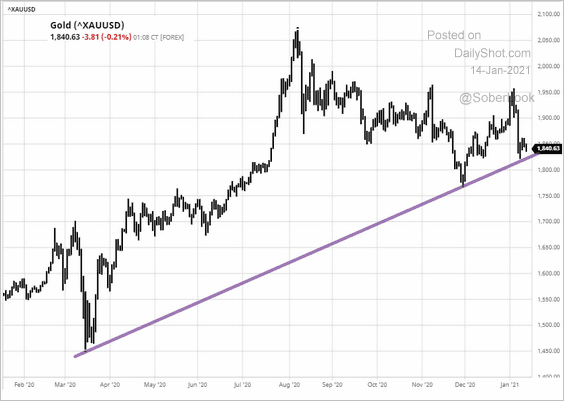 Source: barchart.com
2. Battery prices have declined significantly over the past decade but are now reversing, as vehicle demand outstrips supply.
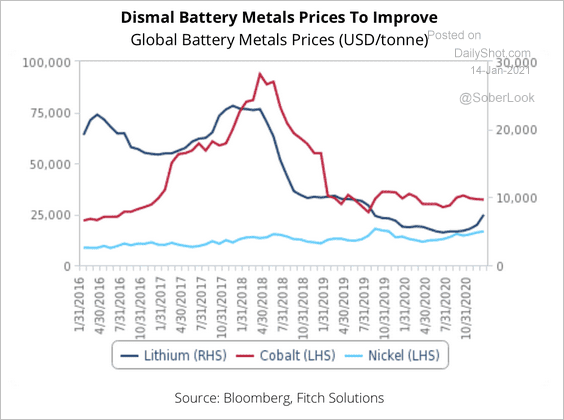 Source: Fitch Solutions Macro Research
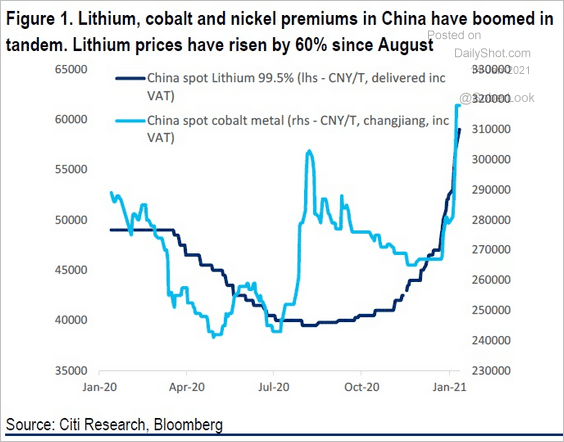 Source: Citi Research, @Scutty
Back to Index
Equities
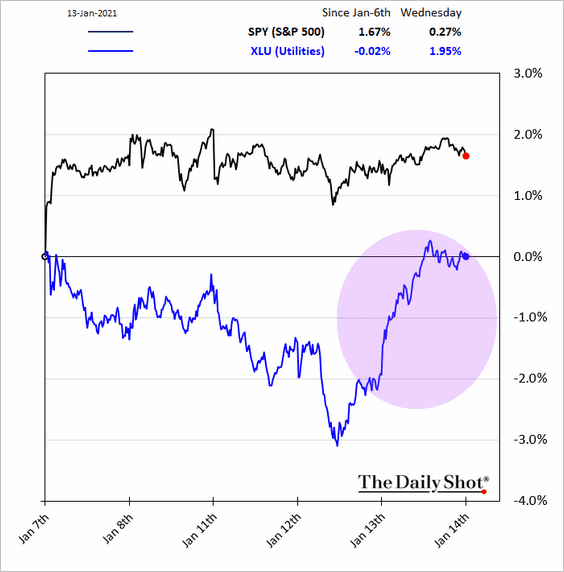
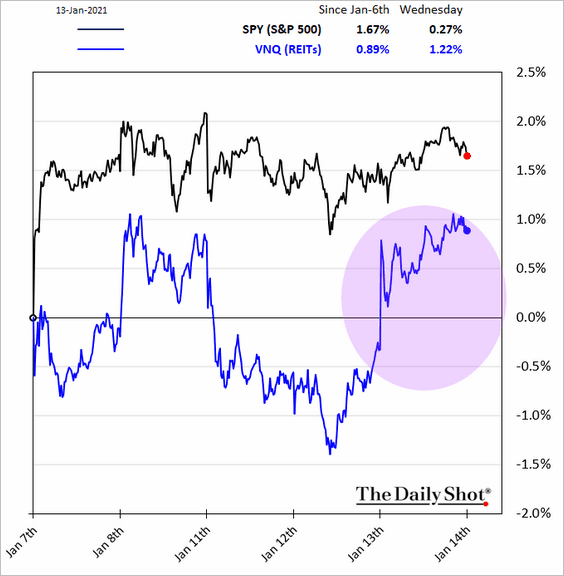
1. Defensive shares outperformed on Wednesday, boosted by higher Treasury prices.
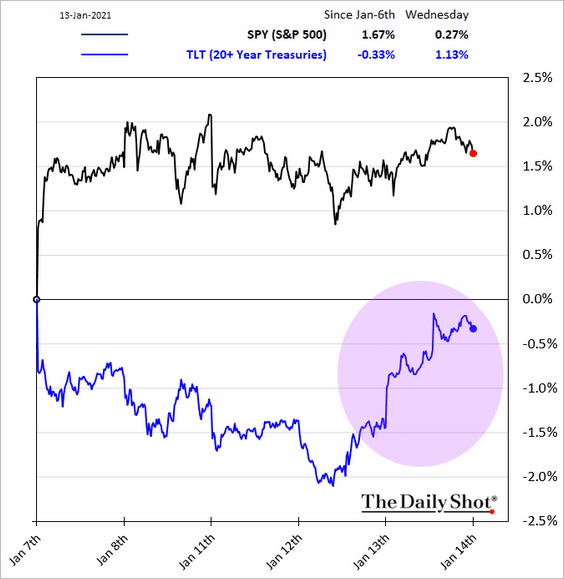
• Utilities:
• REITs:
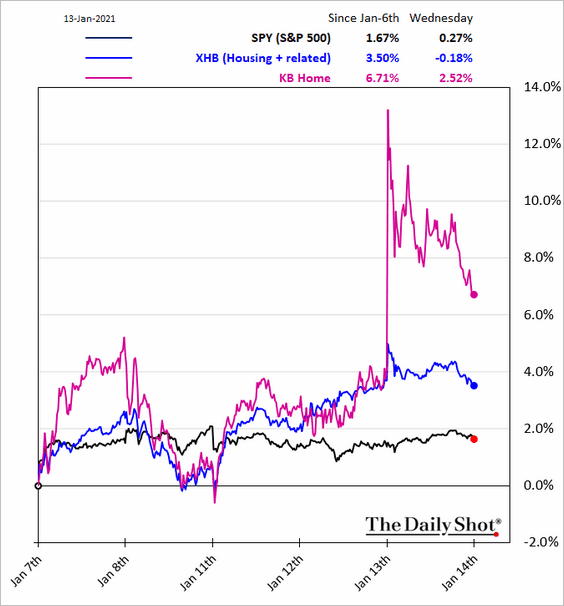
Here are a couple of other sector charts.
• Housing:
• Semiconductors:
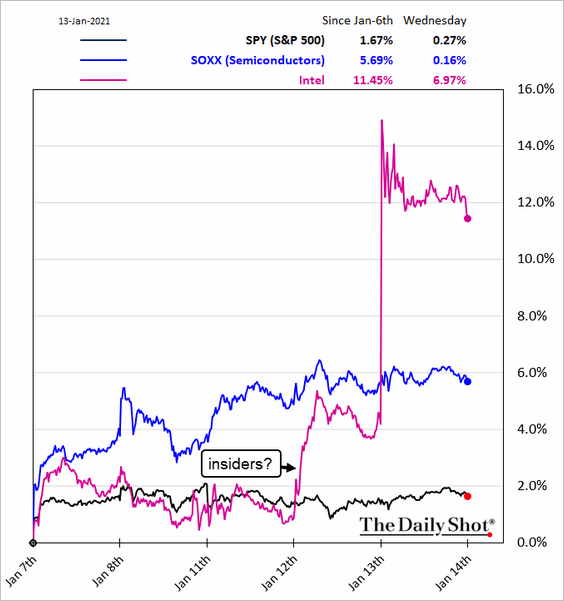
 Source: Reuters Read full article
——————–
2. The composition of the momentum factor is shifting toward more cyclical sectors.
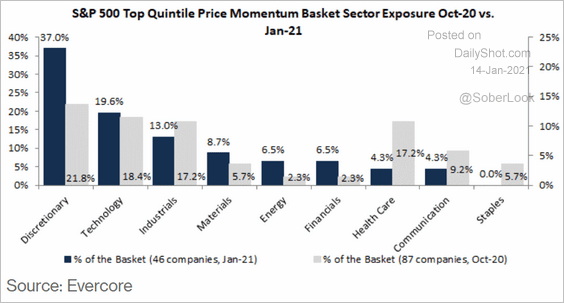 Source: Evercore, @markets Read full article
3. Tech represents a relatively small slice of the GDP and employment but is the largest component of the S&P 500.
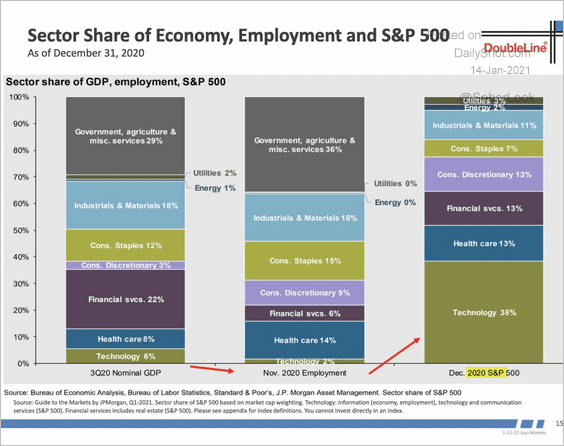 Source: DoubleLine, @JuliaLaRoche
4. This chart shows the ratio of the top five S&P 500 members to the rest of the index vs. Treasury yields.
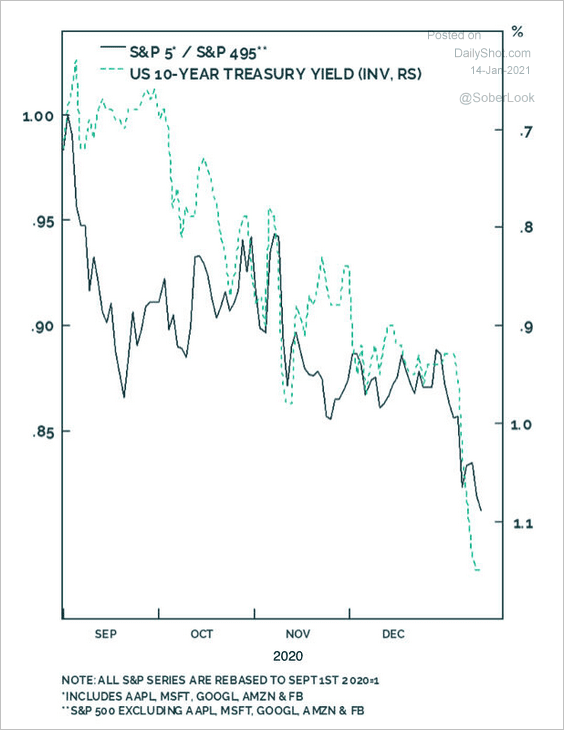 Source: Anastasios Avgeriou, BCA Research
5. Tech M&A volume continues to climb.
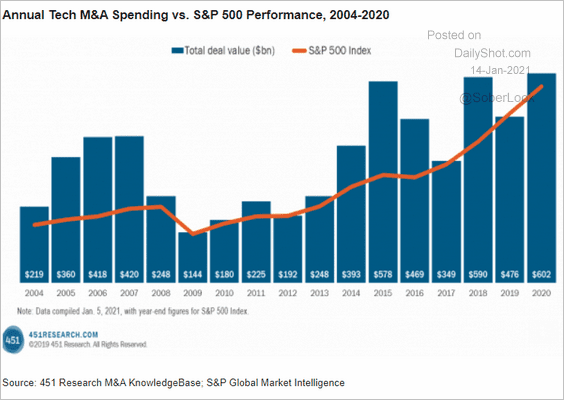 Source: S&P Global Market Intelligence
6. 2020 was a good year for SPAC mergers.
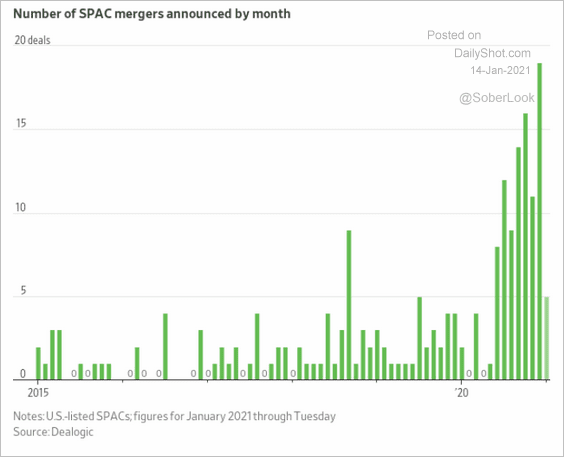 Source: @WSJ Read full article
7. Net foreign purchases of US equities have surged over the past year.
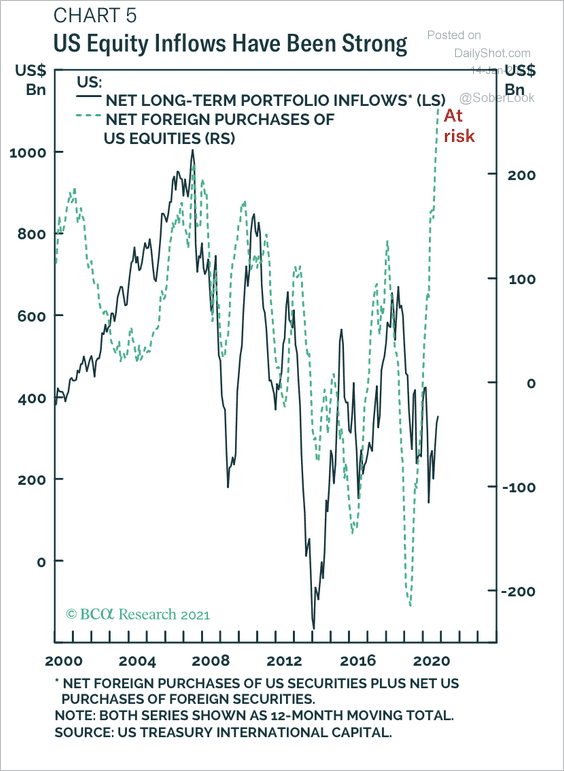 Source: BCA Research
8. Here are the gold-to-S&P 500 and Treasuries-to-S&P 500 ratios.
 Source: @allstarcharts
9. While most Investopedia readers (mostly retail investors) still expect significant returns this year, there was an increase among those who expect a market downturn compared to December.
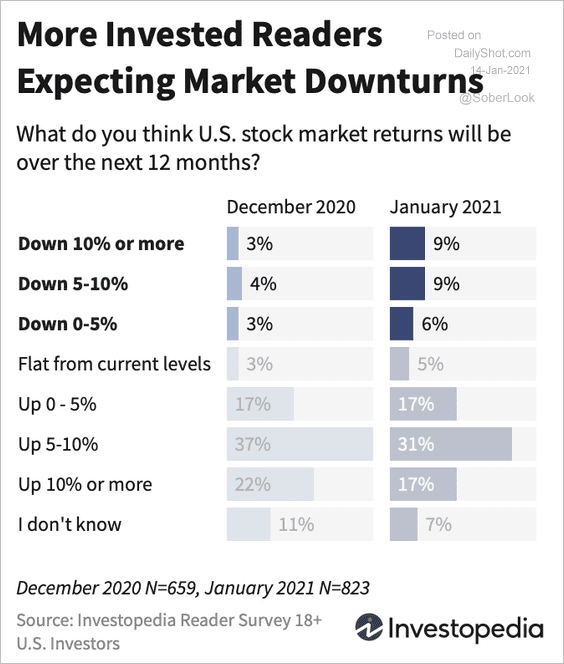 Source: Investopedia Read full article
10. Speculators are increasingly chasing penny stocks.
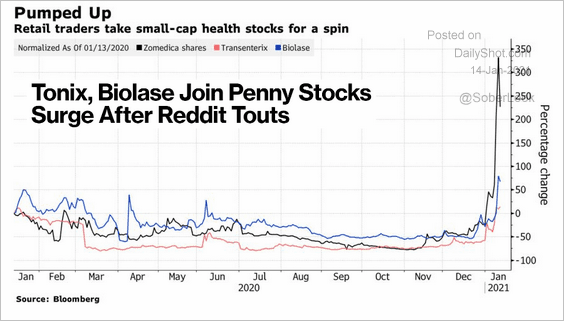 Source: @markets Read full article
11. What could be a potential catalyst to halt the current rally? Here is one possibility.
 Source: @markets Read full article
Back to Index
Rates
1. Investors now expect the Fed to hike rates in late 2023.
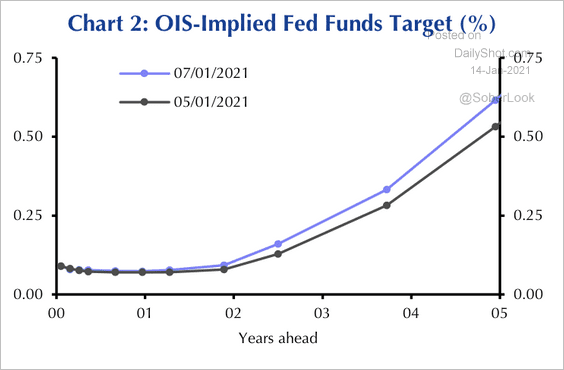 Source: Capital Economics
2. The ratio in swaption premiums for a +25 or -25 basis point shift in 30-year rates shows no bias toward higher or lower rates over the next year.
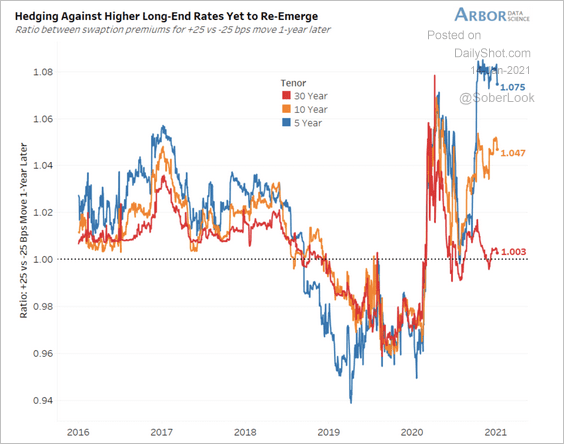 Source: Arbor Research & Trading
Swaption volatility remains extremely low, which suggests investors are not fearful of rising yields.
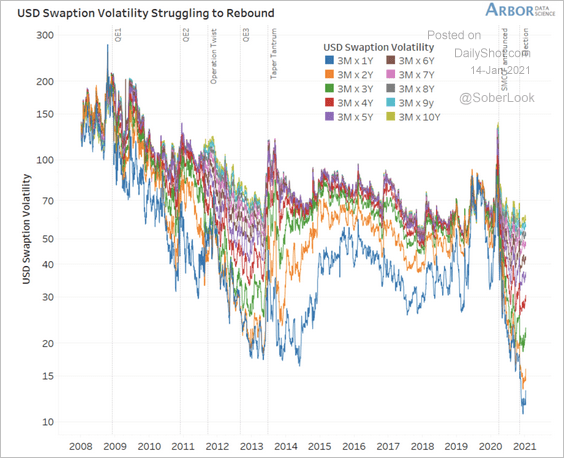 Source: Arbor Research & Trading
——————–
3. This chart shows moves in US real and nominal yields since late July.
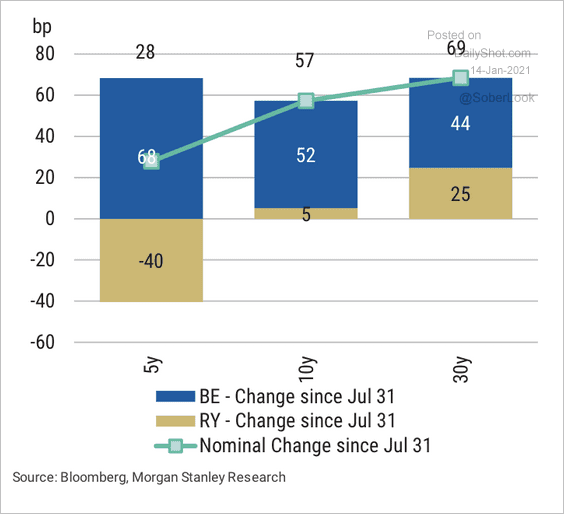 Source: Morgan Stanley Research
——————–
Global Developments
1. Here are the Capital Economics mobility trackers.
![]() Source: Capital Economics
Source: Capital Economics
2. According to a World Bank survey, “firms thus far have been more likely to reduce hours or wages than fire workers.”
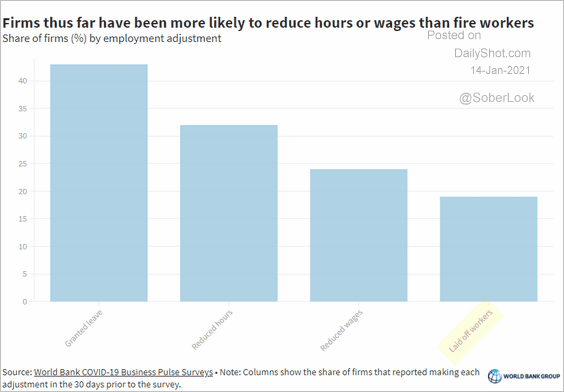 Source: World Bank Read full article
——————–
Food for Thought
1. The world’s biggest shipping hubs:
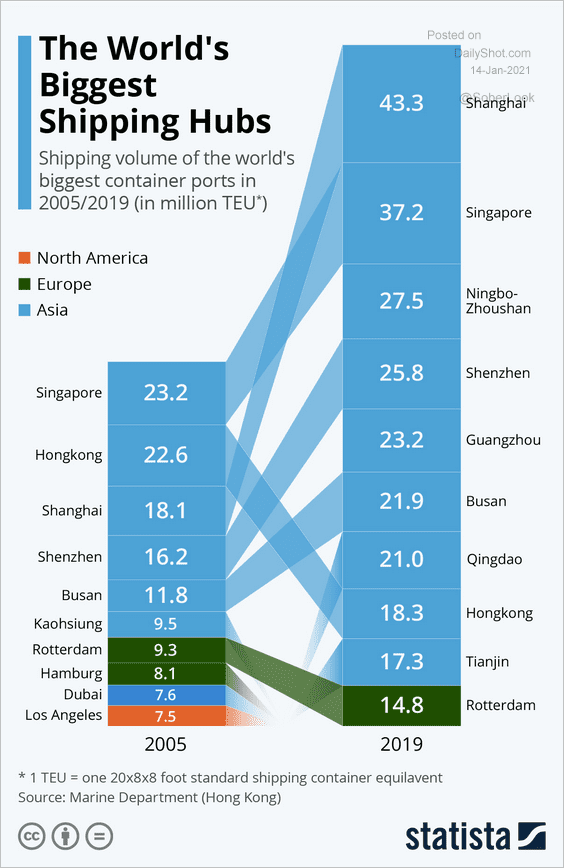 Source: Statista
2. Investing in warehouses vs. offices:
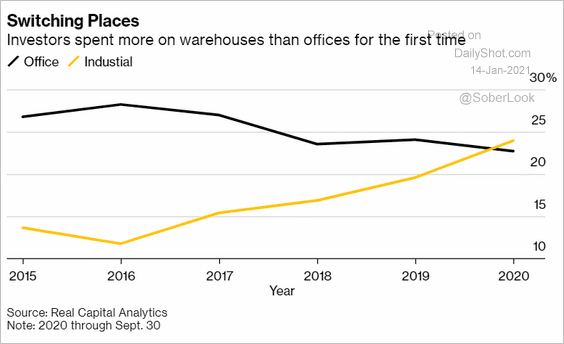 Source: @markets Read full article
3. The share of workers who quit their job, by sector:
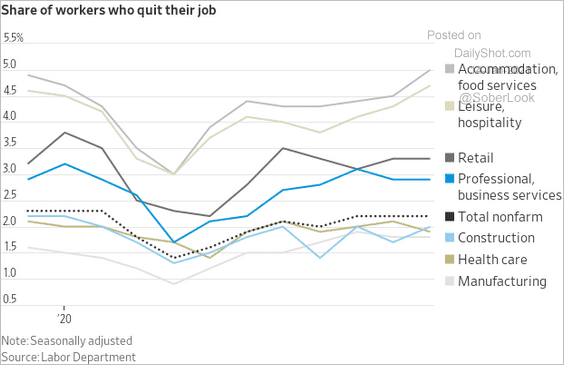 Source: @jeffsparshott
4. Seated restaurant diners in the US vs. Australia:
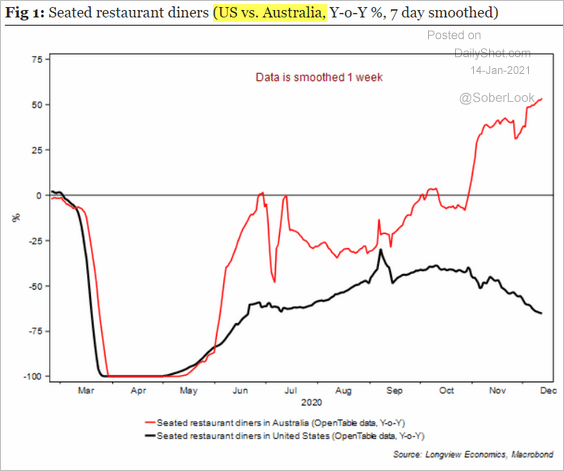 Source: Longview Economics
5. Demand for vaccine:
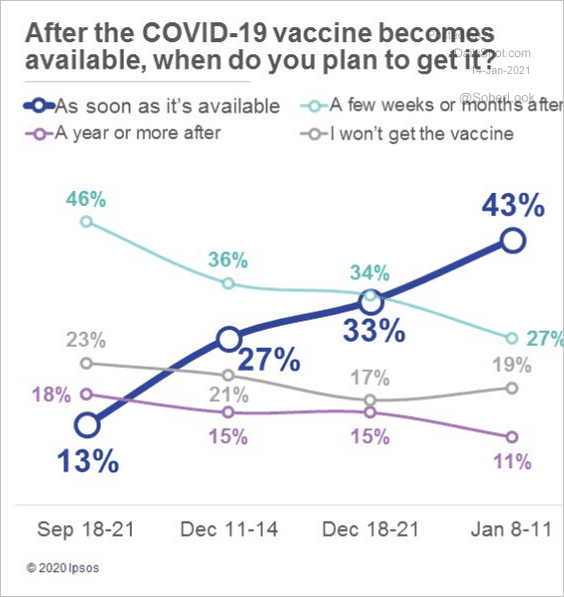 Source: Ipsos Read full article
Percent vaccinated (updated):
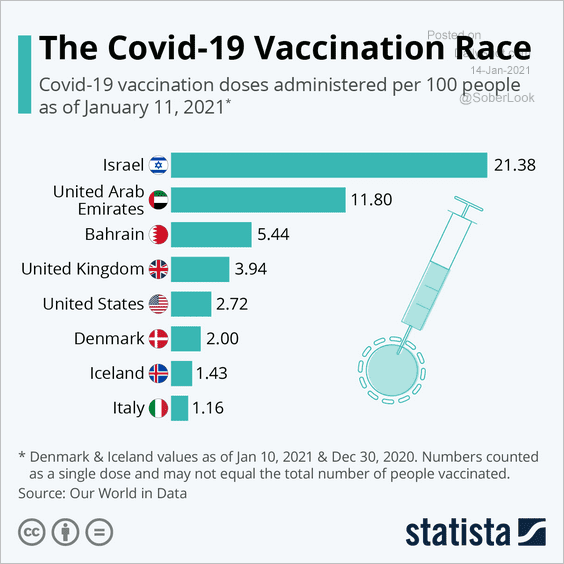 Source: Statista
——————–
6. Native vs. foreign-born workers in STEM and non-STEM occupations:
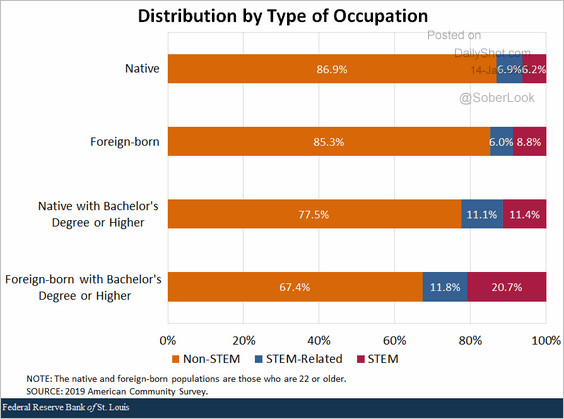 Source: St. Louis Fed Read full article
7. US consumer sentiment by party affiliation:
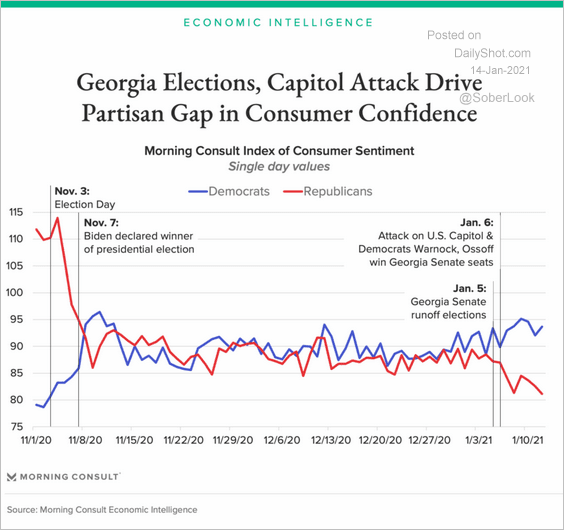 Source: Morning Consult Read full article
8. Capitol police budget:
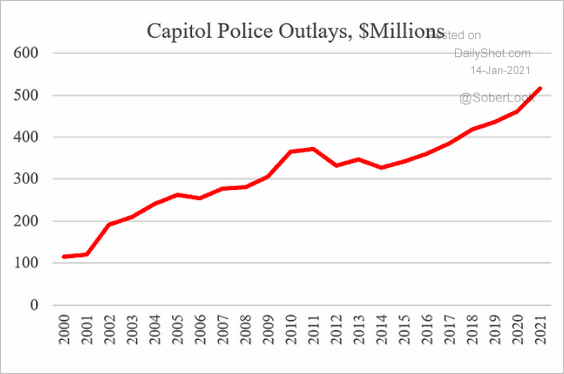 Source: Cato Institute
9. Tallest flagpoles:
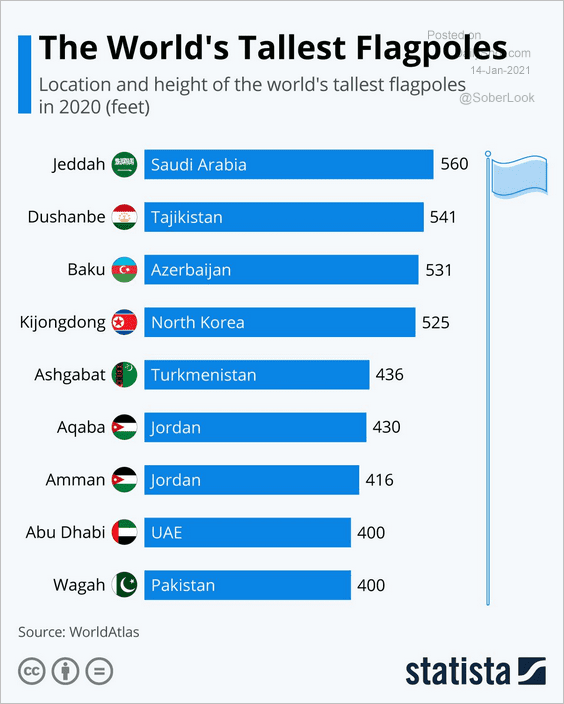 Source: Statista
——————–
Back to Index