
The Daily Shot: 09-Feb-21
• The United States
• The United Kingdom
• The Eurozone
• Japan
• Asia – Pacific
• China
• Emerging Markets
• Cryptocurrency
• Commodities
• Energy
• Equities
• Credit
• Rates
• Global Developments
• Food for Thought
The United States
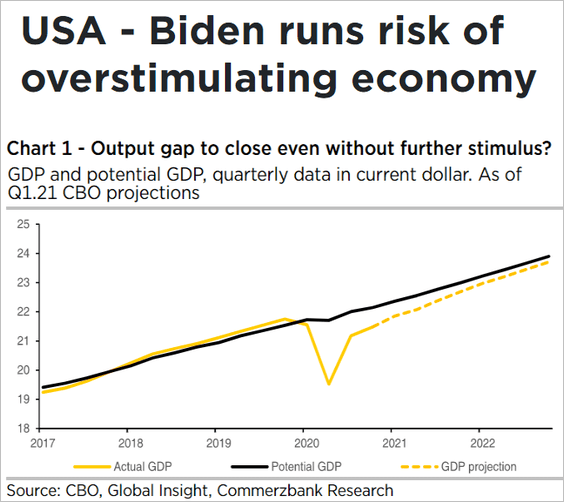
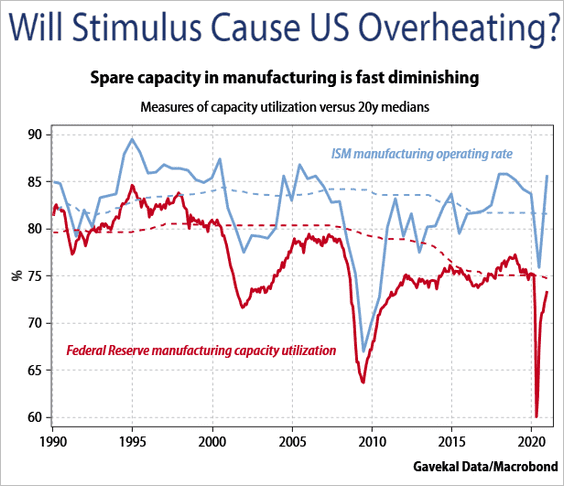
1. Economists are concerned that the additional $1.9 trillion fiscal stimulus will overheat the nation’s economy.
 Source: Commerzbank Research
 Source: Gavekal Research
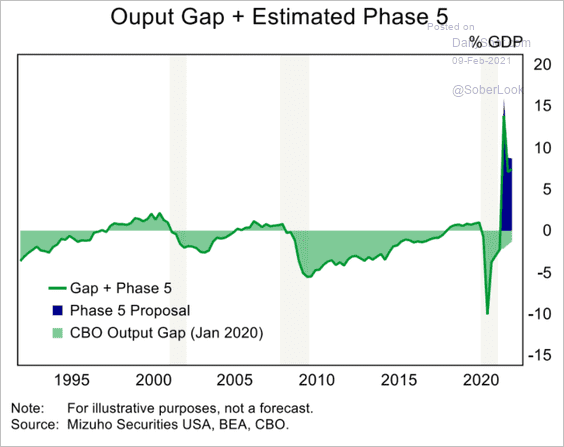
The output gap is expected to close on its own, and the additional fiscal easing will result in the economy operating well above potential.
 Source: Mizuho Securities USA
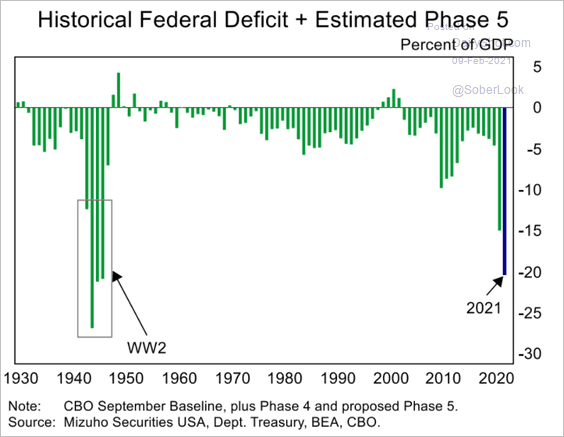
The budget deficit will hit a new post-WW-II record.
 Source: Mizuho Securities USA
——————–
2. Next, we have some GDP growth forecasts.
• BofA revised its GDP forecast higher and now expects the economy to overheat next year at full employment, triggering inflation.
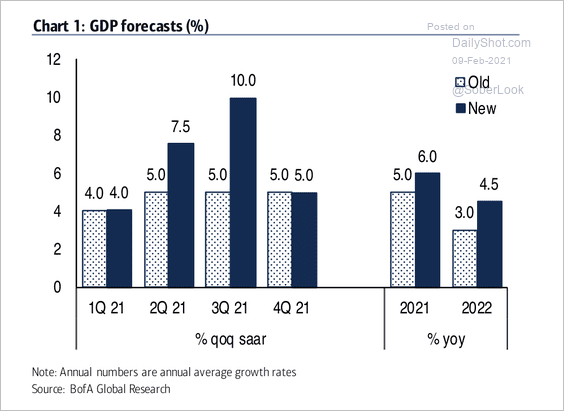 Source: BofA Global Research
• With additional fiscal stimulus and vaccination rollout, SunTrust expects GDP growth to be the strongest since 1999.
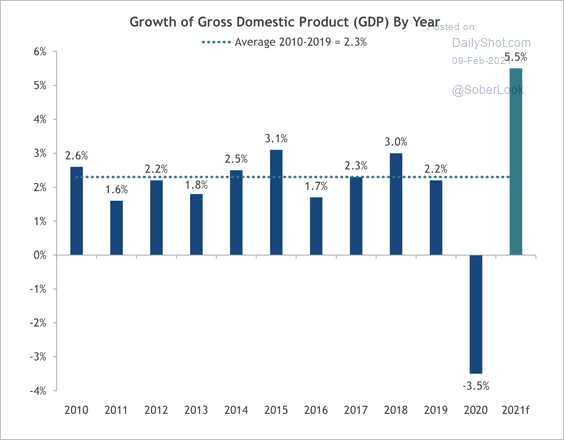 Source: SunTrust Private Wealth Management
• According to Deutsche Bank, nominal GDP is about to rise well above borrowing costs …
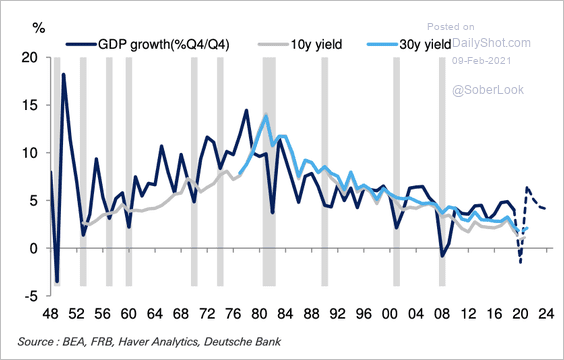 Source: Deutsche Bank Research
… with the spread reaching the highest level since the 1970s.
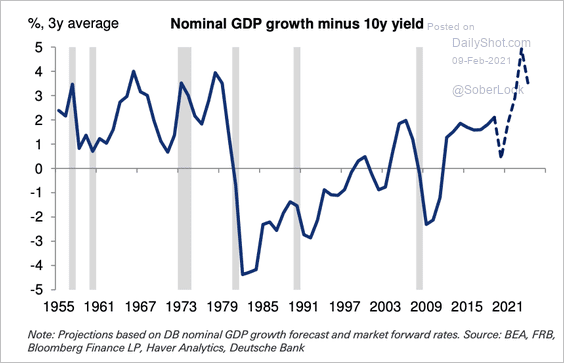 Source: Deutsche Bank Research
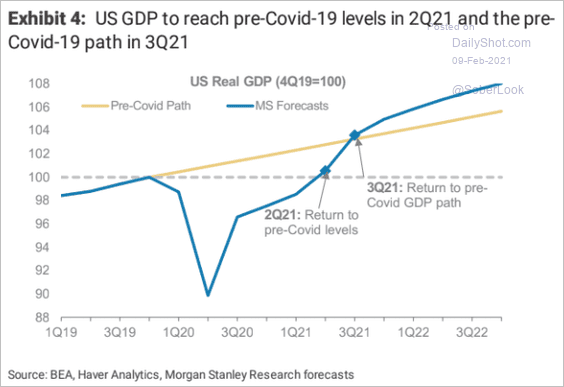
• When will the GDP reach its pre-COVID path?
– According to Morgan Stanley, it will be in Q3 of next year.
 Source: Morgan Stanley Research
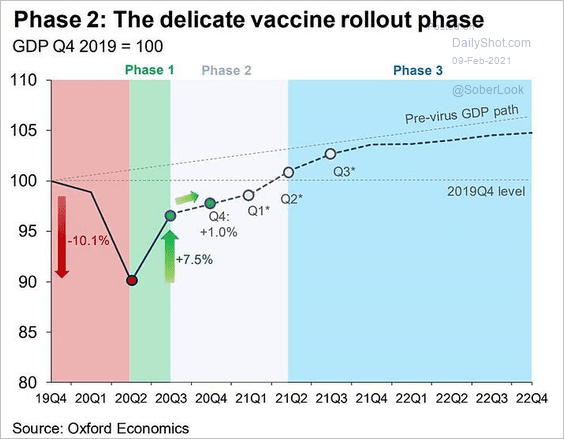
– According to Oxford Economics, the GDP won’t reach its pre-COVID path in the near-term.
 Source: Oxford Economics
——————–
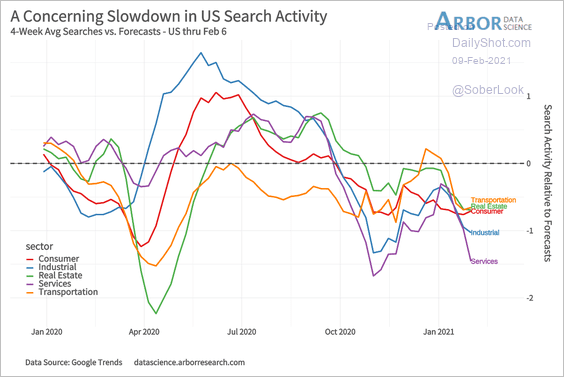
3. Online search activity points to a soft patch in economic growth in recent weeks.
 Source: Arbor Research & Trading
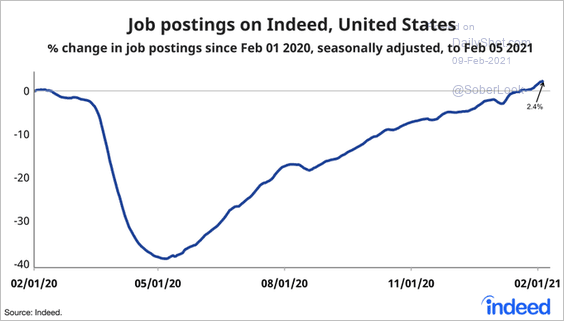
4. Job postings on Indeed have recovered.
 Source: @JedKolko, @indeed
5. The Oxford Economics recovery tracker has been improving as the COVID situation eases (for now).
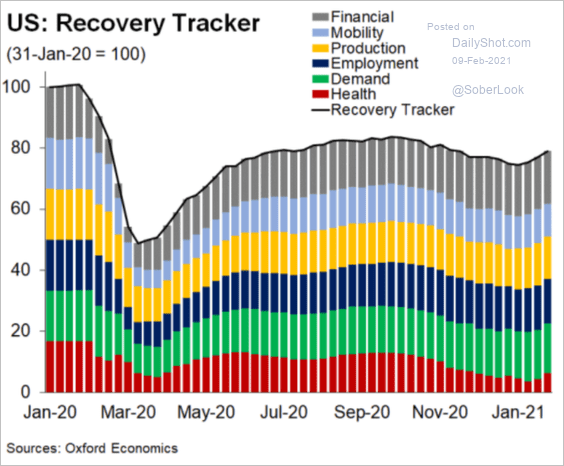 Source: Oxford Economics
6. Migration from urban neighborhoods has been remarkable.
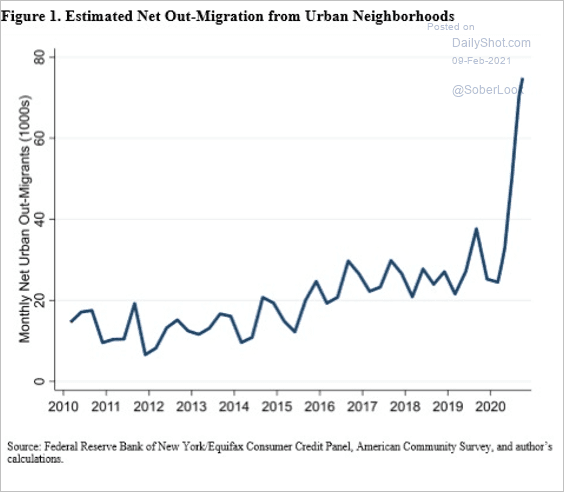 Source: @ClevFedResearch
As a result, the inventory of single-family homes tumbled since the start of the pandemic.
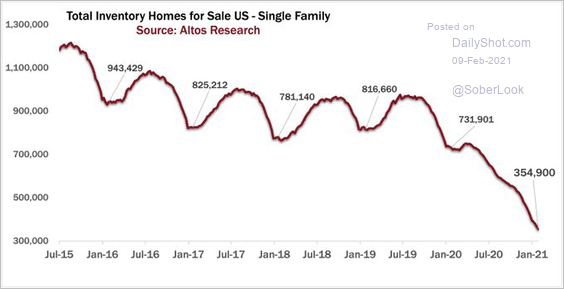 Source: @mikesimonsen
Back to Index
The United Kingdom
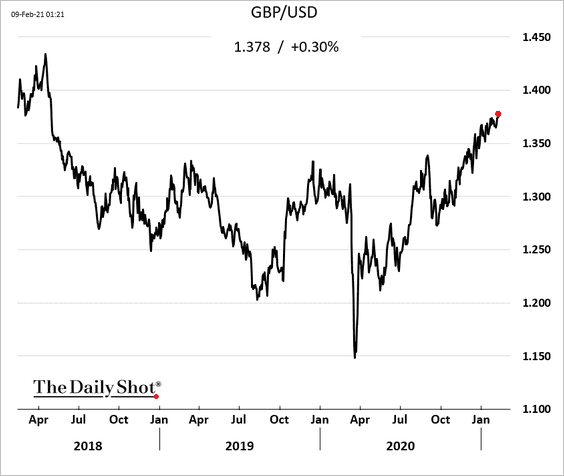
1. The pound continues to climb.
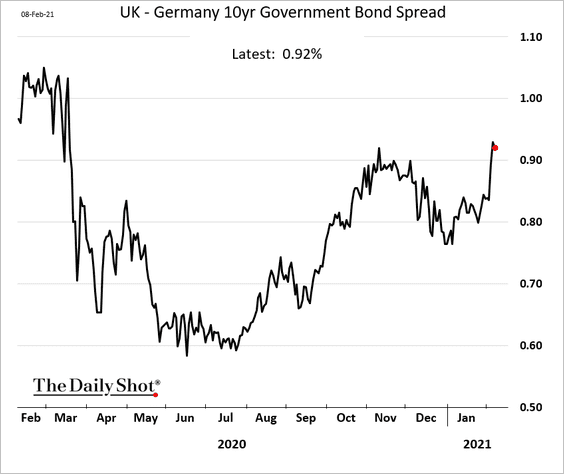
2. Gilt-Bund spreads have widened recently.
3. The BoE expects the GDP to reach its pre-COVID level by the end of the year.
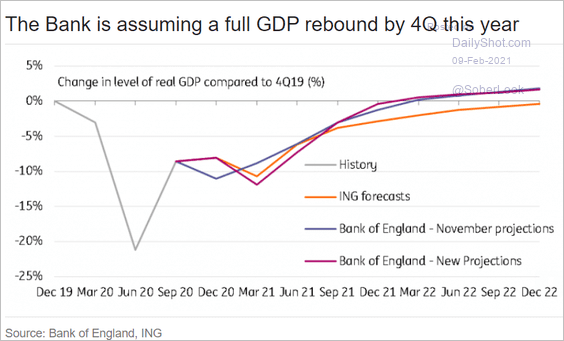 Source: ING
Back to Index
The Eurozone
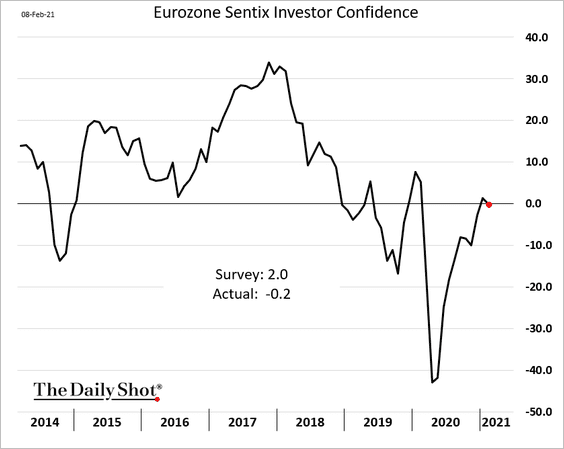
1. Investor confidence softened this month.
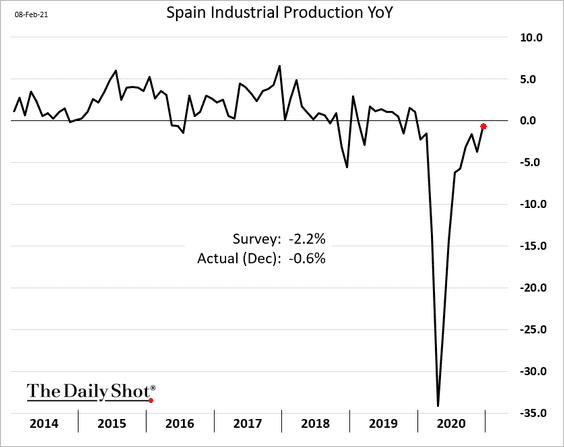
2. Spain’s industrial production has almost recovered.
3. This chart compares the output gap and core inflation for Italy and Spain.
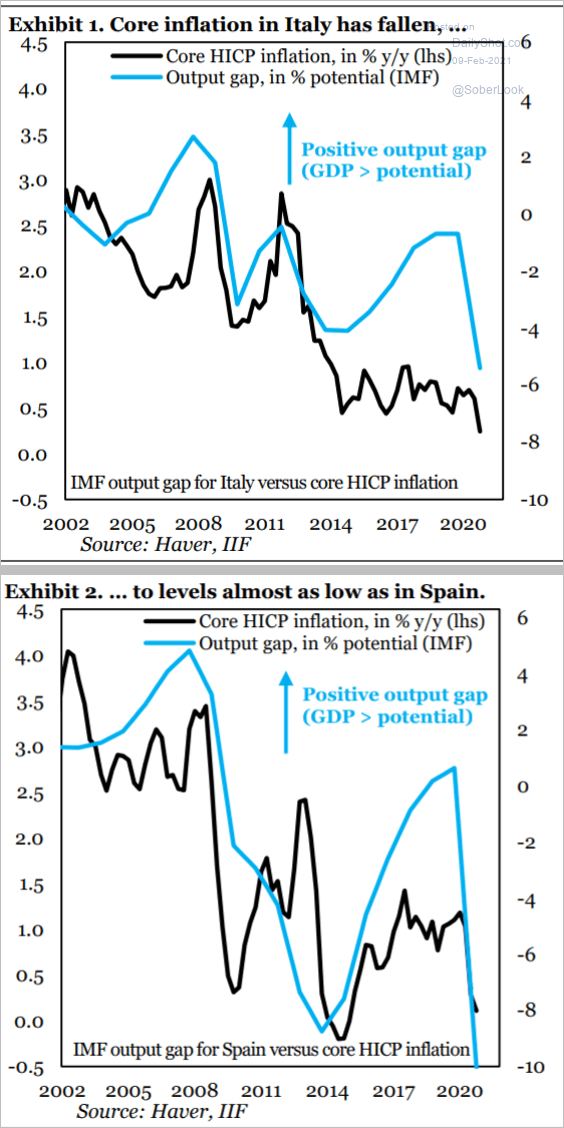 Source: IIF
4. The monetary base hit €5 trillion.
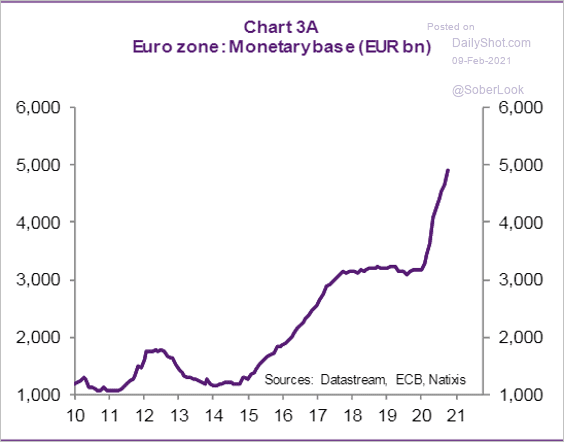 Source: Natixis
Money markets are now flooded with liquidity.
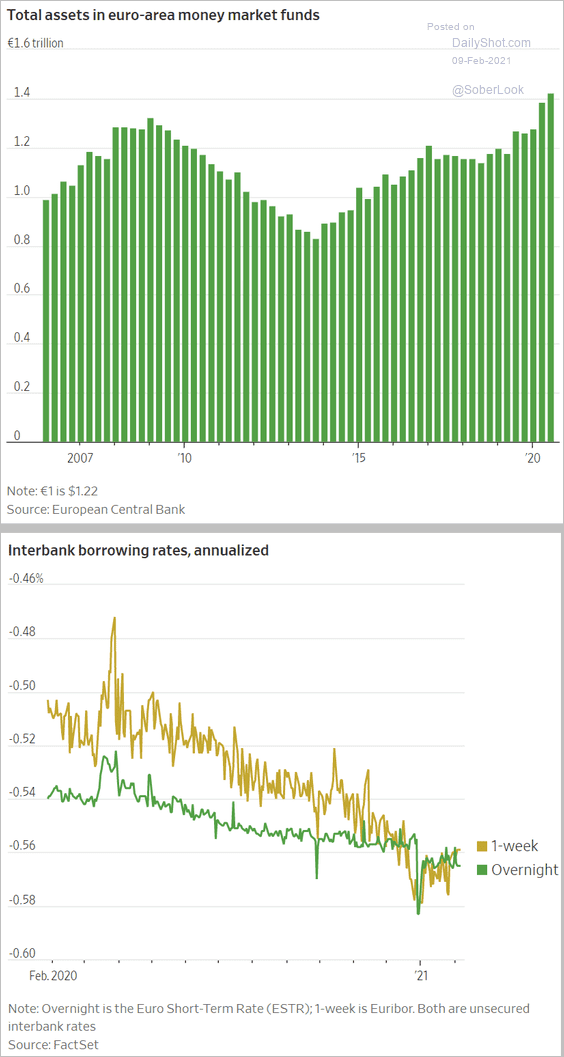 Source: @WSJ Read full article
——————–
5. Will extraordinarily accommodative financial conditions change the ECB’s approach to the TLTRO program?
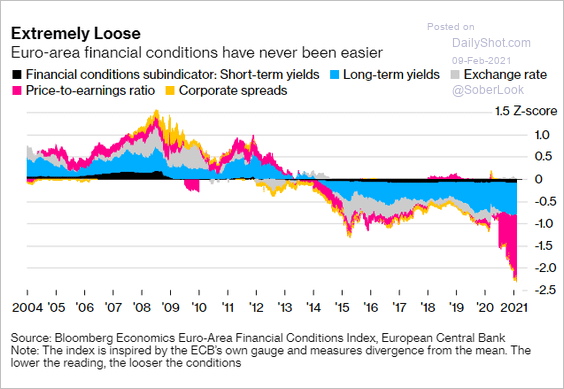 Source: @ZSchneeweiss, @davidjpowell24 Read full article
Back to Index
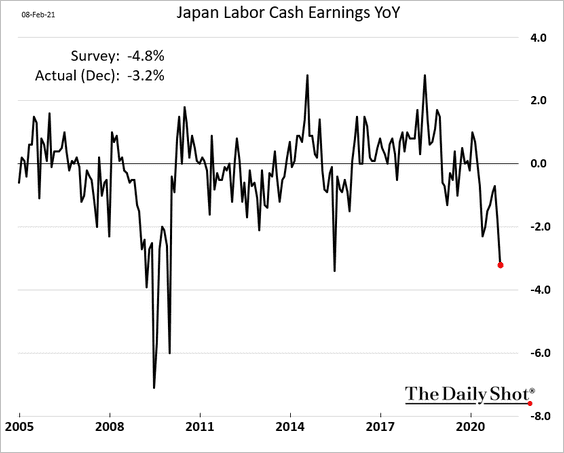
Japan
1. Wages tumbled in December, although the decline was less severe than expected.
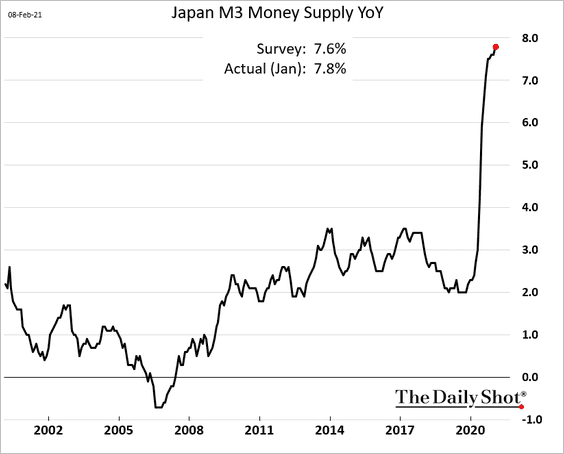
2. The broad money supply growth has been impressive.
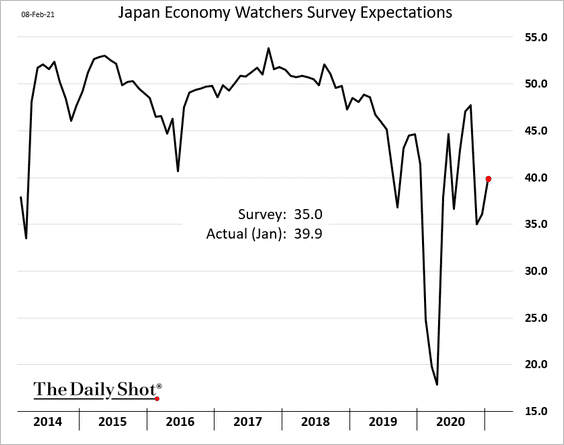
3. The Economy Watchers survey showed an improvement in expectations last month.
4. The stock market has diverged from dollar-yen.
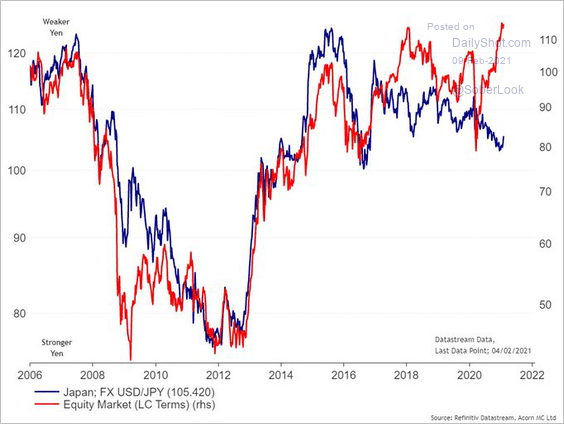 Source: @RichardDias_CFA
Back to Index
Asia – Pacific
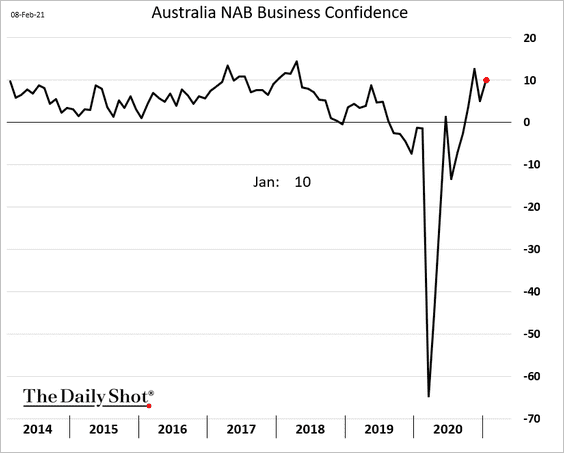
1. Australia’s business confidence strengthened last month.
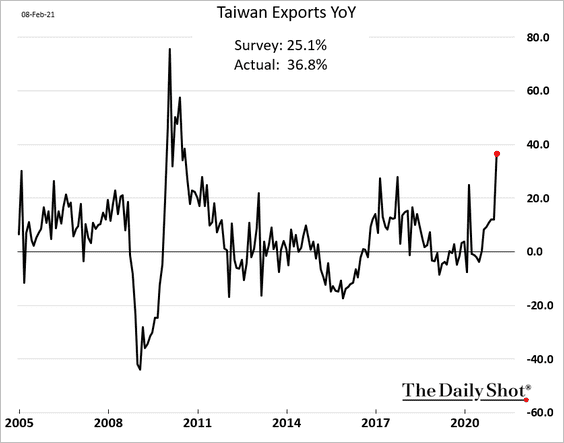
2. Taiwan’s export growth hit the highest level in a decade.
Back to Index
China
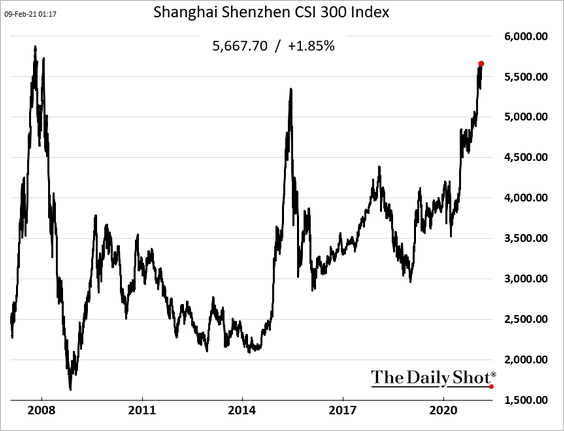
1. The benchmark stock market index is approaching its pre-financial-crisis record.
2. Total debt levels continue to climb.
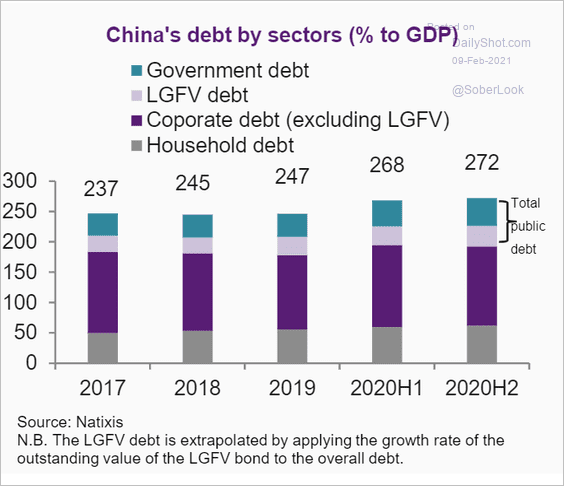 Source: Natixis
3. Here is the breakdown of China’s international trade.
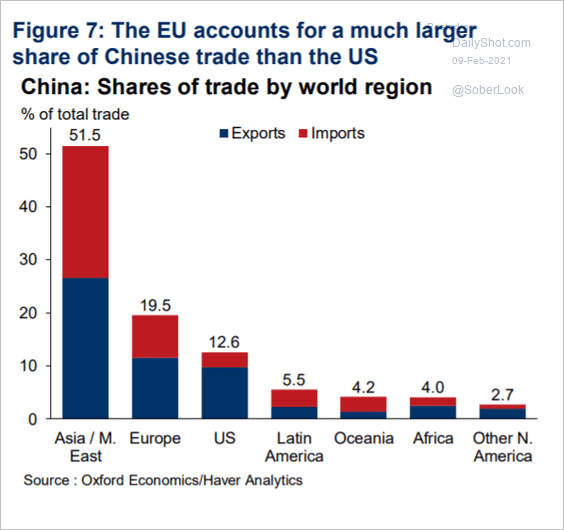 Source: Oxford Economics
Back to Index
Emerging Markets
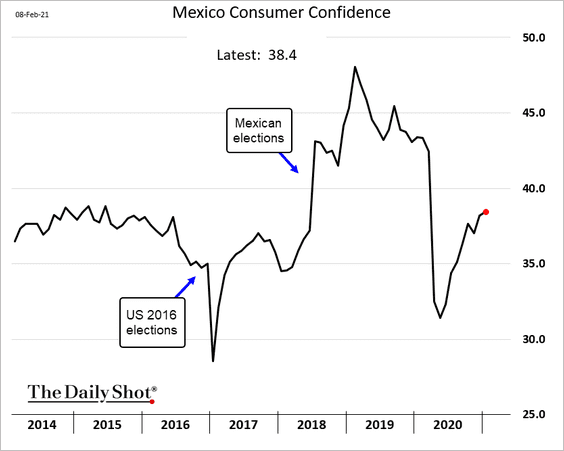
1. Mexico’s consumer sentiment is grinding higher.
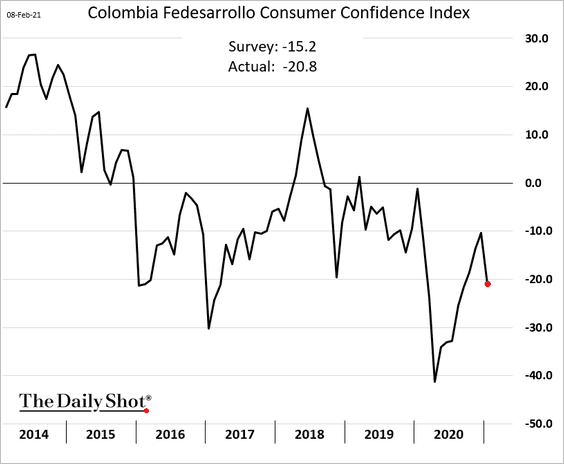
2. Colombia’s consumer confidence deteriorated last month.
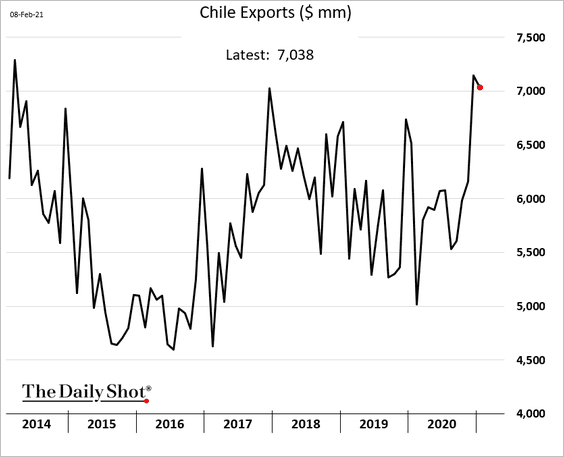
3. Chile’s exports are near multi-year highs.
4. This chart shows market expectations for LatAm policy rates.
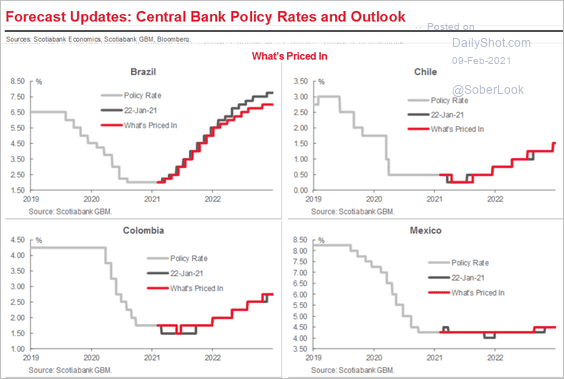 Source: Scotiabank Economics
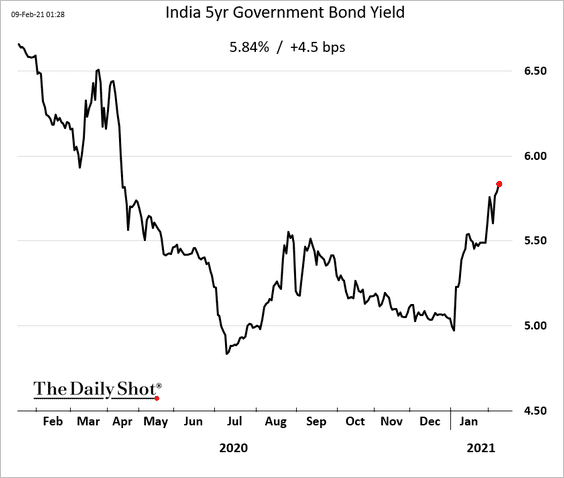
5. India’s bond yields keep climbing despite RBI’s promise to keep yields under control.
6. The coup is expected to severely dampen Myanmar’s GDP growth.
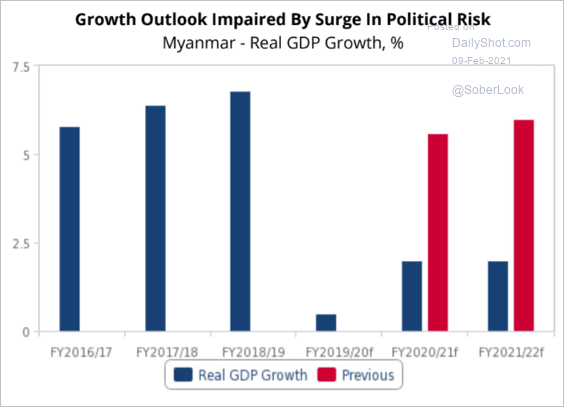 Source: Fitch Solutions Macro Research
7. Population growth across EM is slowing.
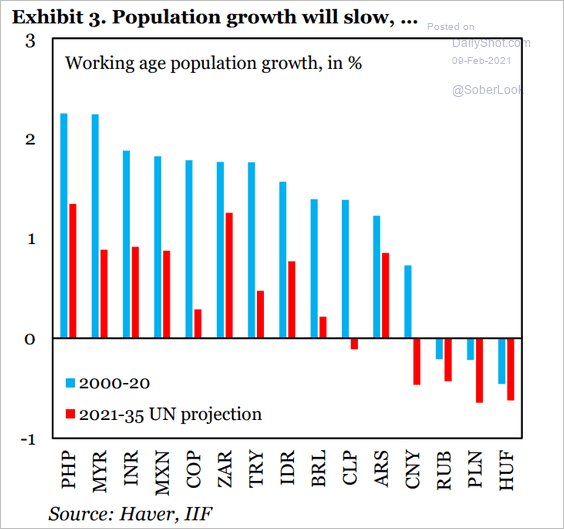 Source: IIF
Back to Index
Cryptocurrency
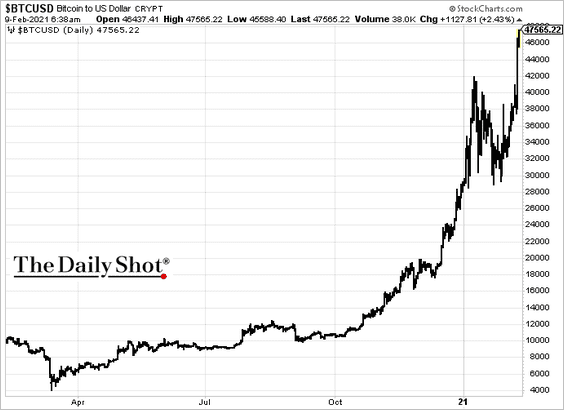
1. Tesla’s Bitcoin purchase sent the cryptocurrency to a new record. Will we see $50k shortly?
 Source: @WSJ Read full article
Miami’s mayor wants to have Bitcoin on the city’s balance sheet.
 Source: Twitter
——————–
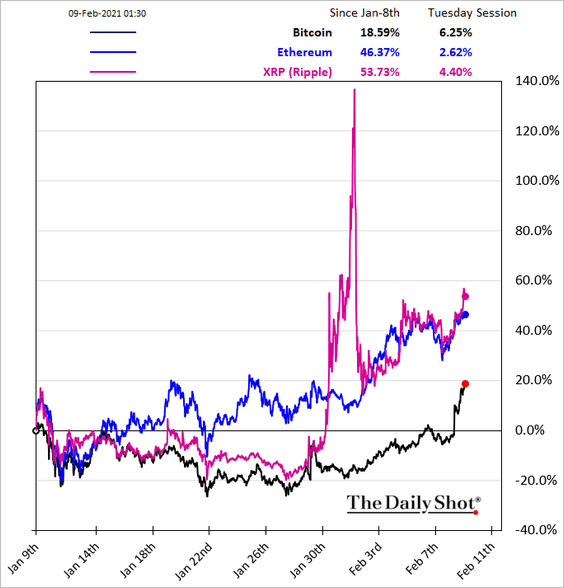
2. Despite Monday’s jump, Ethereum and XRP are still outperforming Bitcoin on a month-to-date basis.
3. Intraday price movements in Bitcoin are more extreme. Nearly every day since mid-December has seen at least one hourly price movement of plus or minus 2%.
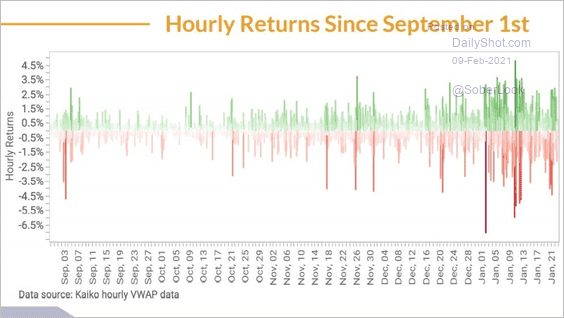 Source: @KaikoData
4. Futures trading volume across crypto assets nearly doubled over the past two quarters.
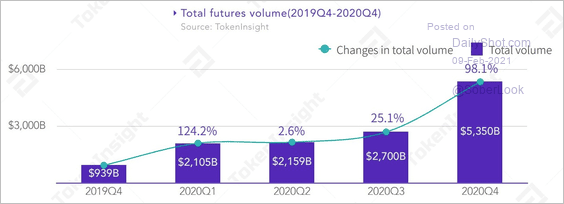 Source: @TokenInsight
5. And here is a look at aggregate Bitcoin spot trading volumes across various exchanges.
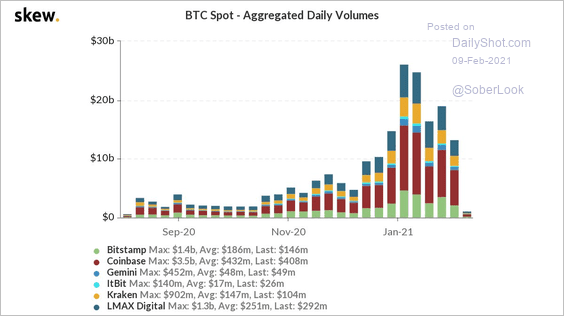 Source: @skewdotcom
6. Who controls the Bitcoin supply?
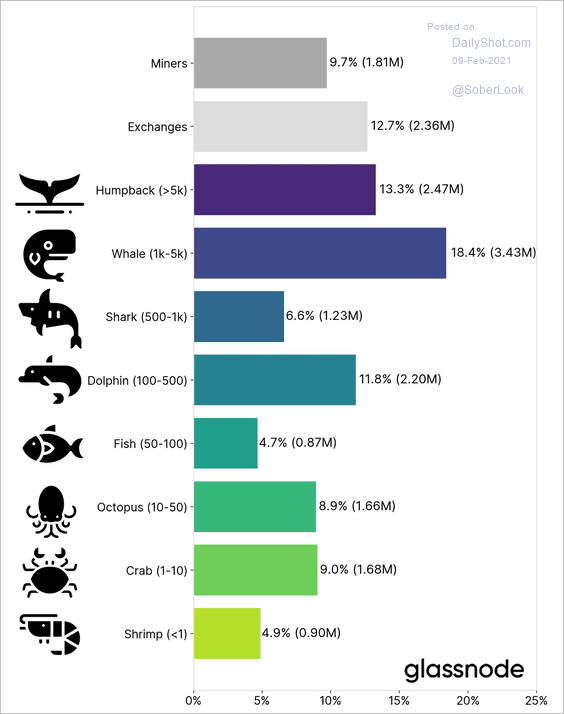 Source: Glassnode Read full article
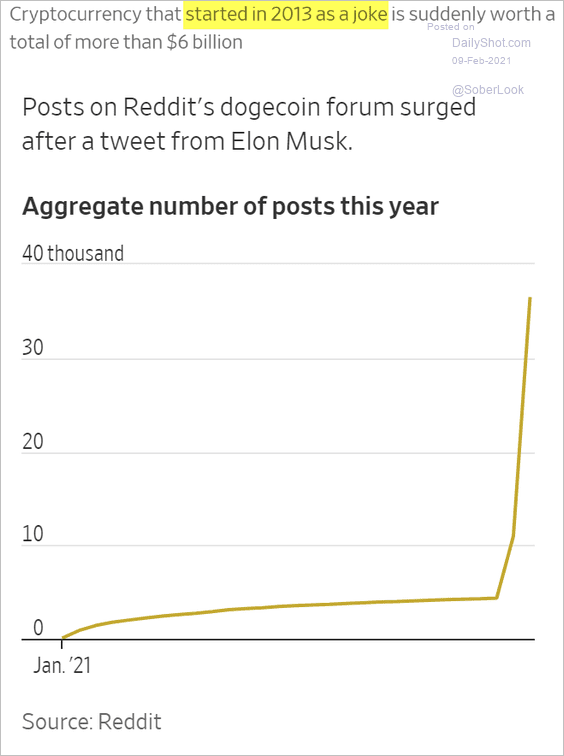
7. The rally in dogecoin continues, which some view as a sign of froth in the crypto market.
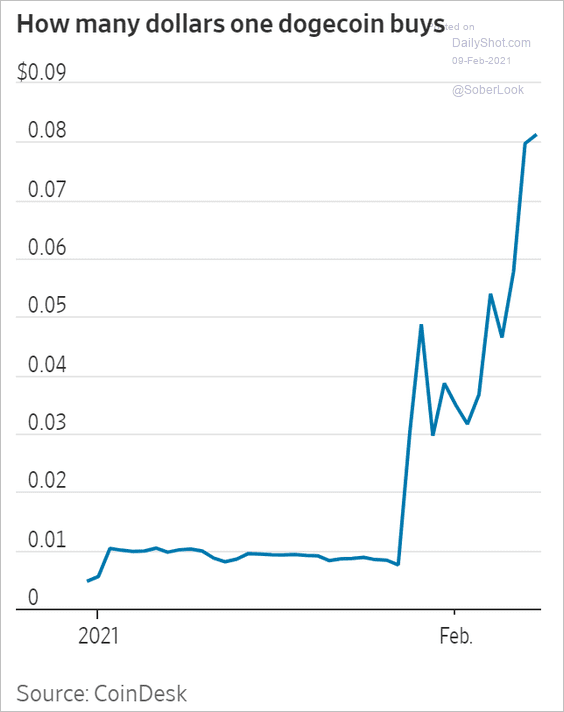 Source: @WSJ Read full article
 Source: @WSJ Read full article
Back to Index
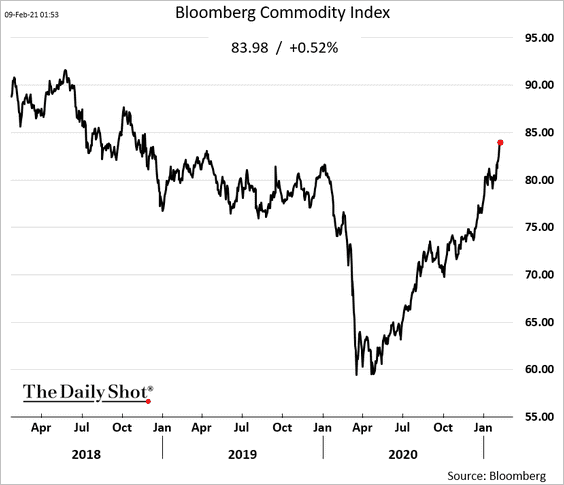
Commodities
1. Let’s start with Bloomberg’s broad commodity index.
82% of the world’s commodities (ex-energy and gold) are producing positive year-over-year returns – the highest since September 2011.
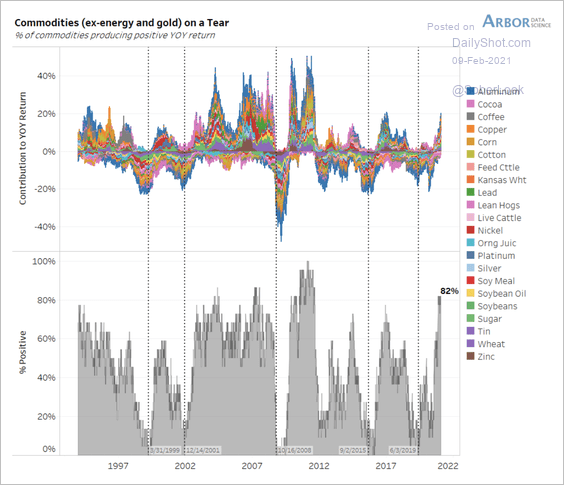 Source: Arbor Research & Trading
——————–
2. The gold/silver ratio has been declining, supported by a weaker dollar.
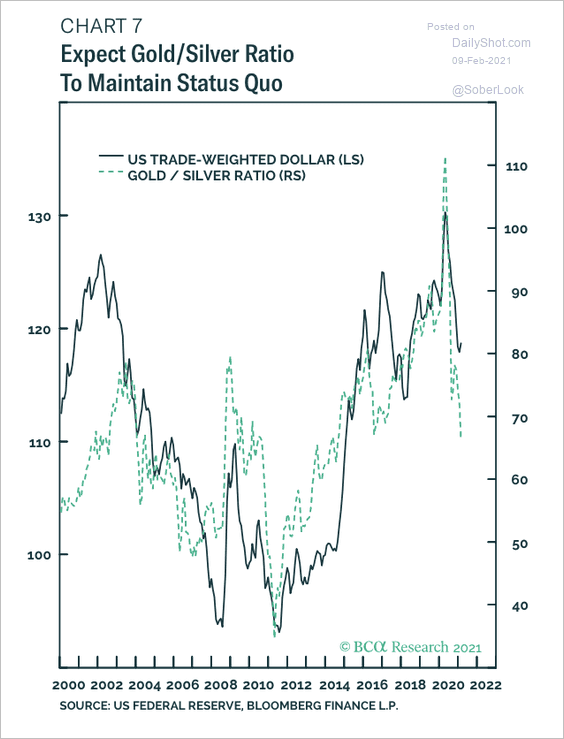 Source: BCA Research
3. Silver supplies have been tightening.
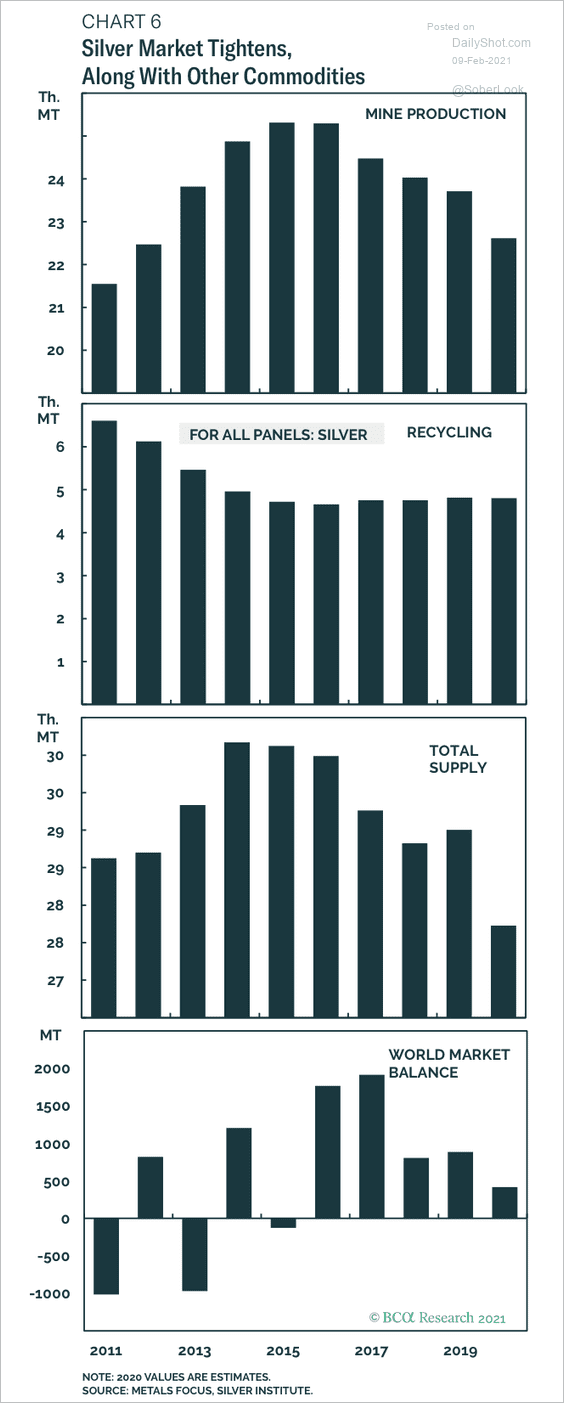 Source: BCA Research
4. Copper inventories are relatively low.
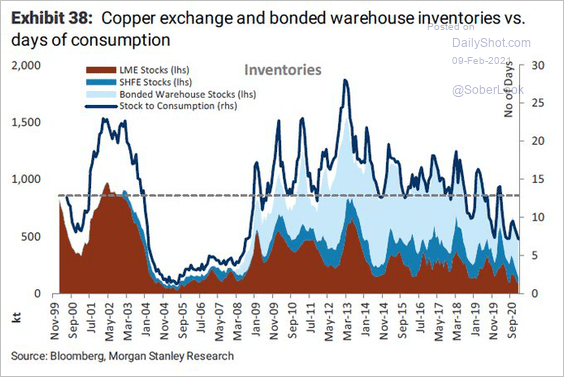 Source: Morgan Stanley Research; @Scutty
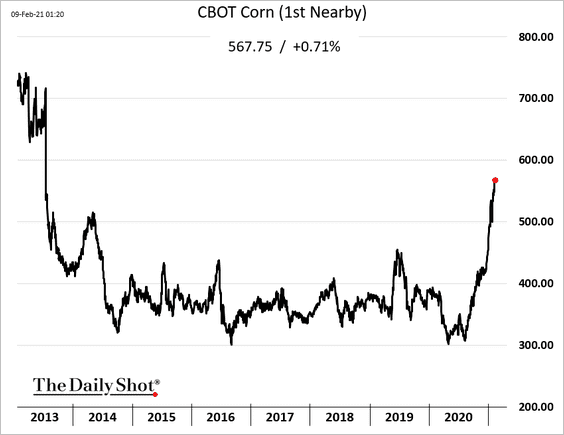
5. US corn futures keep climbing.
6. Global food prices have been rallying strongly over the past year.
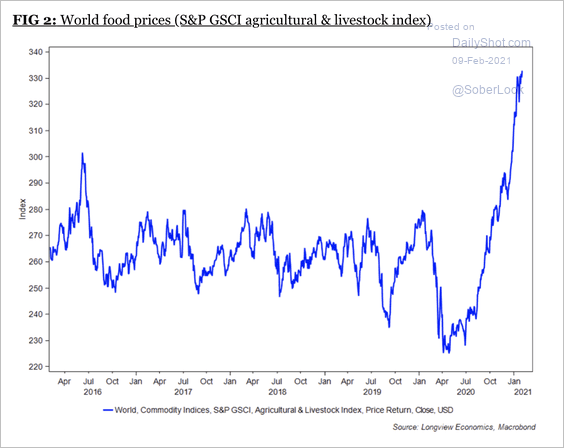 Source: Longview Economics
Back to Index
Energy
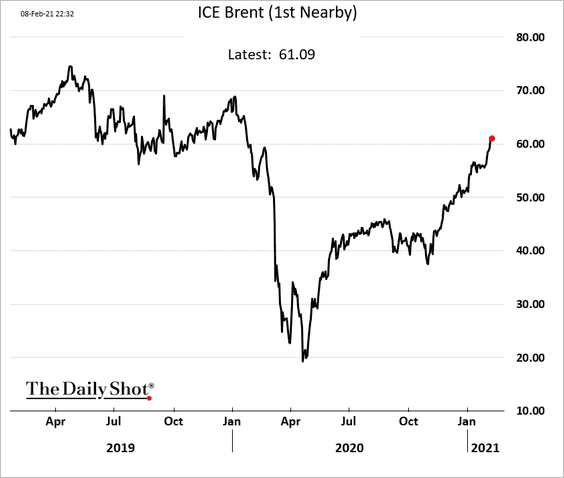
1. Brent crude is trading above $62/bbl.
2. US retail gasoline prices are nearing pre-COVID levels.
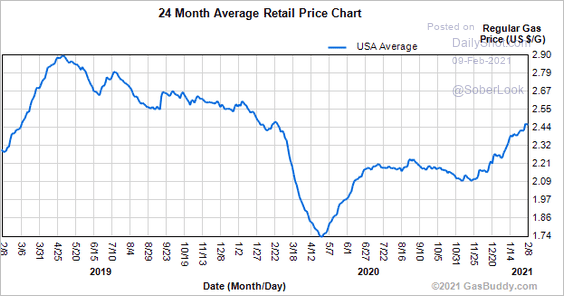 Source: GasBuddy
Back to Index
Equities
1. US indices continue to hit new highs, with the Russell 2000 index (small caps) outperforming the S&P 500 by 20% over the past year.
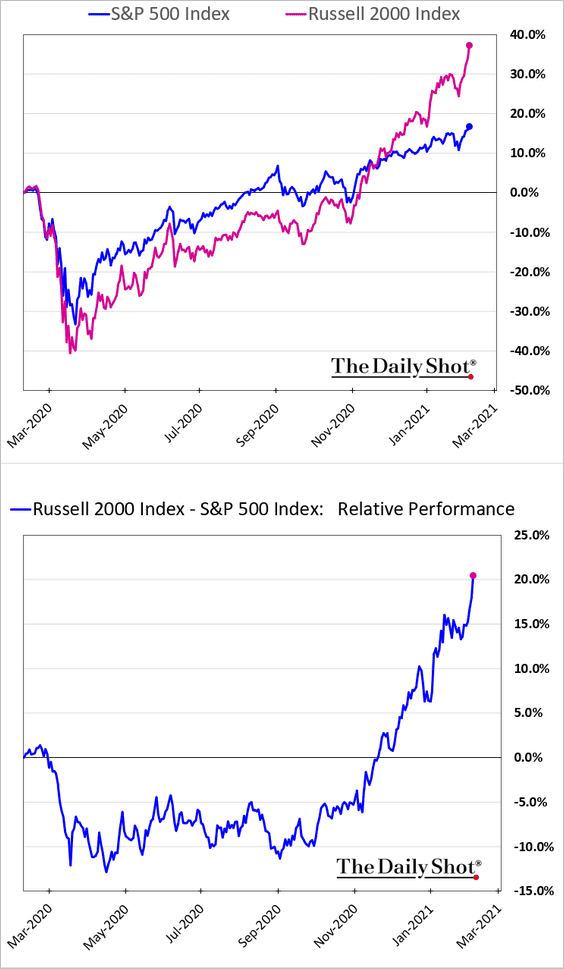
Here is the Russell 2000 vs. its 200-day moving average.
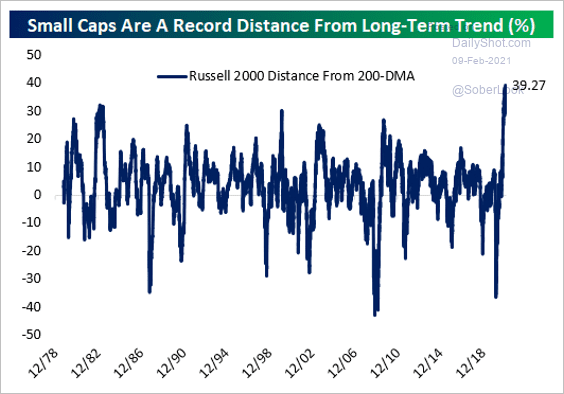 Source: @bespokeinvest Read full article
——————–
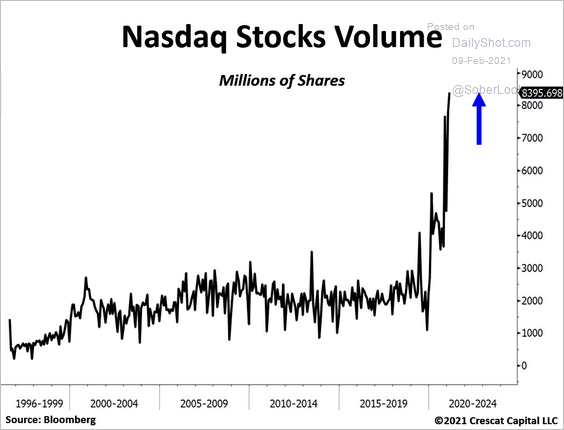
2. Trading volumes have spiked.
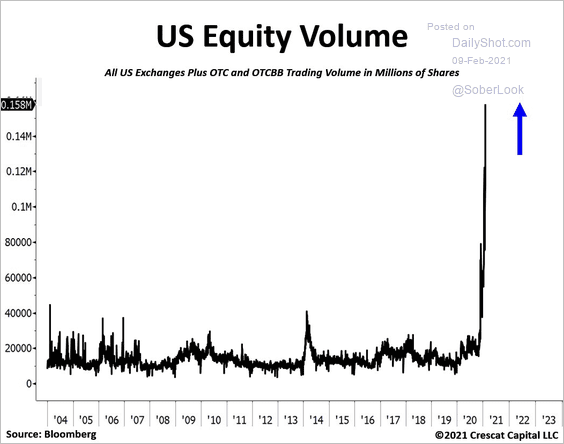 Source: @TaviCosta
 Source: @TaviCosta
——————–
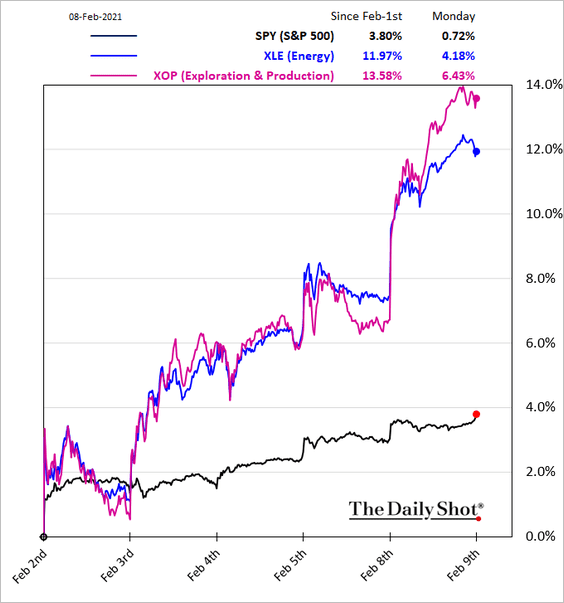
3. The reflation trade is in full swing again, supported by fund flows.
• Energy:
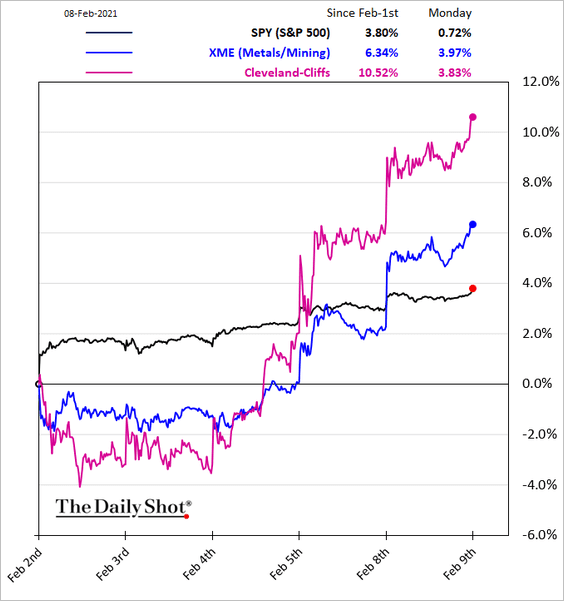
• Metals & Mining:
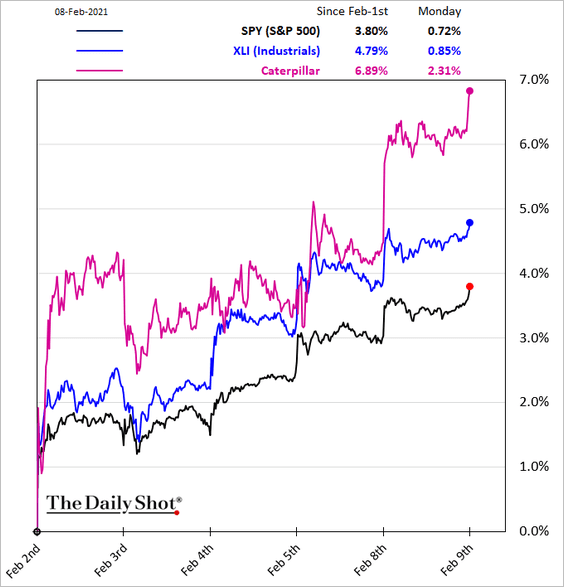
• Industrials:
• Airlines:

• Homebuilders:
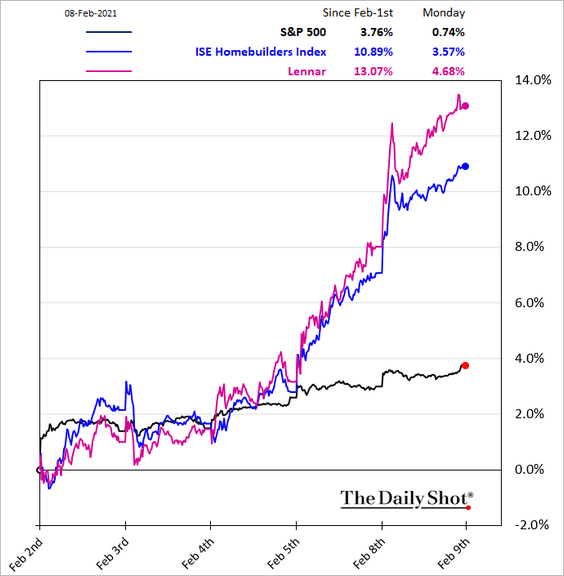
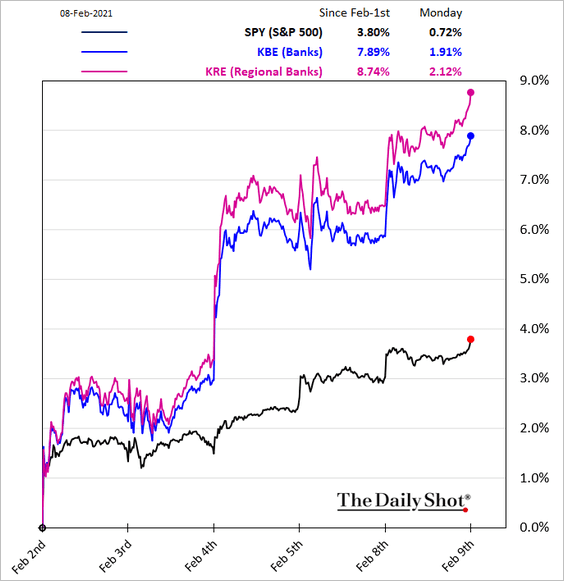
Banks have also been surging in response to higher bond yields. The second chart below shows sector sensitivity to Treasury yields.
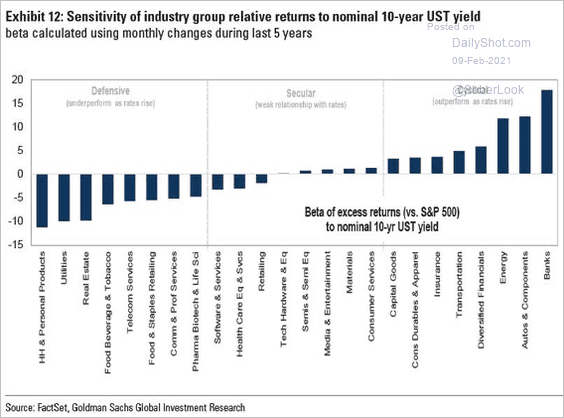 Source: Goldman Sachs Read full article
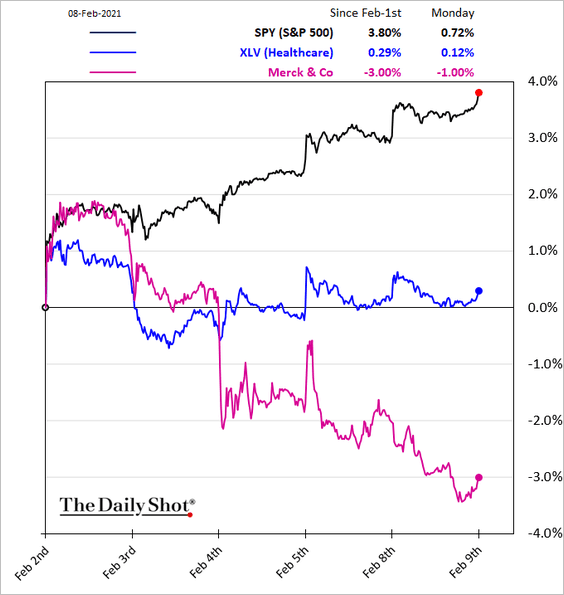
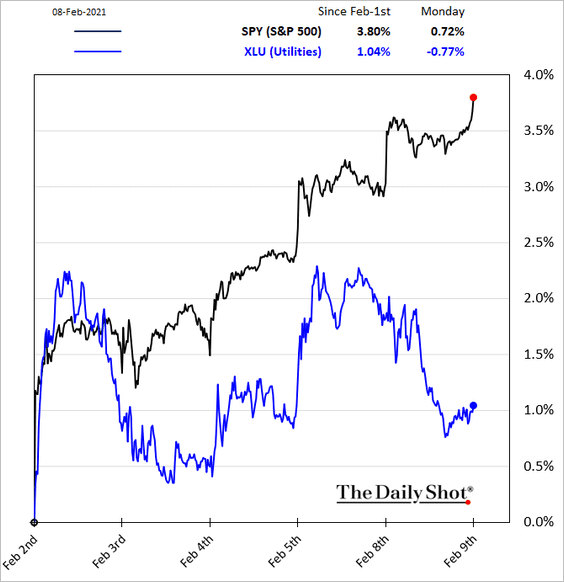
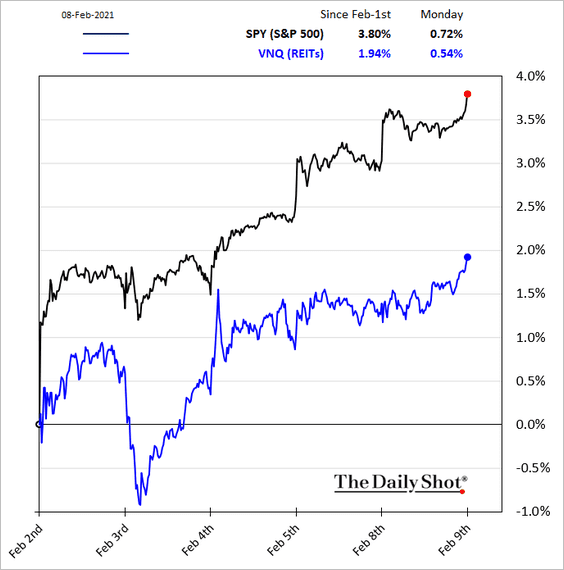
On the other hand, defensive sectors have been underperforming.
• Healthcare:
• Consumer Staples:
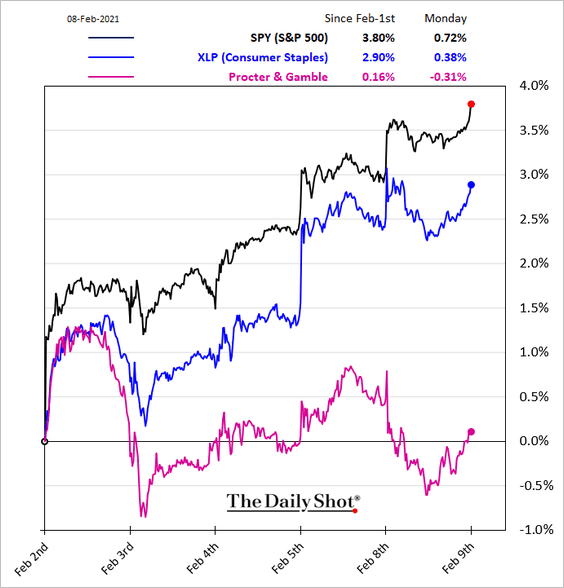
• Utilities:
• REITs:
——————–
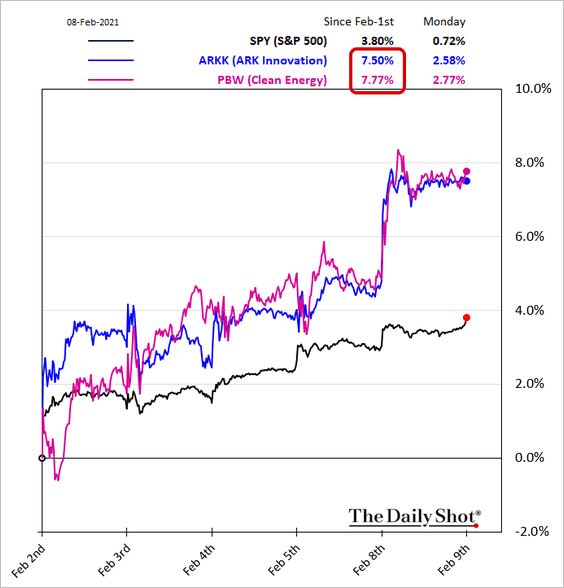
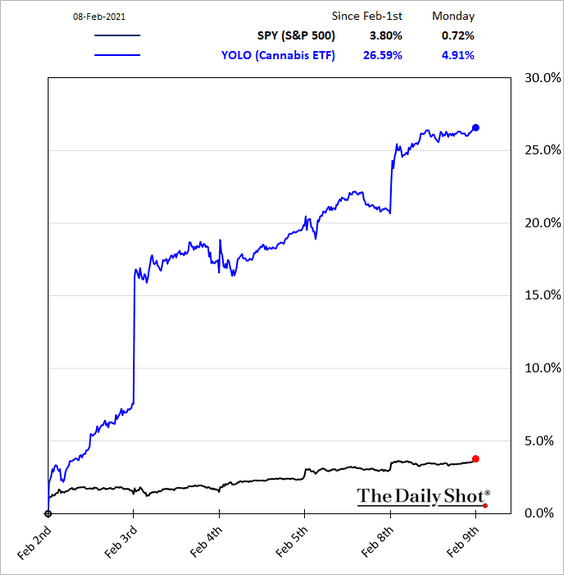
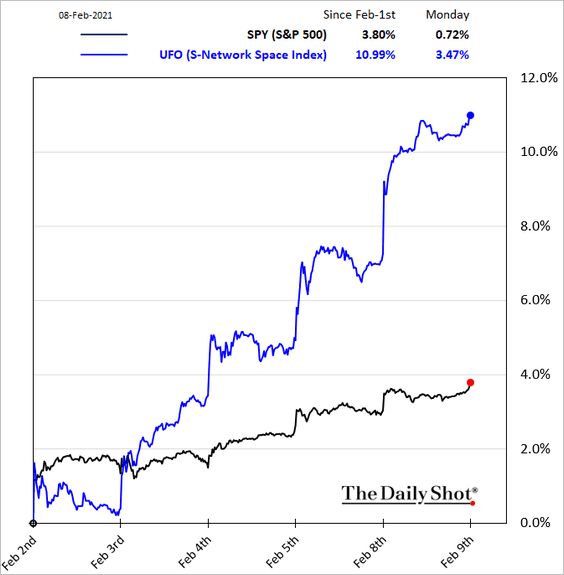
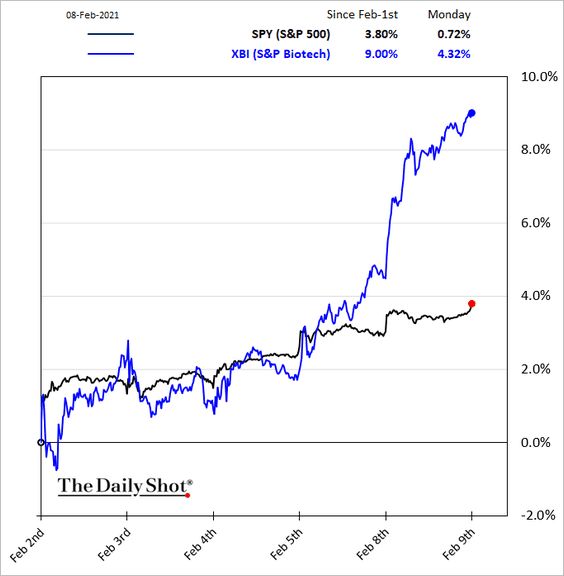
4. Retail favorite thematic plays keep outperforming.
• ARK Innovation and clean energy:
• Cannabis:
• Space:
• Biotech:
——————–
5. This chart shows the annualized month to month return relative to risk across S&P 500 industries.
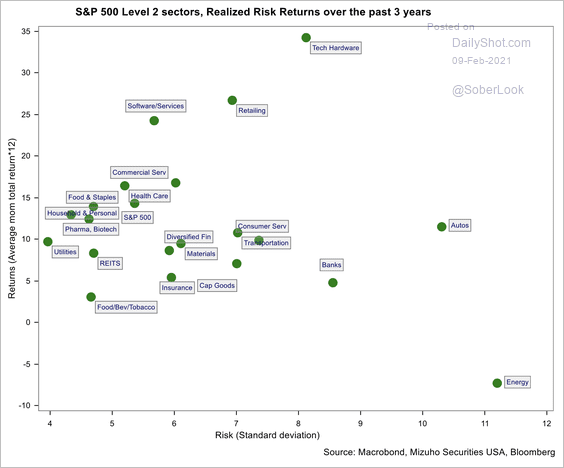 Source: Mizuho Securities USA
6. Here is the composition of fund flows.
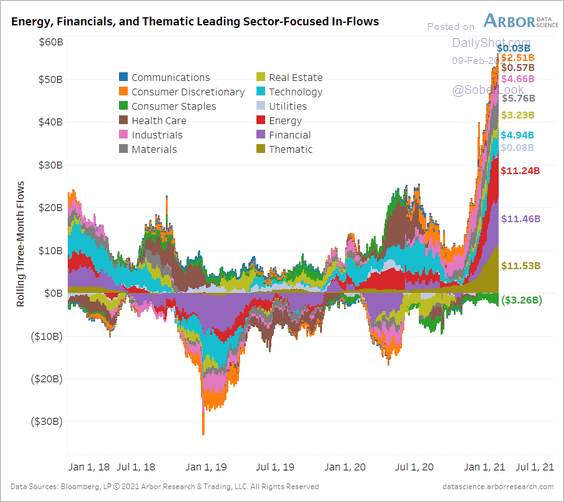 Source: Arbor Research & Trading
7. Excess personal savings have been driving the market to record highs.
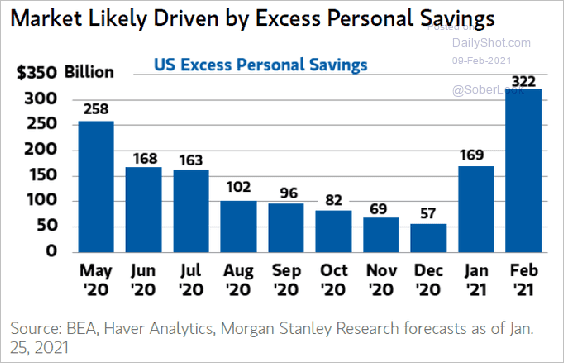 Source: @ISABELNET_SA, @MorganStanley
8. How does the increase in Treasury yields impact the stock market?
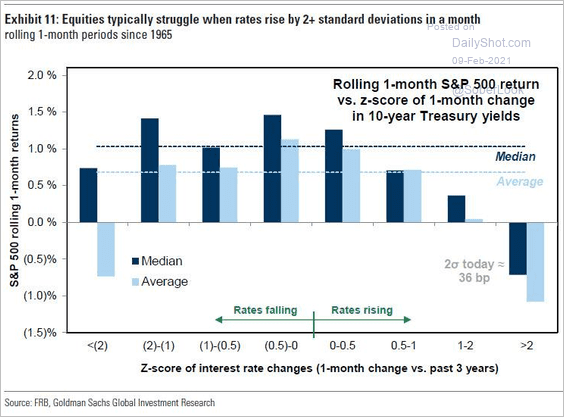 Source: Goldman Sachs
9. Valuations matter over the long-term.
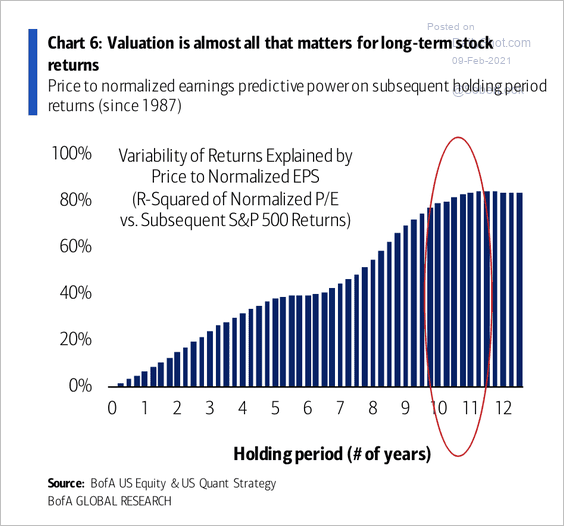 Source: BofA Global Research
BofA expects S&P 500 returns of about 3% over the next decade based on current valuations.
 Source: BofA Global Research
——————–
10. US stocks have diverged from the EUR/USD exchange rate.
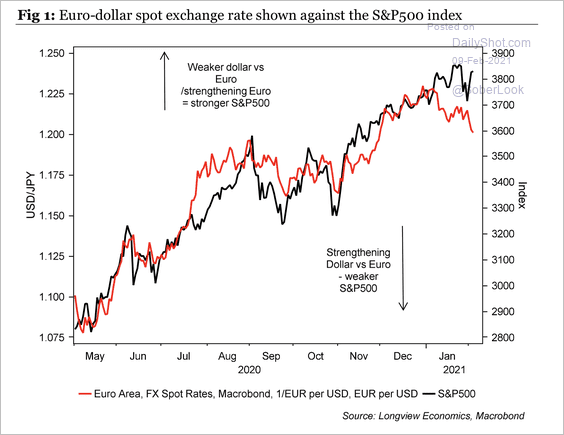 Source: Longview Economics
Back to Index
Credit
1. US high-yield issuance is off to a strong start this year.
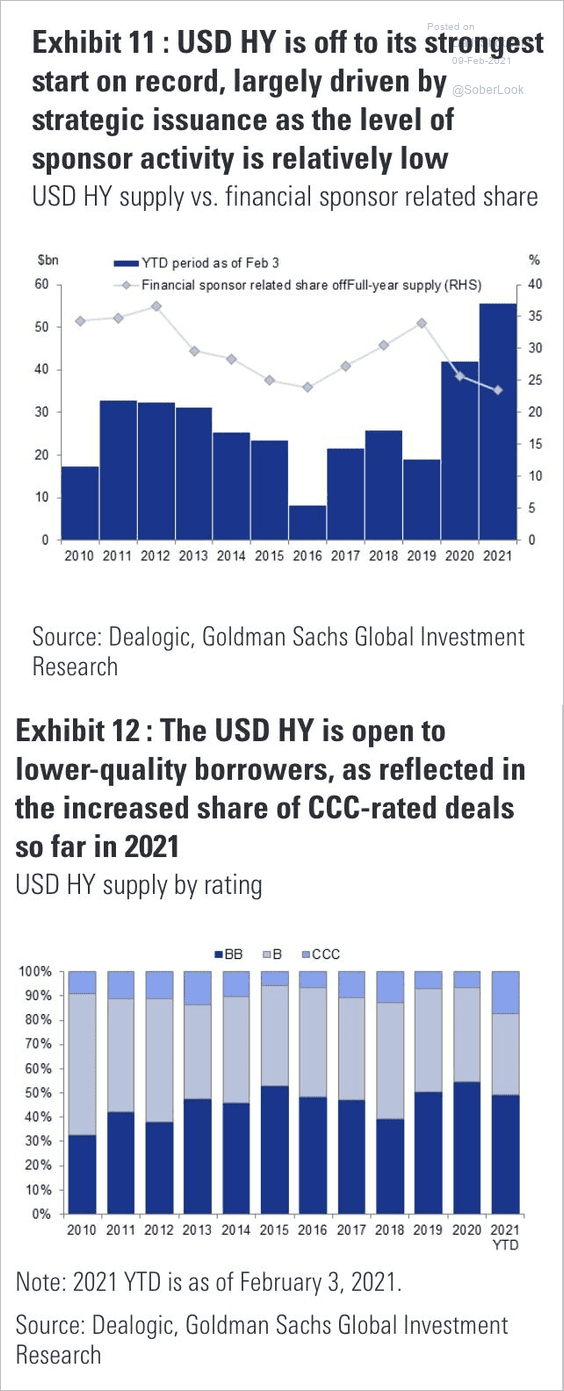 Source: Goldman Sachs, James W.
2. Fewer lenders have been tightening credit on business loans.
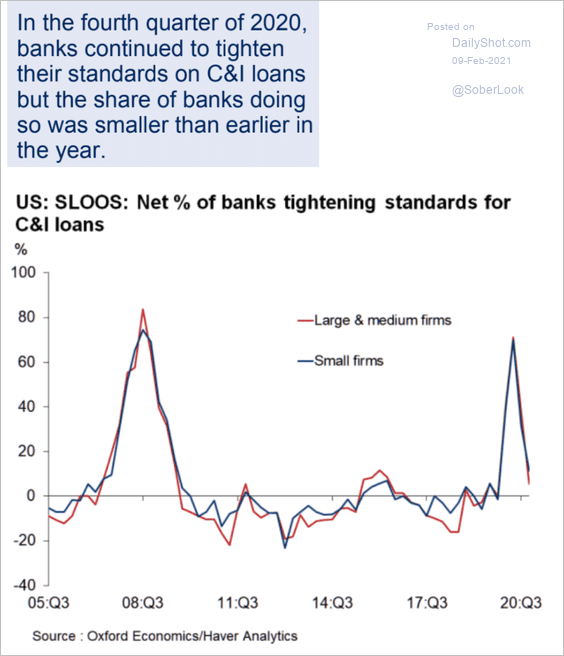 Source: Oxford Economics
3. Bank credit growth has fallen along with inflation.
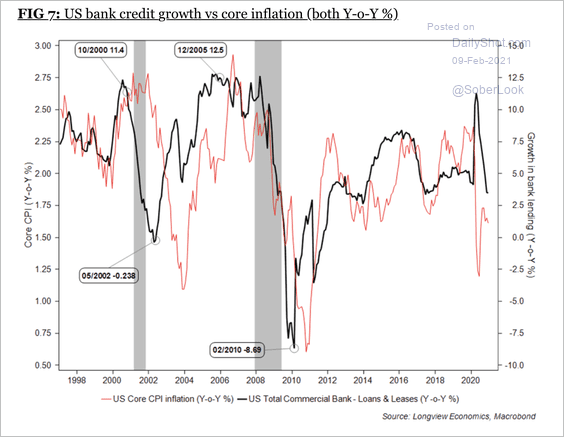 Source: Longview Economics
Back to Index
Rates
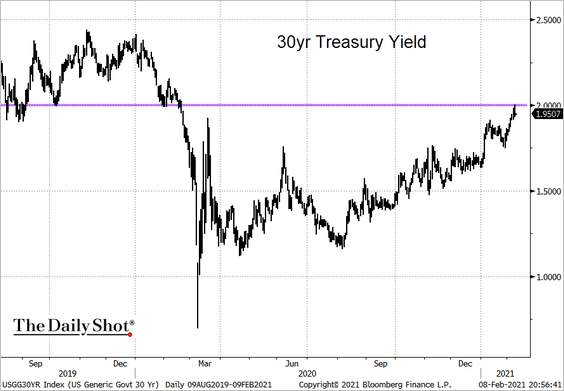
1. The long-bond yield held resistance at 2%.
2. The 5-year TIPS yield (implied real rates) is approaching -2%. This trend points to extraordinarily accommodative monetary conditions.
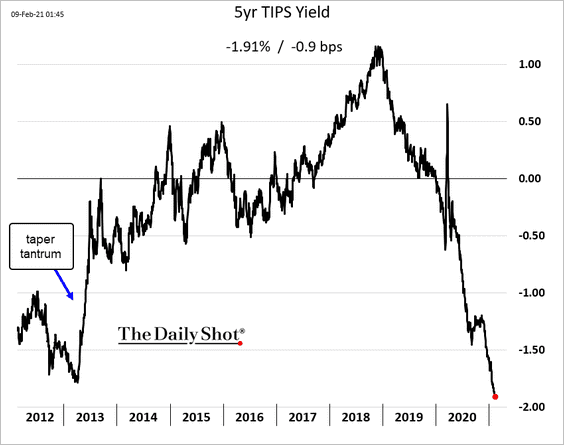
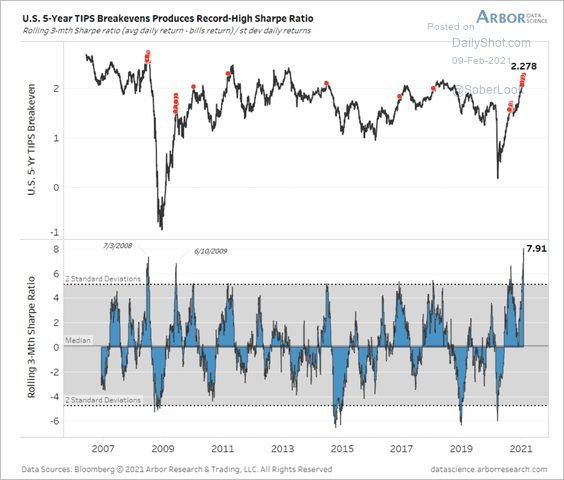
The 5-year TIPS (prices) have a Sharpe ratio of 7.91 over the past three months – an extreme relative to historical peaks.
 Source: Arbor Research & Trading
——————–
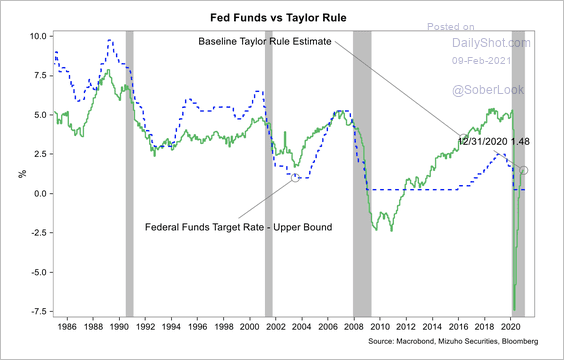
3. Monetary policy is less restrictive than the Taylor Rule implies.
 Source: Mizuho Securities USA
4. How do yields change after a new congress?
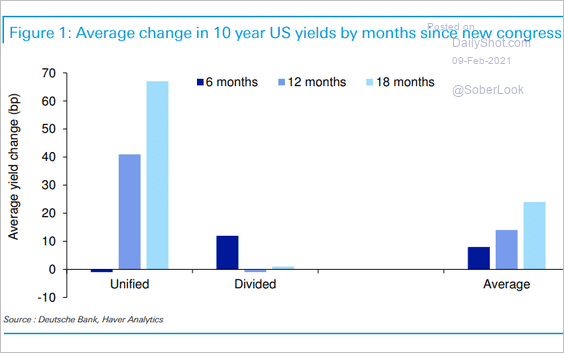 Source: Deutsche Bank Research
Back to Index
Global Developments
1. What can we learn from Israel’s vaccination program (40% of the population vaccinated)?
• Vaccinations by age:
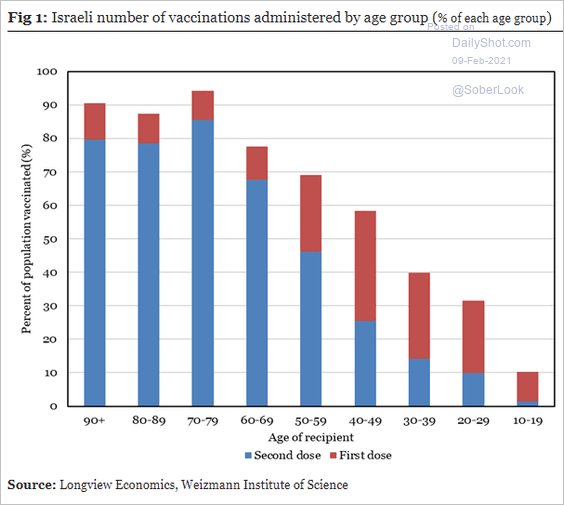 Source: Longview Economics
• Cases and hospitalizations by age:
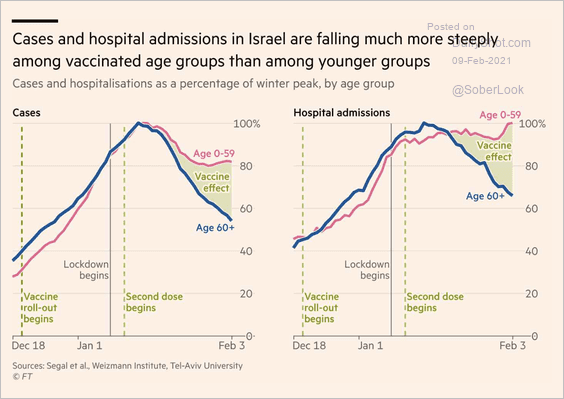 Source: @financialtimes Read full article
• Total cases and deaths:
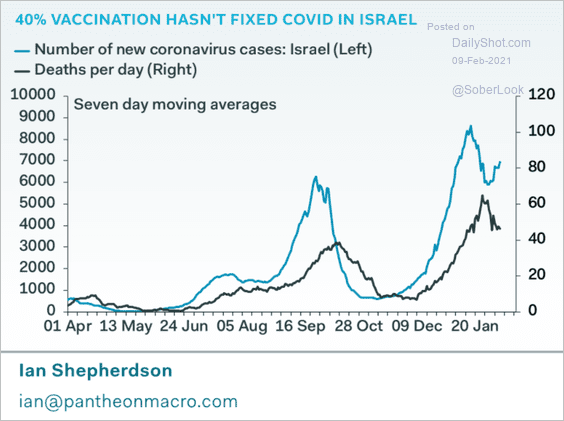 Source: Pantheon Macroeconomics
——————–
2. This chart shows the Citi Global Risk Aversion Index.
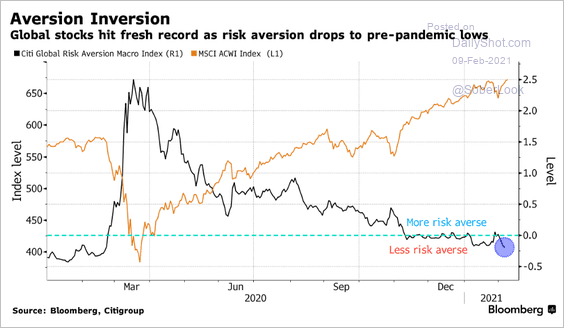 Source: @business Read full article
3. Nominal GDP is outstripping borrowing costs in Germany, UK, Japan, and France.
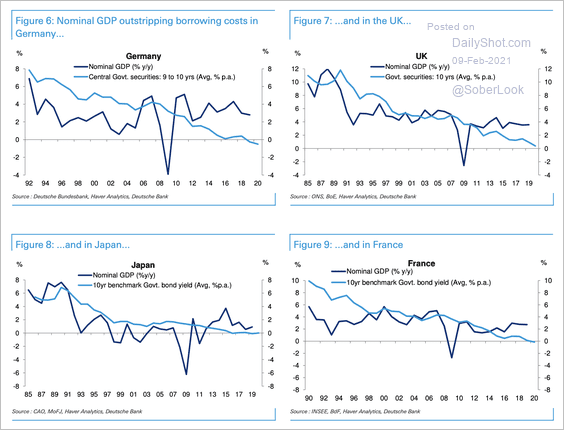 Source: Deutsche Bank Research
——————–
Food for Thought
1. Americans’ trust in media:
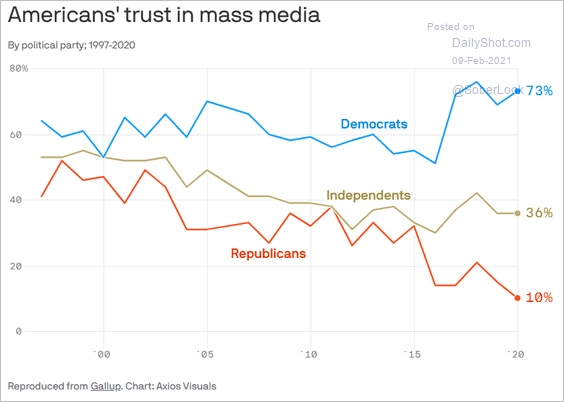 Source: @axios Read full article
2. CO2 emissions from domestic aviation:
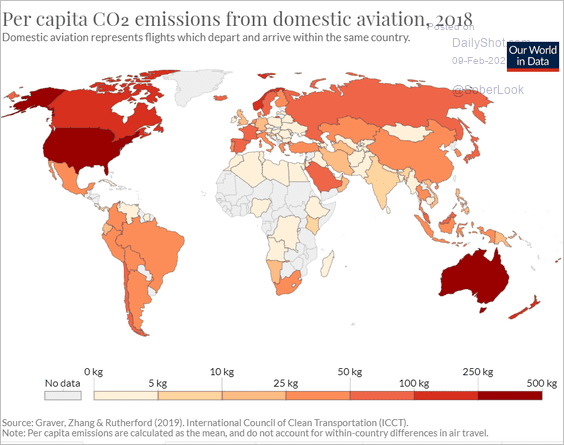 Source: Our World in Data
3. US abortion rate:
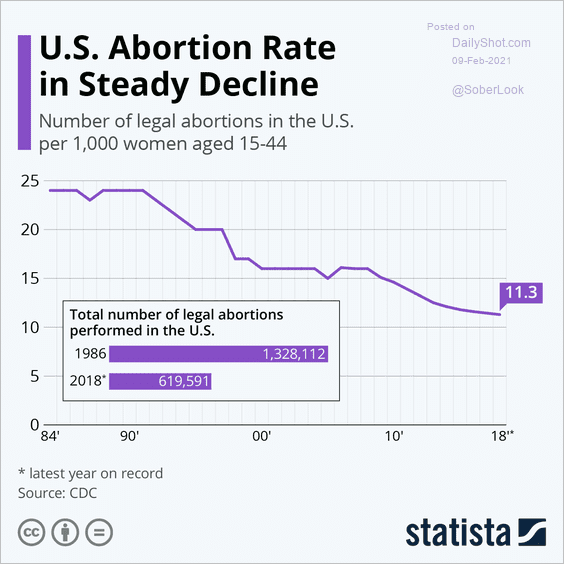 Source: Statista
4. Views on national coronavirus responses:
 Source: Pew Research Center Read full article
5. US vaccination progress:
 Source: @axios Read full article
6. Americans’ views on China and Russia:
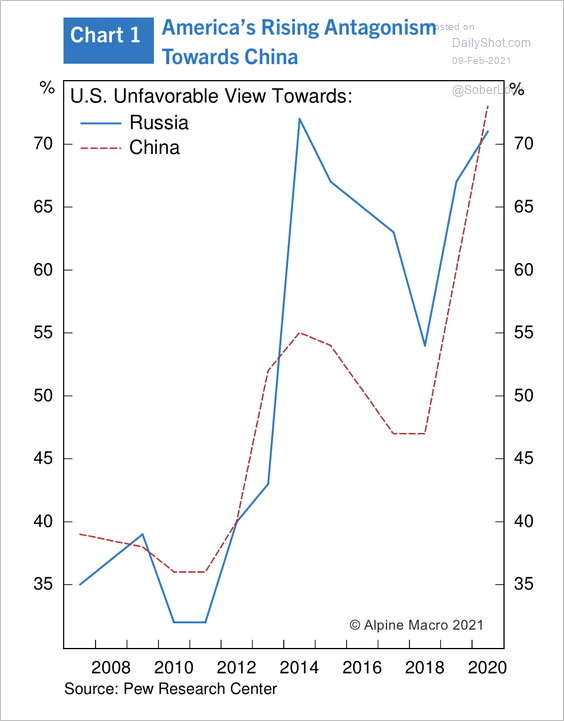 Source: Alpine Macro
7. Approximate duration of European rule in modern Asian countries since the 15th century:
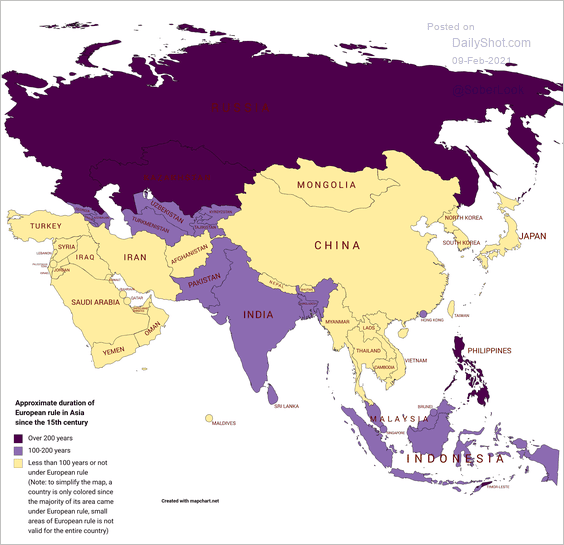 Source: reddit
8. Super Bowl updates:
• Self-reported viewership:
 Source: @MorningConsult, @AlexMSilverman Read full article
• Super Bowl vs. FIFA World Cup:
 Source: Statista
——————–
9. Active volcanoes:
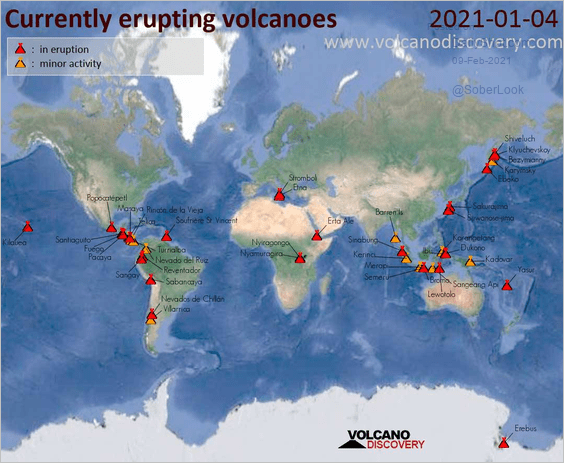 Source: VolcanoDiscovery
——————–
Back to Index