
The Daily Shot: 18-Feb-21
• The United States
• Canada
• The United Kingdom
• Europe
• Asia – Pacific
• China
• Emerging Markets
• Cryptocurrency
• Commodities
• Energy
• Equities
• Credit
• Global Developments
• Food for Thought
The United States
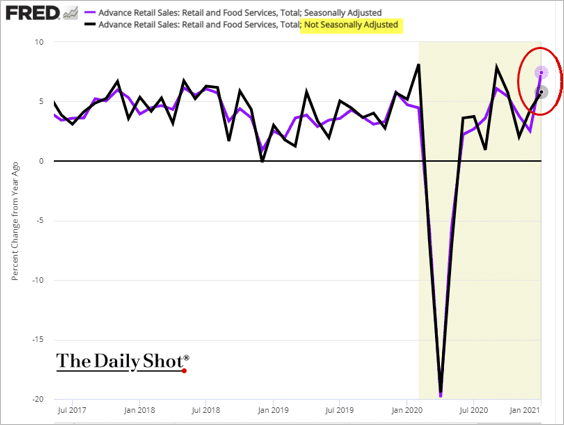
1. According to the latest reports, the nation’s economy is heating up. Boosted by the last batch of stimulus checks, retail sales surged in January (well above forecasts).
• Month-over-month:
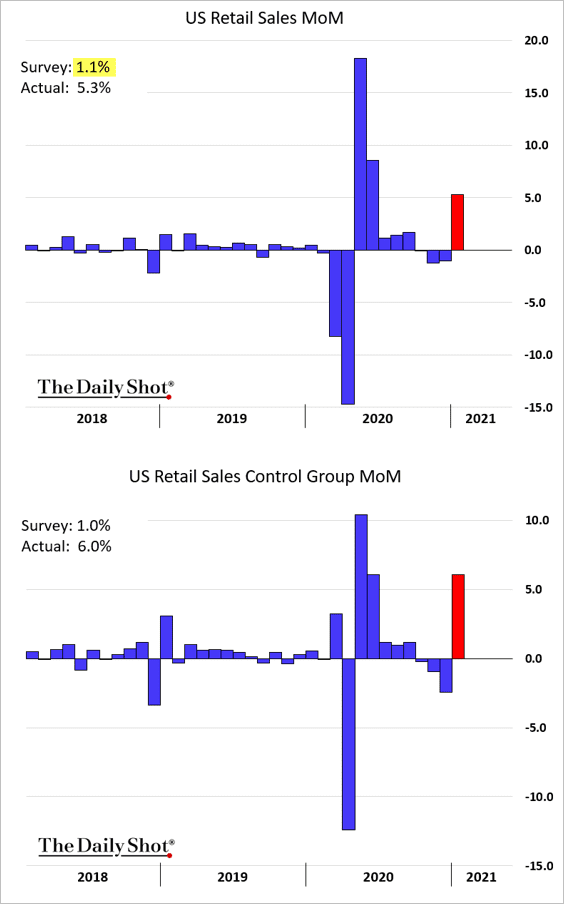
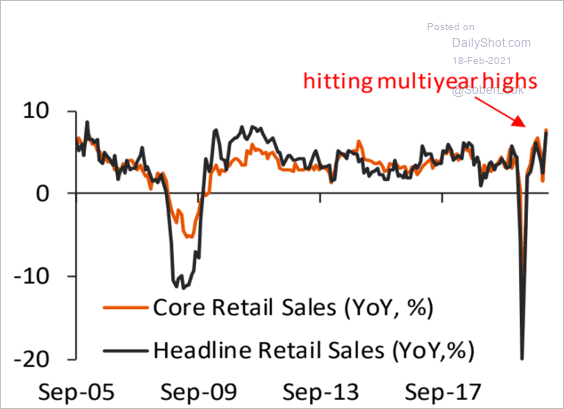
• Year-over-year:
 Source: Piper Sandler
 Source: @WSJ Read full article
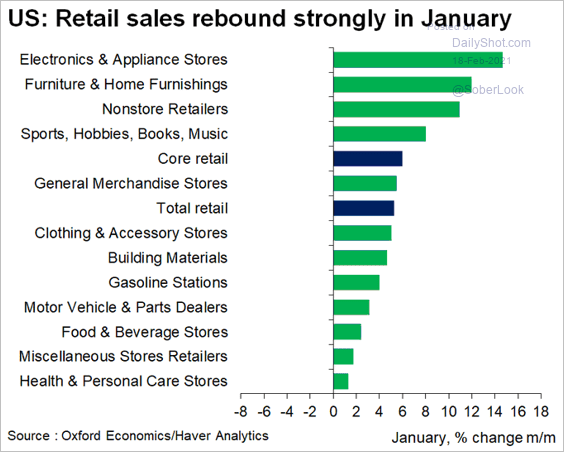
Sales at department stores spiked.

Below is the breakdown by sector.
 Source: @GregDaco
And this chart compares the retail sales trajectory with the 2008 downturn.
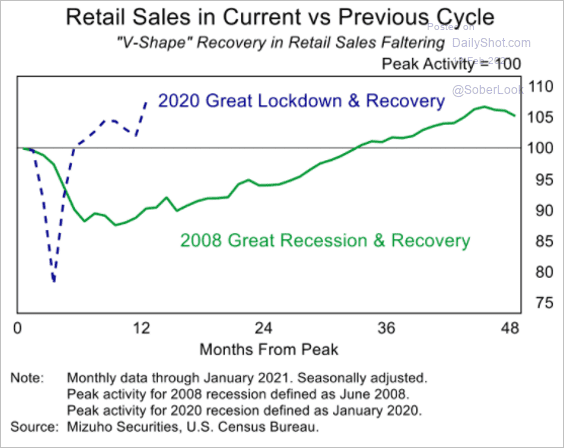 Source: Mizuho Securities USA
It’s worth noting that there may be some noise in these figures due to seasonal adjustments.
——————–
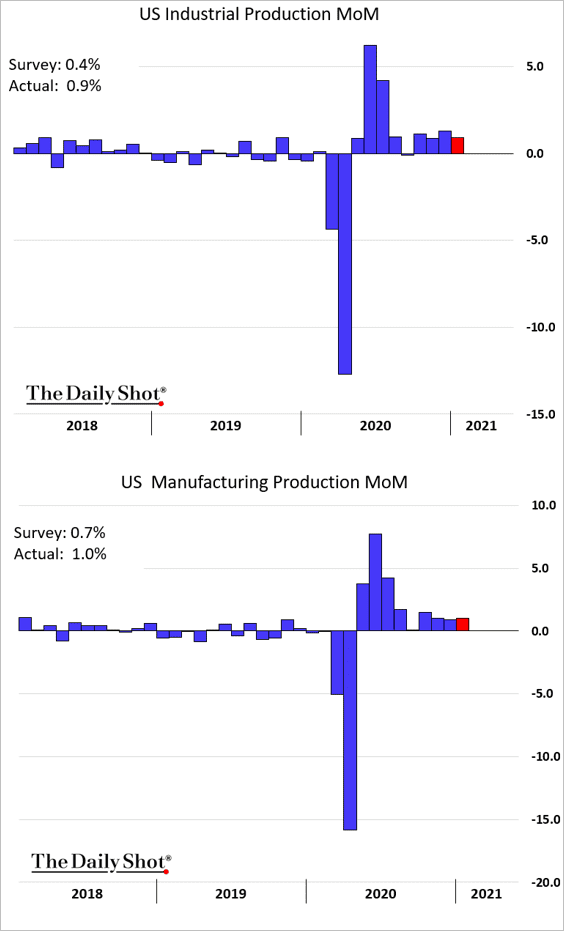
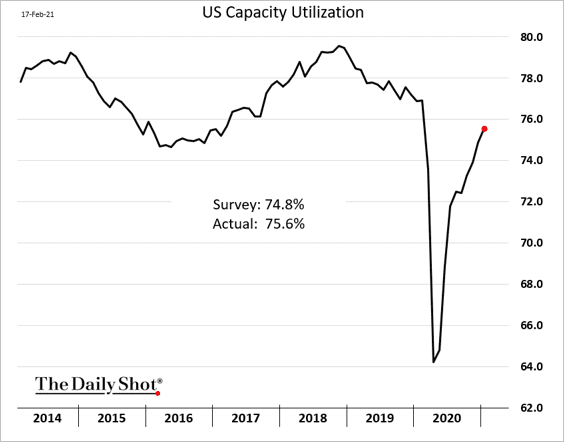
2. US industrial output also exceeded forecasts.
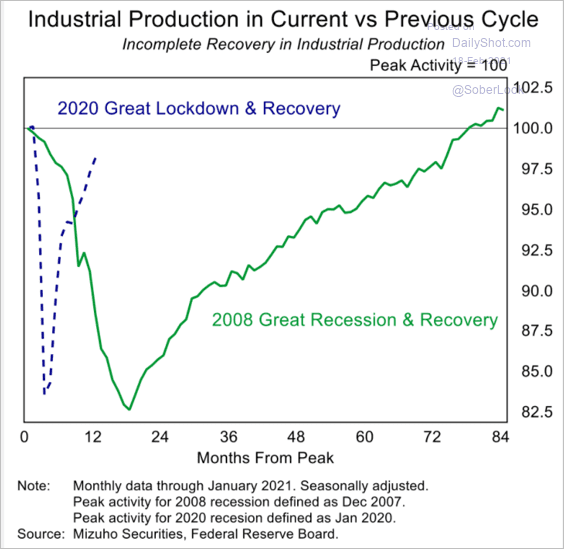
Here is a comparison to 2008.
 Source: Mizuho Securities USA
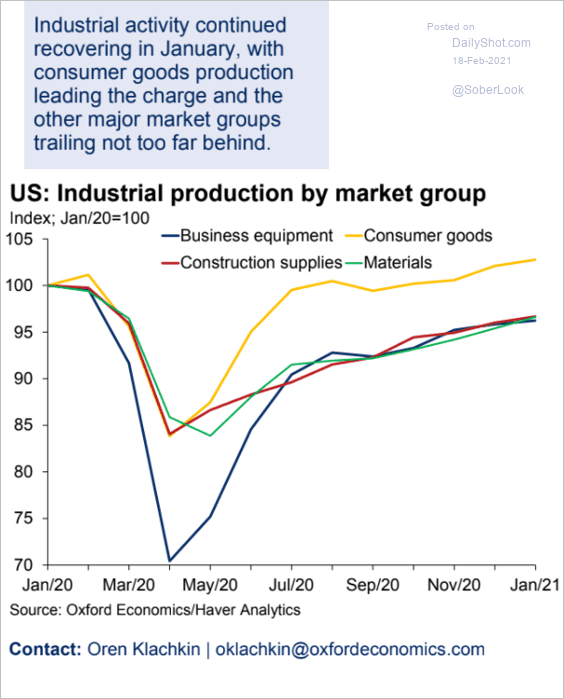
And this is the breakdown by market group.
 Source: Oxford Economics
Capacity utilization has almost recovered.
——————–
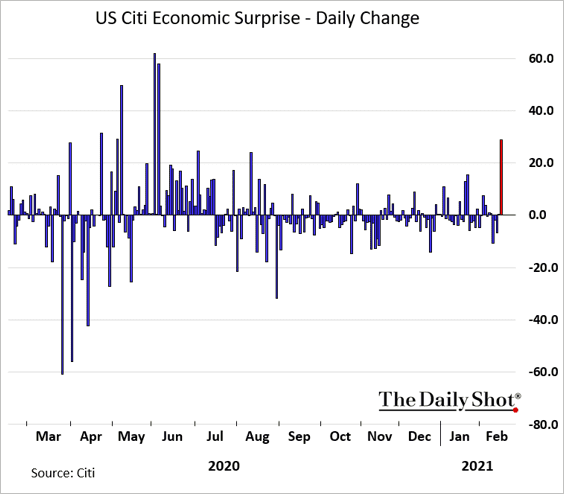
3. The Citi Economic Surprise Index jumped as a result of the above reports.
The Atlanta Fed’s model Q1 GDP growth estimate is now above 9%.
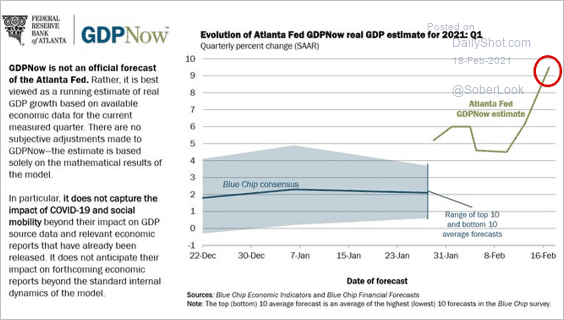 Source: @AtlantaFed Read full article
——————–
4. Other indicators also show economic recovery (we will go over housing market data tomorrow).
• Small business sales:
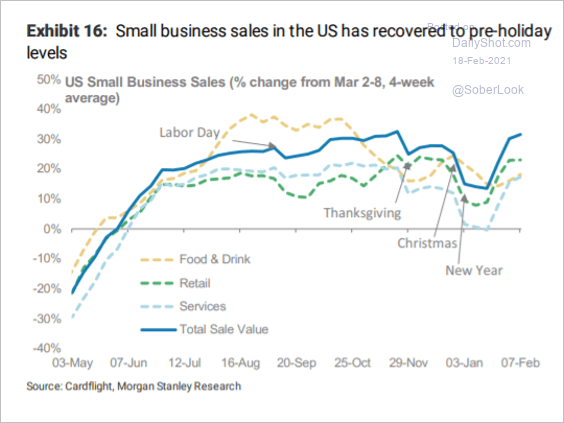 Source: Morgan Stanley Research
• The Evercore ISI trucking survey:
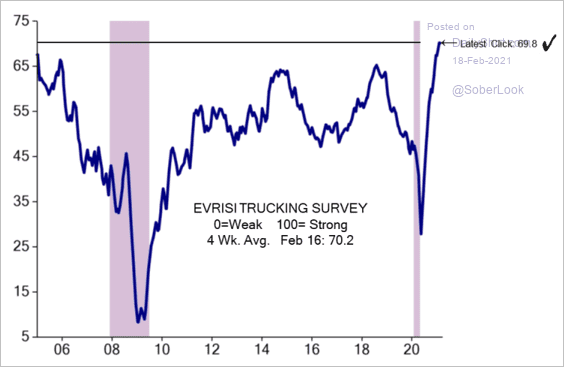 Source: Evercore ISI
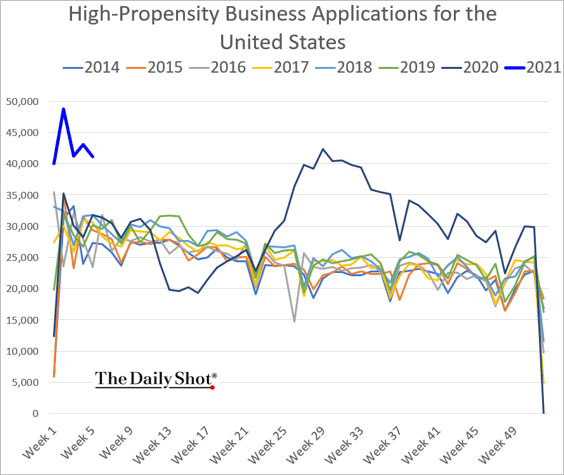
• Business formation:
——————–
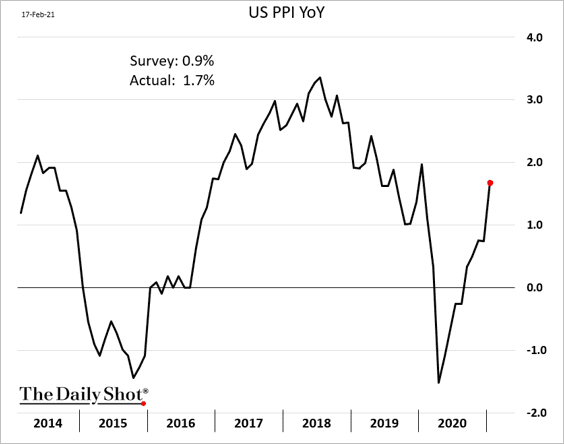
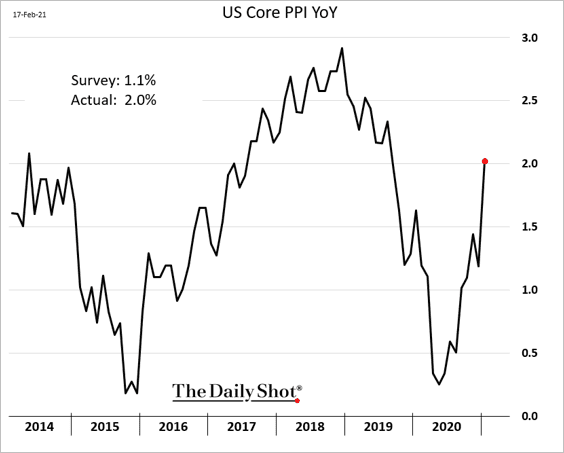
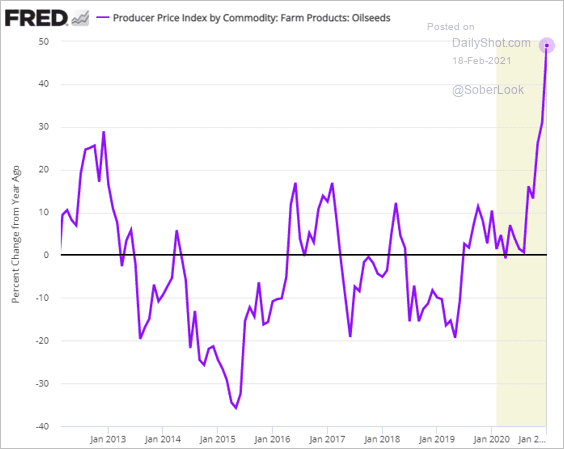
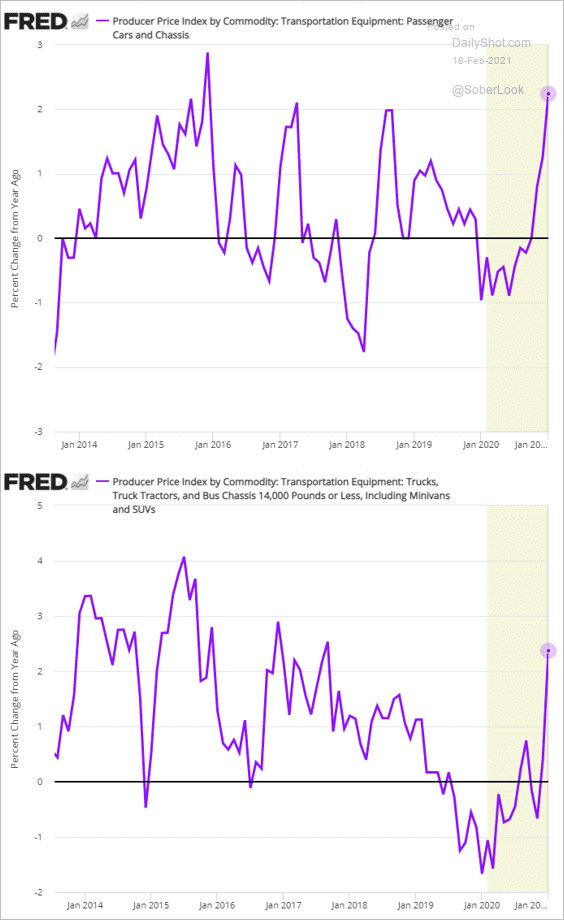
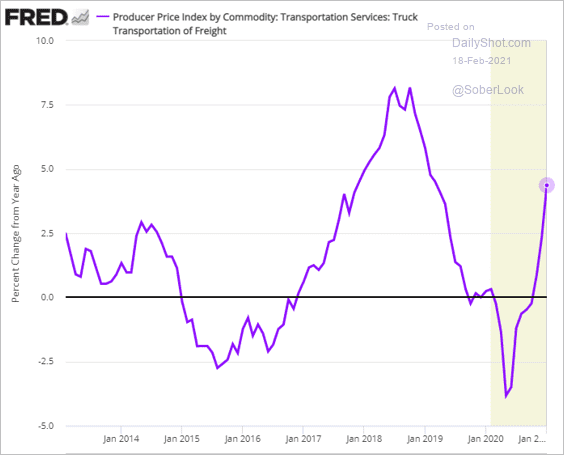
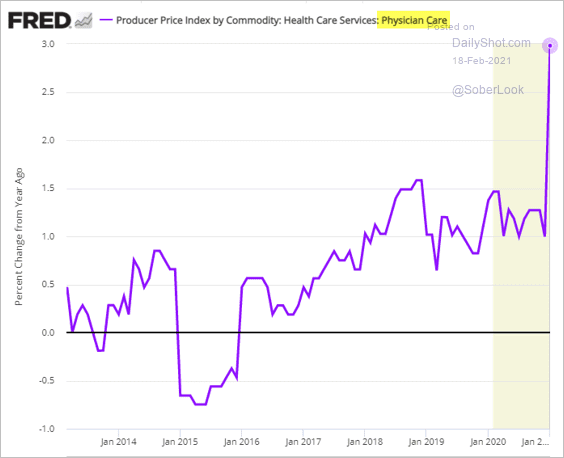
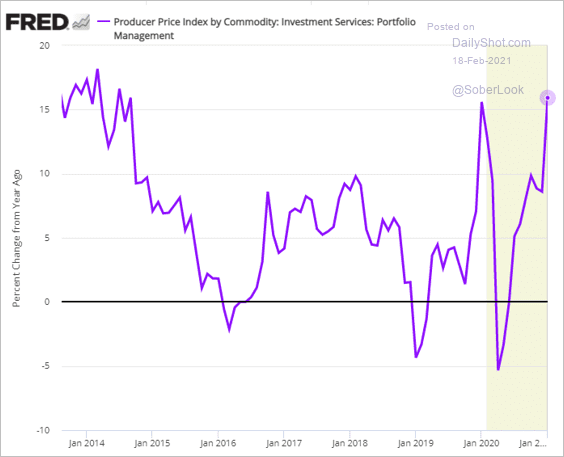
5. Producer prices soared last month – a trend that manufacturers have been reporting for some time.
 Source: Reuters Read full article
• Month-over-month:
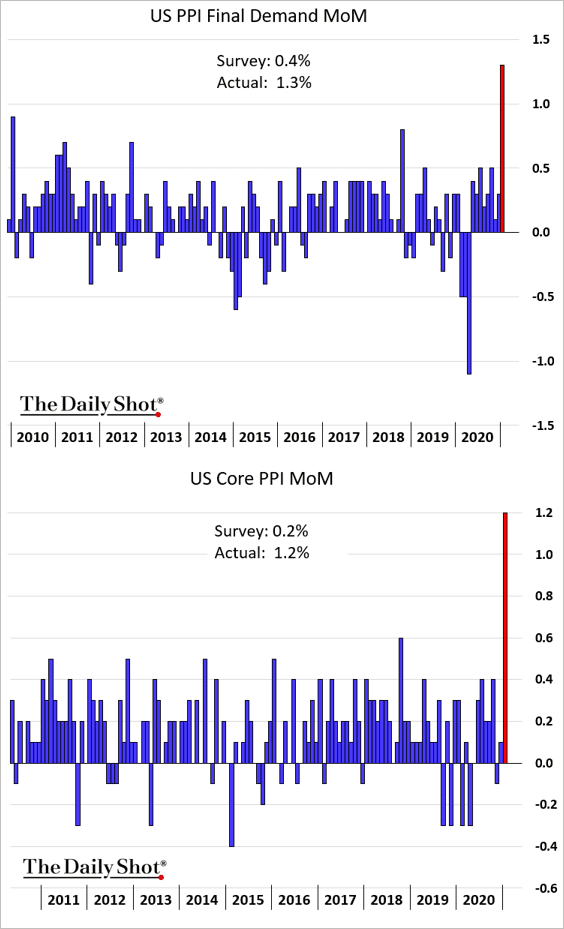
• Year-over-year:
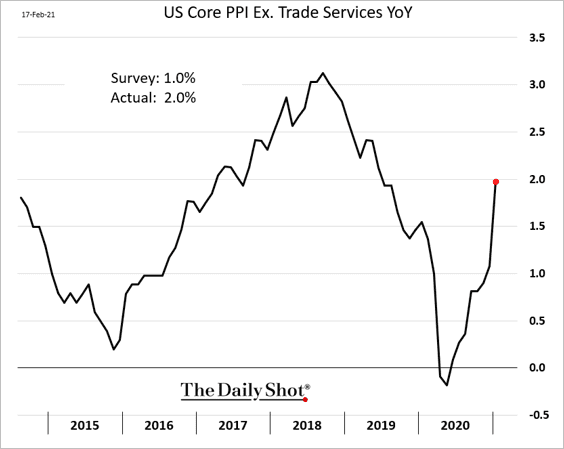
Here is the core PPI excluding (volatile) trade services.
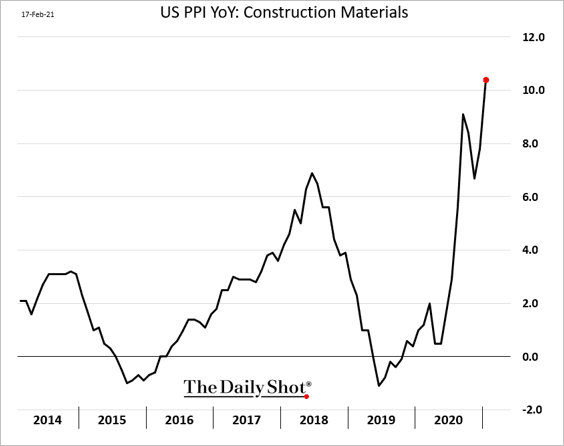
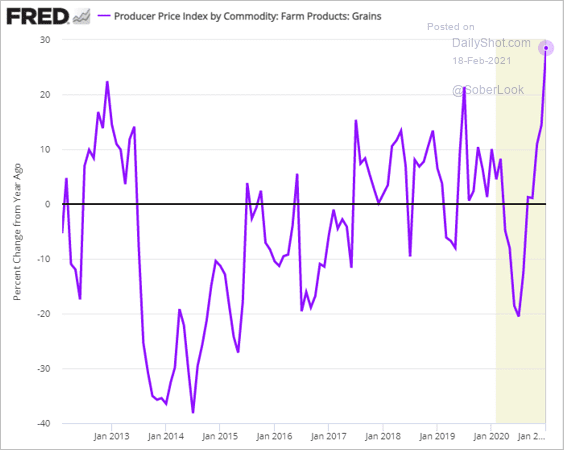
• Next, we have some components of the PPI index.
– Construction materials (driven by lumber):
– Grains:
– Oilseeds:
– Cars and small trucks:
– Truck transportation of freight:
– Medical services:
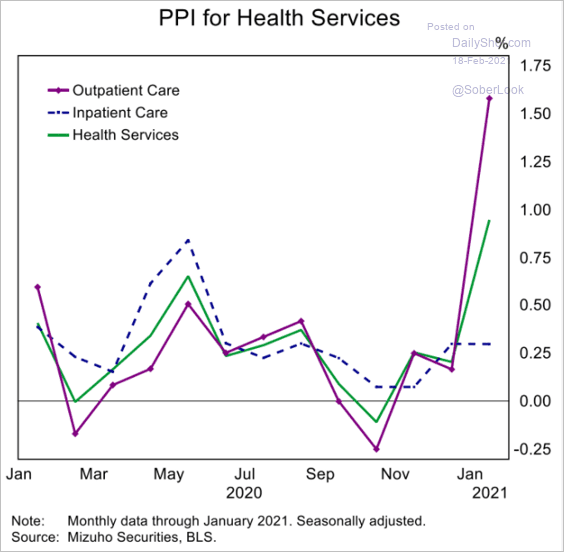 Source: Mizuho Securities USA
– Portfolio management services:
——————–
6. The FOMC minutes show that the central bank remains dovish despite signs of stronger growth and higher inflation.
 Source: Reuters Read full article
Here are a couple of quotes from the minutes.
… participants emphasized that it was important to abstract from temporary factors affecting inflation-such as low past levels of prices dropping out of measures of annual price changes or relative price increases in some sectors brought about by supply constraints or disruptions-in judging whether inflation was on track to moderately exceed 2 percent for some time.
With regard to upside risks, some participants pointed to the possibility that fiscal policy could turn out to be more expansionary than anticipated, that households could display greater willingness to spend out of accumulated savings than expected, or that widespread vaccinations and easing of social distancing could result in a more rapid boost to spending and employment than anticipated. Participants generally viewed the risks to the outlook for inflation as having become more balanced than was the case over most of 2020, although most still viewed the risks as weighted to the downside.
The market now expects liftoff in 2023 …
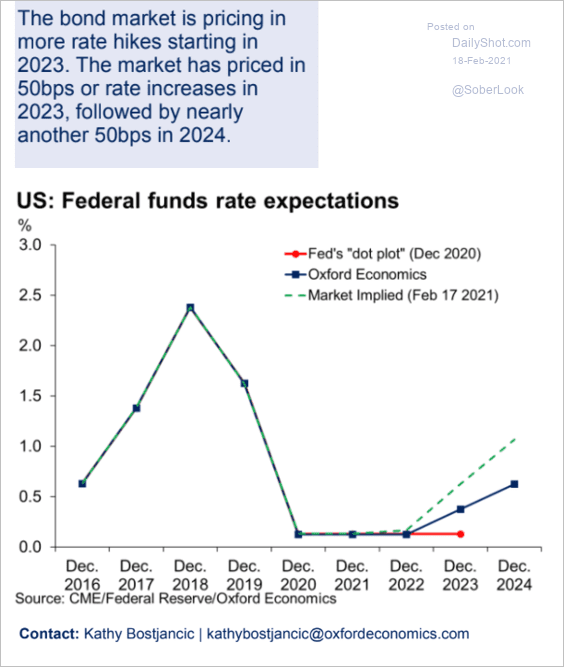 Source: Oxford Economics
… as Treasury yields climb.
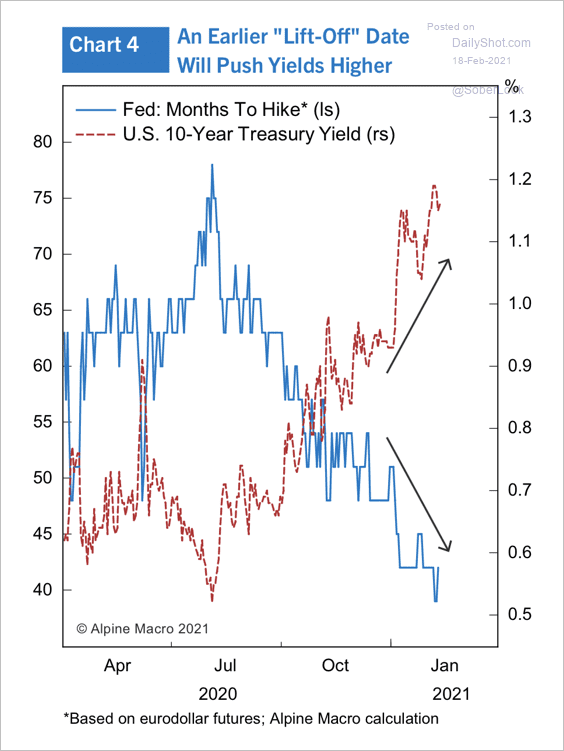 Source: Alpine Macro
Back to Index
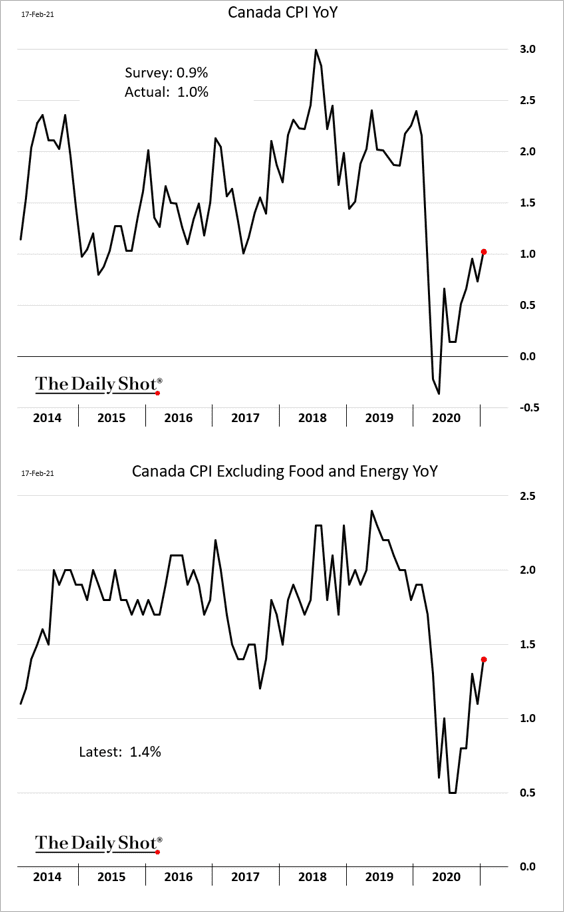
Canada
Inflation ticked up last month but remained below pre-COVID levels.
Back to Index
The United Kingdom
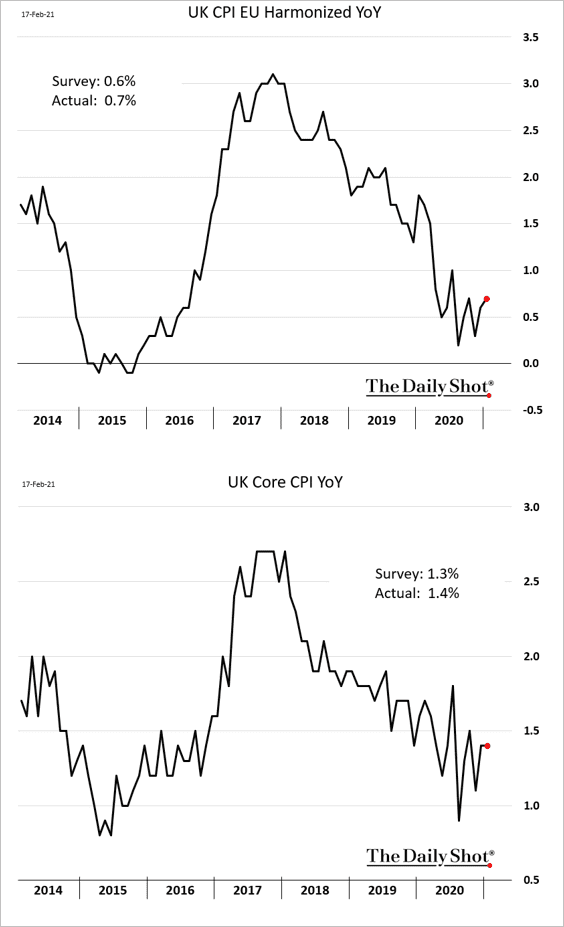
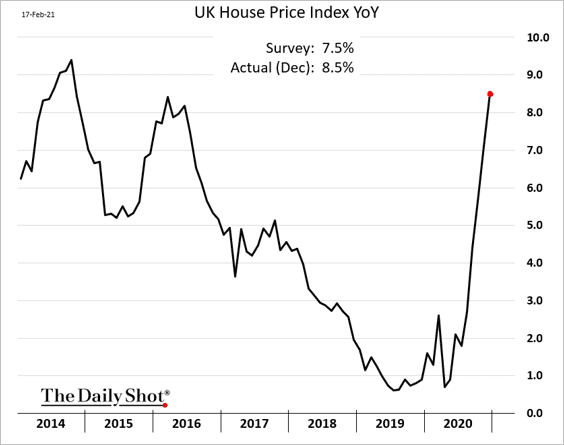
1. Inflation was a touch higher than expected.
• Durable goods prices have been rising quickly.
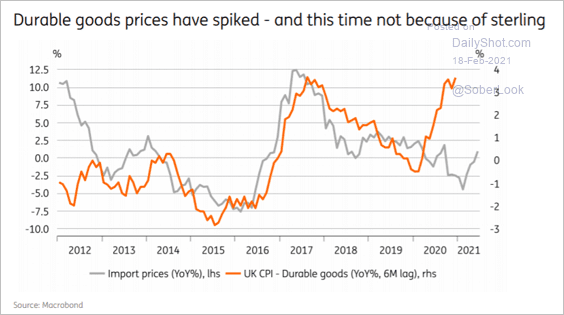 Source: ING Read full article
• According to Pantheon Macroeconomics, the CPI basket weights have been changed to reflect the shift in spending behavior last year. The rebound in COVID-hit sectors, therefore, won’t impact the CPI as much as it would have with the original weights.
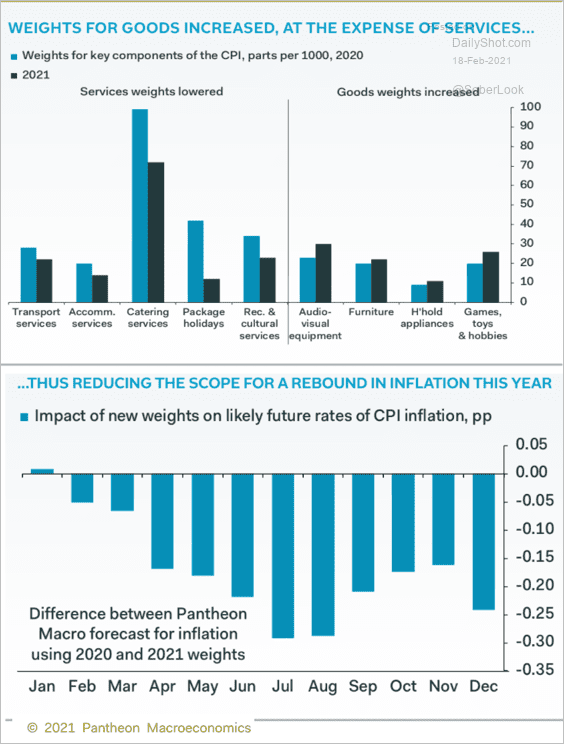 Source: Pantheon Macroeconomics
——————–
2. Home prices rose sharply in December. However, we already know from other metrics that the housing market paused in January.
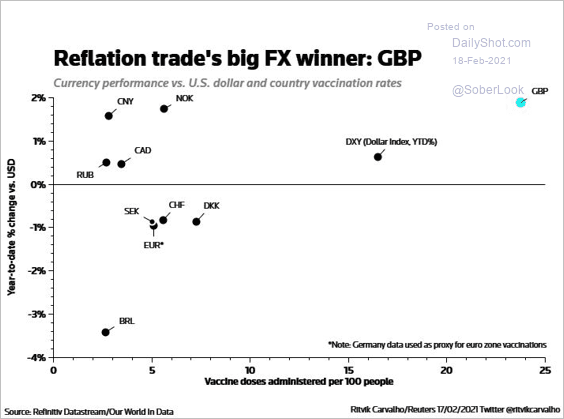
3. The rapid pace of vaccinations in the UK gave the pound a lift.
 Source: @ritvikcarvalho
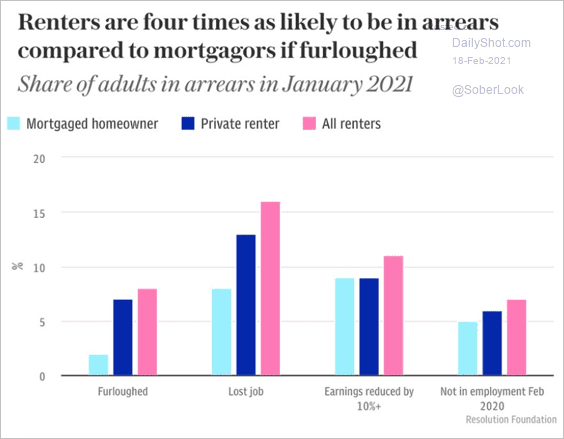
4. Many renters are in arrears.
 Source: The Telegraph Read full article
Back to Index
Europe
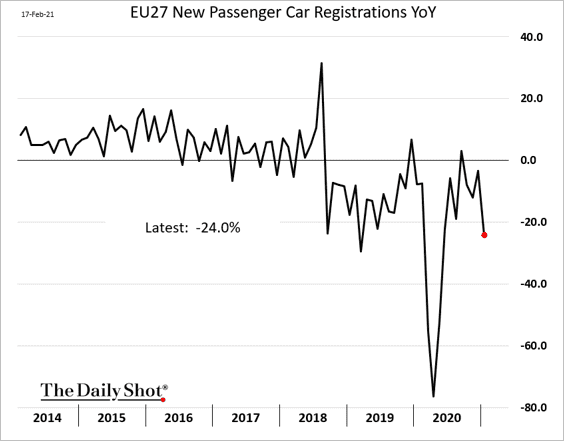
1. Car registrations started the year on a weak note.
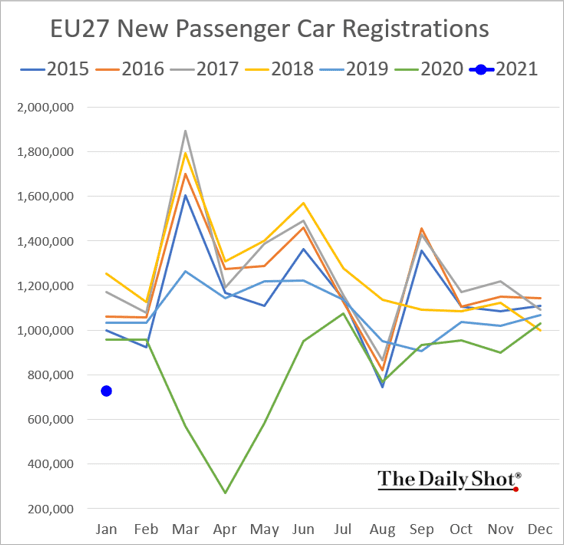
Below is the year-over-year chart.
And here is the situation in the Eurozone.
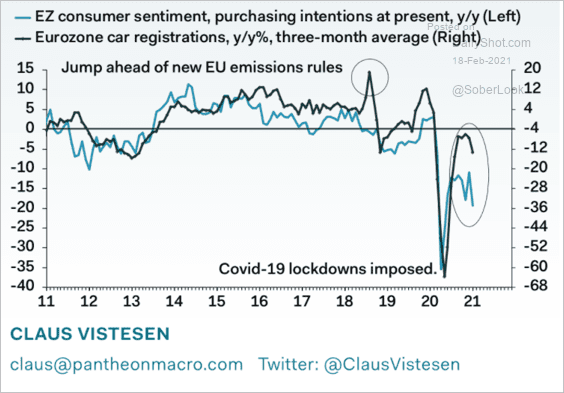 Source: Pantheon Macroeconomics
——————–
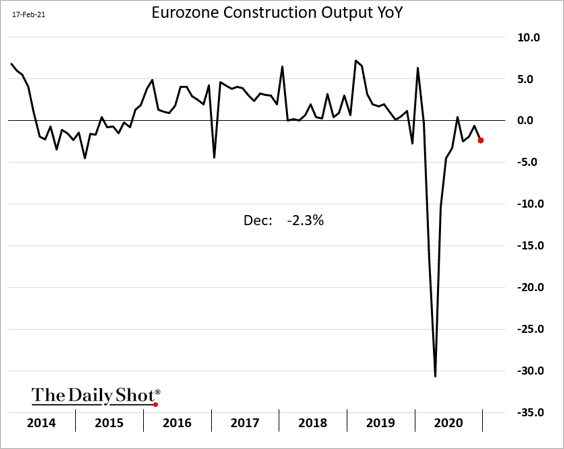
2. Euro-area construction output slowed in December.
3. The gap between German and US market-based inflation expectations continues to widen.
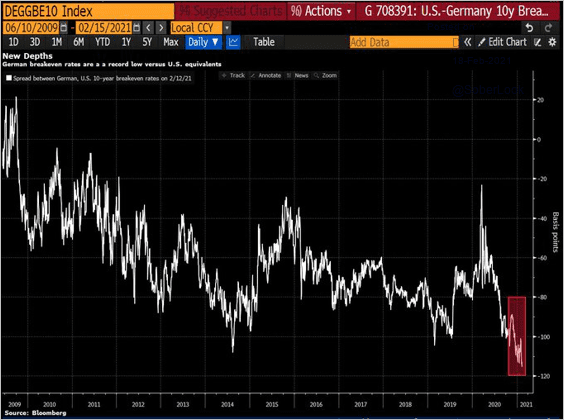 Source: @lisaabramowicz1, @highisland, @TheTerminal
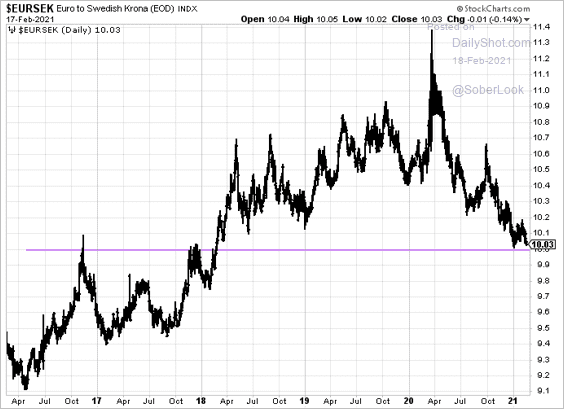
4. EUR/SEK is testing support at 10.0 despite a sluggish recovery in Sweden.
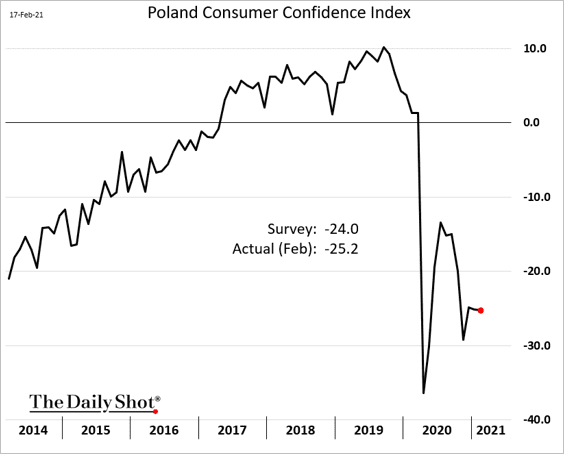
5. Poland’s employment declined last month.
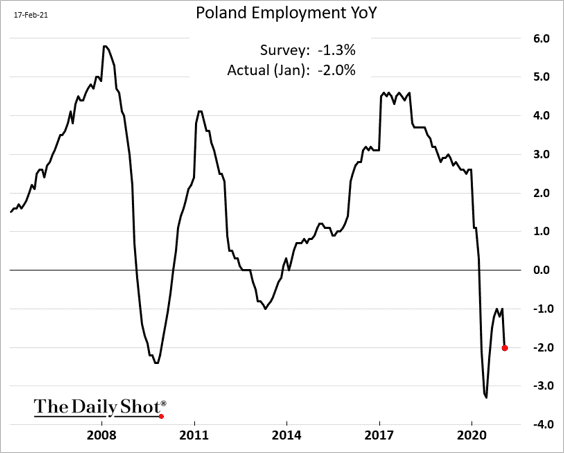
Consumer confidence remains soft.
——————–
6. Here is a look at the gender pay gap in the EU.
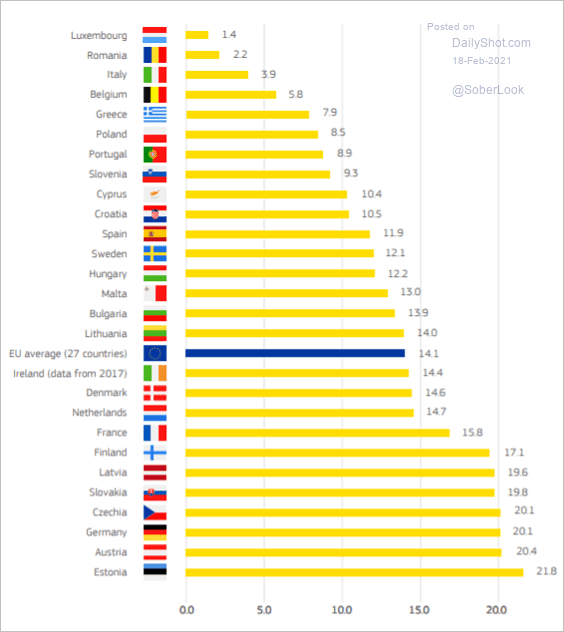 Source: EC Read full article
Back to Index
Asia – Pacific
1. Japan’s supply disruptions reduced inventories in electronics and autos.
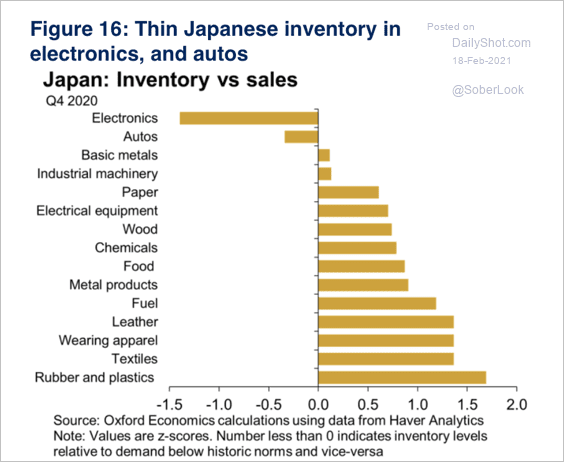 Source: Oxford Economics
2. South Korean investors have been buying foreign bonds, putting downward pressure on the won.
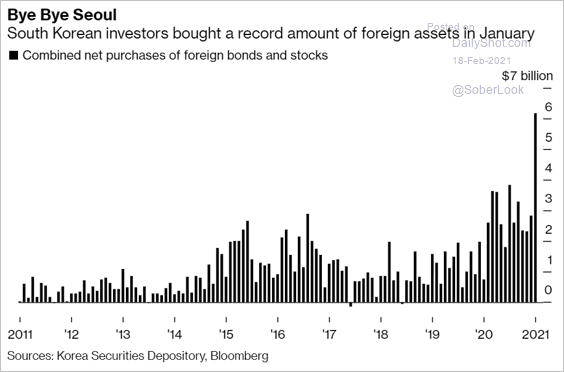 Source: Bloomberg Read full article
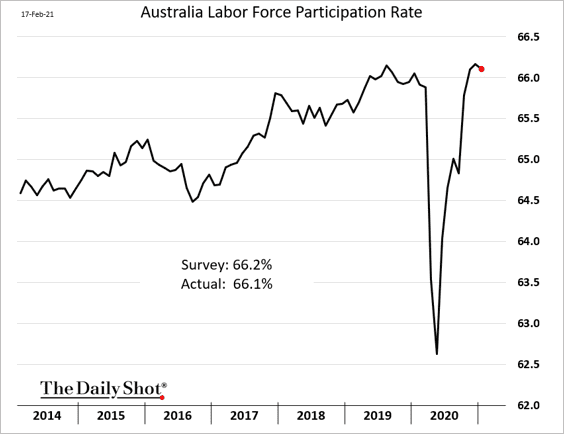
3. Australia’s employment report was in line with expectations. Gains in full-time jobs were quite strong (2nd chart).
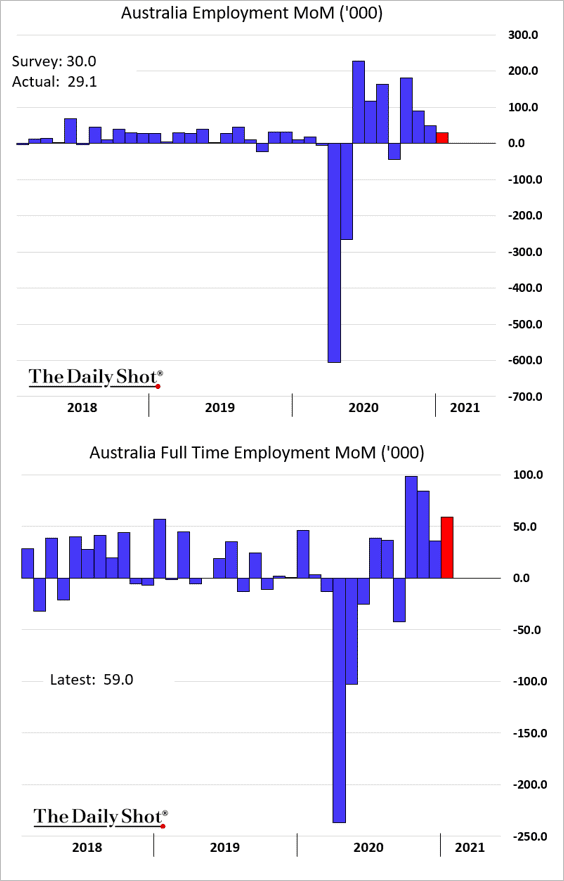
The labor market recovery continues.
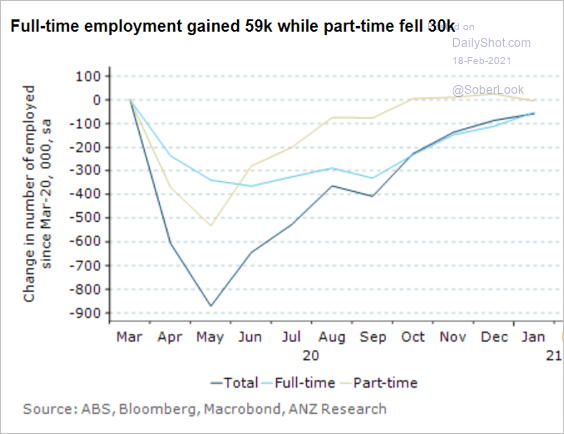 Source: ANZ Research
The unemployment rate declined, but …
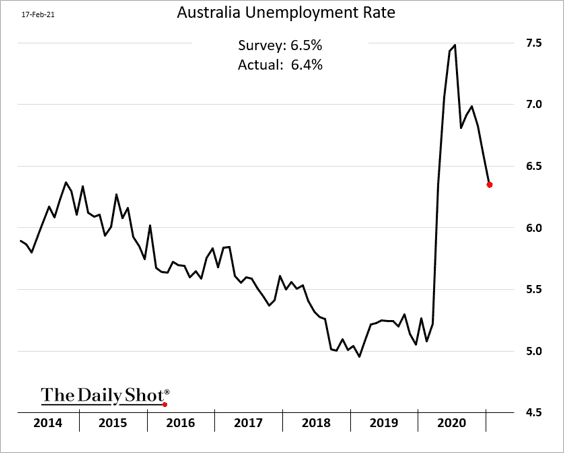
… the participation rate ticked lower.
Back to Index
China
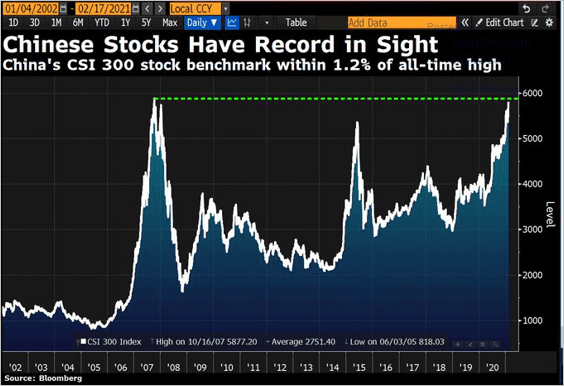
1. The CSI 300 stock benchmark is approaching the high reached in 2007.
 Source: @DavidInglesTV
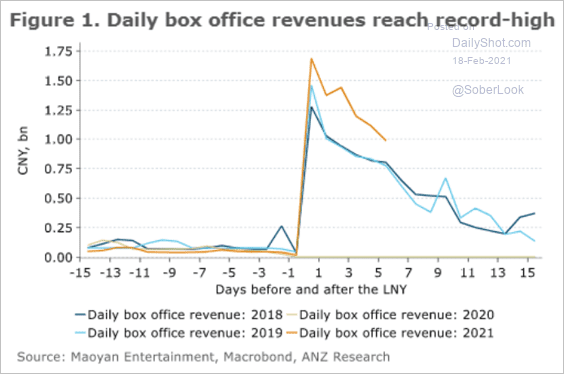
2. China’s citizens went to the movies during the holidays.
 Source: ANZ Research
3. Exports of pandemic-related products remain strong (PPE = personal protective equipment).
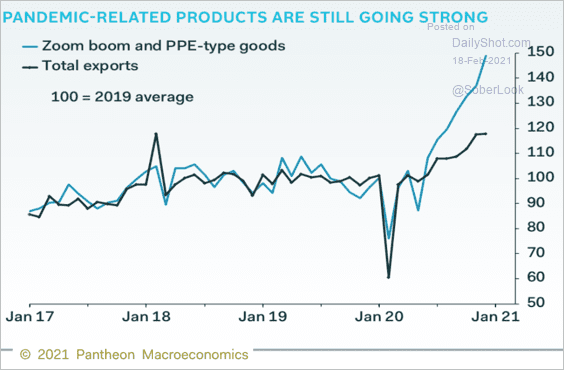 Source: Pantheon Macroeconomics
Back to Index
Emerging Markets
1. India’s economic activity indicators held up well.
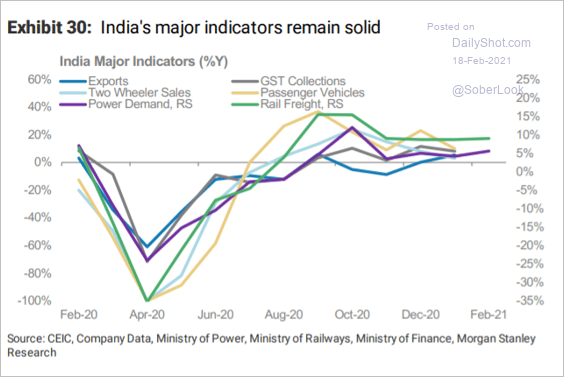 Source: Morgan Stanley Research
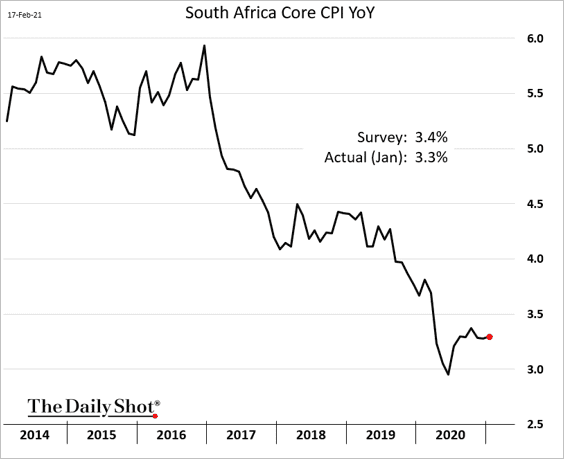
2. South Africa’s inflation is holding steady.
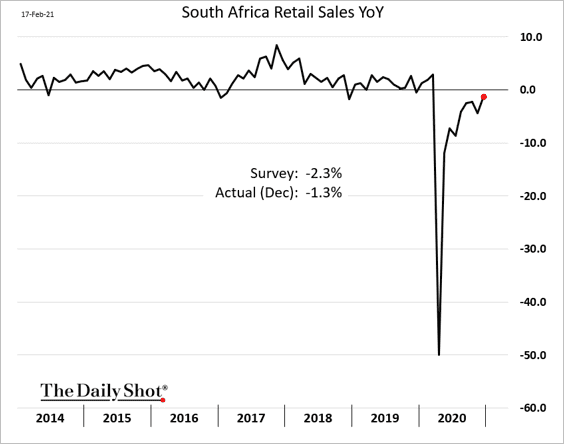
Retail sales have nearly recovered.
——————–
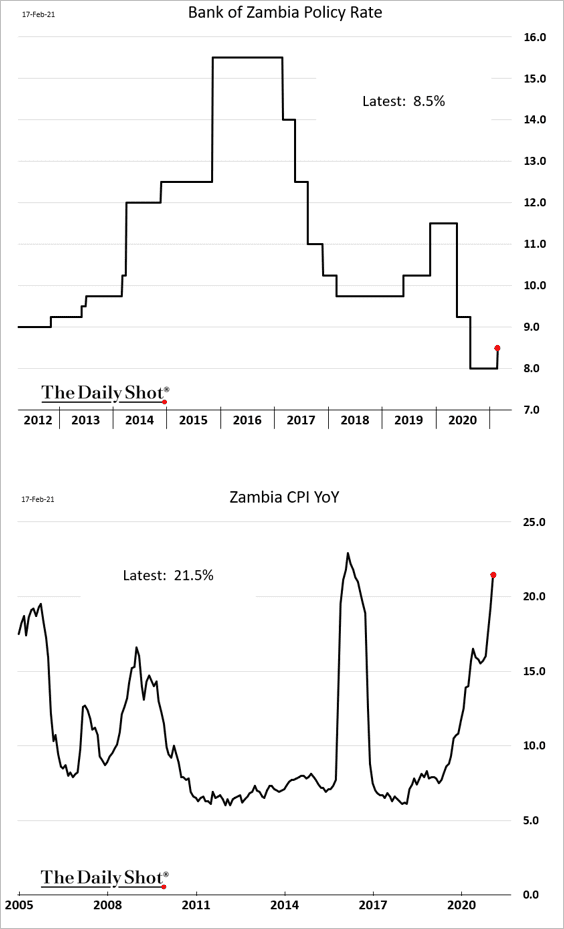
3. Zambia’s central bank hiked rates as inflation spikes.
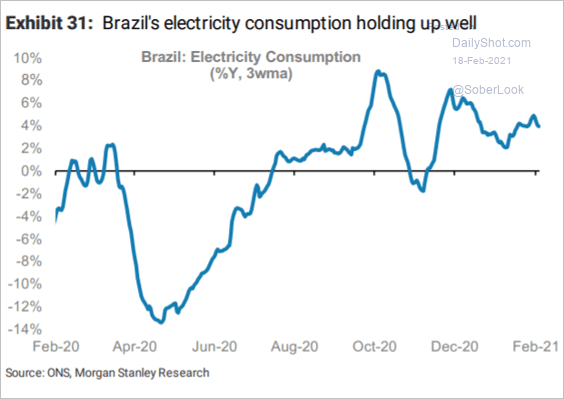
4. Brazil’s electricity usage has been strong.
 Source: Morgan Stanley Research
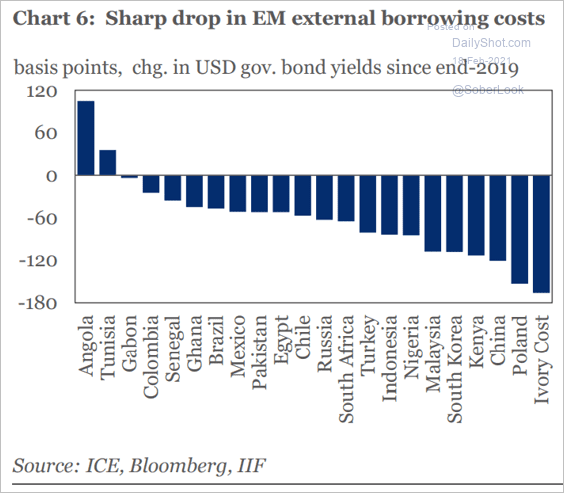
5. This chart shows the changes in EM external borrowing costs.
 Source: IIF
Back to Index
Cryptocurrency
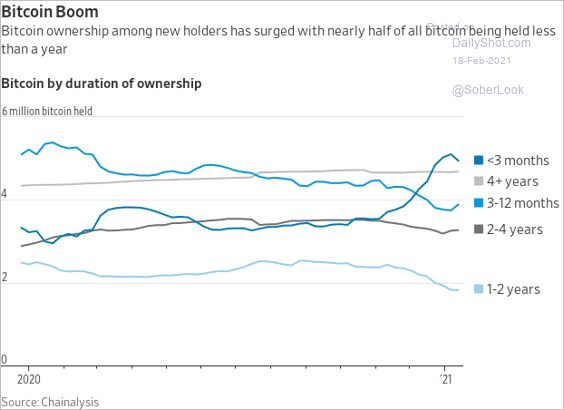
1. There are a lot of new entrants into the Bitcoin market.
 Source: @WSJ Read full article
2. The total crypto market cap is above $1.4 trillion.
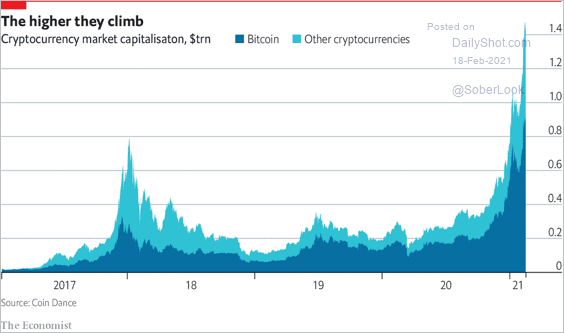 Source: The Economist Read full article
3. Every day brings some positive news for the crypto markets as institutional adoption spreads.
 Source: Reuters Read full article
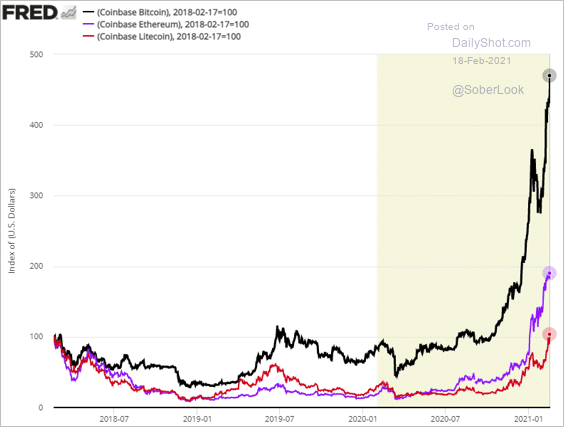
4. This chart shows the relative performance of Bitcoin, Ethereum, and Litecoin over the past three years.
Back to Index
Commodities
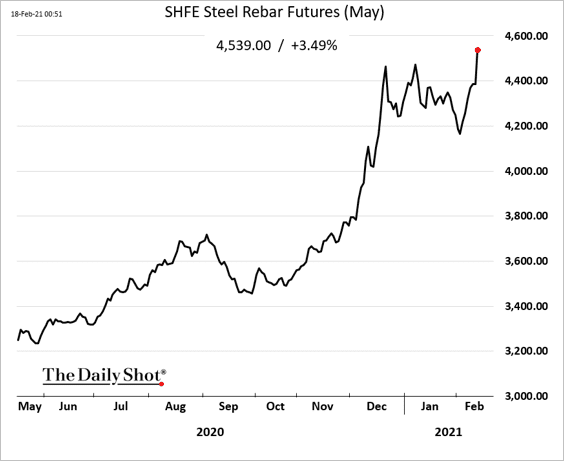
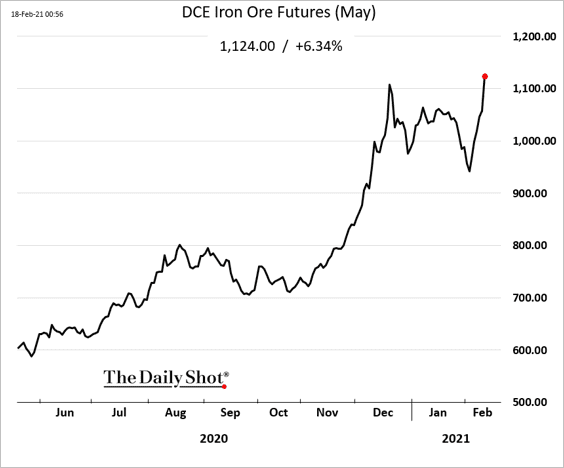
1. China’s steel and iron ore futures jumped as the market reopened after the holidays.
——————–
2. US and German steel inventories have fallen sharply in recent months.
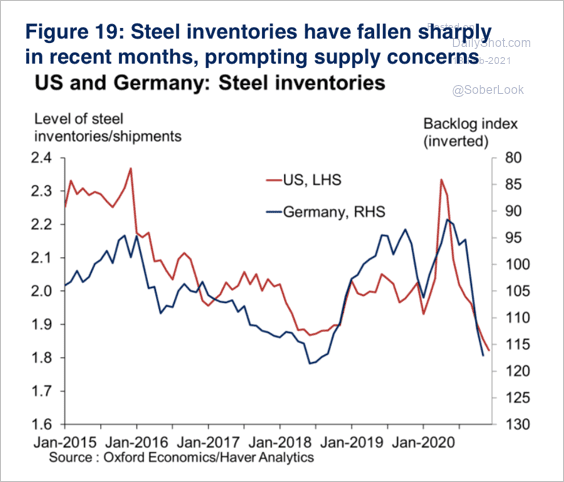 Source: Oxford Economics
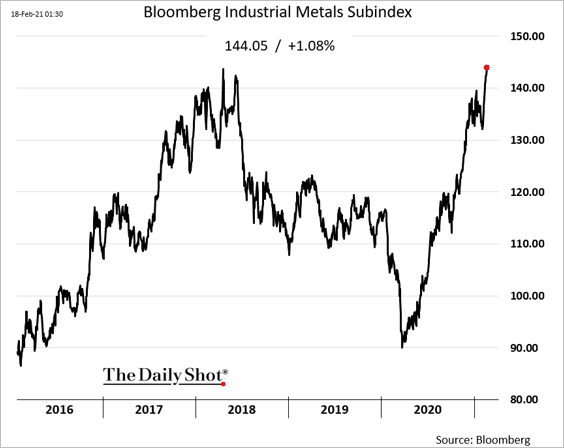
3. Here is Bloomberg’s industrial metals index.
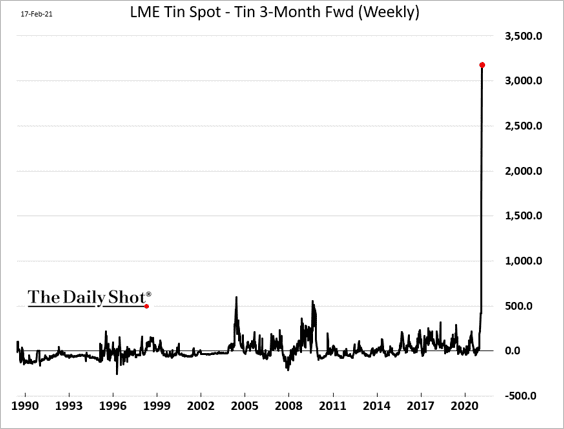
4. The spread between spot and 3-month forward tin prices has blown out (due to shortages).
5. Prices of commodities used in the manufacturing process for renewables have been rising.
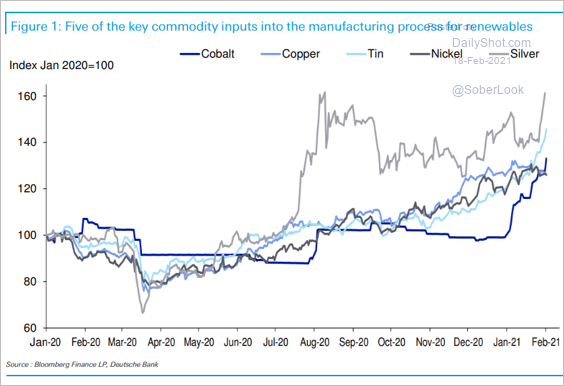 Source: Deutsche Bank Research
Back to Index
Energy
1. The polar vortex (see overview) …
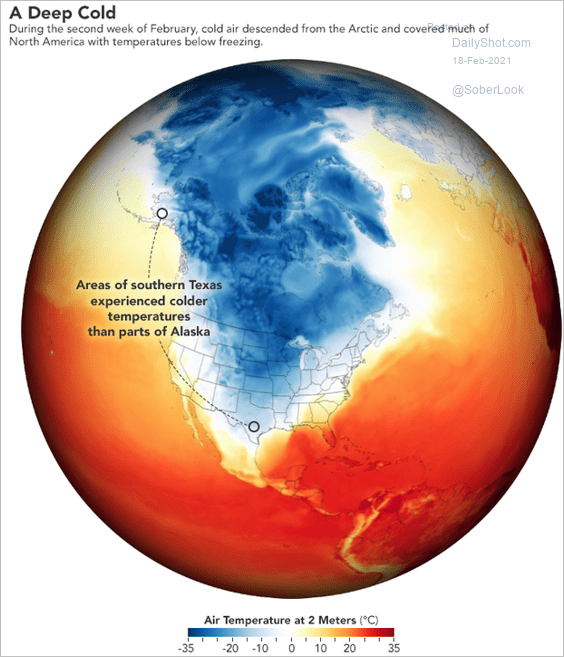 Source: NASA
… sent Texas temperatures to the lowest level in almost a century.
 Source: @chartrdaily
——————–
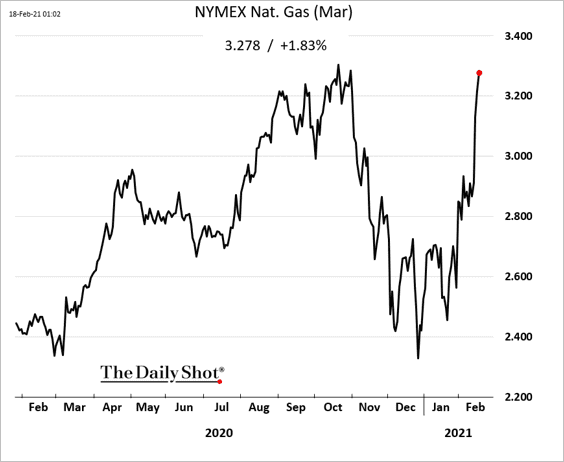
2. NYMEX natural gas prices keep climbing.
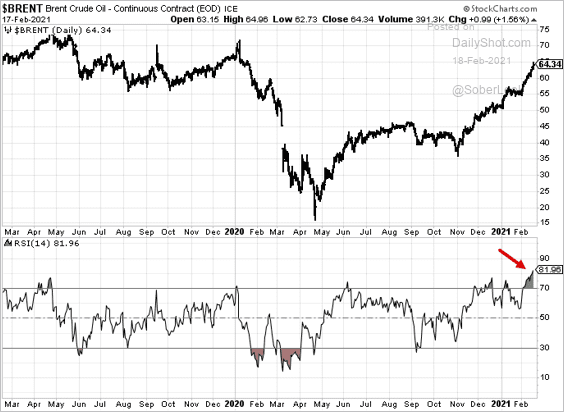
3. Technicals suggest that the Brent rally is stretched.
4. US shale CapEx remains soft.
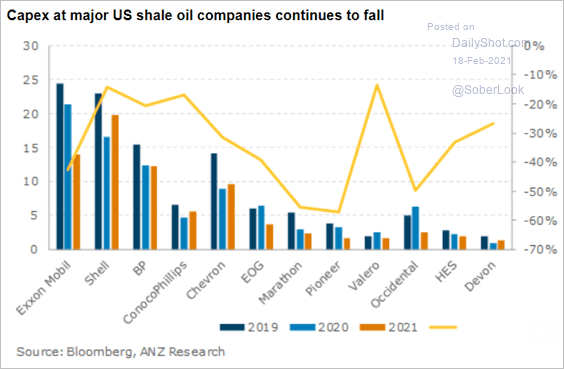 Source: ANZ Research
Back to Index
Equities
1. The market rally has paused, with tech pulling back. Rising inflation and higher bond yields are part of the reason.
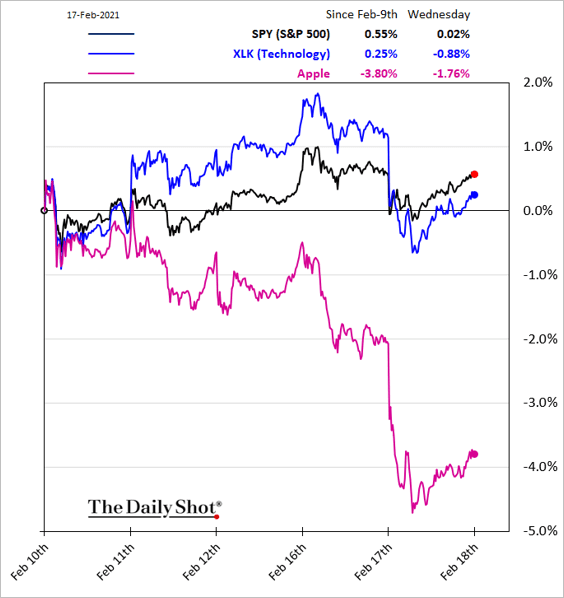
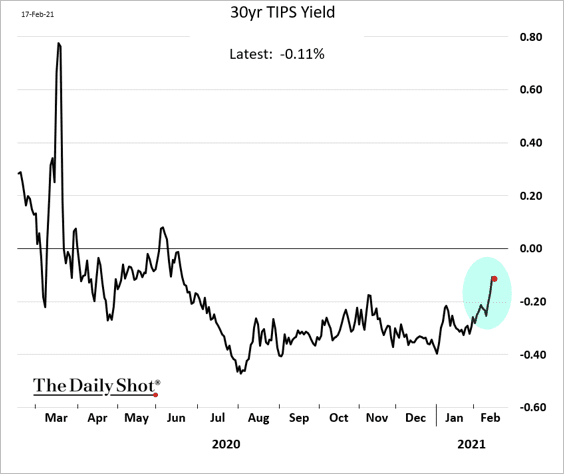
One signal that made some traders uneasy is the reversal in real yields (real rates can be an important component of equity valuations).
 Source: Bloomberg Read full article
——————–
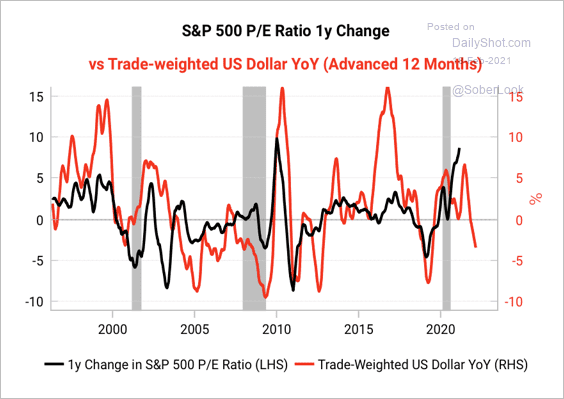
2. A lower US dollar points to a decline in the S&P 500 price-to-earnings ratio this year (which could mean either rising earnings or falling prices).
 Source: Variant Perception
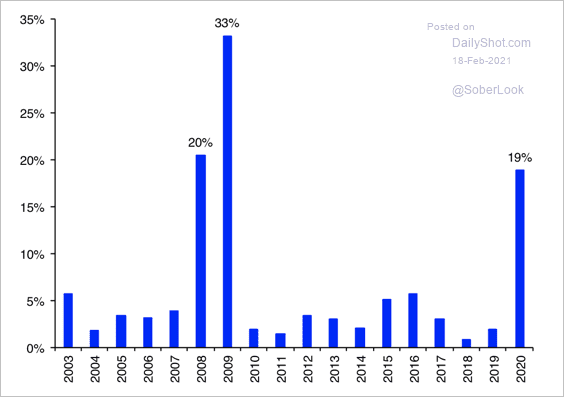
3. This chart shows the percent of negative dividend actions (cut or suspension) by S&P 500 companies.
 Source: Hugo Ste-Marie, Portfolio & Quantitative Strategy Global Equity Research, Scotia Capital
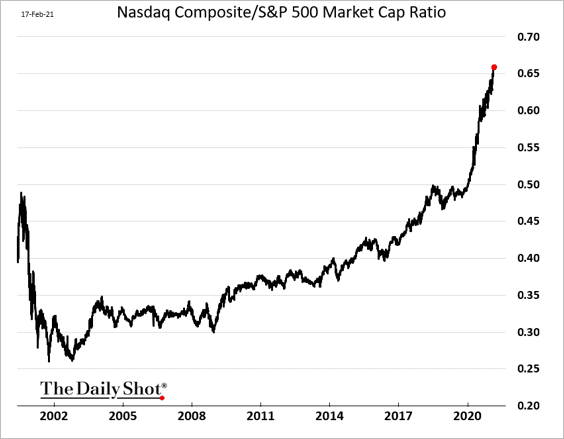
4. When will the Nasdaq Composite market cap reach that of the S&P 500?
 h/t Nancy Moran
5. Below is the composition of US households’ financial assets over time.
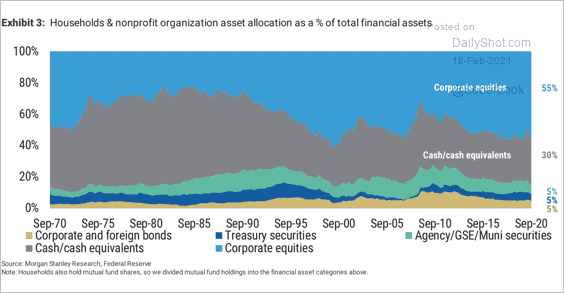 Source: Deutsche Bank Research
6. Which sectors have been driving the acceleration in ETF inflows?
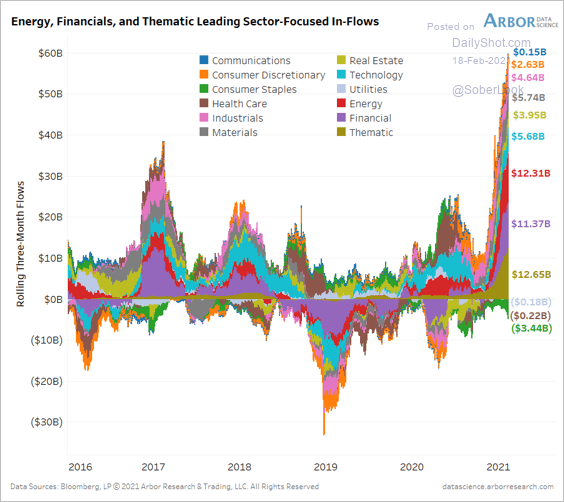 Source: Arbor Research & Trading
Back to Index
Credit
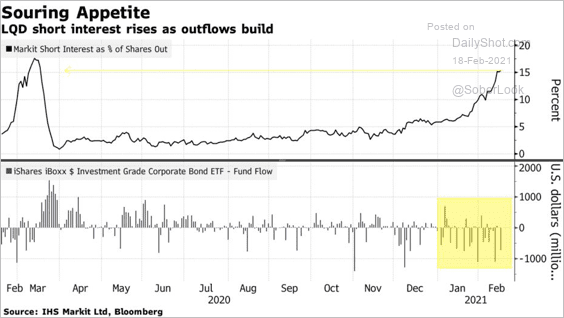
1. Short interest in the largest investment-grade bond ETF as near the pandemic-selloff highs.
 Source: @markets Read full article
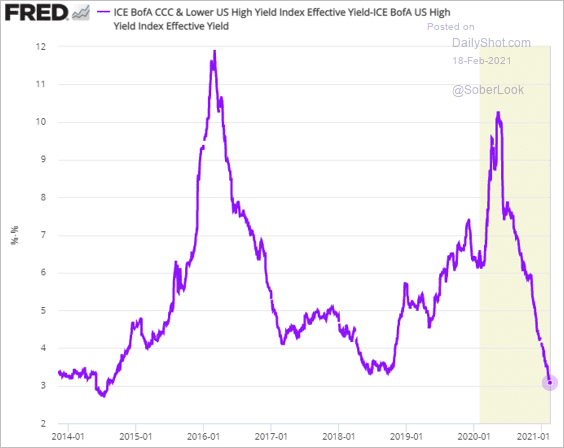
2. The spread between CCC (and lower-rated) bonds and the overall high-yield index is now the tightest since 2014. Complacency has crept into the credit markets as investors chase yield. This will not end well when the Fed begins to cut back on QE.
 h/t @lisaabramowicz1
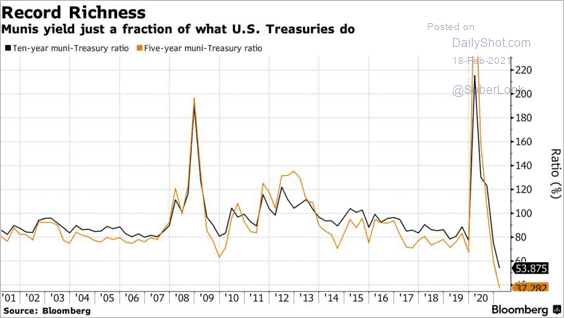
3 Muni bond yields are at record lows relative to Treasuries.
 Source: @markets Read full article
Back to Index
Global Developments
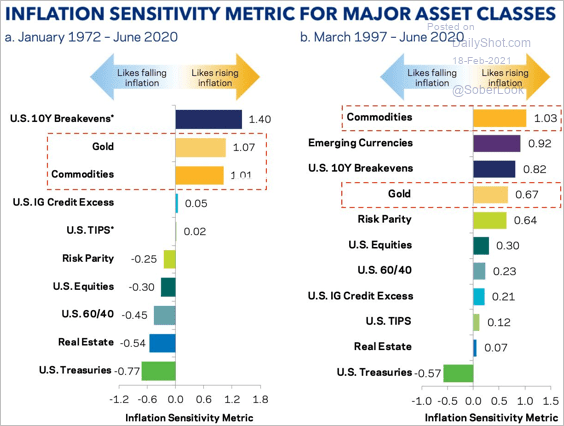
1. How sensitive are different asset classes to inflation?
 Source: Christian Gerlach
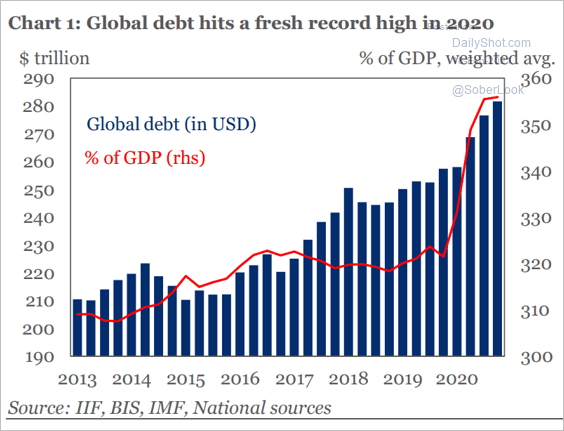
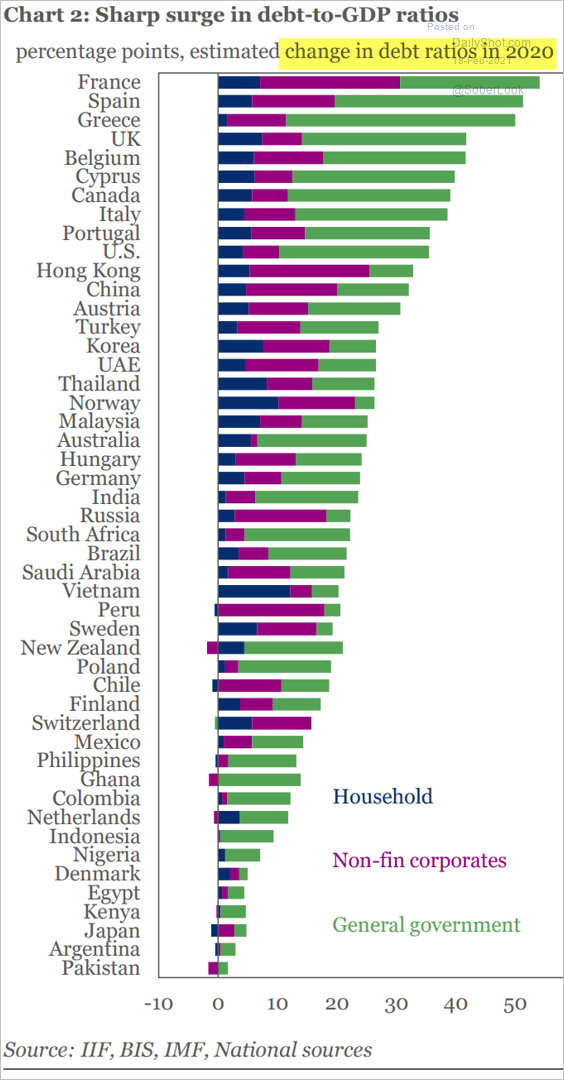
2. Global debt hit a record high last year.
 Source: IIF
This chart shows the change in debt-to-GDP ratios in select economies.
 Source: IIF
——————–
Food for Thought
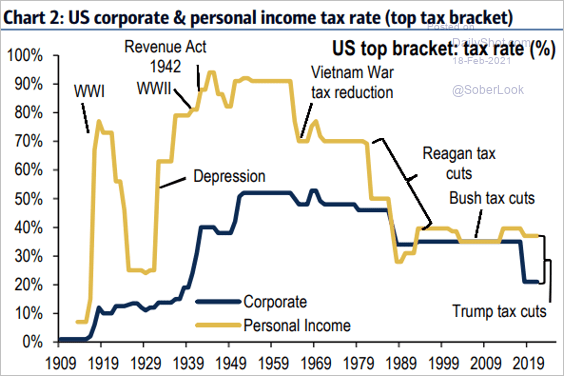
1. US corporate vs. personal tax rates over time:
 Source: BofA Global Research
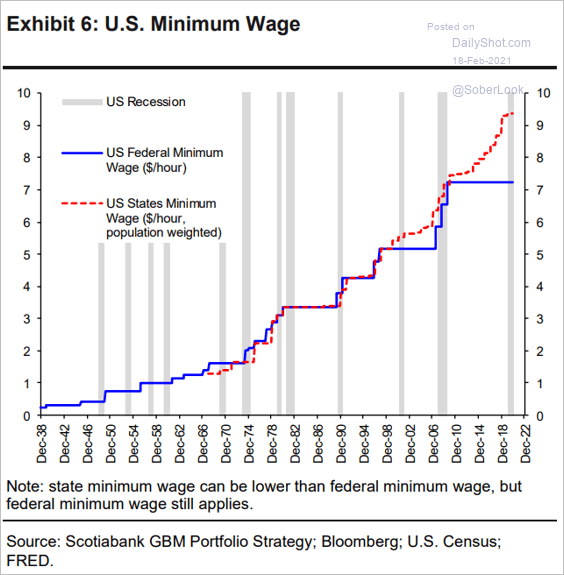
2. The minimum wage at the federal vs. state levels:
 Source: Hugo Ste-Marie, Portfolio & Quantitative Strategy Global Equity Research, Scotia Capital
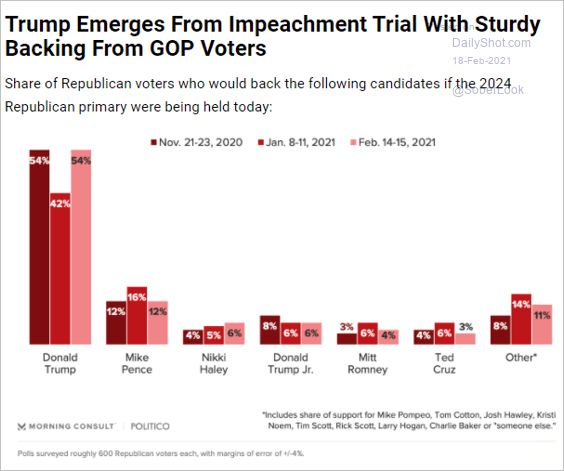
3. GOP voters are sticking with Trump (2 charts).
 Source: Morning Consult Read full article
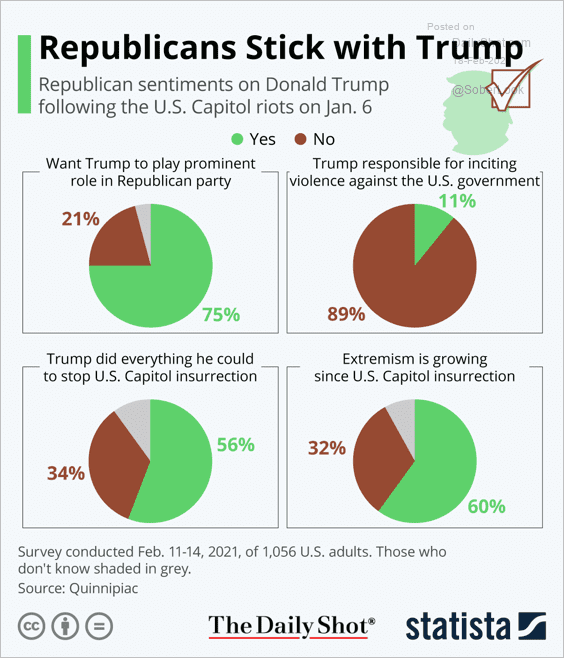 Source: Statista
——————–
4. Plastic waste per capita:
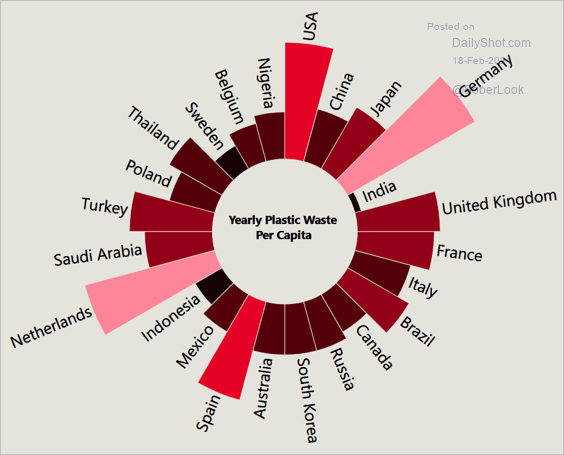 Source: Vistory
5. The number of incarcerated Americans per 100k population:
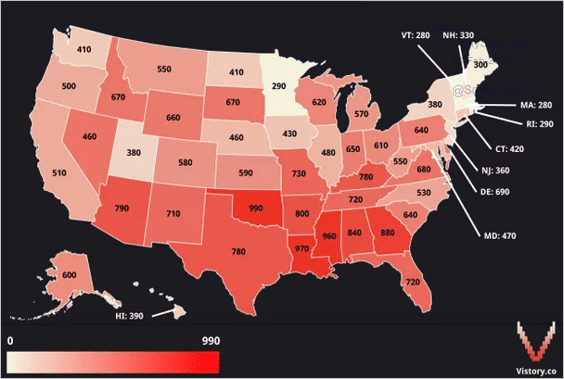 Source: Vistory
6. The number of countries using different COVID vaccines:
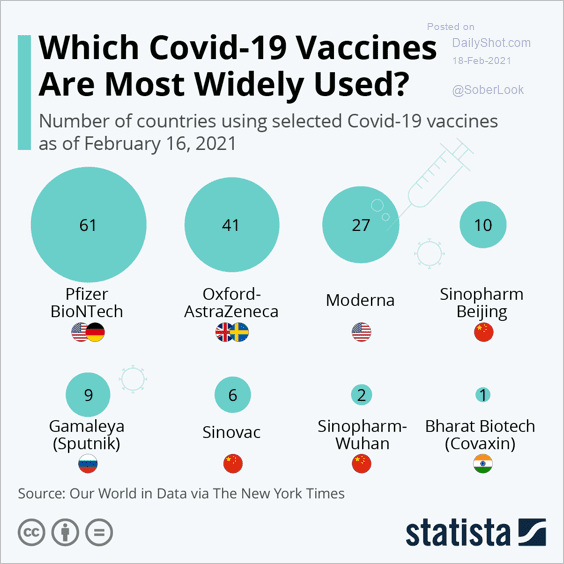 Source: Statista
7. Kids spending more time with electronic devices:
 Source: Morning Consult Read full article
8. Nevada cannabis tax revenue:
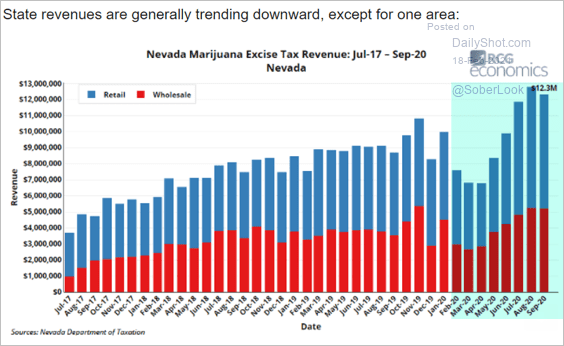 Source: @rcgeconomics, @HTLasVegas
9. Cow density in Switzerland:
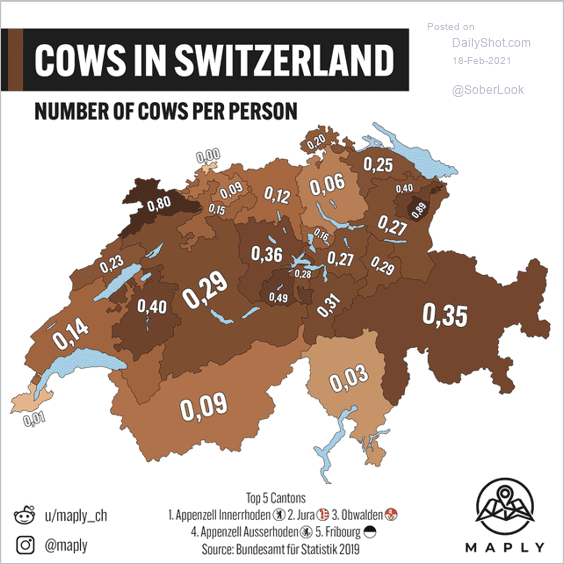 Source: reddit
——————–
Back to Index