
The Daily Shot: 25-Feb-21
• The United States
• Canada
• The Eurozone
• Asia – Pacific
• Emerging Markets
• Cryptocurrency
• Commodities
• Energy
• Equities
• Rates
• Global Developments
• Food for Thought
The United States
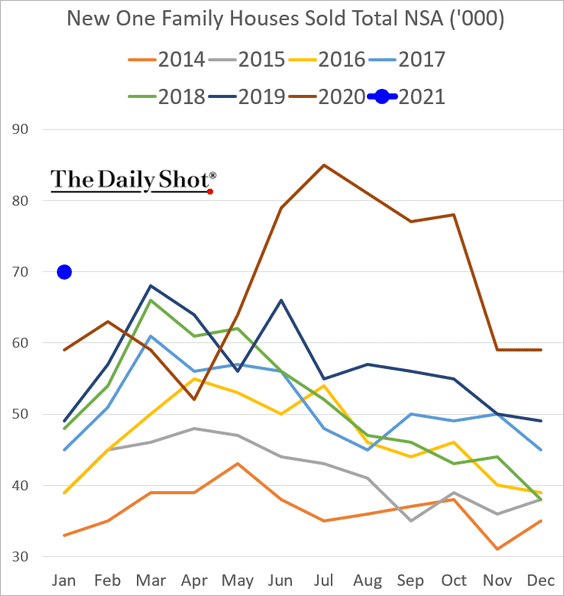
1. Let’s begin with the housing market.
• New home sales started the year on a strong note (well above Jan 2020 levels).
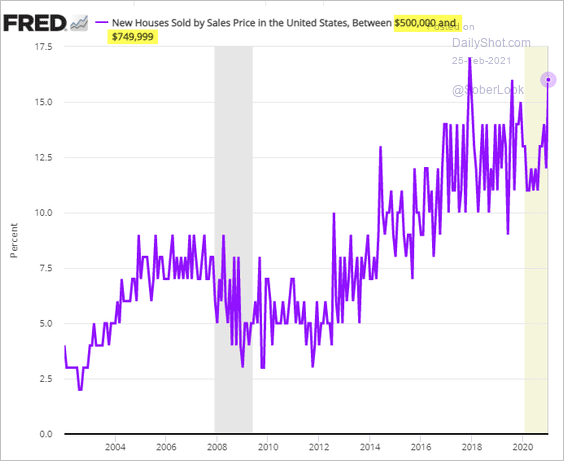
– Sales of higher-end homes picked up last month.
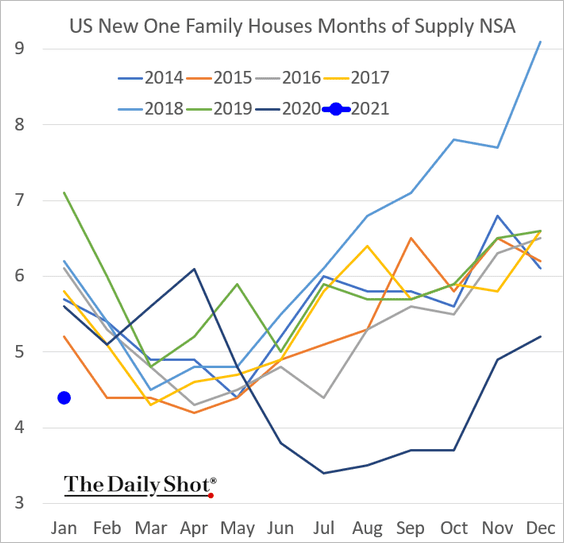
– Measured in months of supply, inventories of new homes are at multi-year lows.
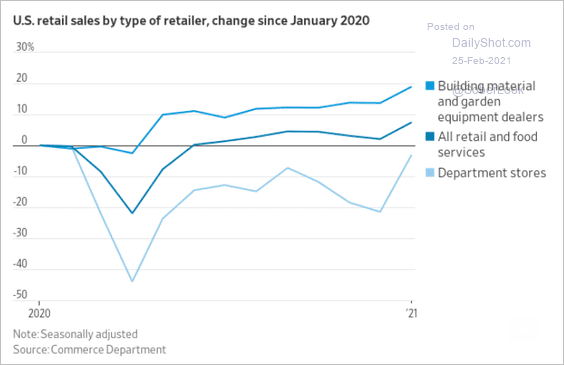
• Will housing continue to boost retail sales?
 Source: @WSJ Read full article
• As Treasury yields climb (see the rates section), a rise in the 30-year mortgage rate could weigh on housing activity.
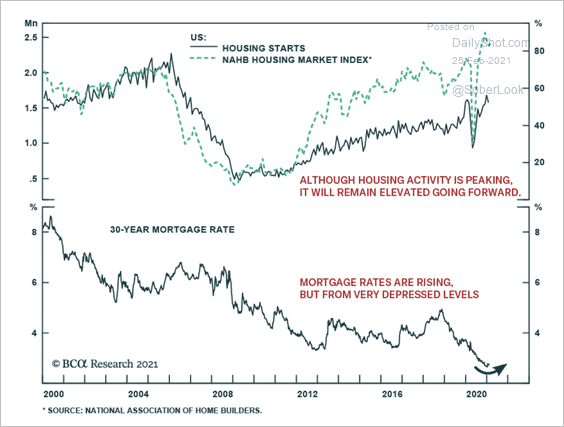 Source: BCA Research
• The chart below shows the ratio of home prices to family incomes (similar to this trend).
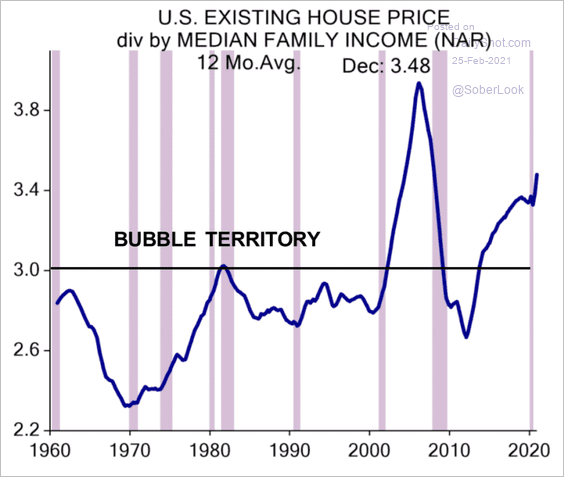 Source: Evercore ISI
• Loan applications to purchase a home declined last week.
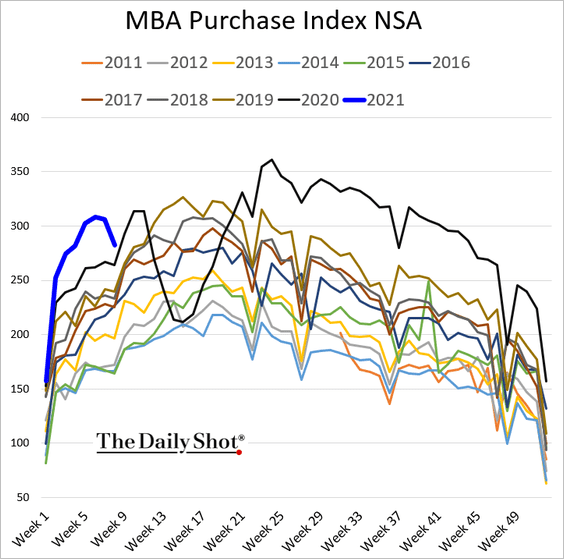
——————–
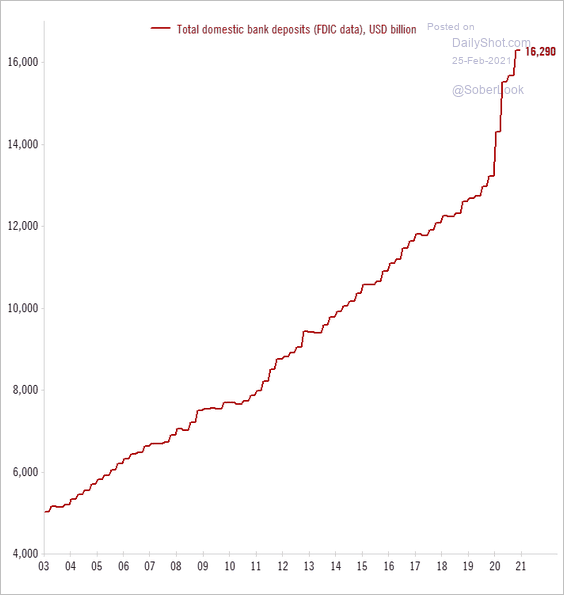
2. Will last year’s spike in savings convert into substantially stronger consumer spending this year? Will it boost inflation?
 Source: @TCosterg
Here is an estimate of “excess” savings from TS Lombard.
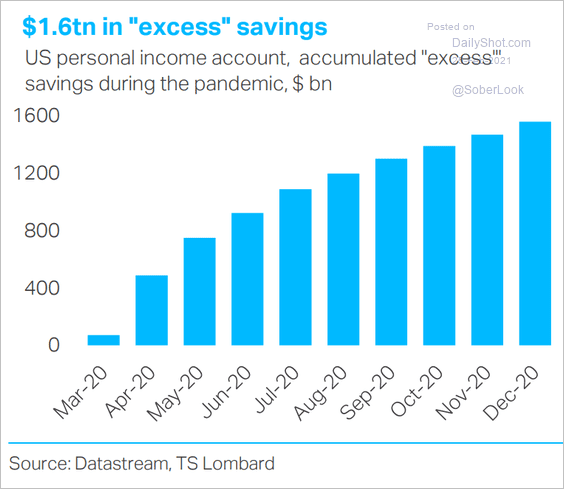 Source: TS Lombard
Online search activity suggests that consumers are losing interest in saving, which points to increased spending ahead. It could also indicate more flows into the stock market.
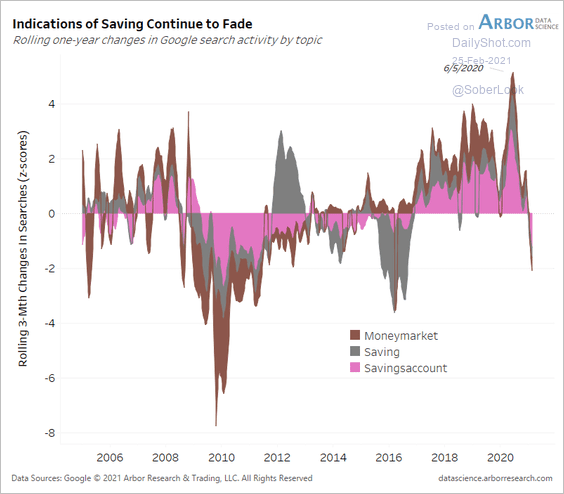 Source: Arbor Research & Trading
——————–
3. Here is the Wage Phillips Curve for the US. Can you spot government checks?
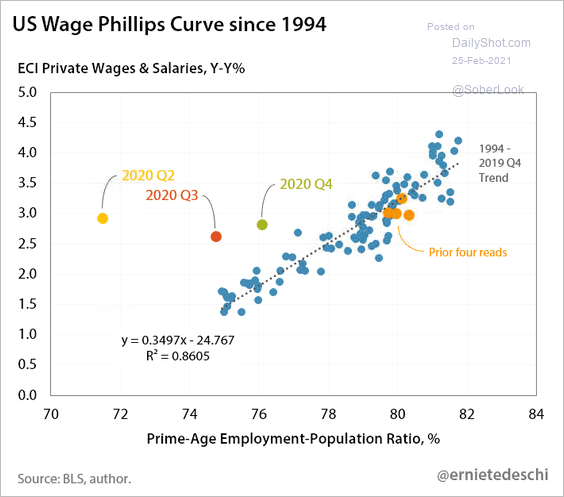 Source: @ernietedeschi
4. Next, we have some updates on the labor market.
• An alternative measure of the unemployment rate:
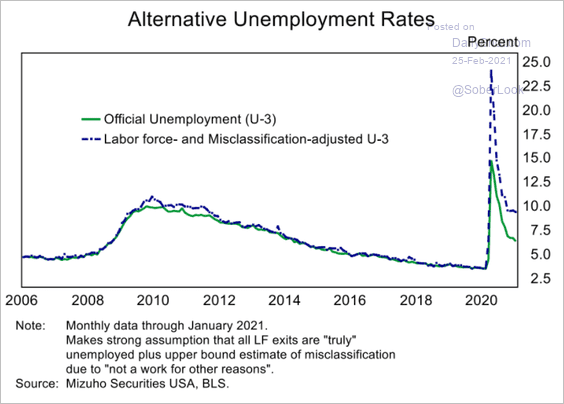 Source: Mizuho Securities USA
• Labor force participation by age:
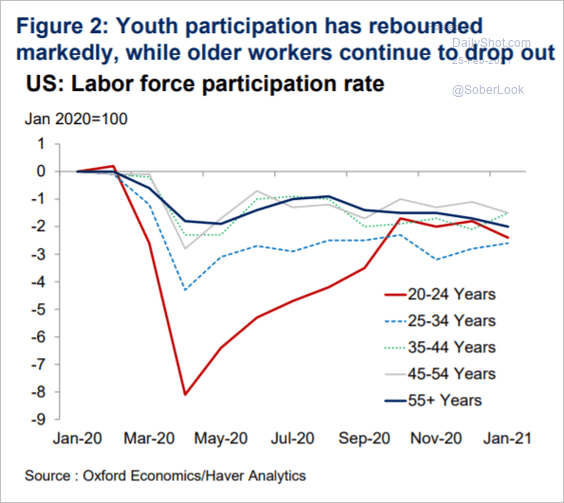 Source: Oxford Economics
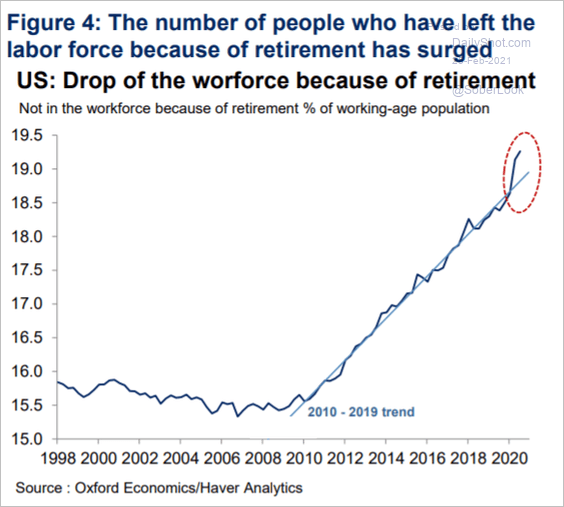
• The participation “shortfall” is increasingly driven by older Americans (retirement).
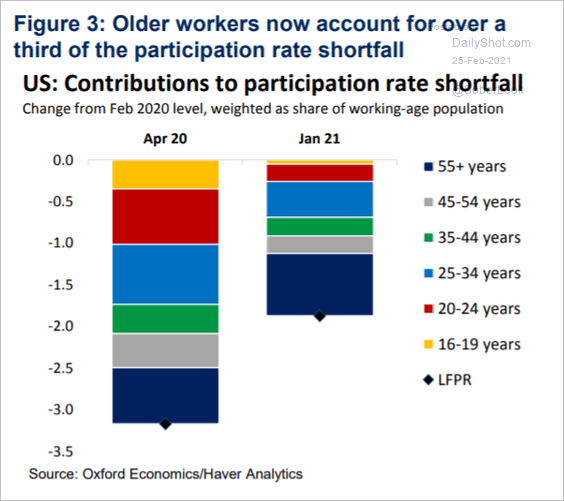 Source: Oxford Economics
 Source: Oxford Economics
• Pandemic-driven changes in employment by wage category:
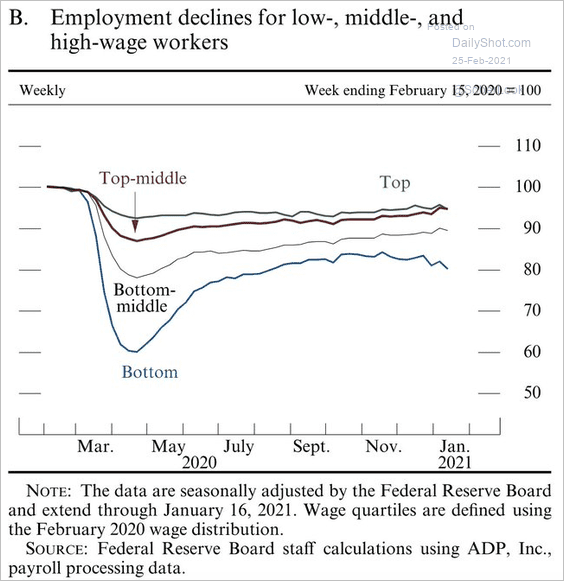 Source: @bcheungz Read full article
Back to Index
Canada
1. The yield curve continues to steepen.
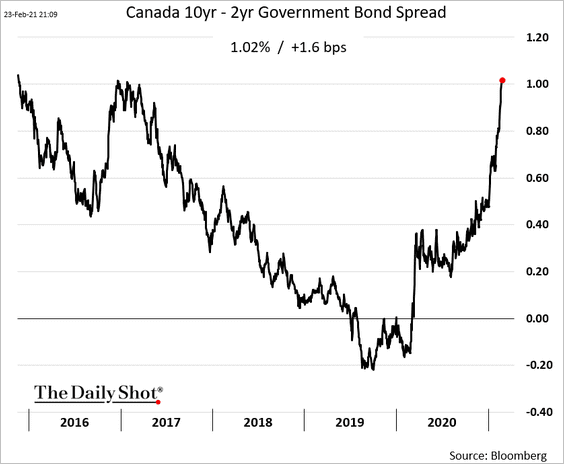 h/t Robert Fullem
2. Home price appreciation has been broad.
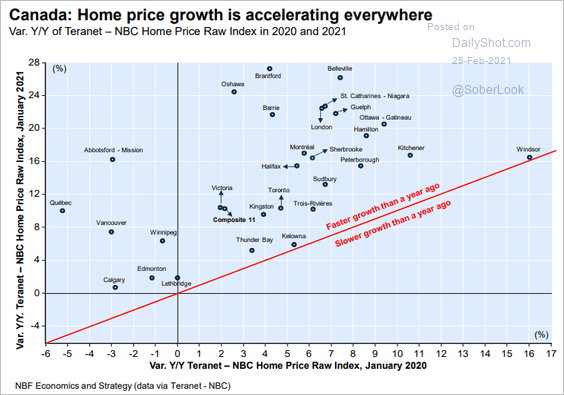 Source: Economics and Strategy Group, National Bank of Canada
3. Uninsured mortgage originations keep climbing.
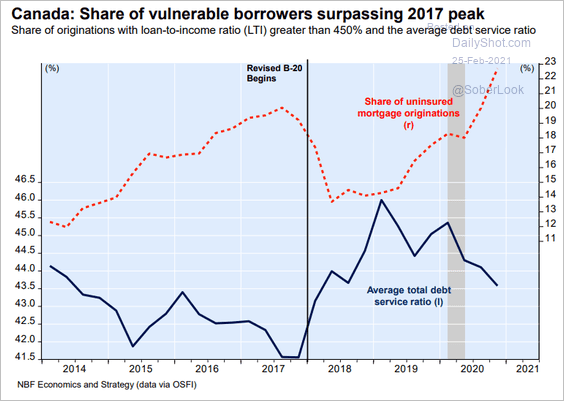 Source: Economics and Strategy Group, National Bank of Canada
Back to Index
The Eurozone
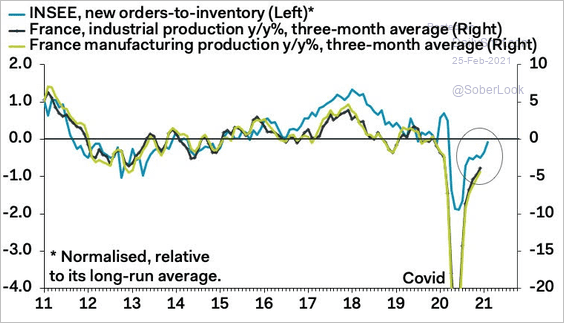
1. French business confidence was a bit softer than expected this month.
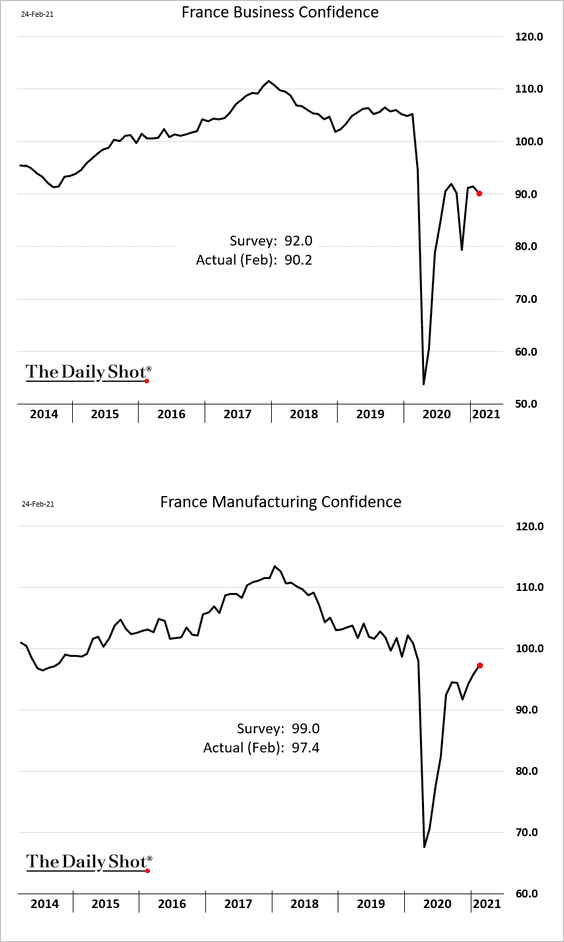
However, new orders-to-inventory estimates point to further gains in industrial output.
 Source: Pantheon Macroeconomics
——————–
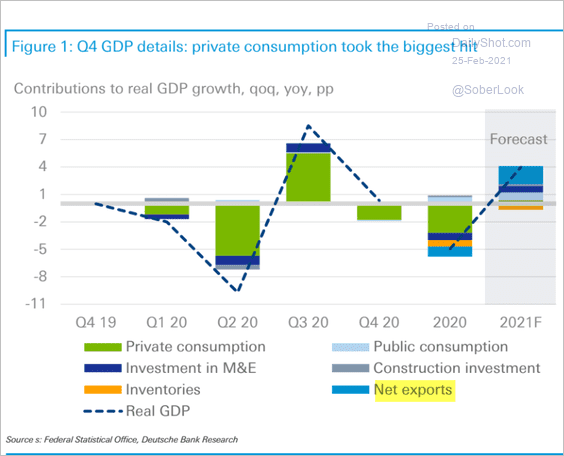
2. According to Deutsche Bank, Germany’s economic recovery this year will be primarily driven by exports.
 Source: Deutsche Bank Research
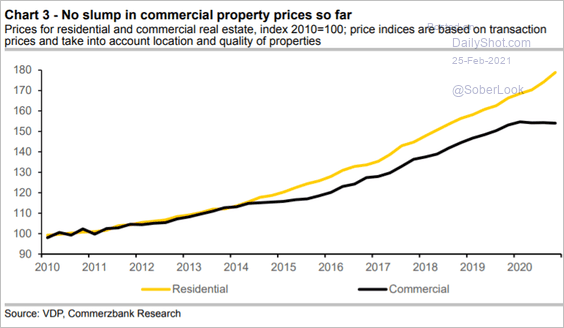
Separately, this chart shows the divergence between Germany’s commercial and residential property prices.
 Source: Commerzbank Research
——————–
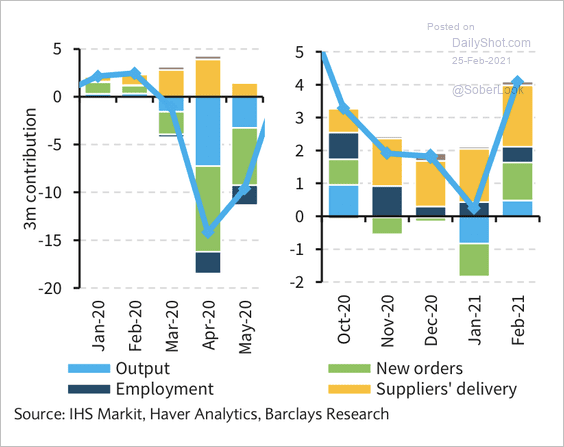
3. Global supply chain disruptions are distorting euro-area manufacturing PMI data. Will we see further increases in pricing pressure?
 Source: Barclays Research
4. This chart shows the banking sector’s cost of negative rates with and without the TLTRO program.
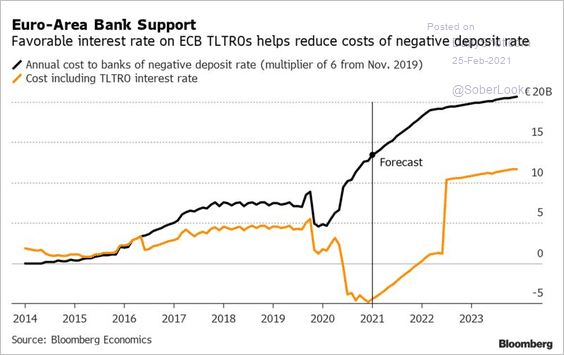 Source: Bloomberg Read full article
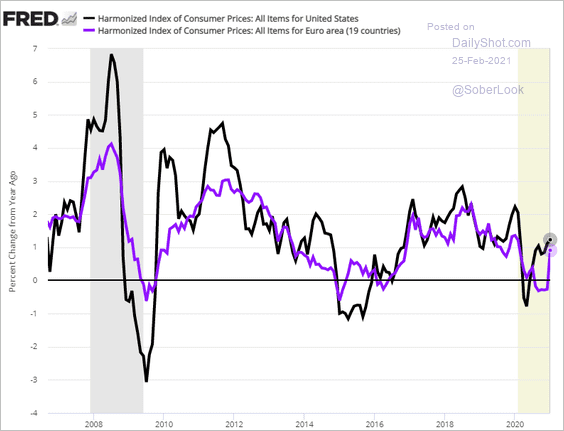
5. Over longer periods, the US and Eurozone inflation indices (apples-to-apples comparison) tend to track each other quite well. The US CPI is just more volatile.
6. Economic expectations are rebounding, which could benefit EUR/USD.
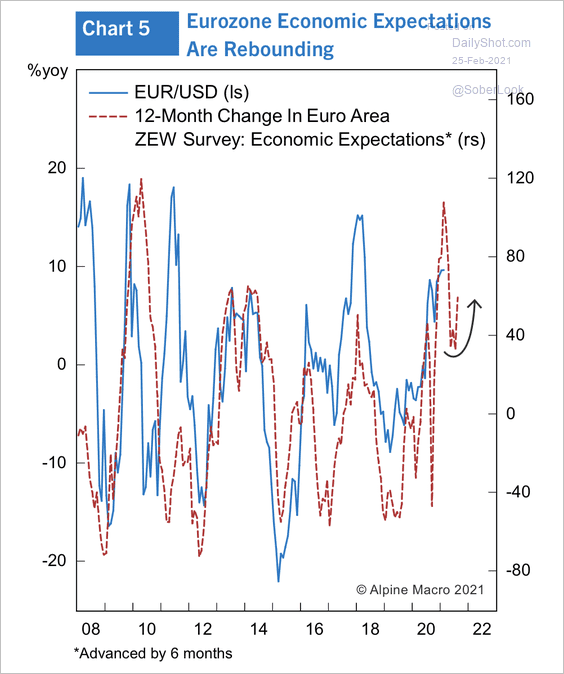 Source: Alpine Macro
The euro is broadly at purchasing power parity.
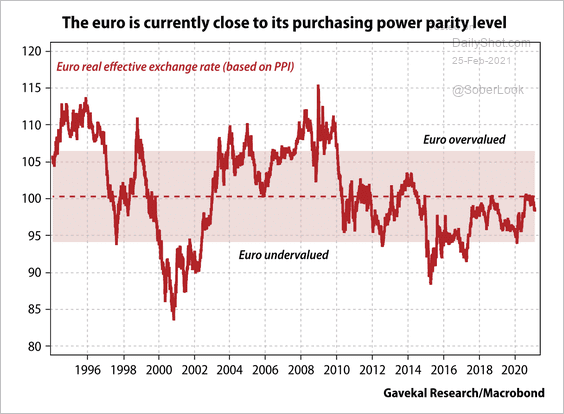 Source: Gavekal Research
Back to Index
Asia – Pacific
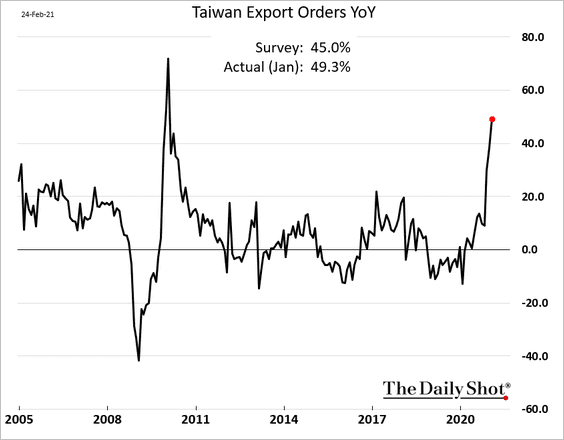
1. Taiwan’s export orders are nearly 50% above last year’s levels amid semiconductor shortages.
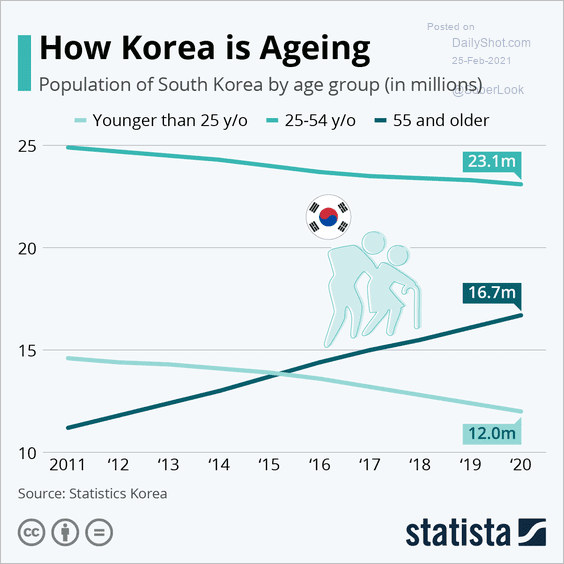
2. South Korea’s demographics don’t look promising.
 Source: Statista
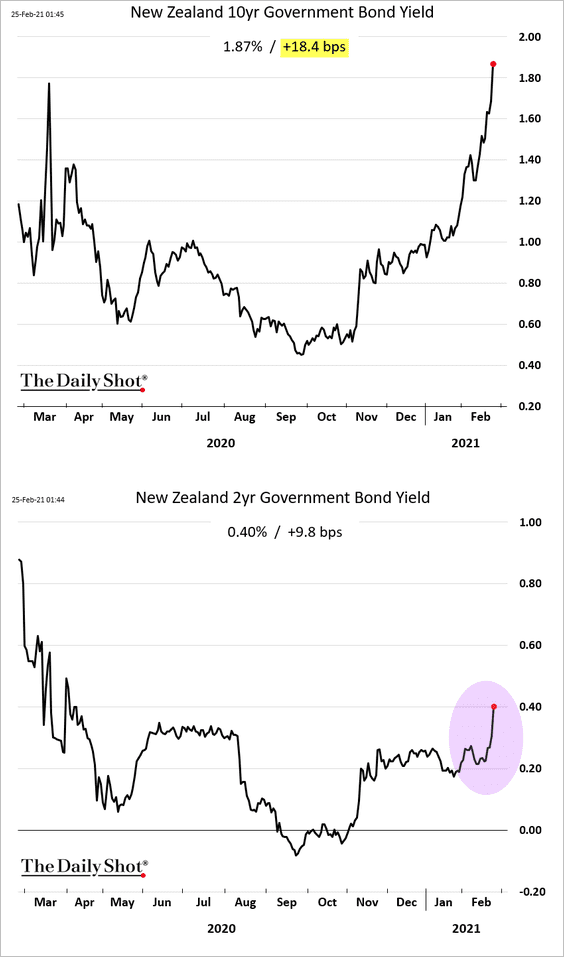
3. New Zealand’s bond yields are soaring. The market is now pricing in a possibility of a rate hike later this year.
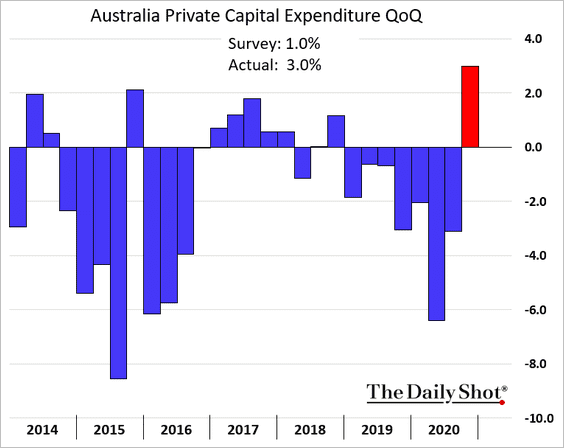
4. Australia’s CapEx jumped in Q4, driven by non-mining sectors.
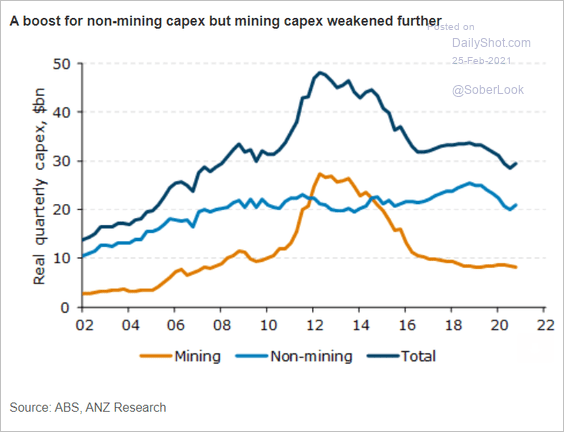 Source: ANZ Research
Back to Index
Emerging Markets
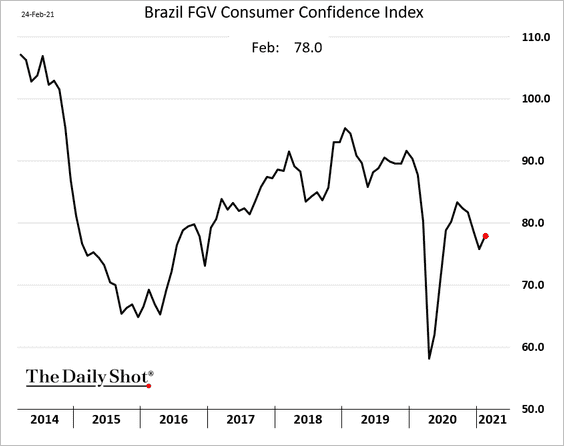
1. Brazil’s consumer confidence ticked up this month.
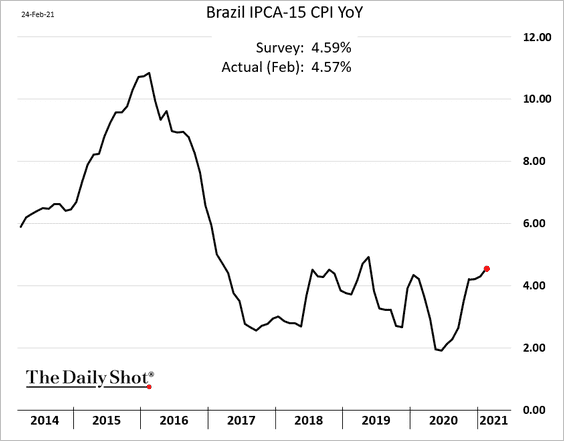
Inflation is grinding higher, but the pace has been a bit slower than expected.
——————–
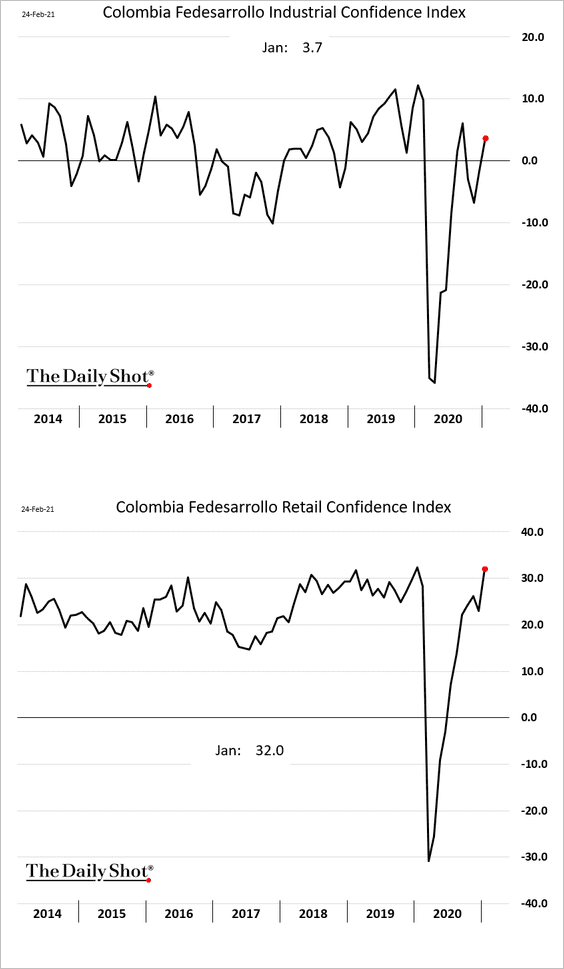
2. Unlike other countries, Colombia’s retail confidence has been outpacing sentiment at industrial firms.
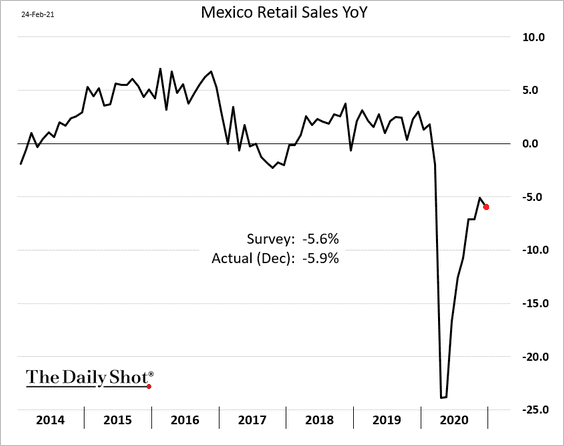
3. Mexico’s retail sales weakened in December. This is going to be a long recovery.
4. The World Economics SMI report on India points to persistent weakness in business activity as margins deteriorate.
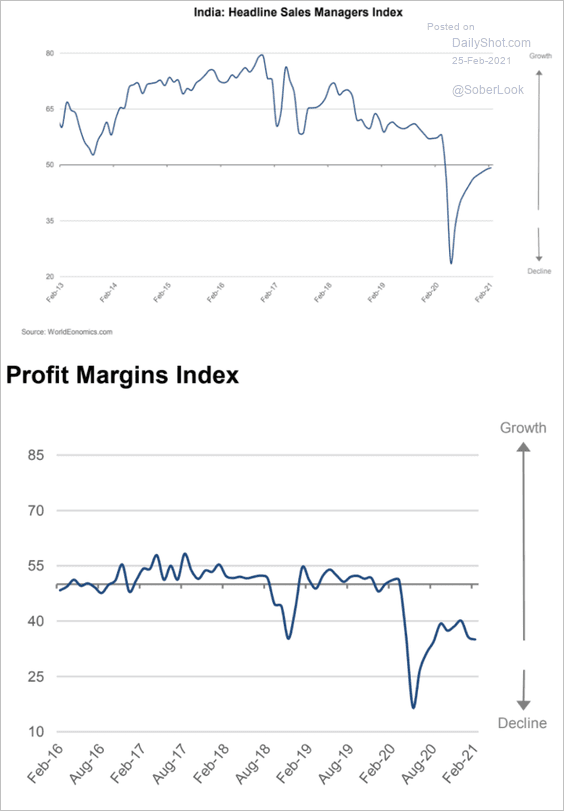 Source: World Economics
5. Some EM countries are outpacing developed nations in their vaccination progress.
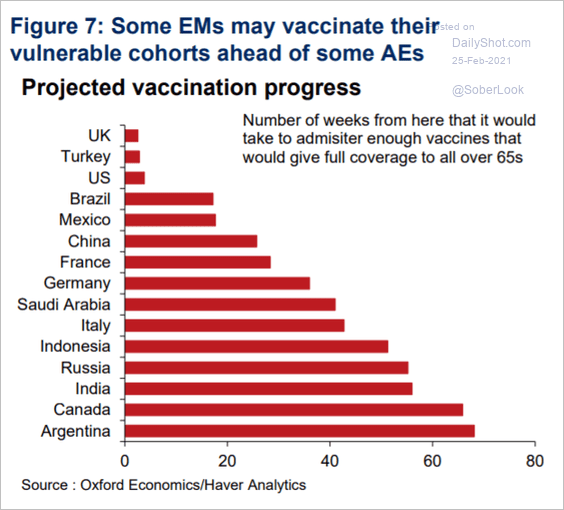 Source: Oxford Economics
Back to Index
Cryptocurrency
1. Digital asset investment products saw inflows totaling $492 million last week, with Bitcoin (BTC) products accounting for $412 million.
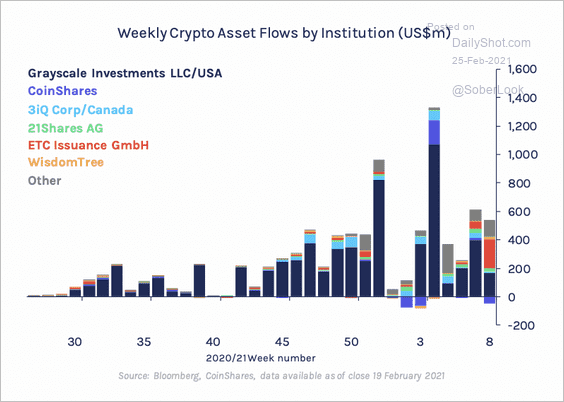 Source: CoinShares Read full article
2. Online search activity for cryptos has accelerated.
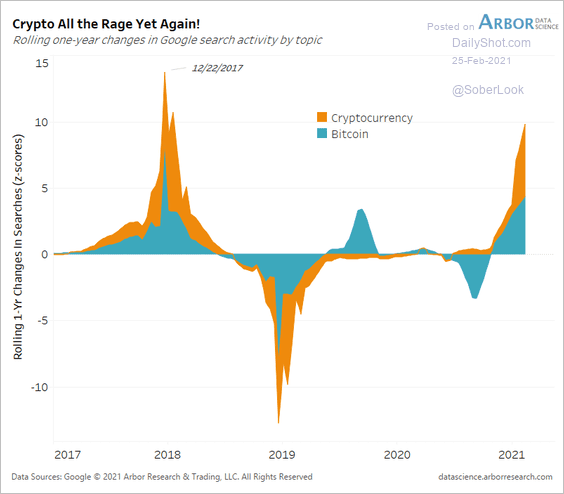 Source: Arbor Research & Trading
3. The current BTC drawdown is the largest since January.
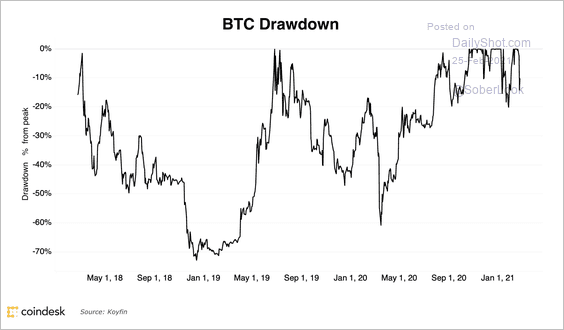 Source: @CoinDeskData
4. Ethereum (ETH) has underperformed BTC since its CME futures launch, accelerating during the recent crypto selloff.
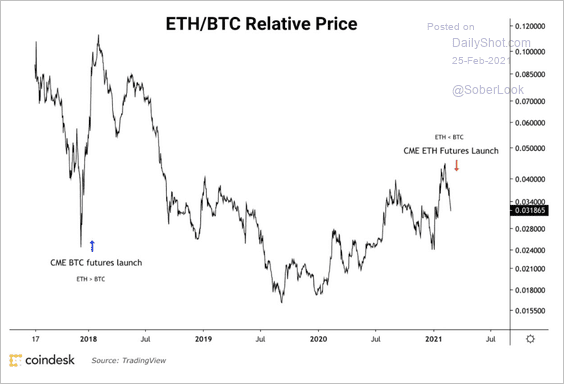 Source: @CoinDeskData
5. It’s been a tough week for cryptocurrencies so far.
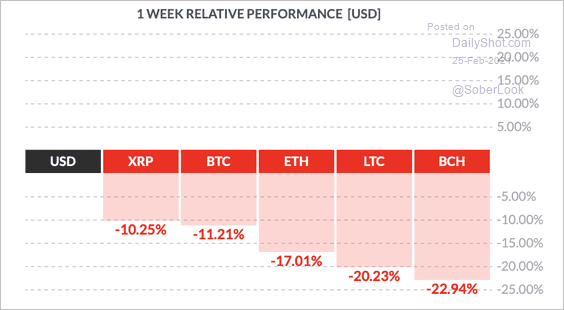 Source: FinViz
Back to Index
Commodities
1. Industrial metals keep climbing.
• US copper (highest since 2011):

• Nickel (boosted by hedge funds):
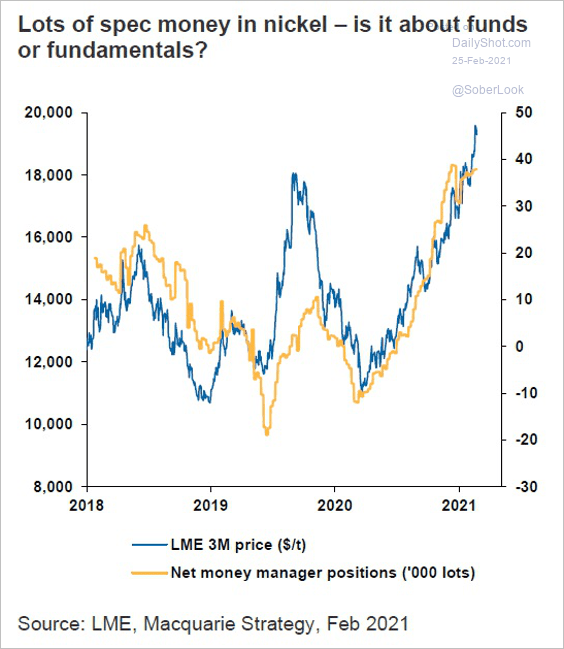 Source: Macquarie Strategy, @Scutty
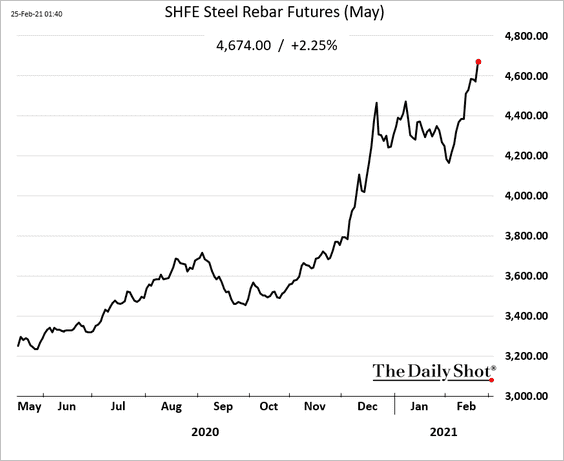
• Steel futures in China:
Steel prices in North America have risen sharply.
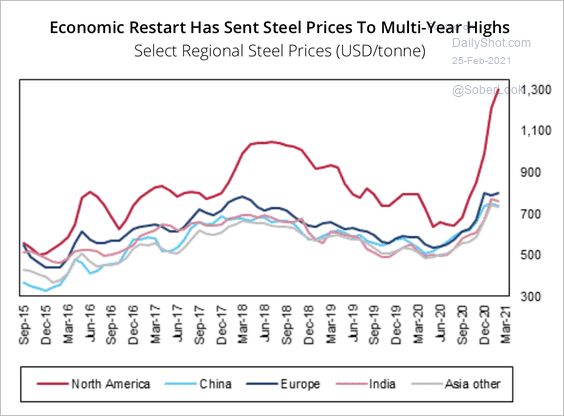 Source: Fitch Solutions Macro Research
——————–
2. Gold held support, but higher bond yields will remain a drag on the precious metal.
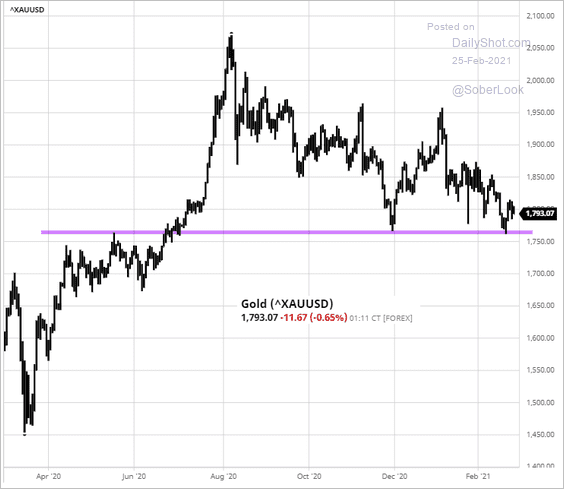 Source: barchart.com
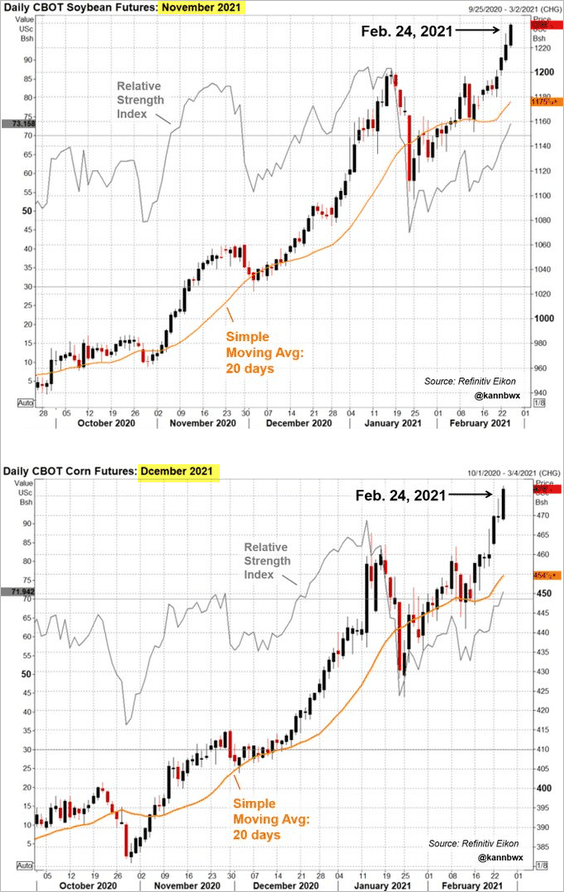
3. US wheat futures have been soaring.
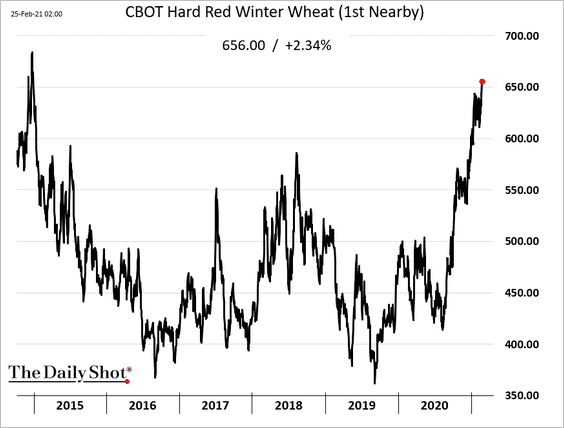
The charts below show “new crop” soybeans and corn futures (maturing this fall).
——————–
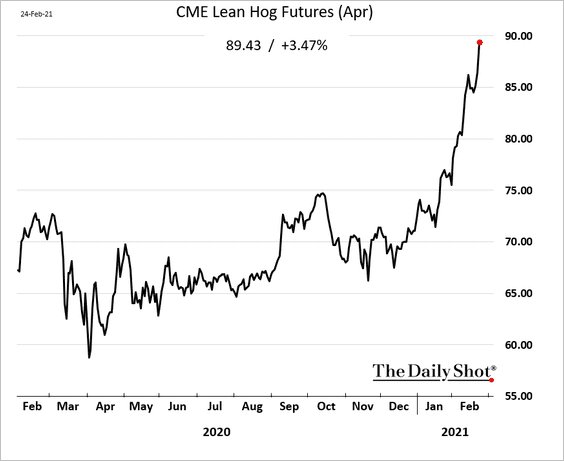
4. The Agriculture Department’s cold storage report showed declining pork belly and trim stocks, sending hog futures sharply higher.
5. It’s been a good month for commodities.
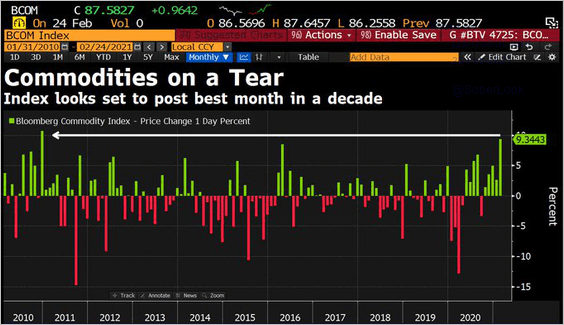 Source: @DavidInglesTV
Back to Index
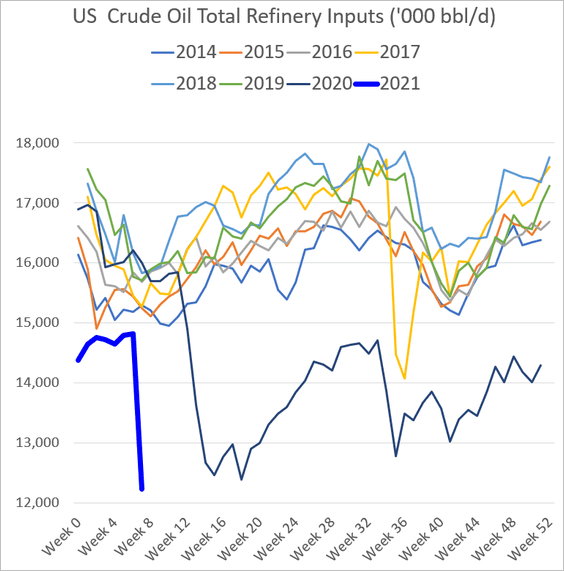
Energy
1. Last week’s freezing weather in Texas sent refinery runs to multi-year lows.
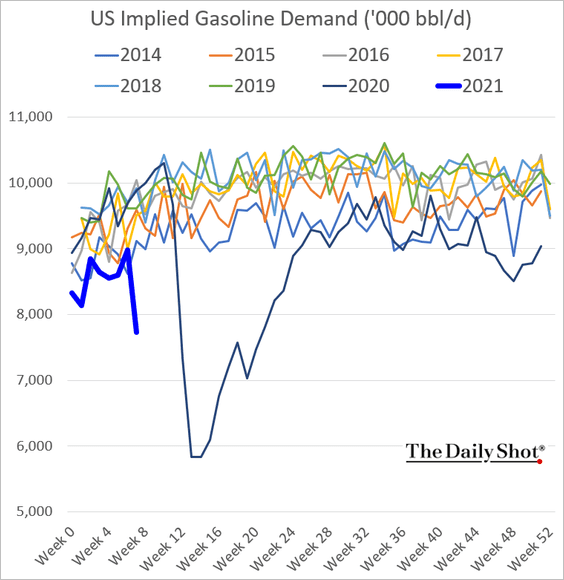
• Gasoline deliveries tumbled as well.
• And here is fuel ethanol production.
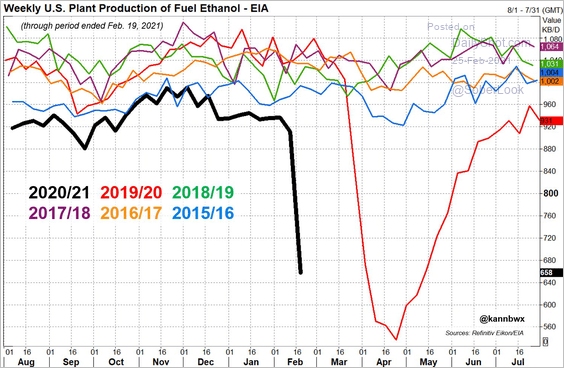 Source: @kannbwx
• Crude oil imports tumbled.
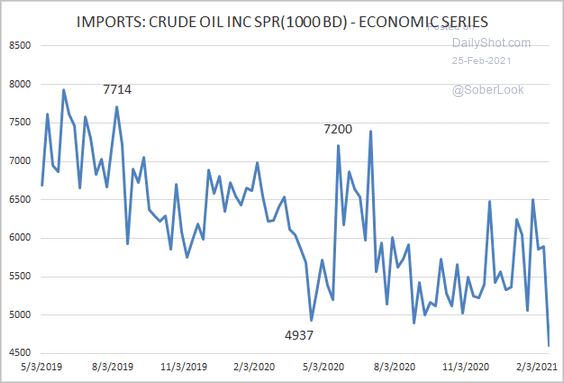 Source: @JeoffHall
——————–
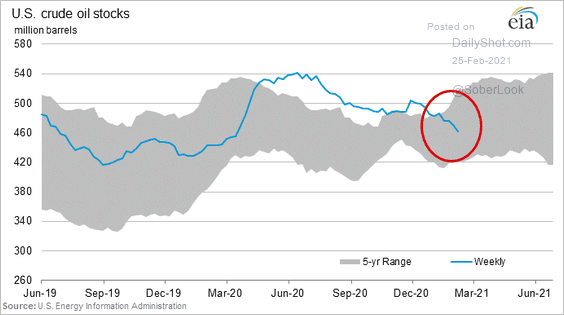
2. US crude oil inventories continue to decline.
Back to Index
Equities
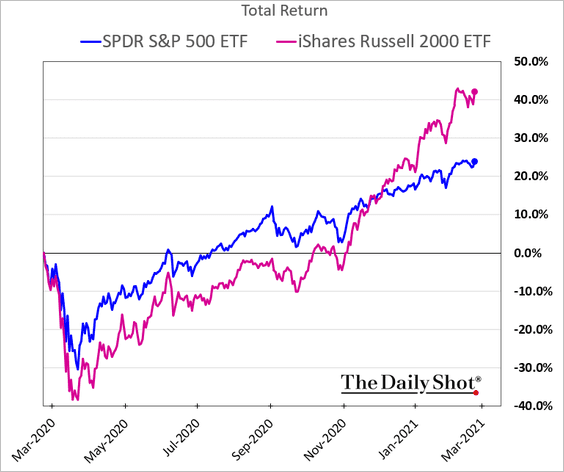
1. Let’s start with some relative performance trends over the past year.
• Small caps:
• Equal-weight S&P 500 (closing the gap):
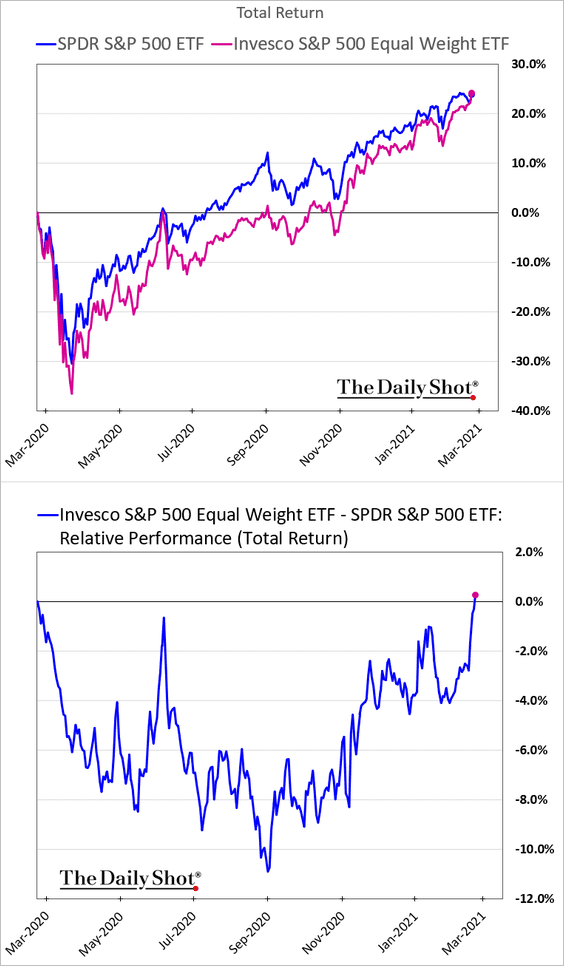 h/t Nancy Moran
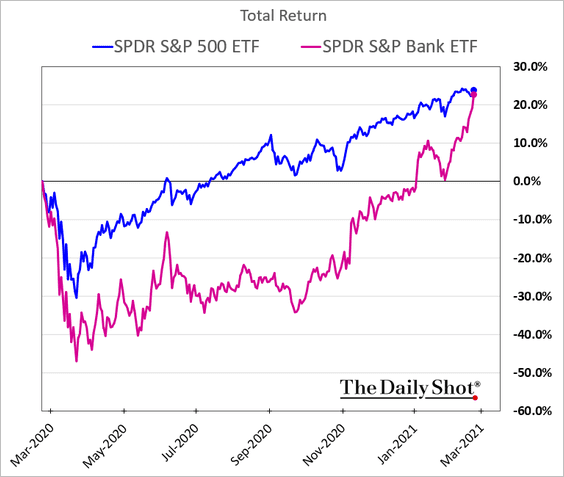
• Banks (closing the gap):
• High-beta stocks:
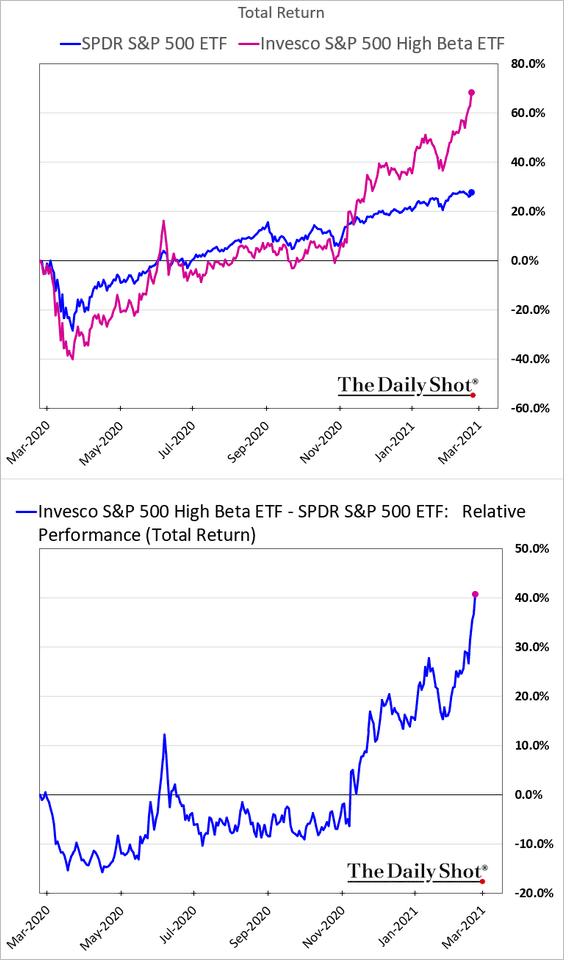
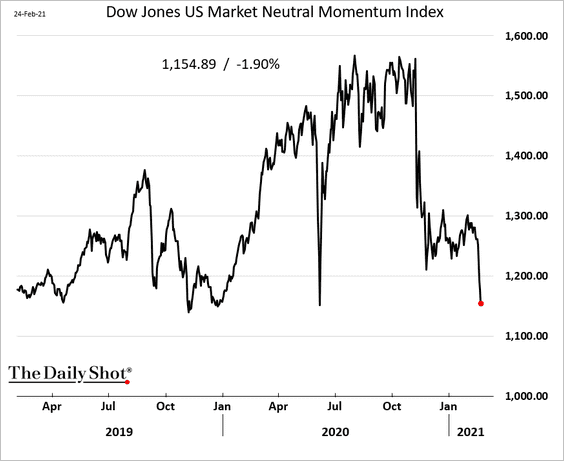
• Momentum factor:
——————–
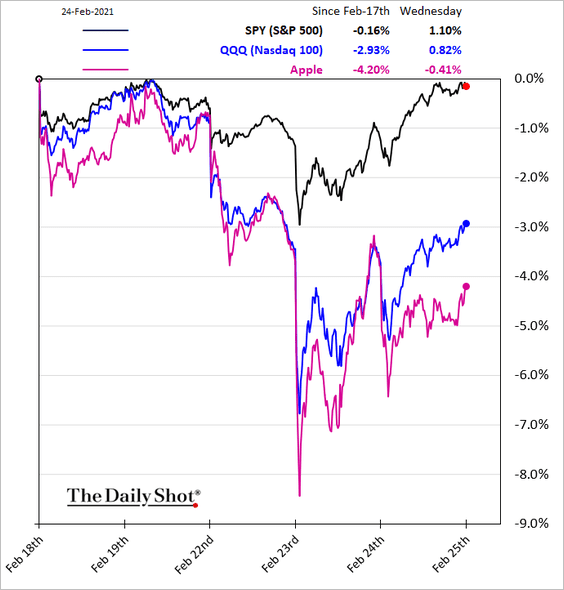
2. Mega-cap companies continue to underperform.
3. Some models suggest that given current valuations, long-term S&P 500 performance will be negative.
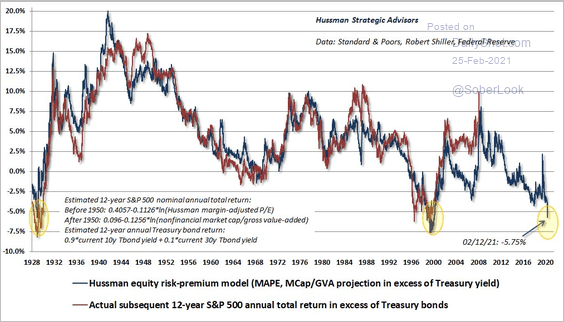 Source: @hussmanjp
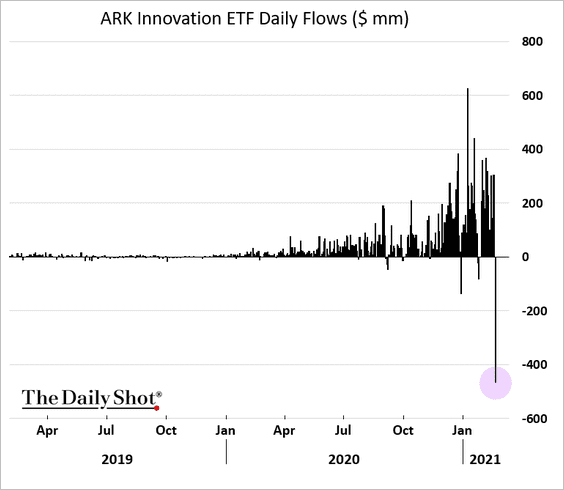
4. The popular ARK Innovation ETF saw some outflows.
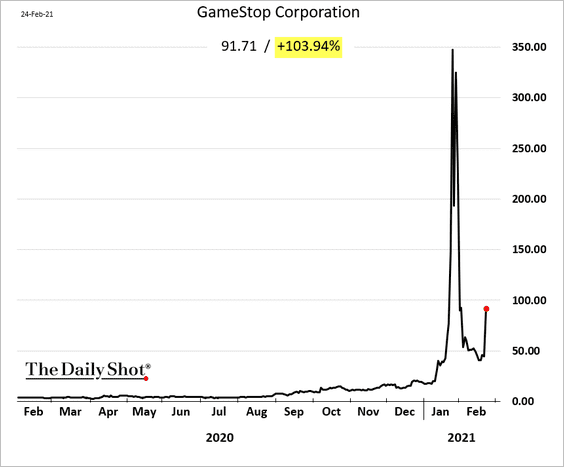
5. Here we go again.
6. An unusually high percentage of large-cap mutual funds have outperformed their benchmark this year.
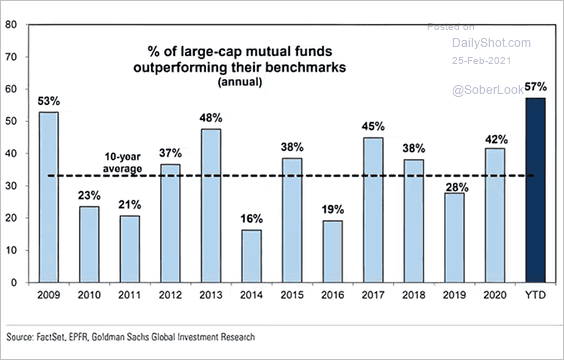 Source: @ISABELNET_SA, @GoldmanSachs
Back to Index
Rates
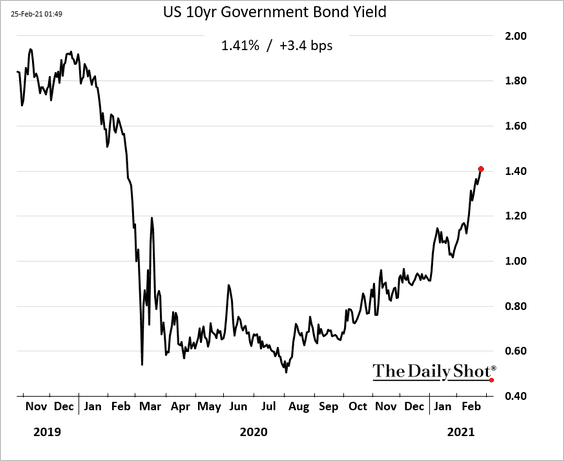
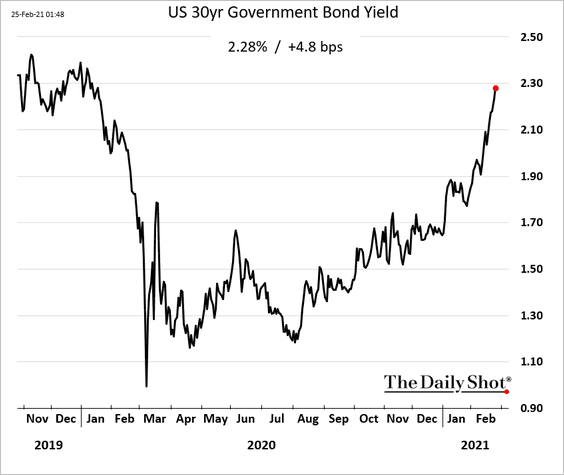
1. Treasury yields keep climbing, with the 10yr breaching 1.4%.
• Here is the 30yr yield.
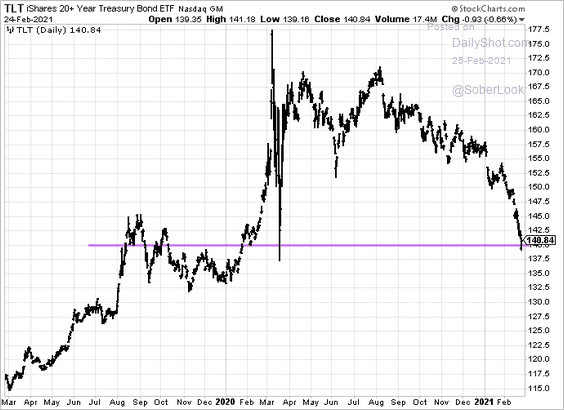
And this chart shows the iShares 20+ Year Treasury ETF.
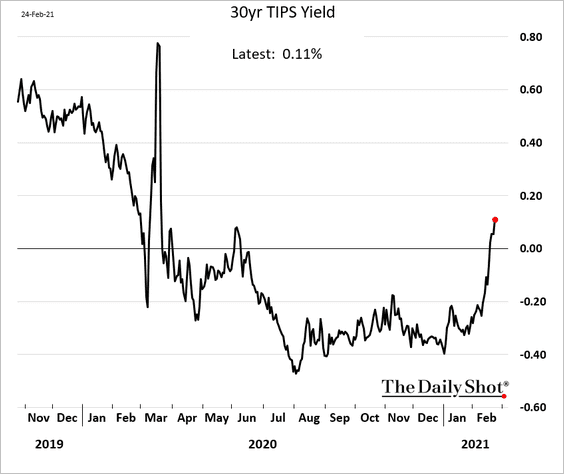
• The recent yield gains have been driven by real rates (TIPS yields) rather than inflation expectations.
• According to Alpine Macro, the 10yr Treasury yield has yet to return to “fair value.”
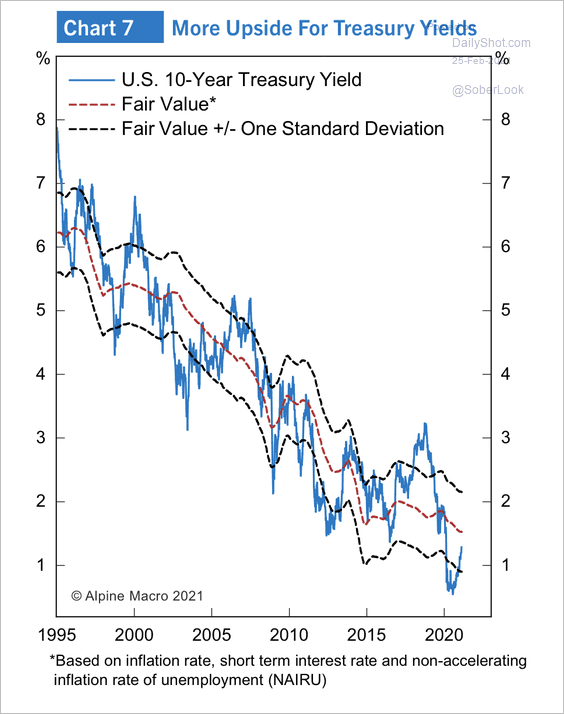 Source: Alpine Macro
——————–
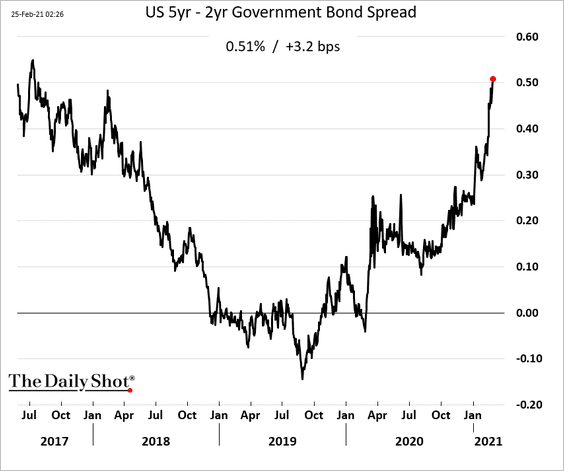
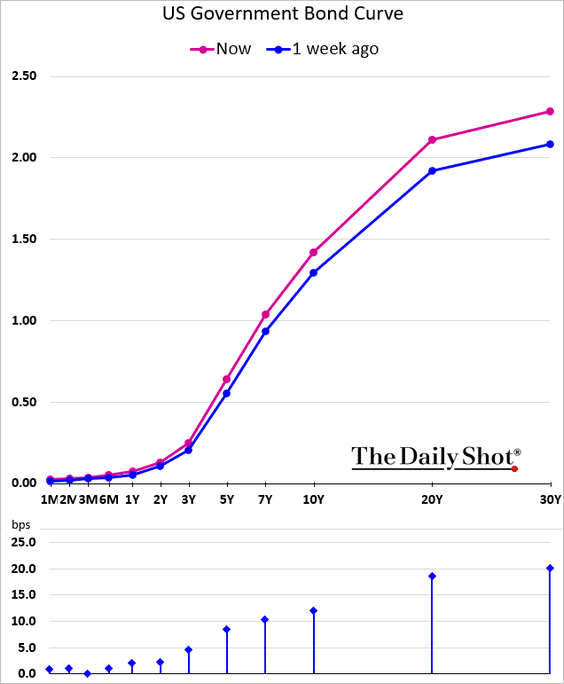
2. The yield curve is steepening across maturities, including at the short end.
——————–
3. CTAs/macro hedge funds have been shorting Treasuries and got rewarded for it.
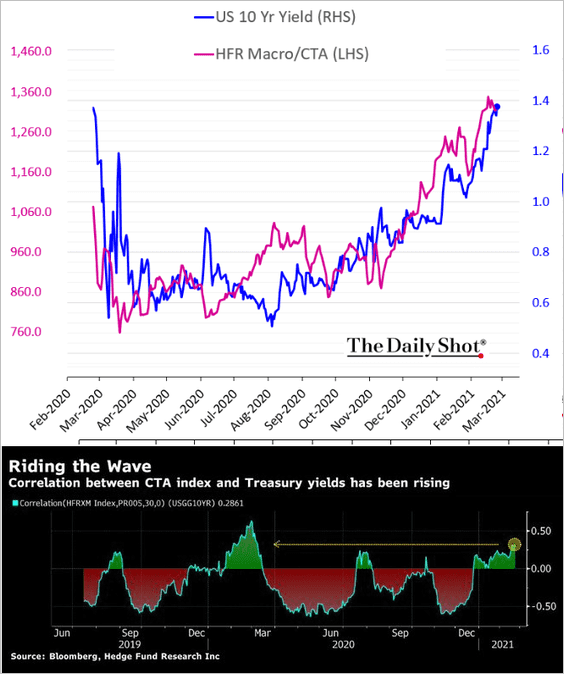 Source: @StephenSpratt Read full article
Back to Index
Global Developments
1. The dollar’s decline typically occurs during times of US equity market underperformance relative to the world.
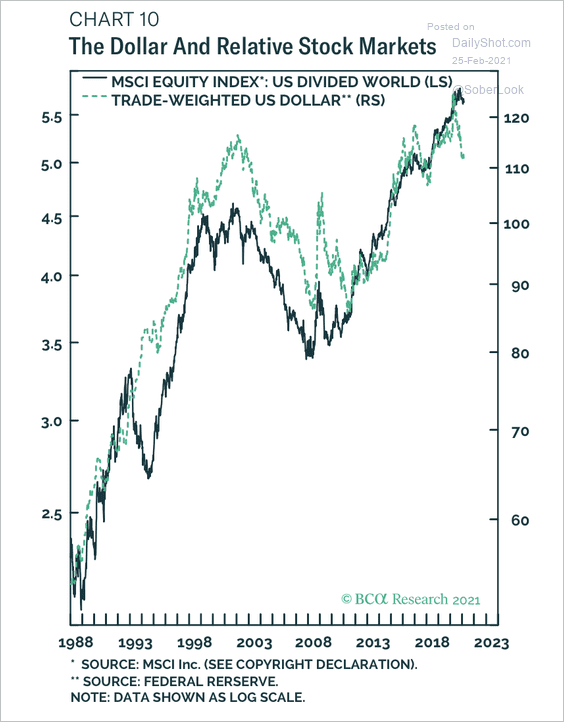 Source: BCA Research
Here is the US dollar’s seasonal trend.
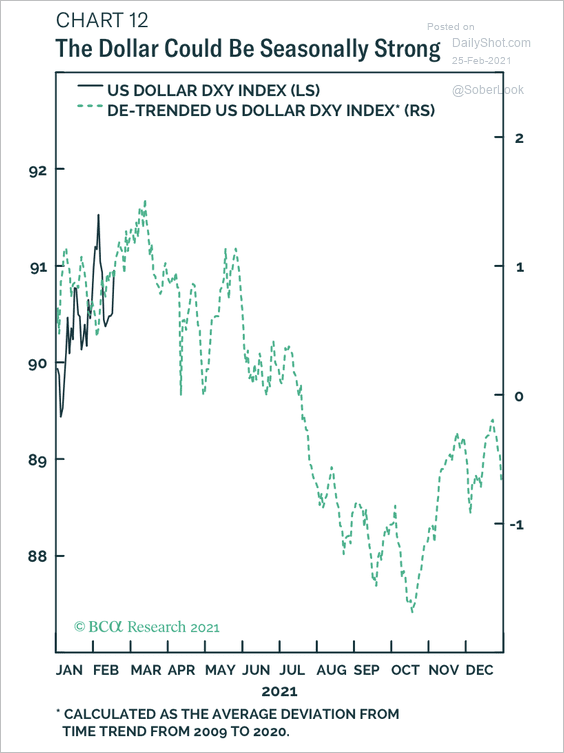 Source: BCA Research
——————–
2. The IMF expects global growth to bounce back this year.
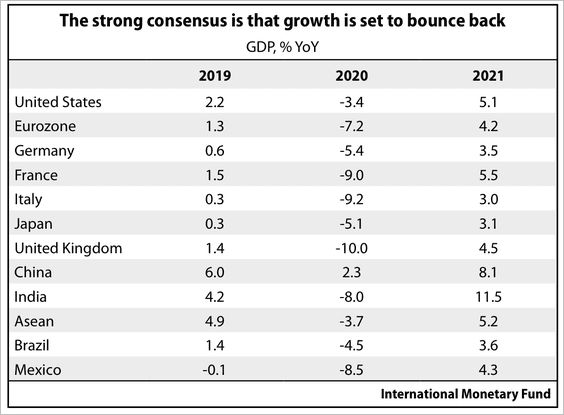 Source: Gavekal Research
However, many economies that had a strong Q4 are expected to shrink this quarter.
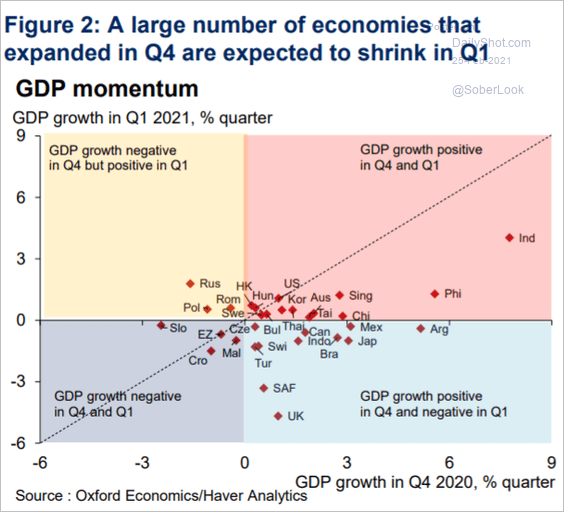 Source: Oxford Economics
——————–
Food for Thought
1. Prevalence of lactose intolerance globally:
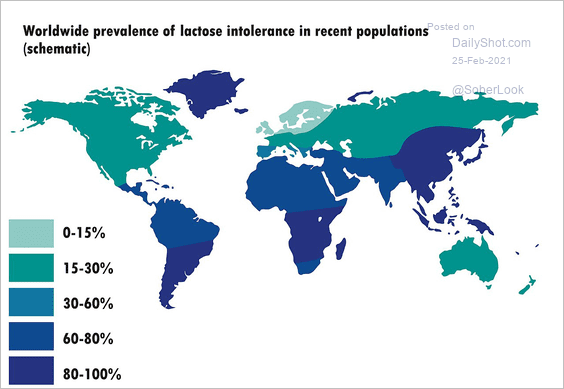 Source: Wikipedia Read full article
2. Pandemic-induced anxiety and depression:
 Source: Statista
3. Encouraging vaccine data from the UK:
 Source: @financialtimes Read full article
4. Wikipedia editors in different languages:
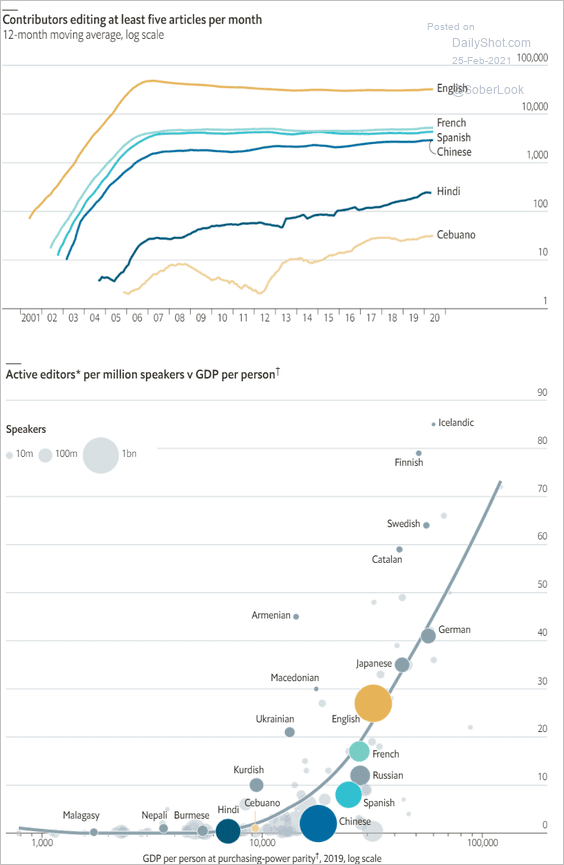 Source: The Economist Read full article
5. US homeowners who lived in their homes for more than twenty years:
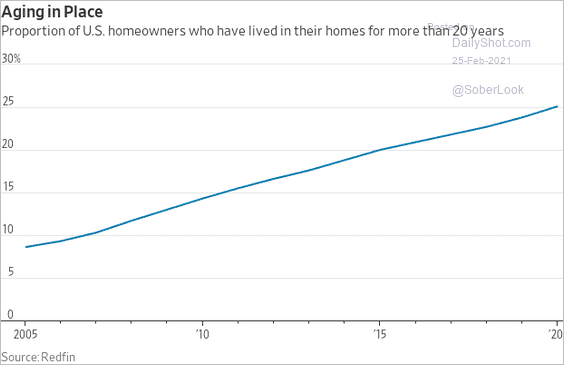 Source: @WSJ Read full article
6. US states’ population change over the past decade:
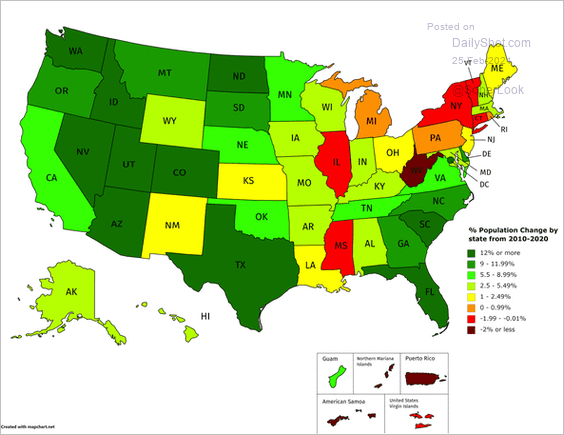 Source: reddit
7. Who are the top income earners in the US?
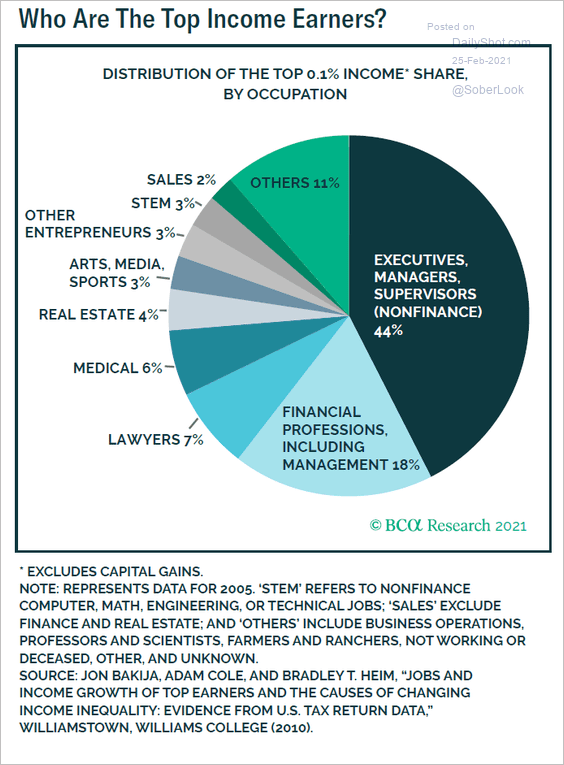 Source: BCA Research
8. Projected US debt-to-GDP ratio:
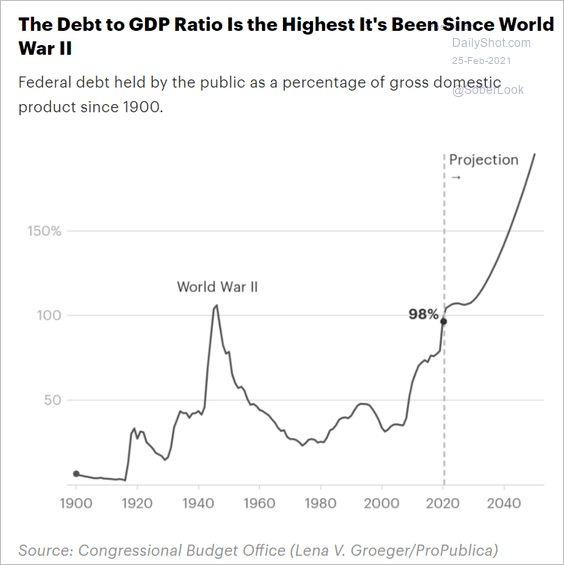 Source: ProPublica Read full article
9. The chess boom:
 Source: @chartrdaily
——————–
Back to Index