
The Daily Shot: 26-Feb-21
• Rates
• Equities
• Commodities
• Energy
• Cryptocurrency
• Emerging Markets
• China
• Asia – Pacific
• The Eurozone
• The United Kingdom
• The United States
• Food for Thought
Rates
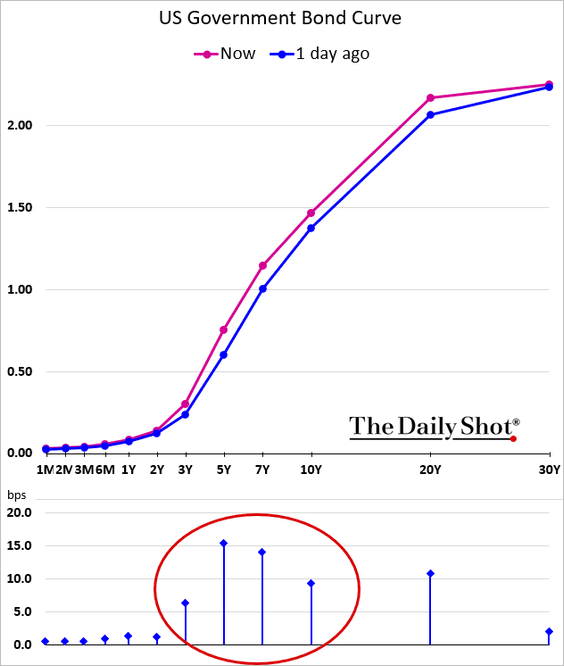
1. The belly of the Treasury curve took a hit on Thursday.
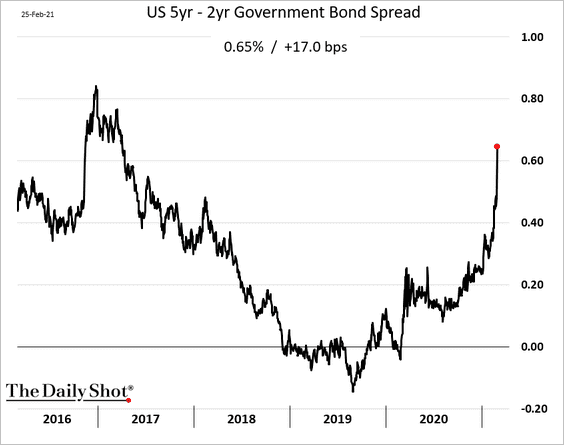
• The 5yr – 2yr Treasury spread:
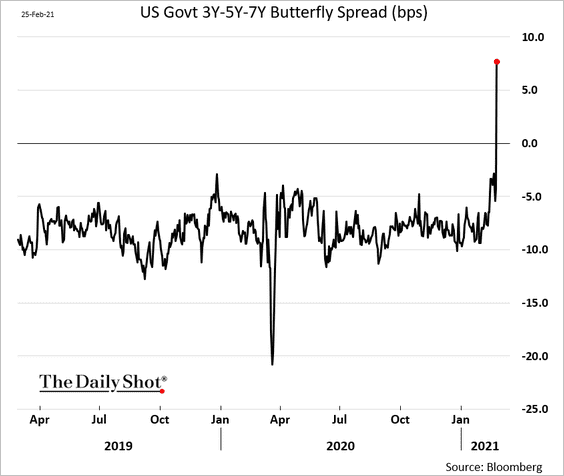
• The 3yr-5yr-7yr butterfly spread (the biggest 1-day move in years):
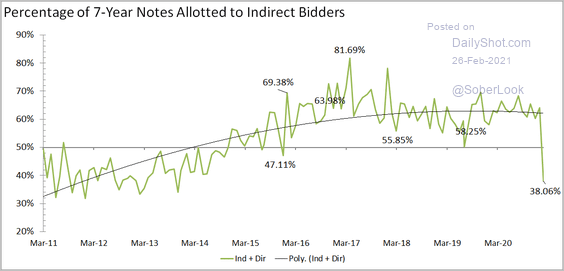
• Many indirect bidders pulled out of the 7yr Treasury auction.
 Source: @JeoffHall
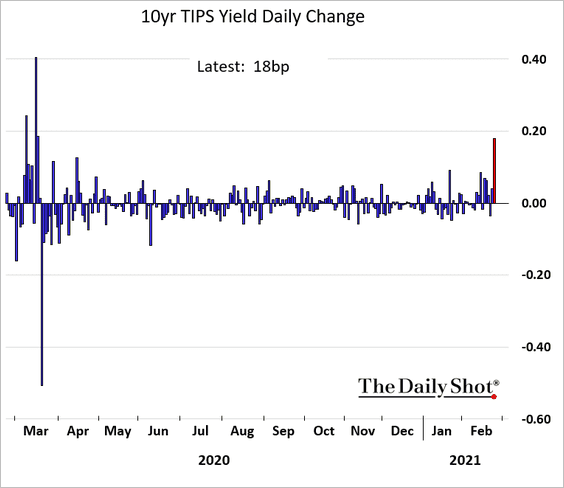
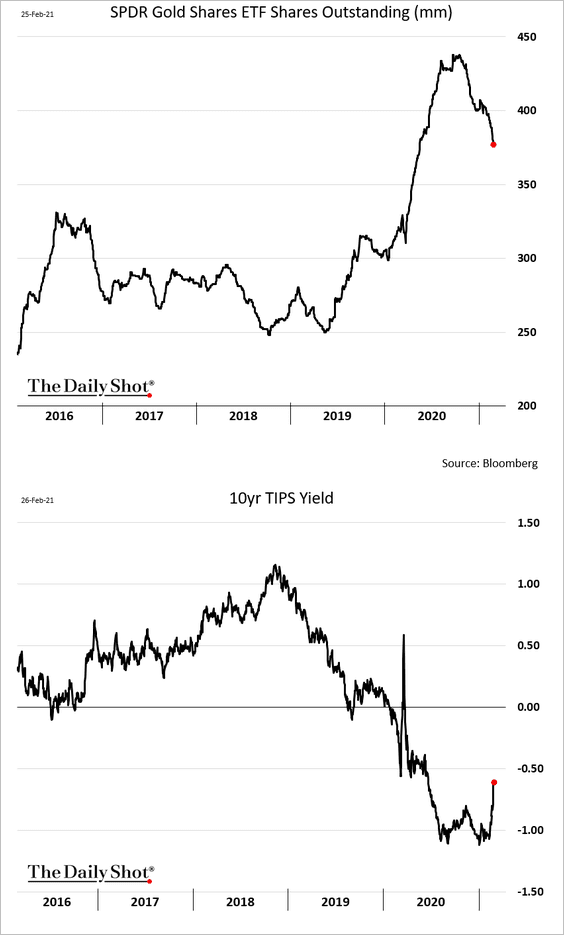
• Real rates jumped.
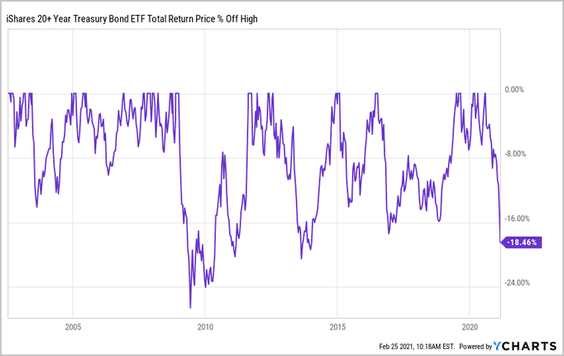
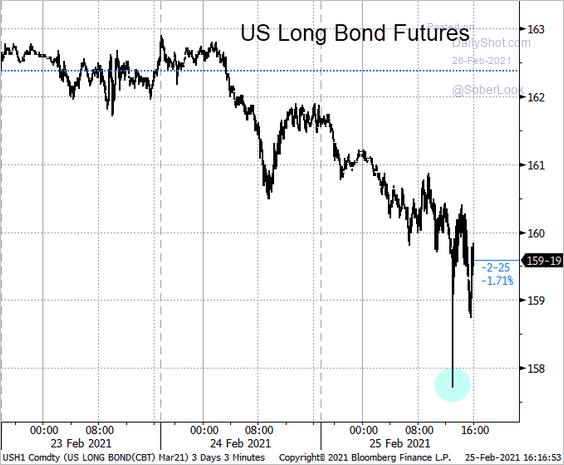
• It’s been a tough few weeks for Treasuries.
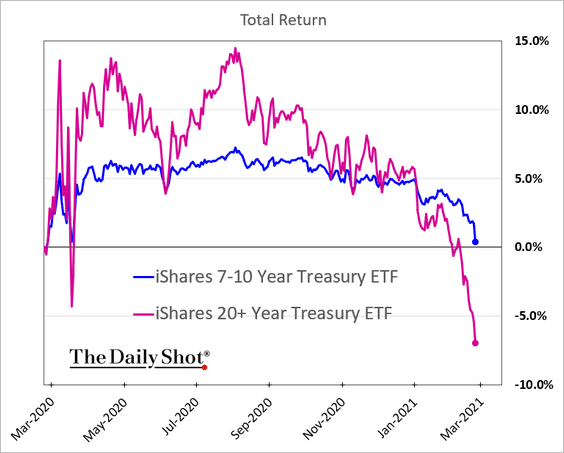
Here is the drawdown.
——————–
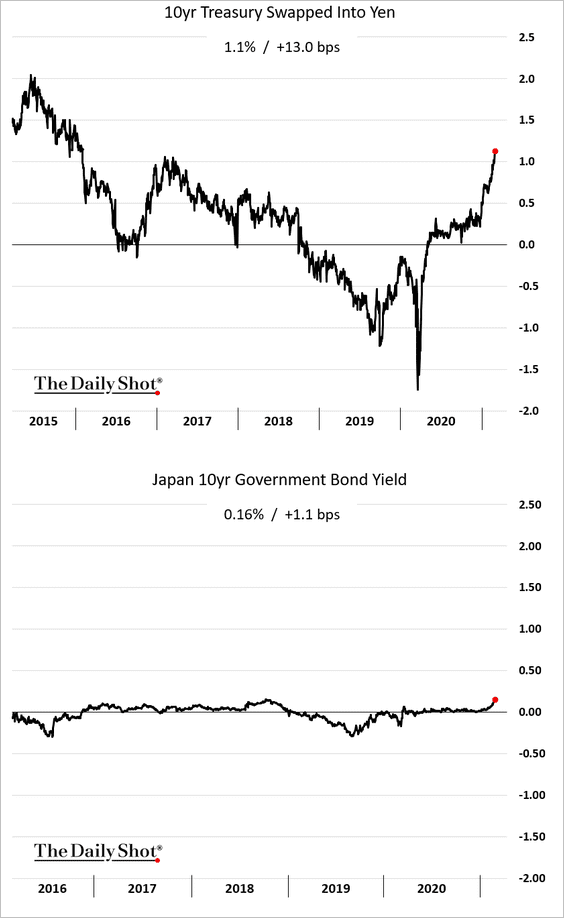
2. Is the Treasury selloff overdone? US debt is becoming increasingly attractive for European and Japanese investors.
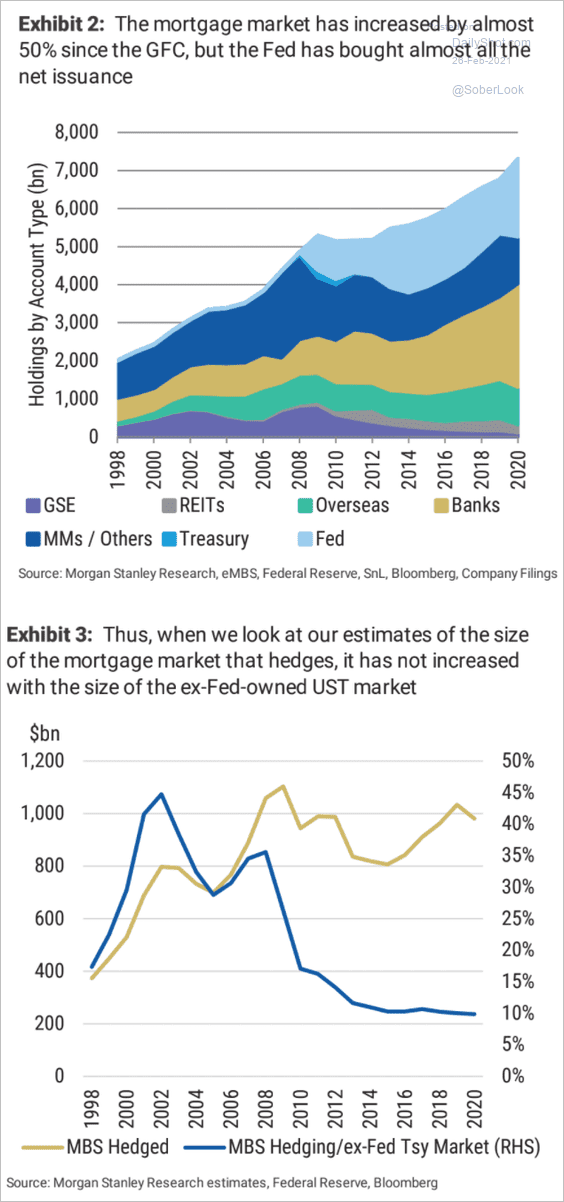
3. With longer-term rates rising, mortgage refinancing is expected to slow down, extending the duration of MBS securities. Holders of MBS (who are short convexity) found themselves increasingly long duration and were forced to hedge their exposure (often happens when rates rise suddenly). The hedging processes, which is usually done via rate swaps, added to downward pressure on Treasuries.
 Source: @markets Read full article
It’s unclear just how much of an impact mortgage convexity hedging is having on the market. The mortgage market increased by some 50% since the financial crisis, but the Fed now holds a substantial portion of MBS securities. The second chart below shows Morgan Stanley’s estimate of mortgage market hedges.
 Source: Morgan Stanley Research
——————–
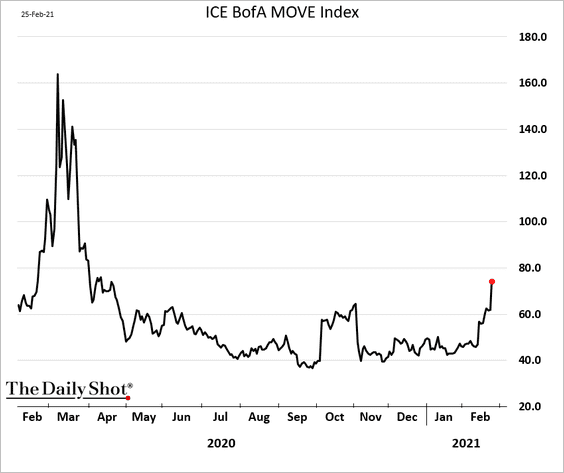
4. Treasury implied volatility keeps climbing.
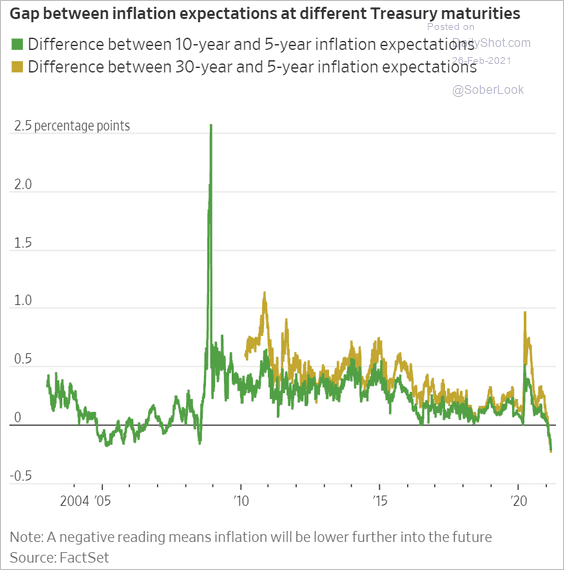
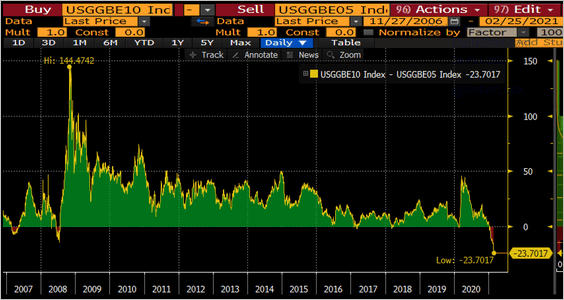
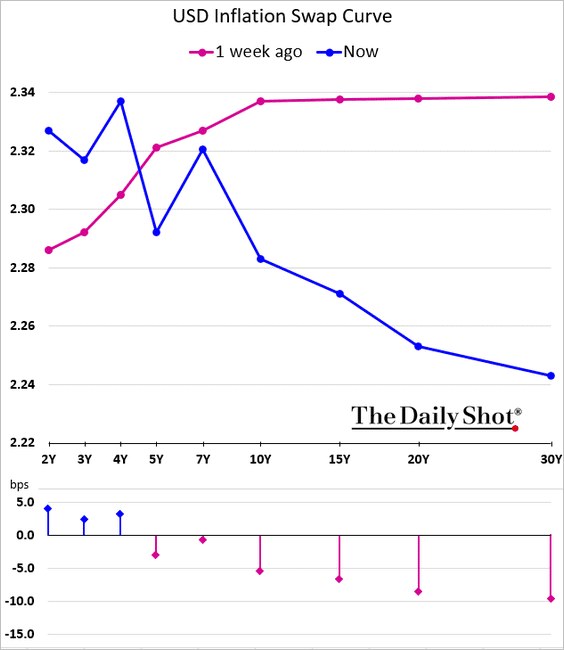
5. Longer-dated breakeven rates (inflation expectations) have been highly correlated with stocks recently (see the equities section). Something unusual happened this week in inflation markets – the breakeven curve inverted. The market now expects a stimulus-driven spike in inflation but sees price gains moderating over the long run.
 Source: @WSJ Read full article
 Source: @lisaabramowicz1
Here is the inflation swap curve.
 Source: Bloomberg
——————–
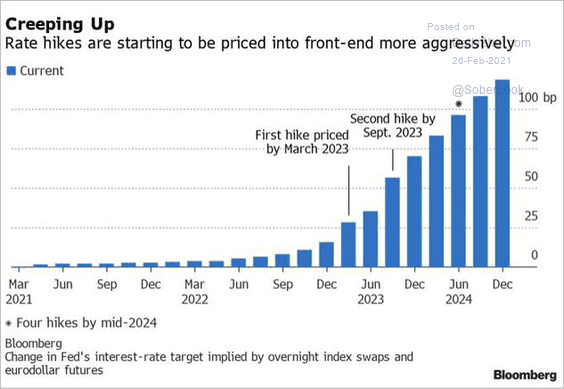
6. The market is rapidly raising expectations of rate hikes a couple of years out.
 Source: @EddBolingbroke, @TheTerminal
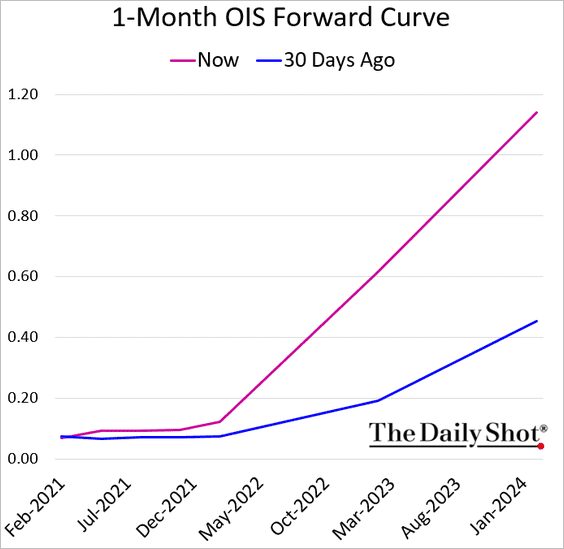
Here is the market expectation for short-term rates.
 Source: @TheTerminal, Bloomberg Finance L.P.
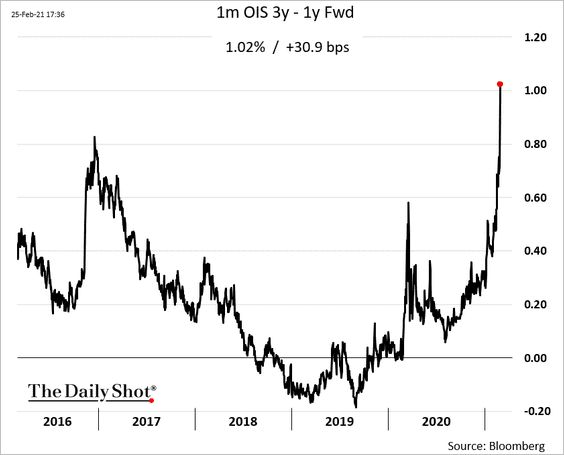
This chart shows the spread between expected short-term rates one year out vs. three years out.
——————–
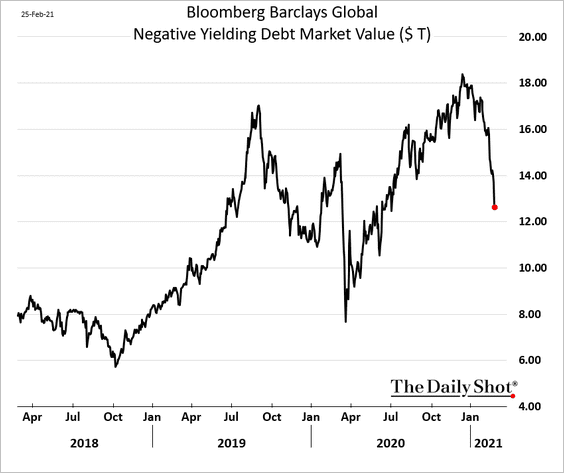
7. Negative-yielding debt market value continues to decline.
8. The public wants to know about bond yields.
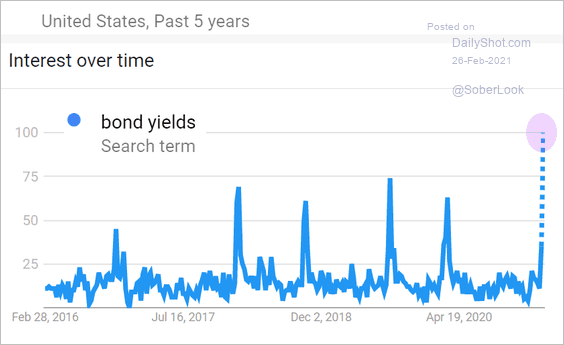 Source: Google Trends, @Peter_Atwater
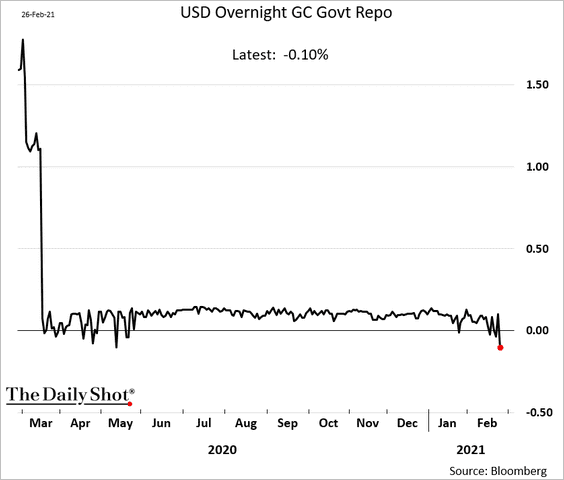
9. The US Treasury is starting to pull capital from its account at the Fed (as was expected), further boosting liquidity in the private sector.
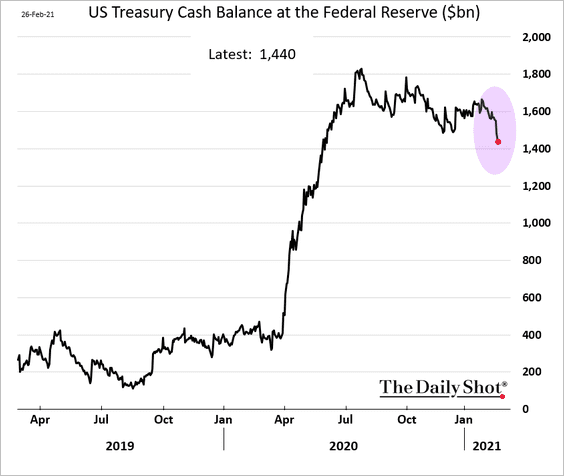
This process will continue to put downward pressure on short-term rates.
Back to Index
Equities
1. Strong economic data in the US put further downward pressure on Treasuries, spooking stock investors.
 Source: @TheTerminal, Bloomberg Finance L.P.
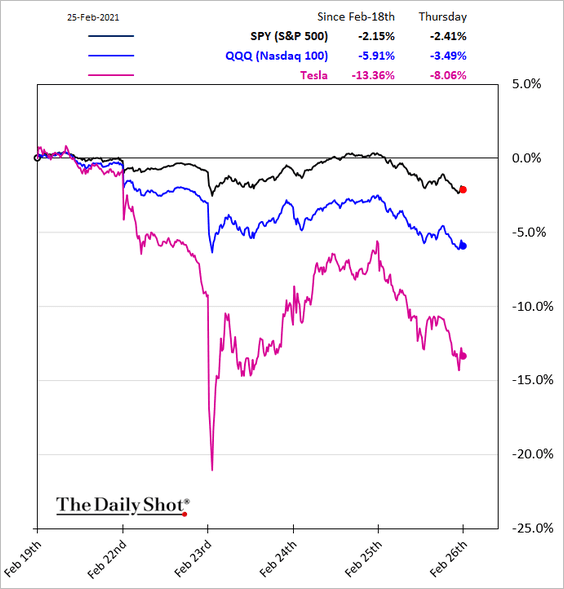
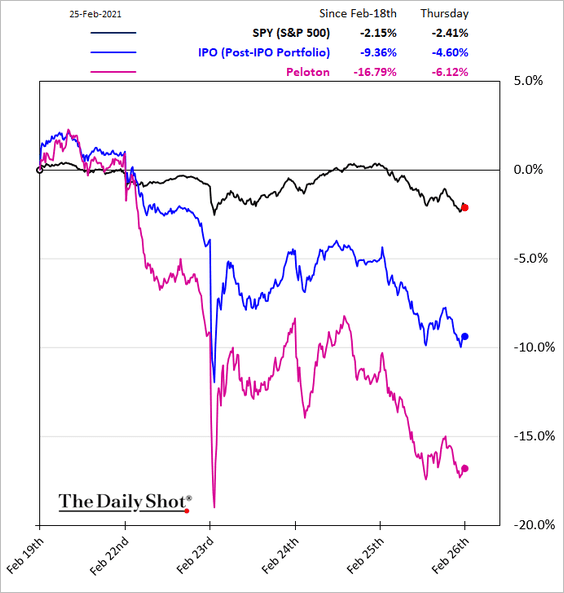
Tech and other high-flyers dragged US indices sharply lower.
• Nasdaq 100:
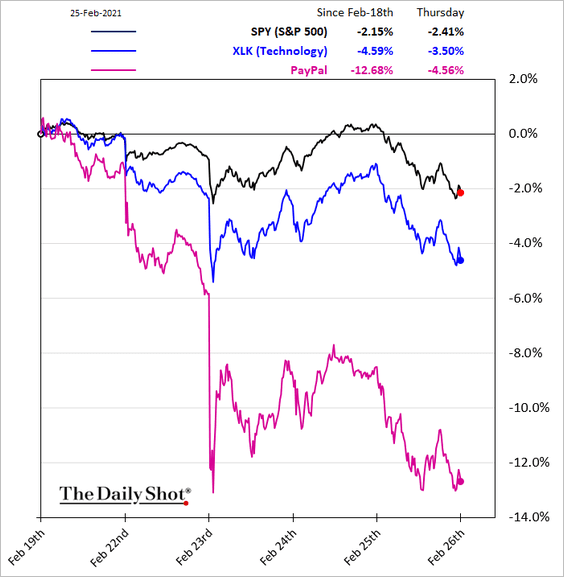
• The tech sector:
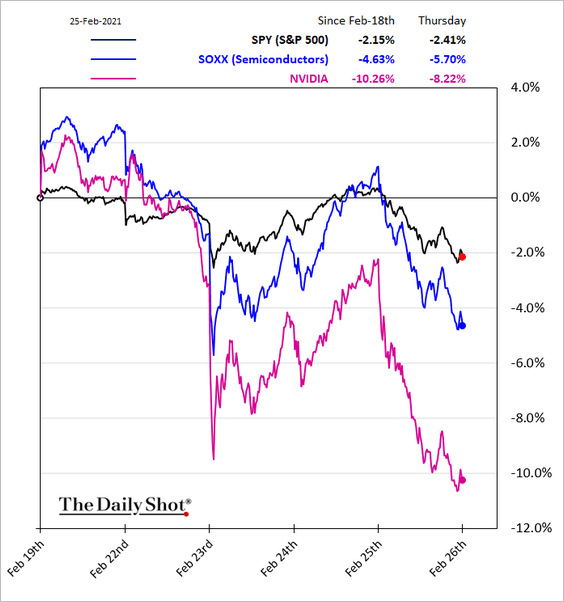
• Semiconductors:
• Post-IPO stocks:
——————–
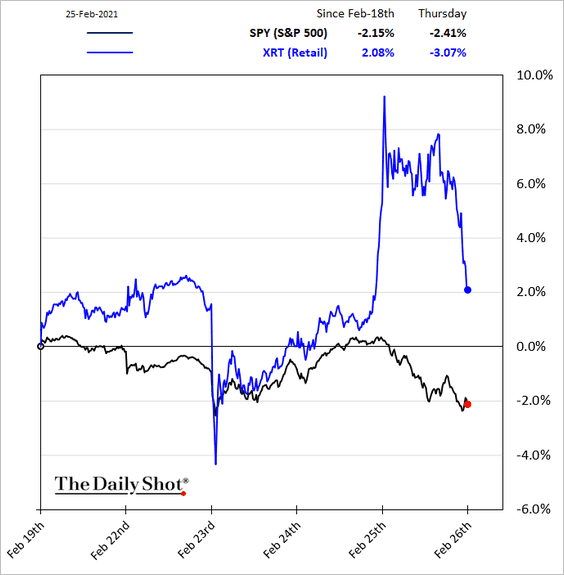
2. The S&P retail sector continues to get whipsawed by GameStop.
3. How does the market perform under different real rate and breakeven (inflation expectations) scenarios?
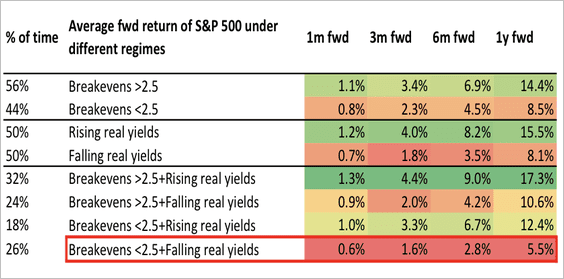 Source: Variant Perception
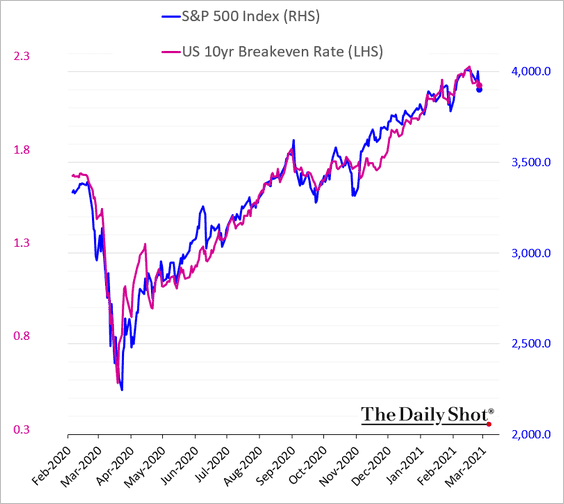
The correlation between the S&P 500 and the 10-year breakeven rate over the past 12 months has been remarkable. Longer-term breakeven rates have pulled back in recent days (see the rates section).
——————–
4. Intraday correlation between stocks and bonds turned positive.
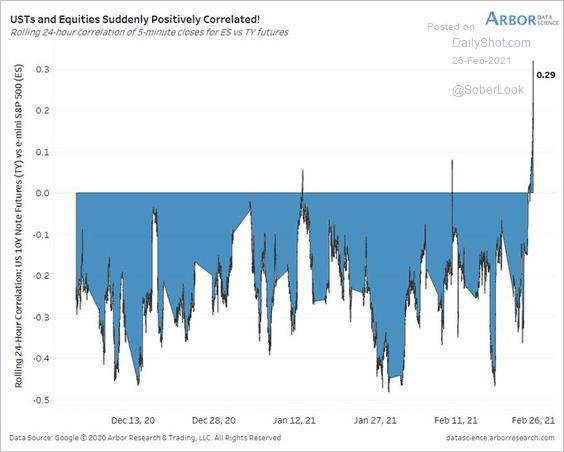 Source: @benbreitholtz
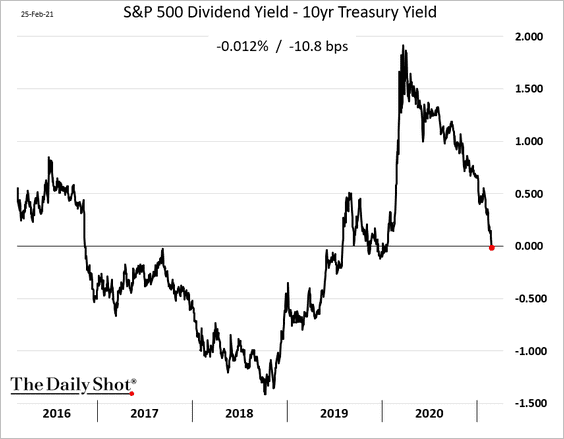
5. The 10yr Treasury yield climbed above the S&P 500 dividend yield.
6. Will massive liquidity injections over the past year keep powering global stocks higher?
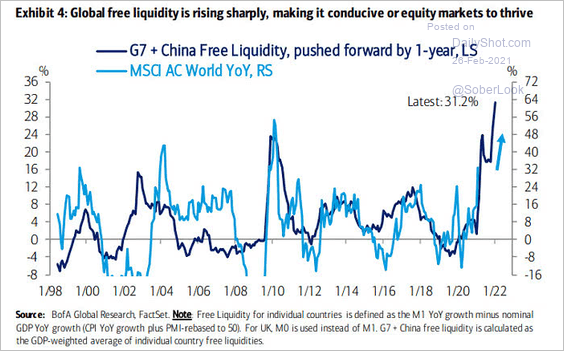 Source: @ISABELNET_SA, @BofAML
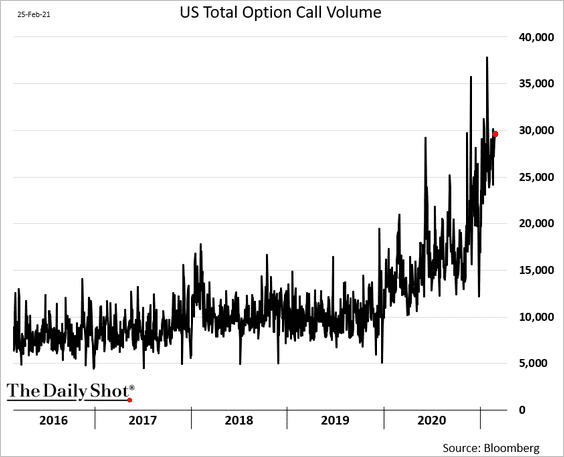
7. Retail investors continue to drive up call option trading volumes.
Back to Index
Commodities
1. Rising real rates are forcing investors out of gold ETFs.
2. US corn and soybean planted acres rose this year as prices recovered.
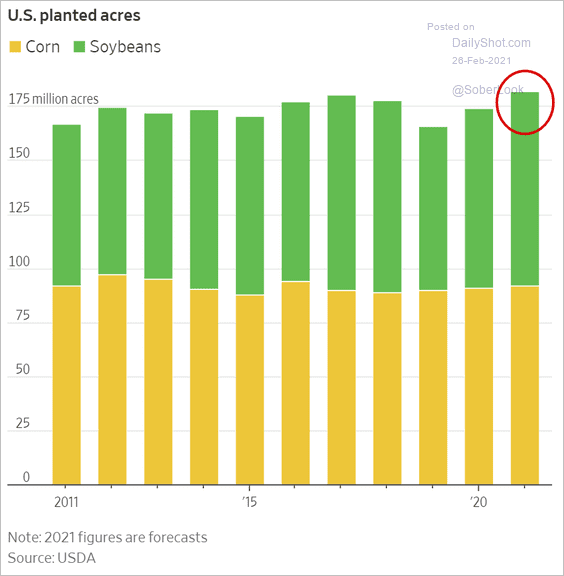 Source: @WSJ Read full article
Back to Index
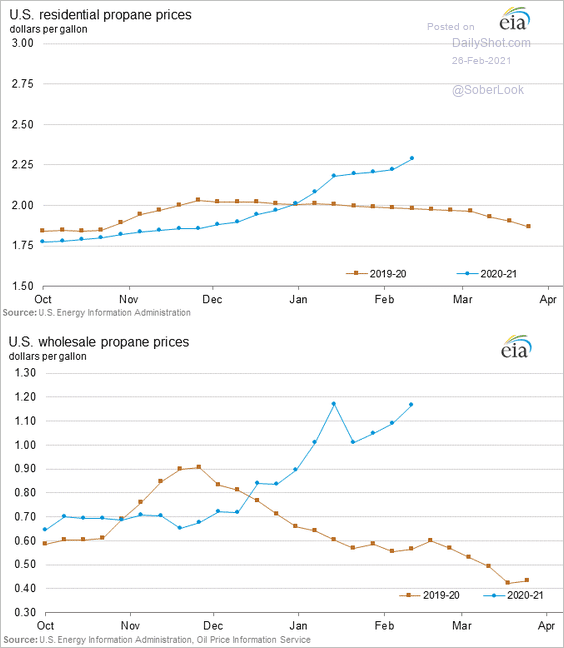
Energy
1. US natural gas inventories declined sharply last week and are now below the 5-year average.
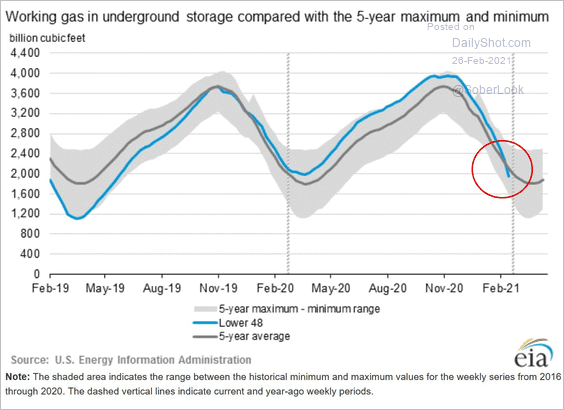 Source: @EIAgov Read full article
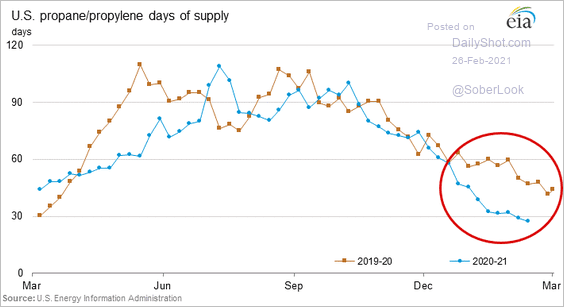
2. Propane inventories are also falling, pushing prices higher.
Back to Index
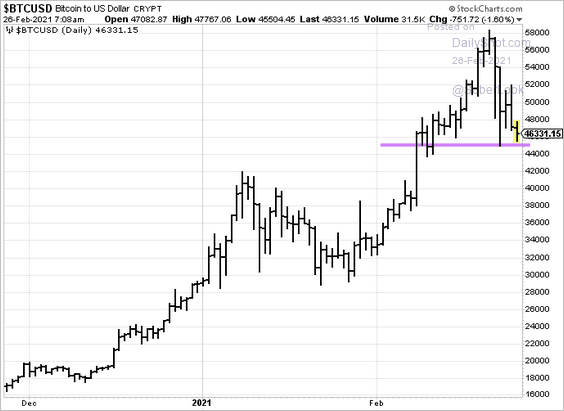
Cryptocurrency
1. Bitcoin held support at $45k.
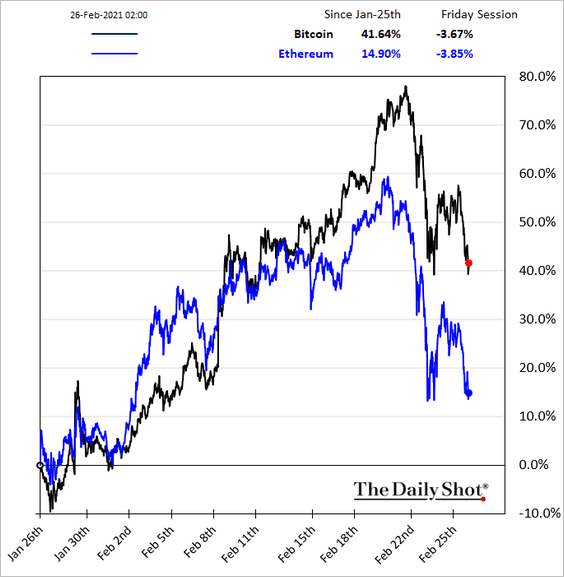
Here is the relative performance.
——————–
2. The average intraday move of Tesla has been slightly higher than BTC and ETH over the past year (Tesla sometimes trades like a cryptocurrency). FAANG stocks have relatively lower intraday moves.
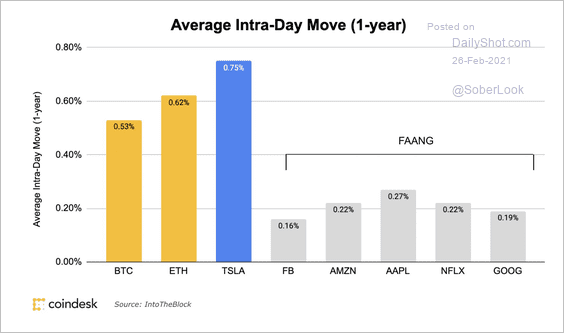 Source: @CoinDeskData
3. Coinbase had more monthly transacting users in Q4 2020 than in Q1 2018, which preceded a crypto bear market.
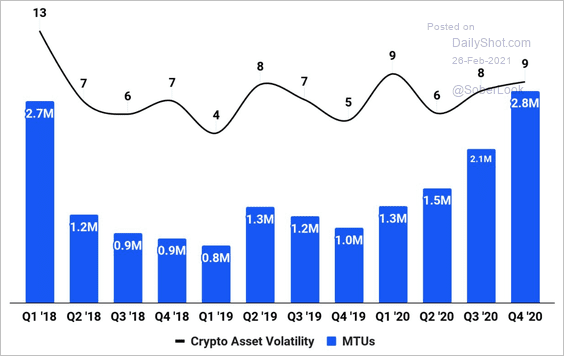 Source: Coinbase Read full article
4. The largest public fund holding Bitcoin (Grayscale) started trading at a discount to NAV.
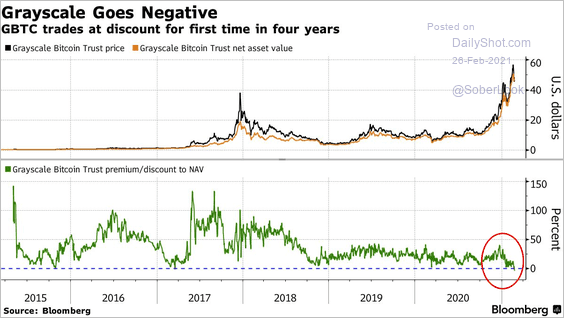 Source: @BloombergQuint Read full article
5. Bitcoin’s market value is not yet extreme relative to its realized value.
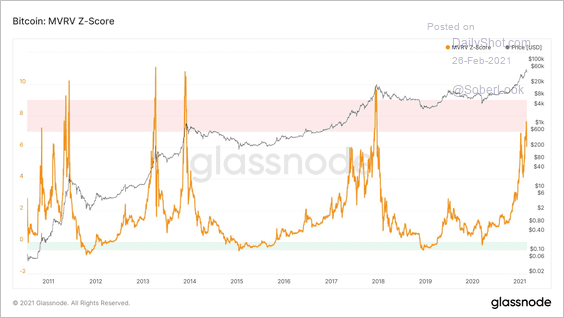 Source: Glassnode
Back to Index
Emerging Markets
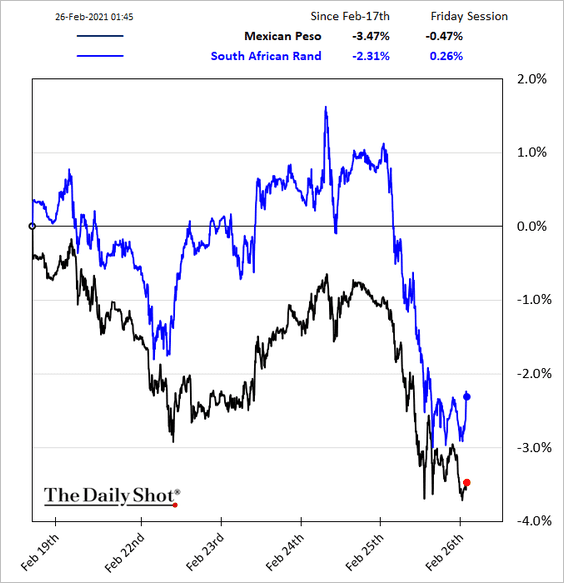
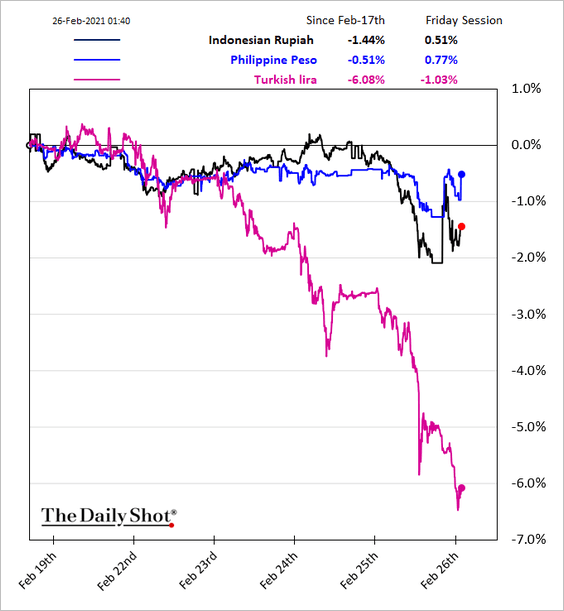
1. This week’s selloff in EM currencies appears to be ebbing, except for the Turkish lira.
Many EM currencies are below their real effective exchange rates.
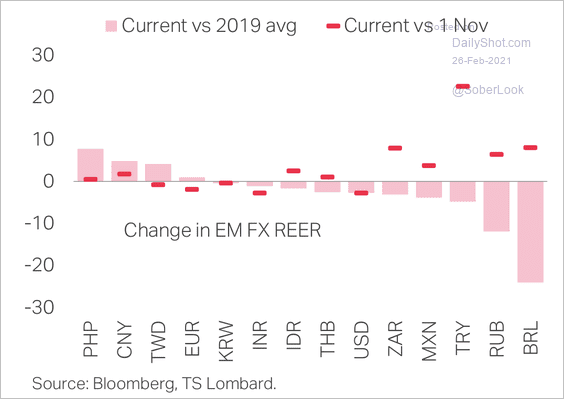 Source: TS Lombard
——————–
2. How much fiscal adjustment is required to stabilize debt (under different rate scenarios)?
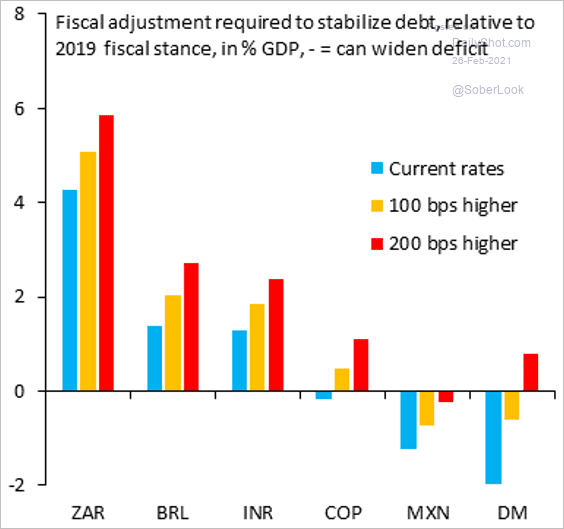 Source: @SergiLanauIIF
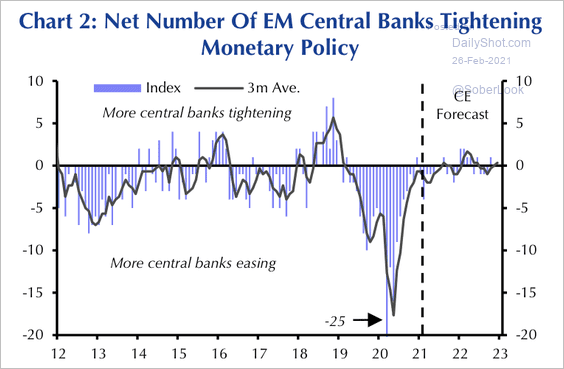
3. The market expects rate hikes in India and Russia over the next year.
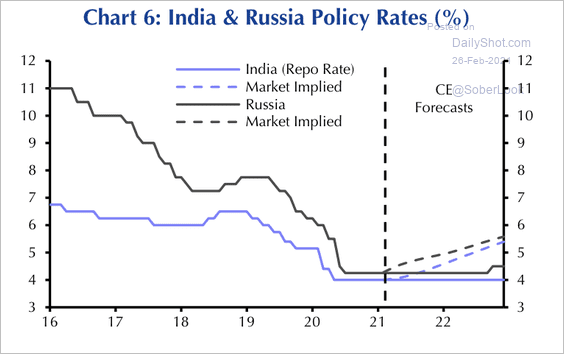 Source: Capital Economics
Capital Economics expects the majority of EM central banks to keep rates on hold this year.
 Source: Capital Economics
——————–
4. Here are some updates on Russia.
• Ruble – oil divergence:
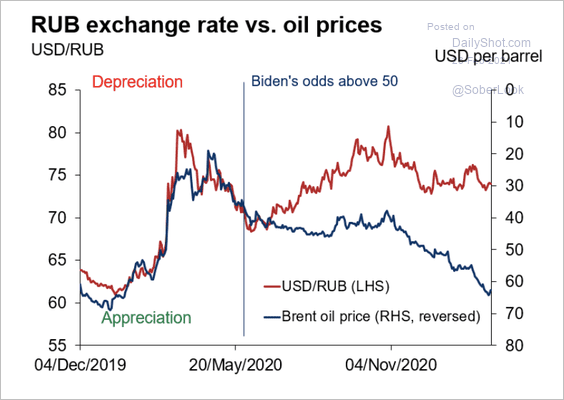 Source: Oxford Economics
• Worsening economic confidence:
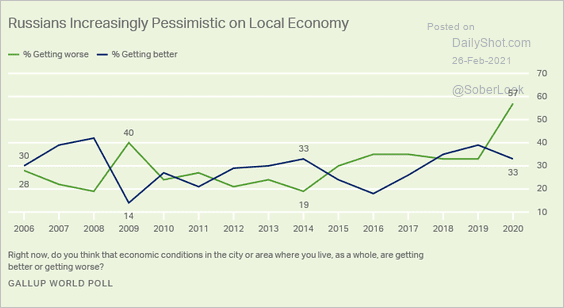 Source: Gallup Read full article
• Concerns about corruption:
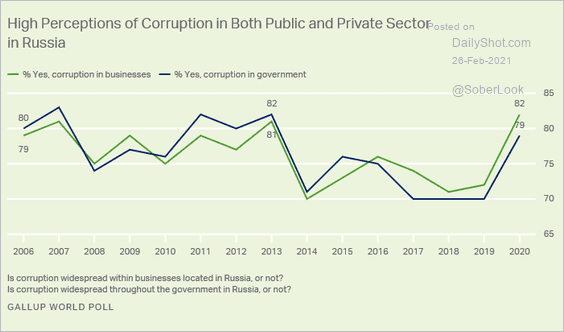 Source: Gallup Read full article
——————–
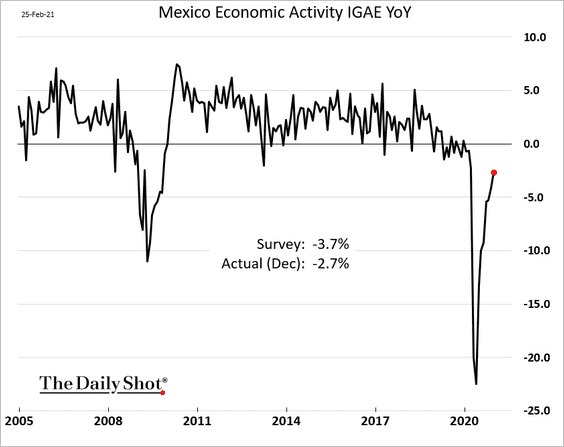
5. Mexico’s economic activity is gradually recovering.
Back to Index
China
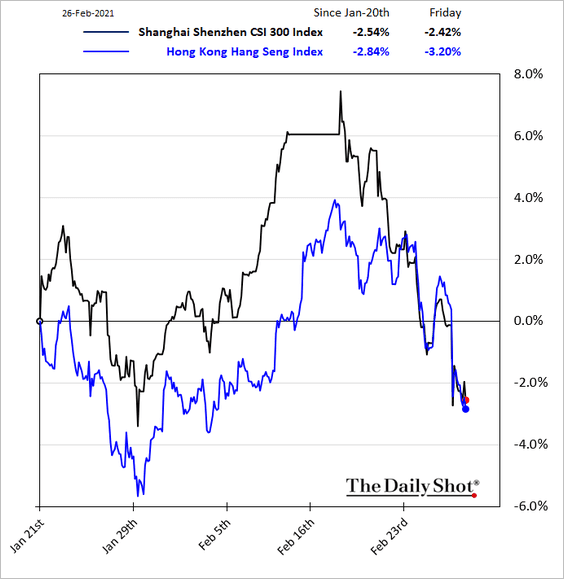
1. Stocks are trending lower.
The Consumer Staples sector took a hit.
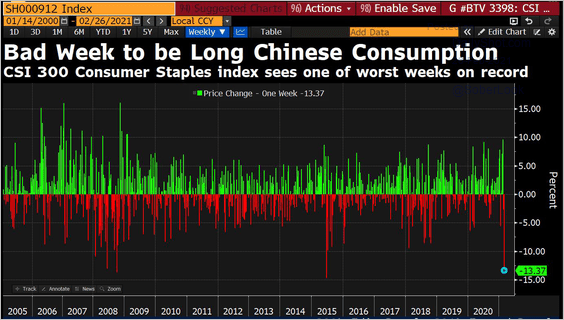 Source: @DavidInglesTV
——————–
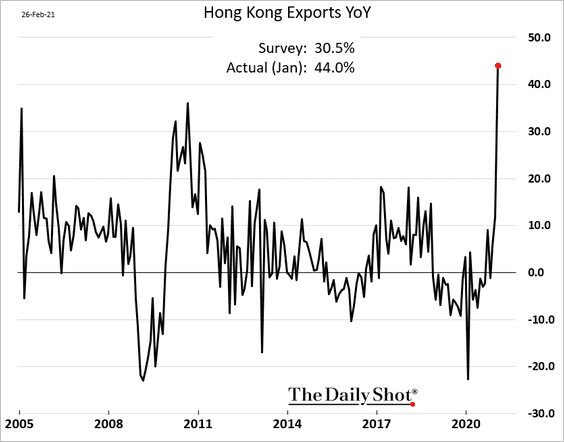
2. Hong Kong’s exports spiked last month.
 Source: @markets Read full article
Back to Index
Asia – Pacific
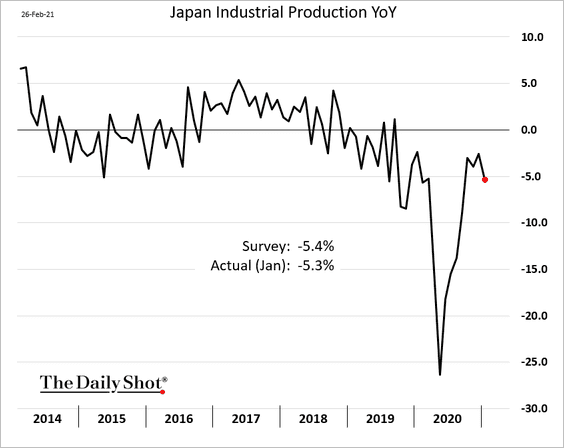
1. Japan’s industrial production weakened last month (in line with expectations).
2. Below-average rainfall created some water shortages in Taiwan, which held back chip production.
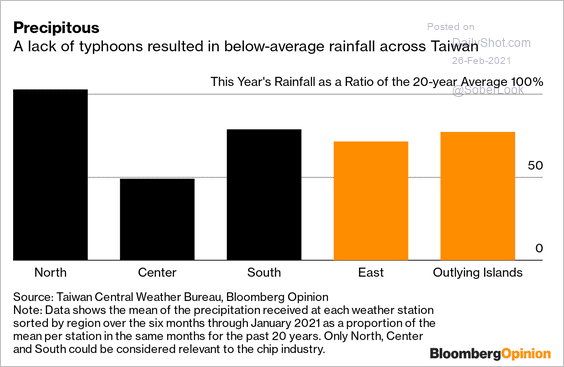 Source: @tculpan, @bopinion Read full article
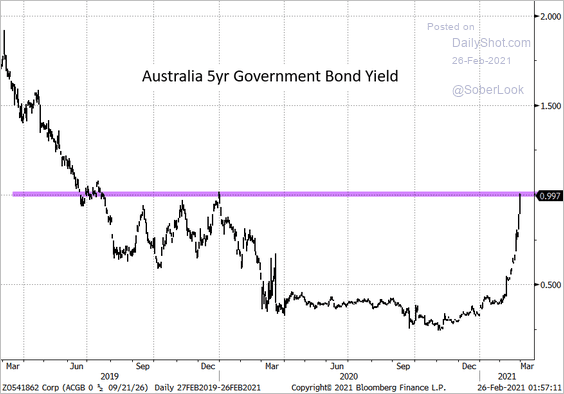
3. Australia’s 5yr bond yield is testing resistance at 1%.
 Source: @TheTerminal, Bloomberg Finance L.P.
Back to Index
The Eurozone
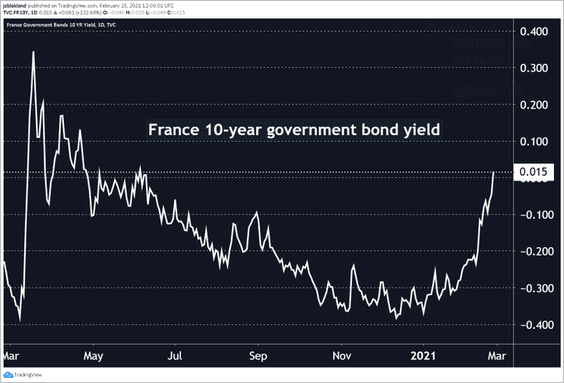
1. The French 10yr bond yield moved into positive territory.
 Source: @jsblokland
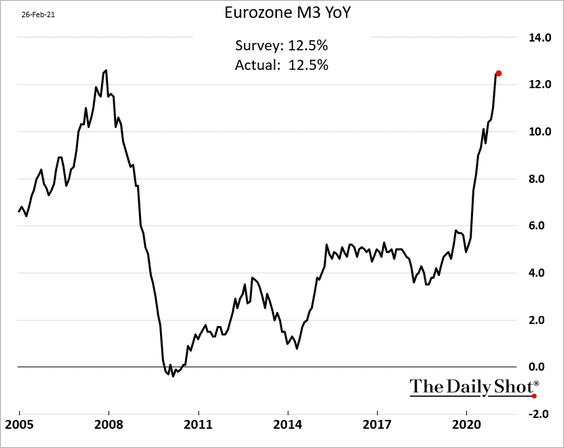
2. The broad money supply is 12.5% above last year’s levels.
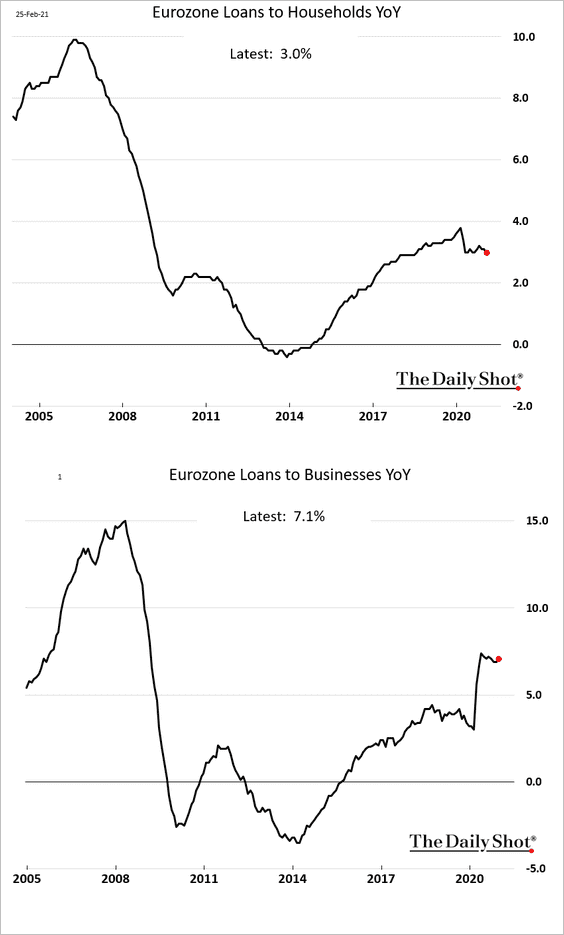
Business loan growth is holding steady, but credit to households is slowing.
——————–
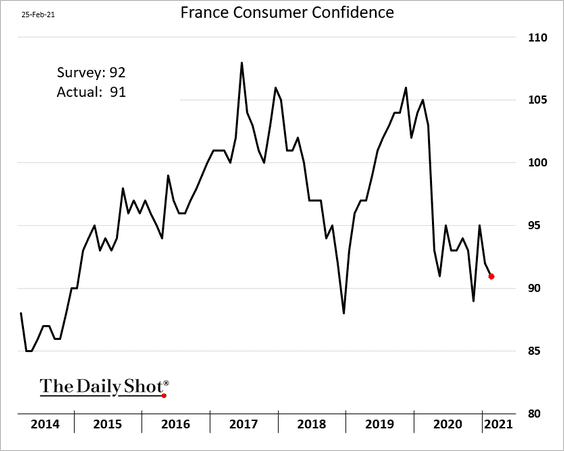
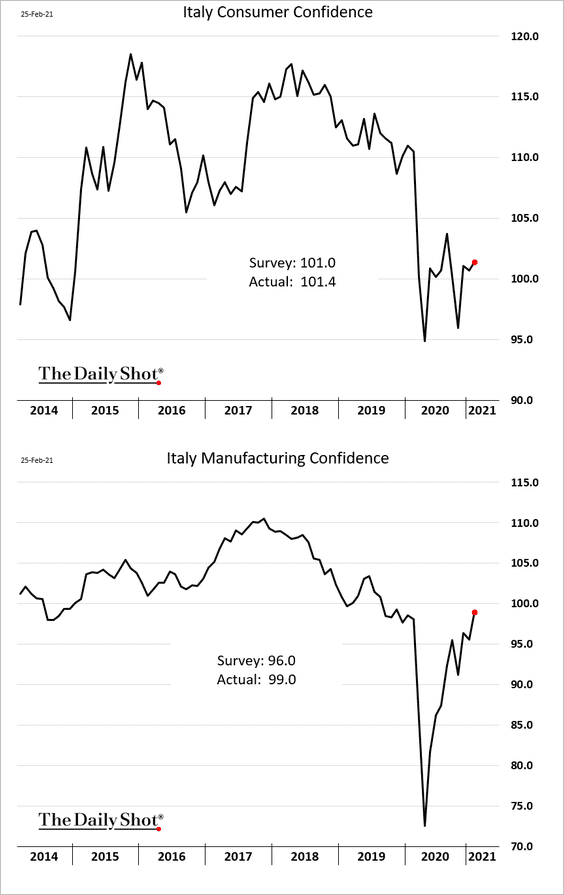
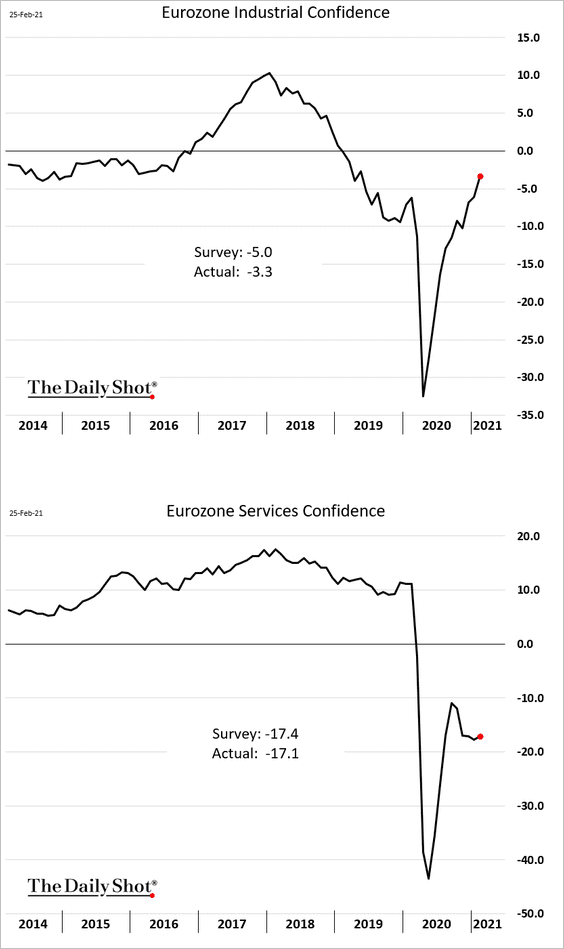
3. Next, let’s take a look at sentiment indicators across the Eurozone.
• French consumer confidence:
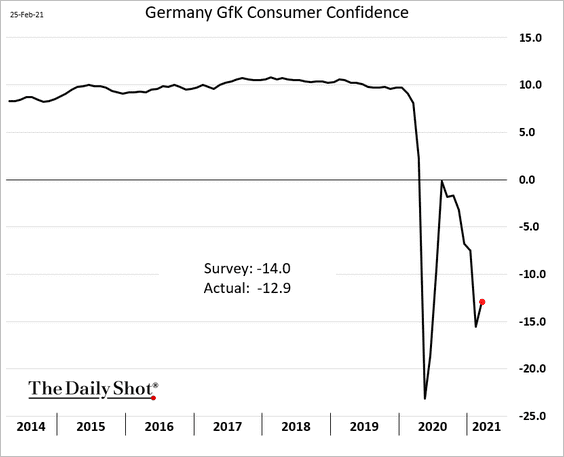
• German consumer confidence:
• Italian consumer and manufacturing confidence:
• Industrial and service-sector confidence in the Eurozone:
Back to Index
The United Kingdom
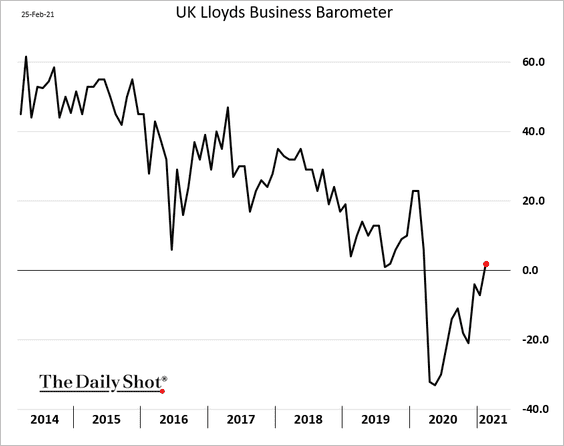
1. Business sentiment continues to recover.
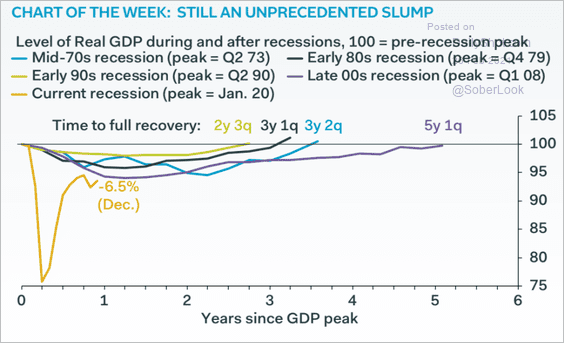
2. Here is the current GDP recovery vs. previous recessions.
 Source: Pantheon Macroeconomics
3. Many young people have left London.
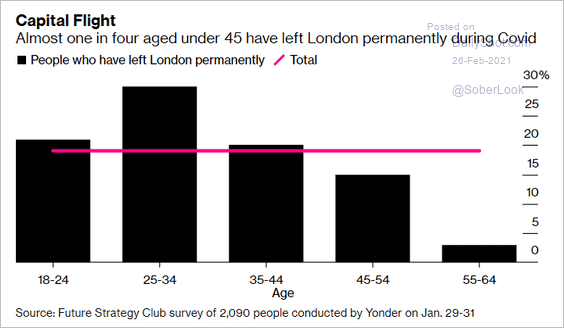 Source: Bloomberg Read full article
Back to Index
The United States
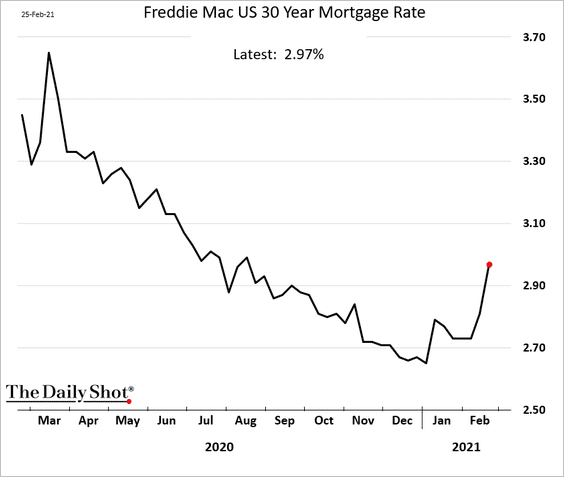
1. The 30-year mortgage rate is climbing with Treasury yields.
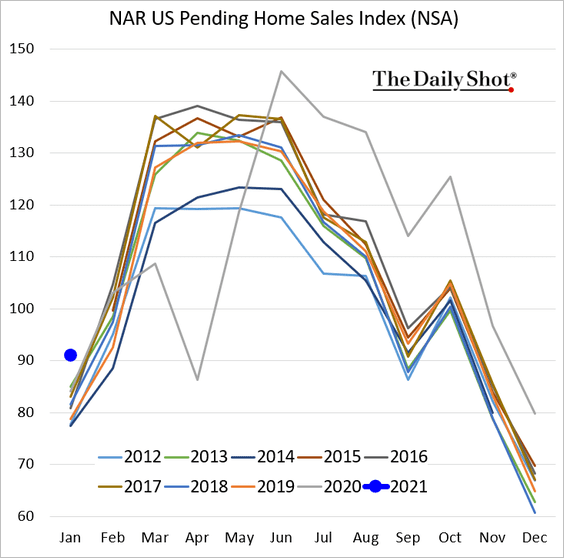
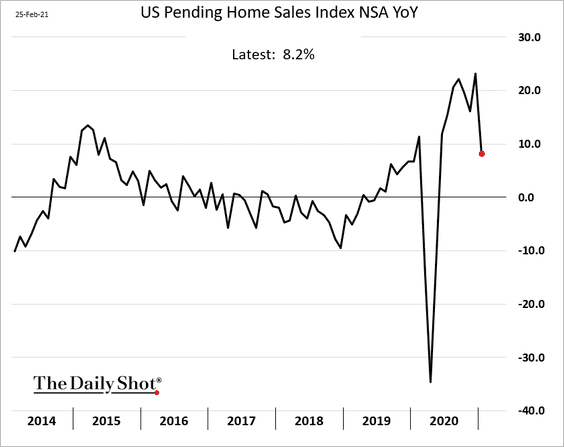
2. January pending home sales were robust but below market expectations.
Here is the year-over-year chart.
——————–
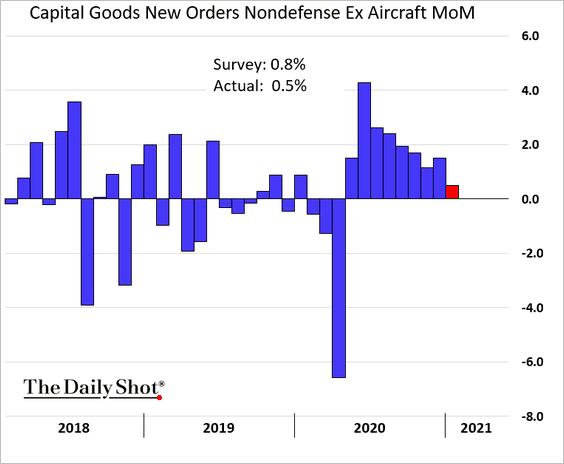
3. Durable goods orders surprised to the upside.
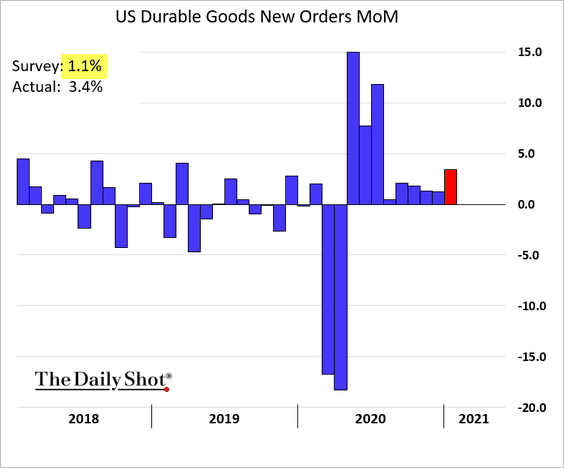
Growth in capital goods orders is slowing.
——————–
4. Jobless claims declined last week. The combination of strong durable goods orders and this improvement in unemployment applications put downward pressure on Treasuries on Thursday.
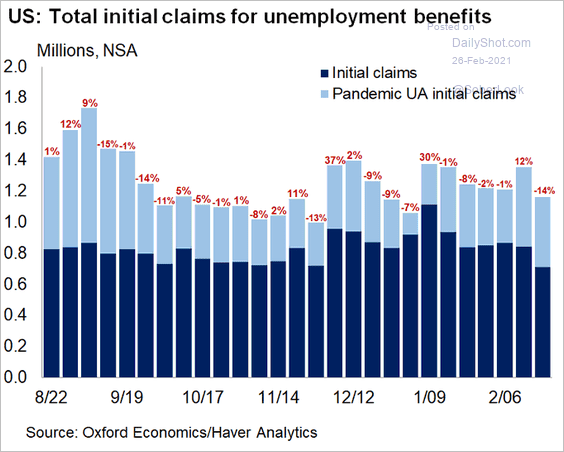 Source: @GregDaco
Continuing claims remain elevated.
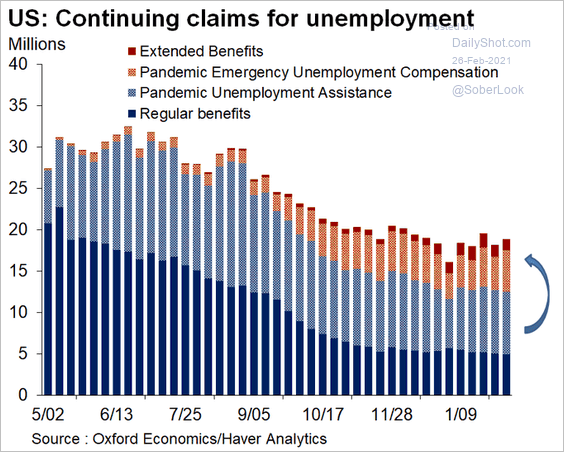 Source: @GregDaco
——————–
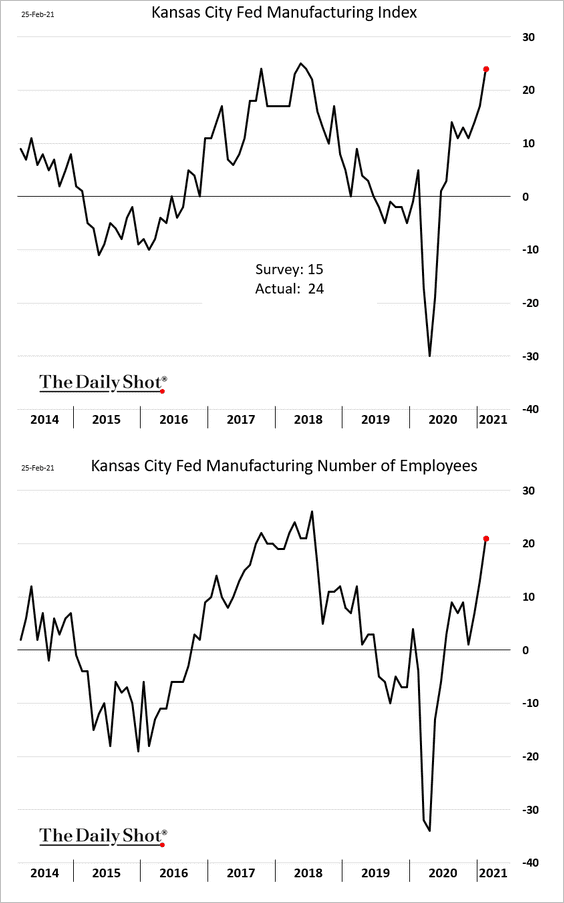
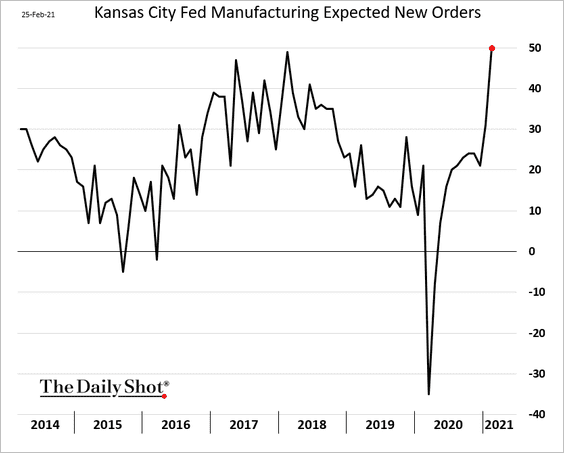
5. The Kansas City Fed’s regional manufacturing report was exceptionally strong.
• The index of expected orders hit a multi-year high.
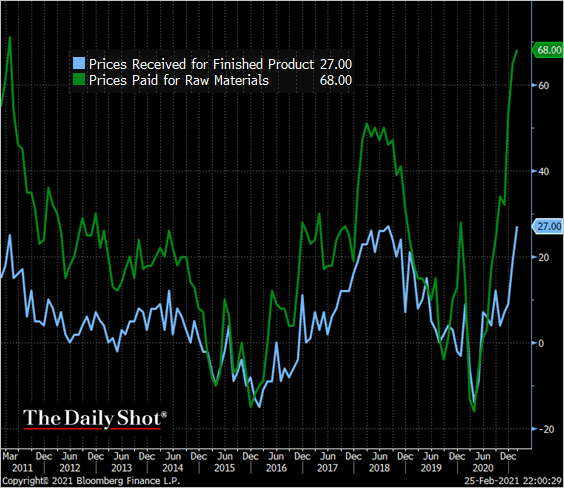
• Growth in input costs has accelerated.
 Source: @TheTerminal, Bloomberg Finance L.P.
——————–
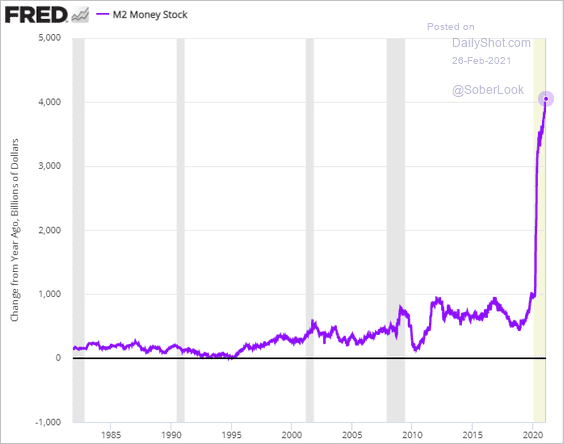
6. The US broad money supply is now up $4 trillion vs. the same time a year ago.
Back to Index
Food for Thought
1. Global declines in living standards:
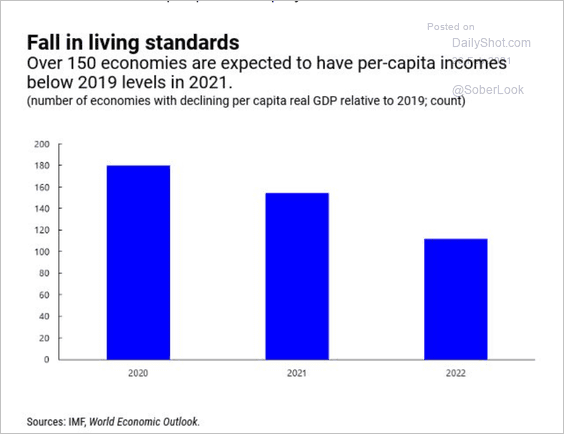 Source: IMF Read full article
2. Late deliveries by the USPS going into the holidays:
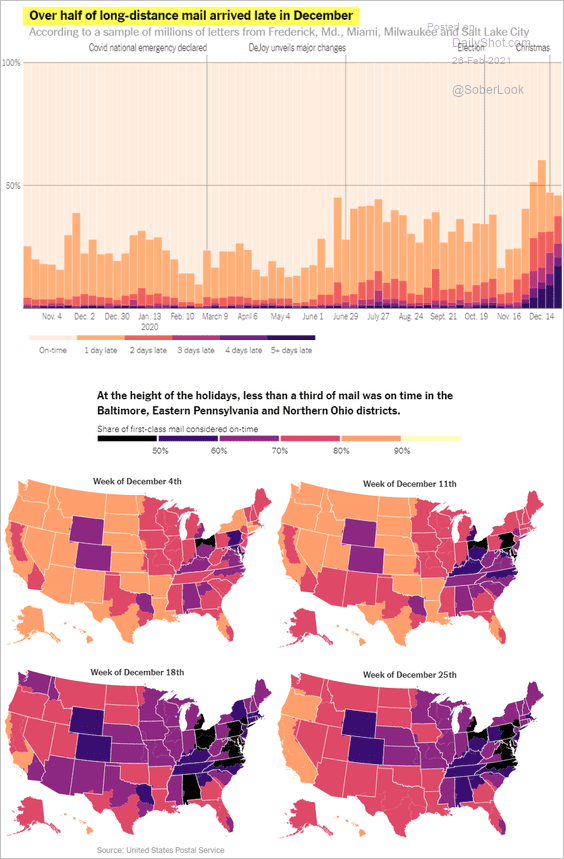 Source: The New York Times Read full article
3. UK parents working from home vs. away from home:
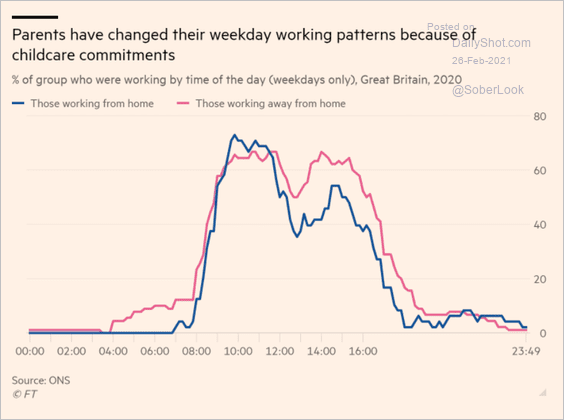 Source: @financialtimes Read full article
4. Cultural regions in the US:
 Source: @simongerman600
5. Population change by type of community:
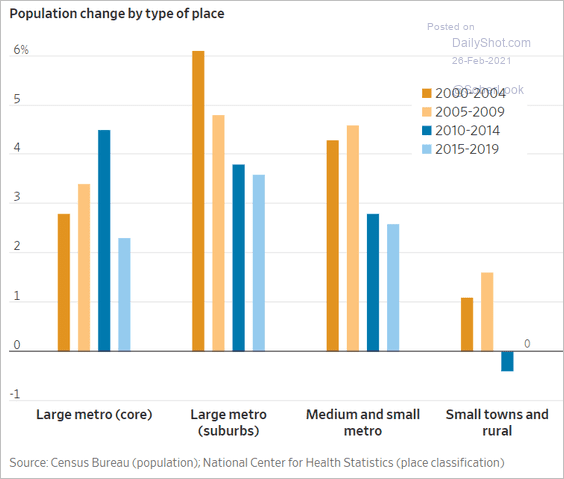 Source: @WSJ Read full article
6. Homework helpers:
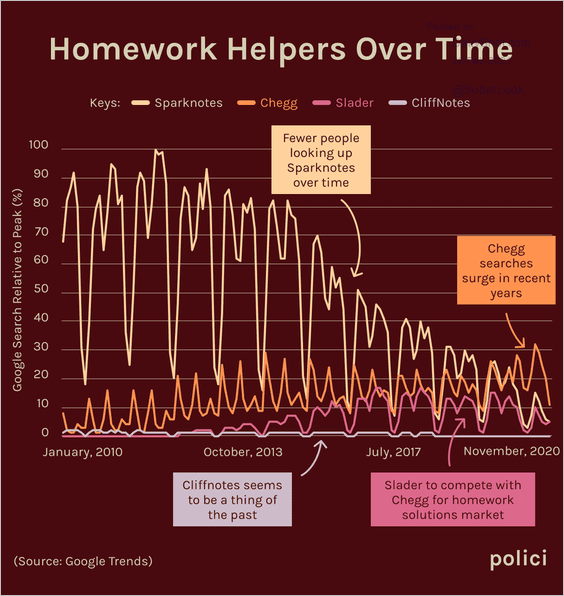 Source: r/dataisbeautiful
7. Finland’s school system:
 Source: Business Insider Read full article
8. US learning from other countries:
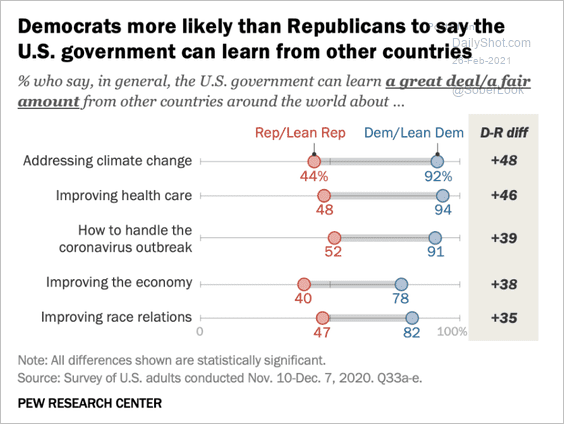 Source: Pew Research Center Read full article
9. Gov. Cuomo’s approval ratings:
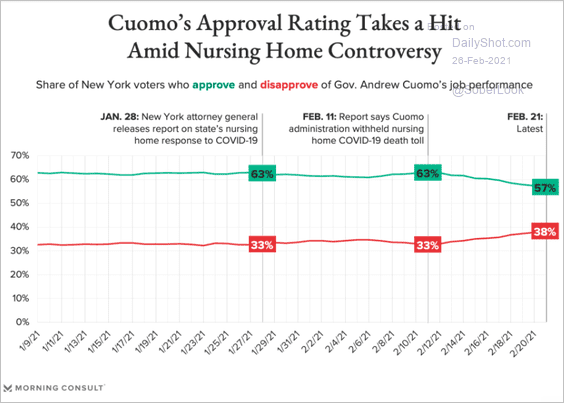 Source: Morning Consult Read full article
10. Vaccines are working (2 charts):
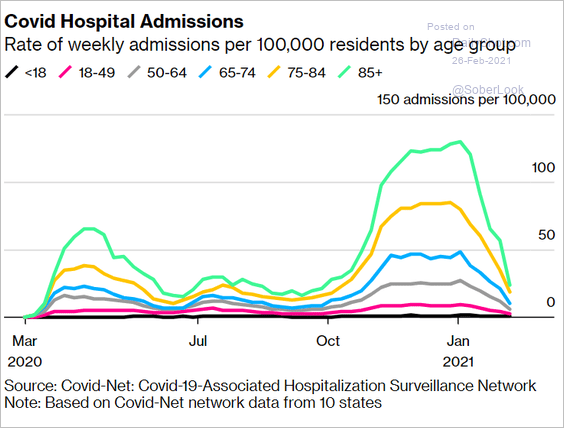 Source: @business Read full article
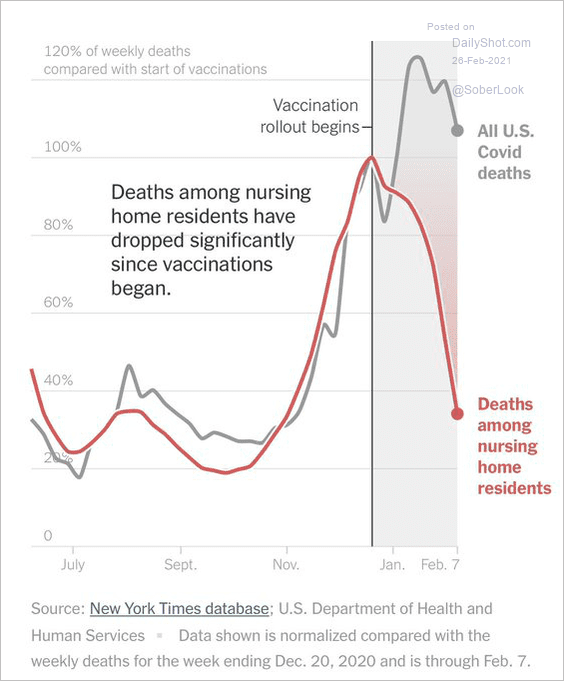 Source: @sangerkatz, @mathisonian, @smervosh, @danielle_ivory, h/t @GregDaco Read full article
——————–
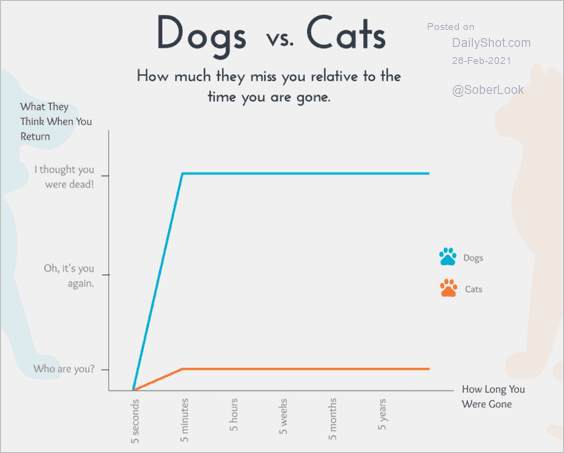
11. Dogs vs. cats:
 Source: visme
——————–
Have a great weekend!
Back to Index