
The Daily Shot: 02-Mar-21
• The United States
• Canada
• The United Kingdom
• The Eurozone
• Europe
• Japan
• Asia – Pacific
• Emerging Markets
• Commodities
• Energy
• Equities
• Rates
• Global Developments
• Food for Thought
The United States
1. The ISM Manufacturing PMI report topped market forecasts, showing US factory activity accelerating in February.
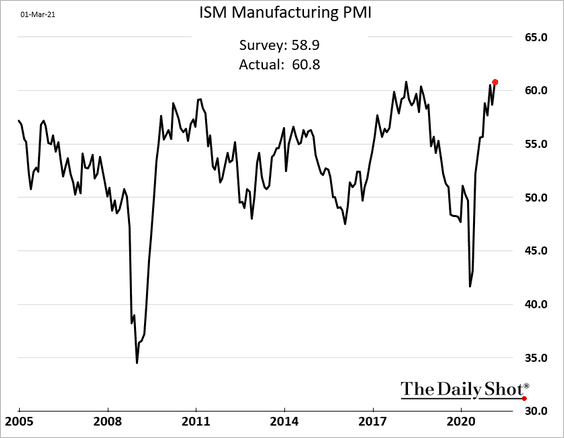
The report points to further gains in the nation’s industrial production.
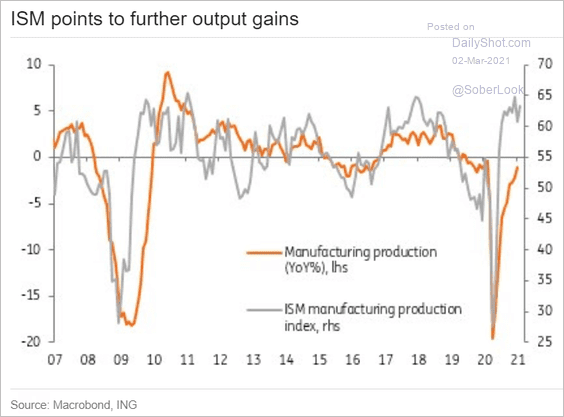 Source: ING
However, slower factory activity in China suggests that US manufacturing will moderate in the months ahead.
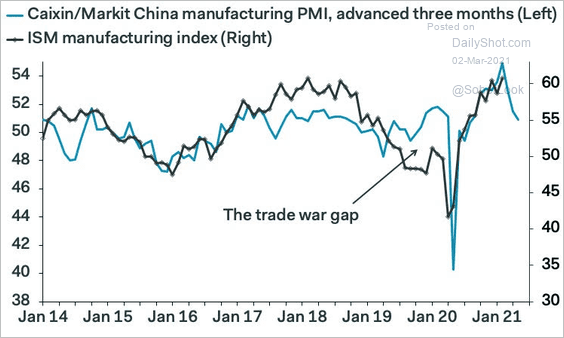 Source: Pantheon Macroeconomics
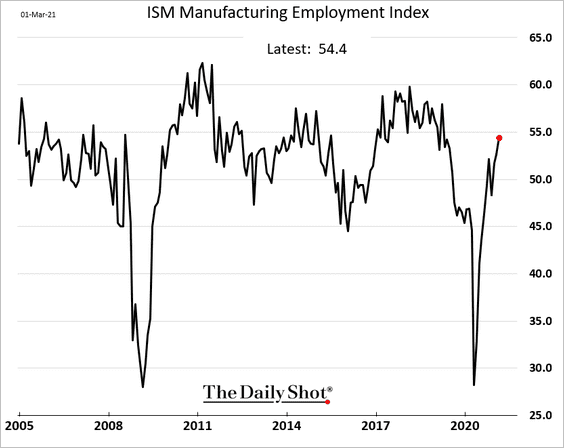
• Hiring improved, but many factories have trouble finding qualified workers.
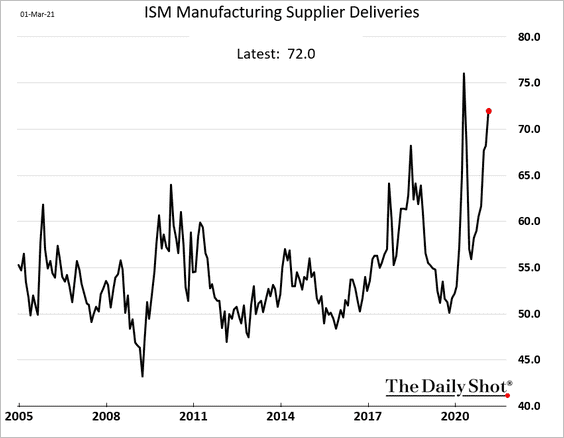
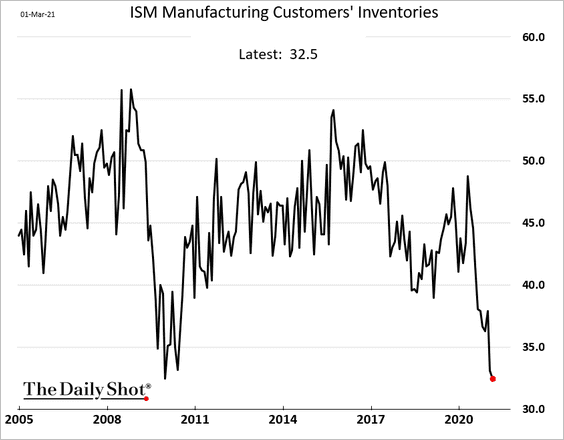
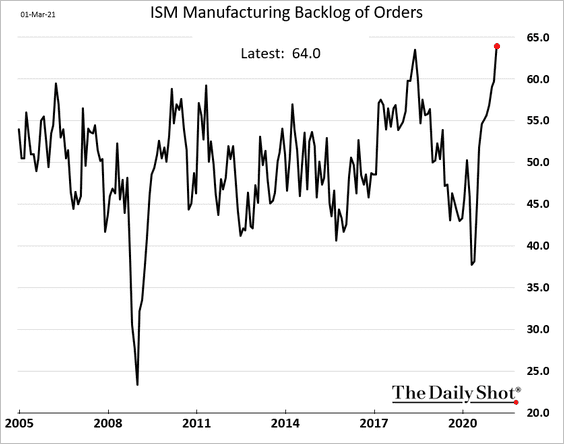
• Manufacturers report increased lead times, rising backlogs, supply chain bottlenecks, and tight customer inventories.
– Supplier deliveries (higher number indicates longer delivery times):
– Customer inventories:
– Order backlogs:
• Here are the contributions to the headline index.
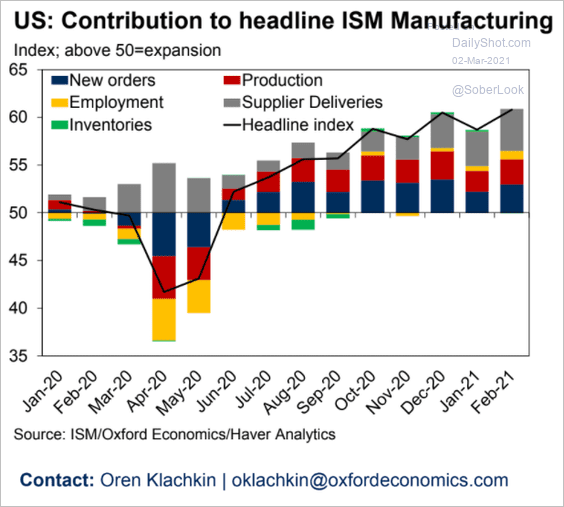 Source: Oxford Economics
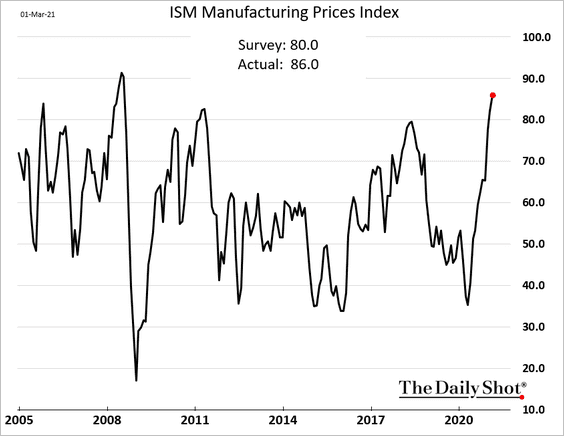
• As we’ve seen in other reports, manufacturers increasingly face cost pressures. This trend is driven by higher commodity prices as well as supply bottlenecks.
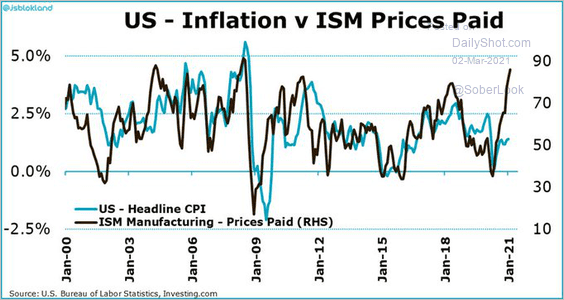
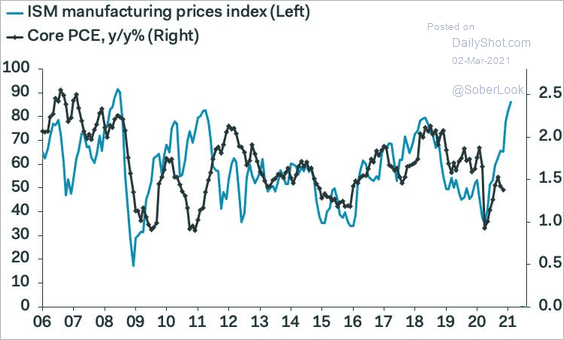
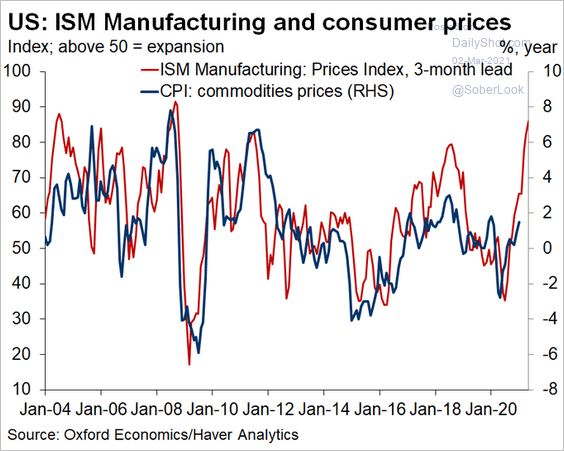
• US consumer inflation tends to be correlated with the ISM “prices paid” index.
– Headline CPI:
 Source: @jsblokland
– Core PCE:
 Source: Pantheon Macroeconomics
– Commodities CPI:
 Source: @GregDaco
——————–
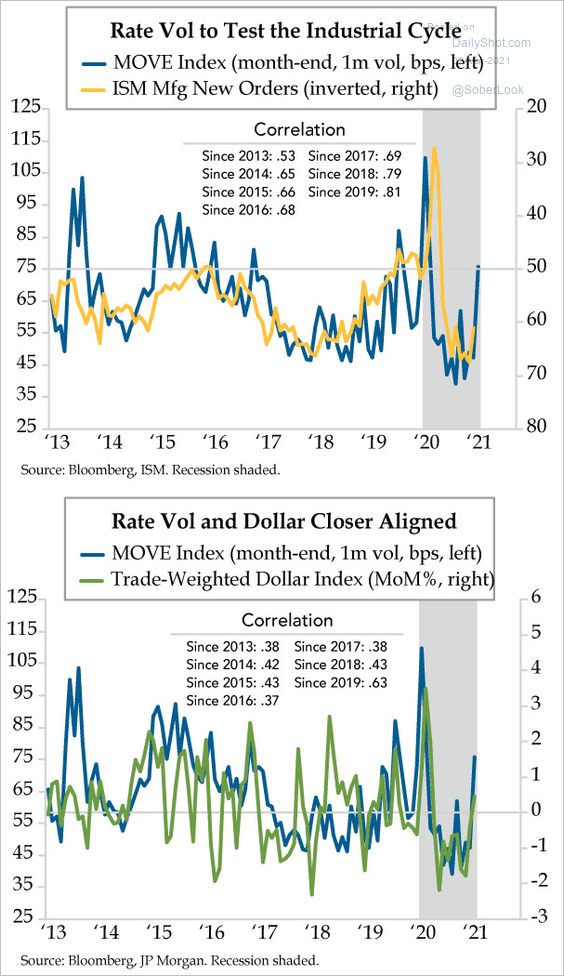
2. The recent increase in bond volatility (MOVE) points to a stronger US dollar and slower factory orders ahead.
 Source: The Daily Feather
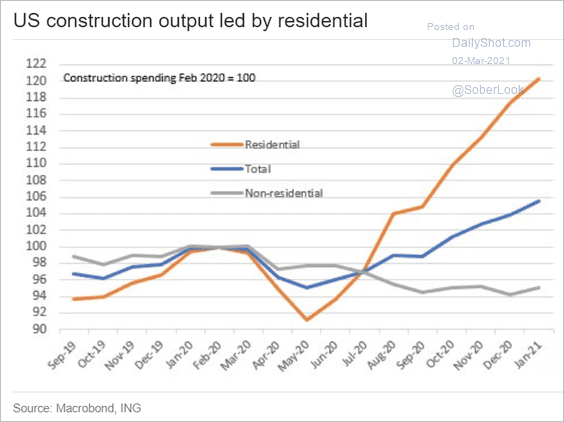
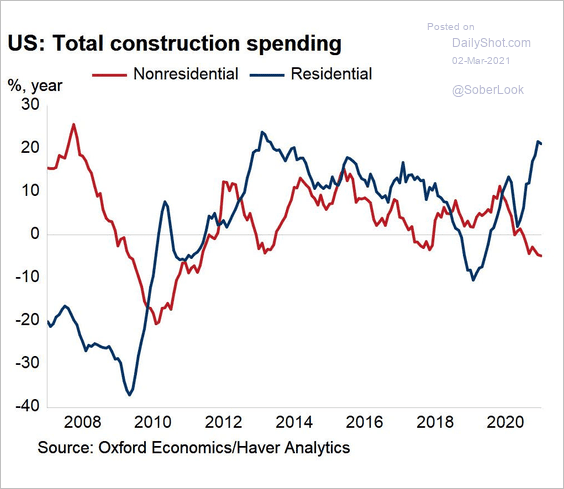
3. The residential – nonresidential construction spending divergence continues (2 charts).
 Source: ING
 Source: Oxford Economics
——————–
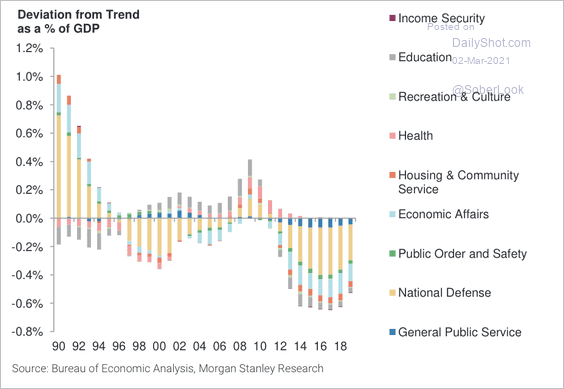
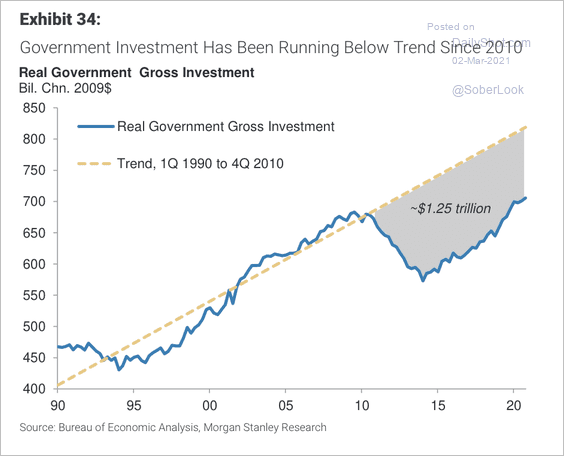
4. There has been significant underspending in infrastructure over the past few years (2 charts).
 Source: Morgan Stanley Research
 Source: Morgan Stanley Research
Here are Morgan Stanley’s estimates of transportation spending growth.
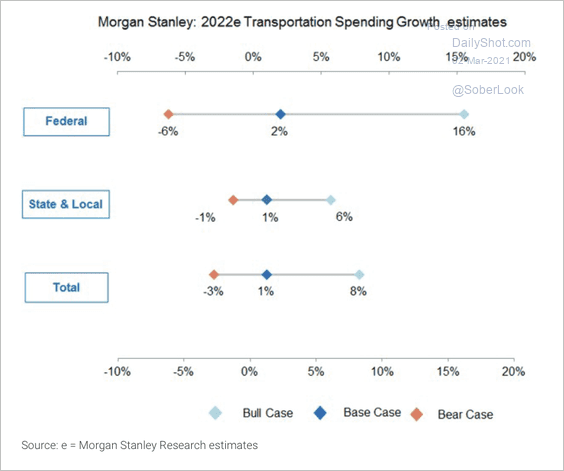 Source: Morgan Stanley Research
——————–
5. Restaurant activity shows signs of improvement, which should boost payrolls.
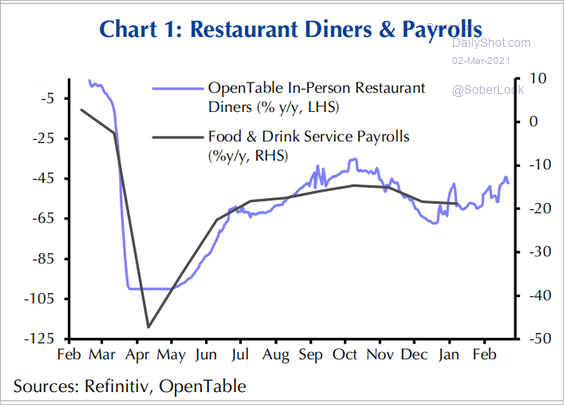 Source: Capital Economics
6. Hotel occupancy remains depressed for this time of the year.
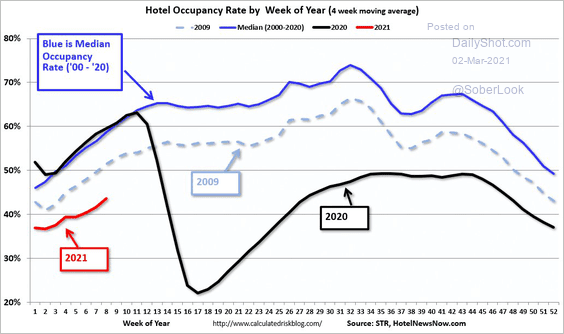 Source: @calculatedrisk Read full article
Back to Index
Canada
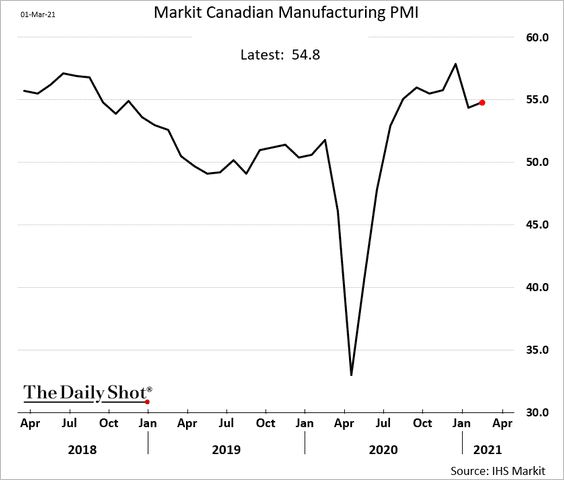
1. Manufacturing expansion held steady last month.
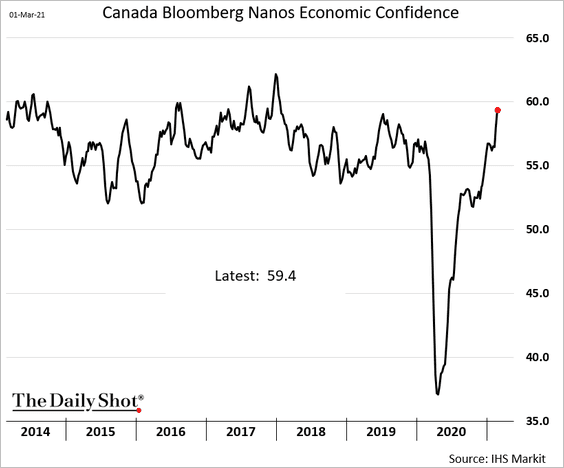
2. Economic confidence continues to climb.
3. Transportation and warehouse sectors represent a growing share of total capital expenditures.
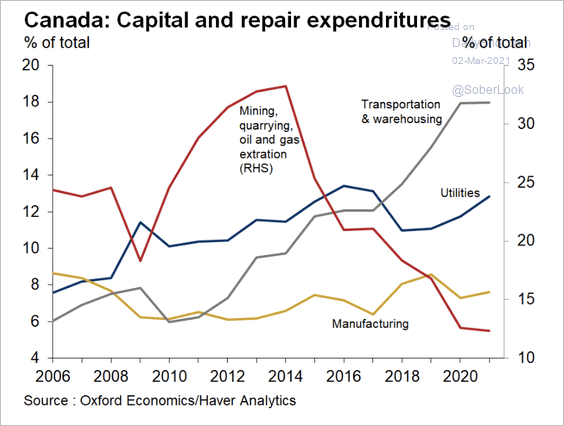 Source: Oxford Economics
Public and private capital spending is expected to increase this year.
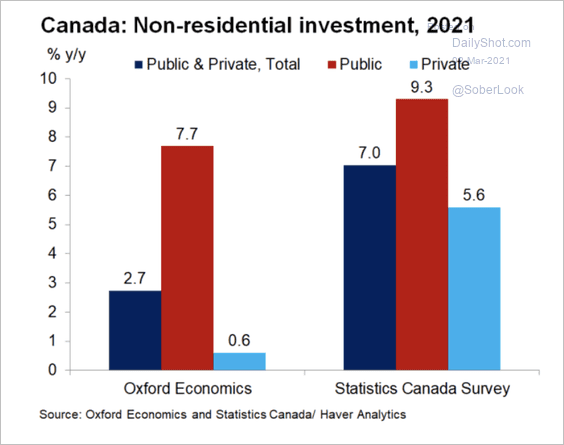 Source: Oxford Economics
——————–
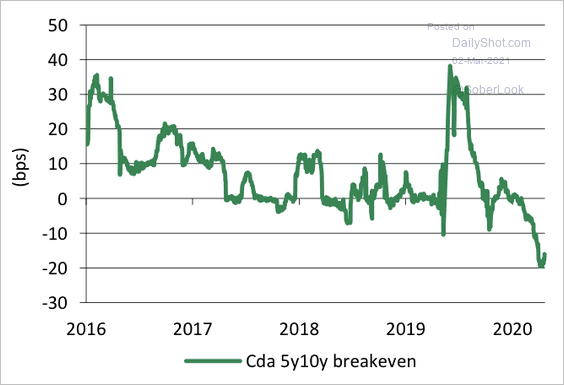
3. The 5-year 10-year breakeven curve is deeply inverted.
 Source: Desjardins
 Source: Desjardins
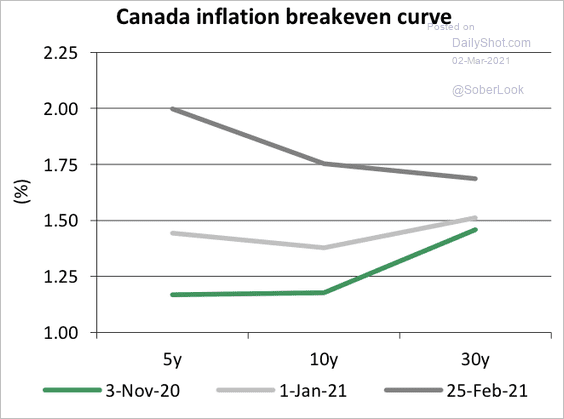
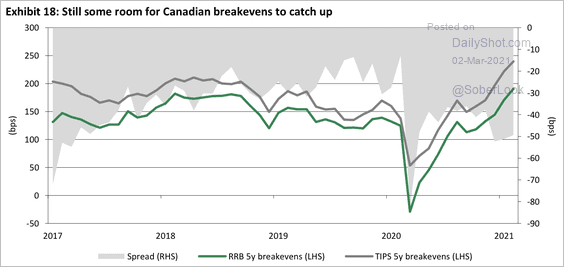
Canadian inflation expectations have room to catch up to the US.
 Source: Desjardins
Back to Index
The United Kingdom
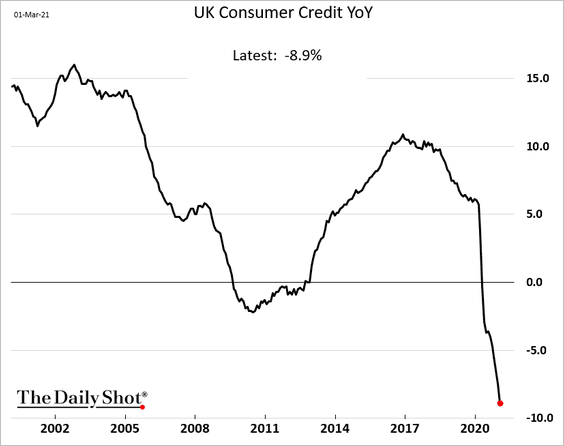
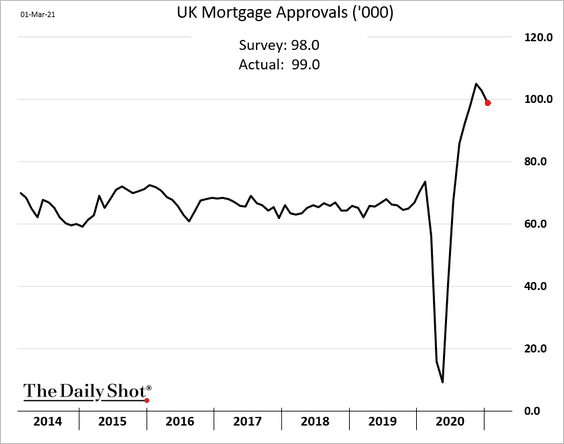
1. Consumer credit continues to shrink as households hold back on borrowing.
Mortgage approvals remain elevated (although off the highs).
——————–
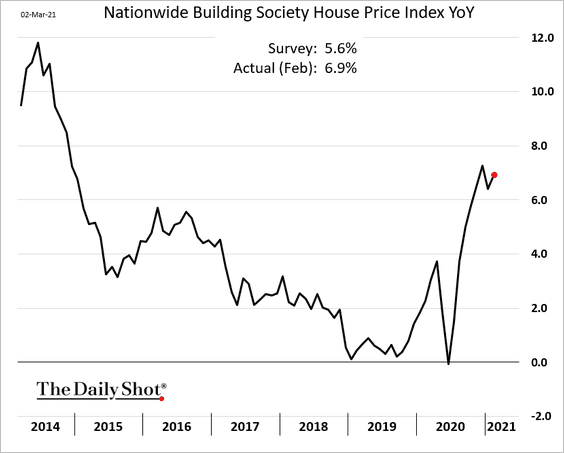
2. Home price appreciation picked up last month.
But new homebuyer activity appears to be tapering.
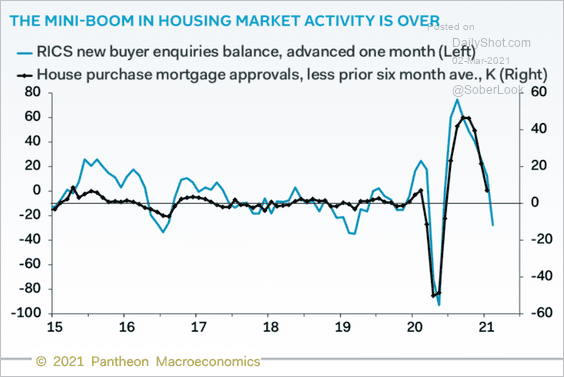 Source: Pantheon Macroeconomics
——————–
3. Growth in UK factory orders is lagging the Eurozone.
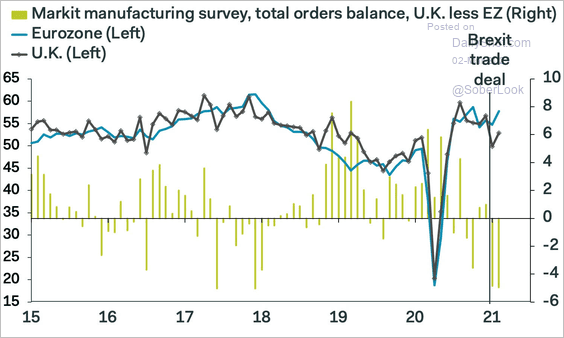 Source: @samueltombs, Pantheon Macroeconomics
4. UK equities are trading at the largest forward price-to-earnings valuation gap versus developed Europe in years.
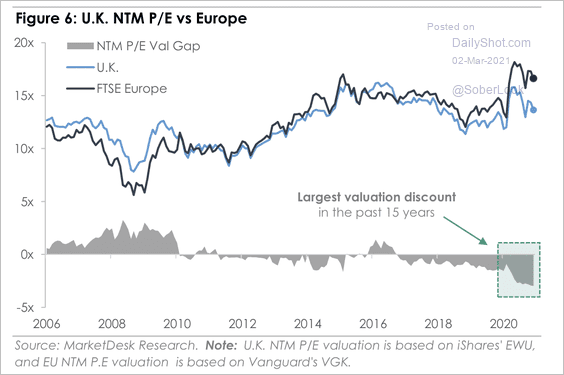 Source: MarketDesk Research
5. This chart shows the sector weightings of the iShares UK small-cap ETF (EWUS) versus the iShares UK large-cap ETF (EWU).
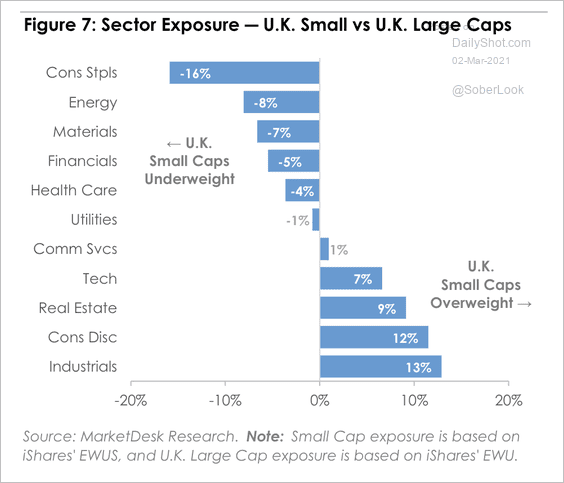 Source: MarketDesk Research
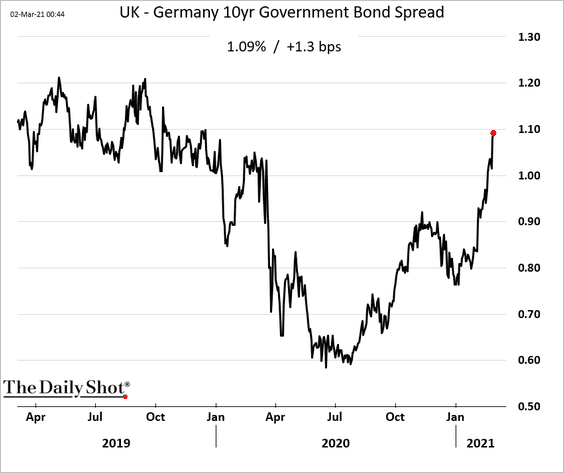
6. The spread between gilts and Bunds keeps widening.
Back to Index
The Eurozone
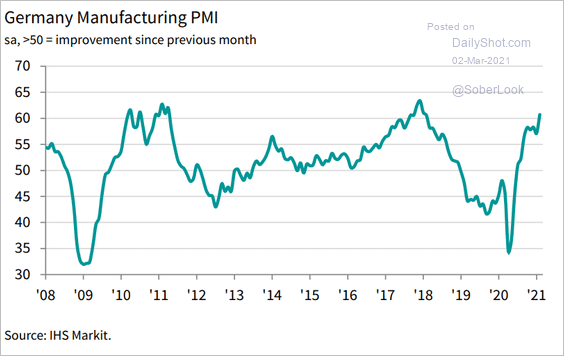
1. Manufacturing activity strengthened across Europe last month. Here are some PMI trends.
• Germany:
 Source: IHS Markit
• France:
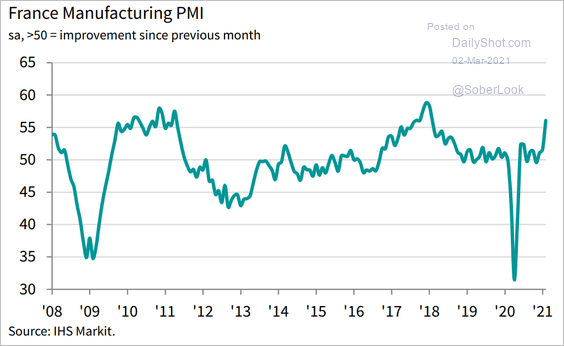 Source: IHS Markit
• Italy:
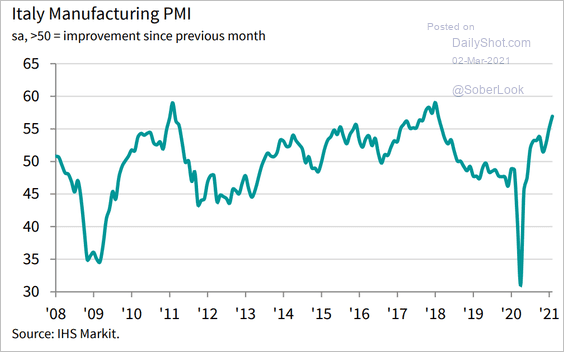 Source: IHS Markit
• The Eurozone:
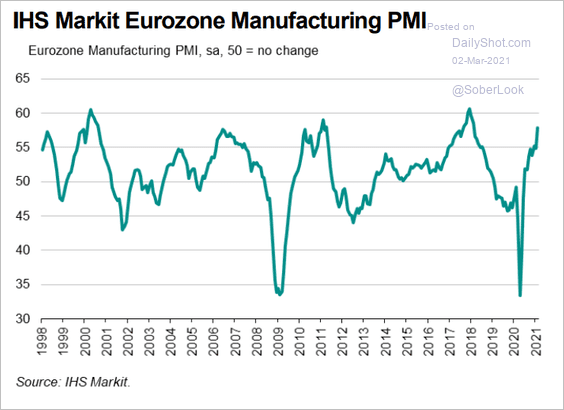 Source: IHS Markit
Will we continue to see sustained improvements in factory output?
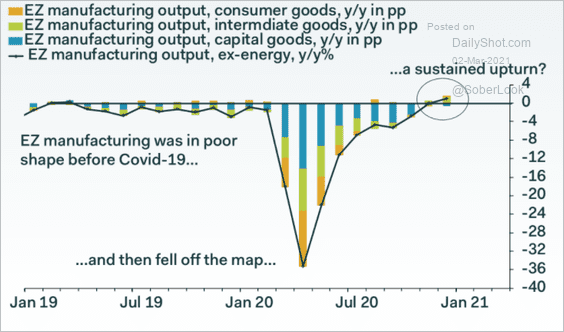 Source: Pantheon Macroeconomics
——————–
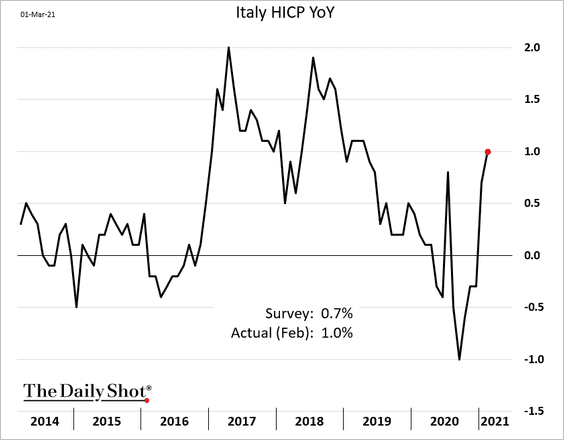
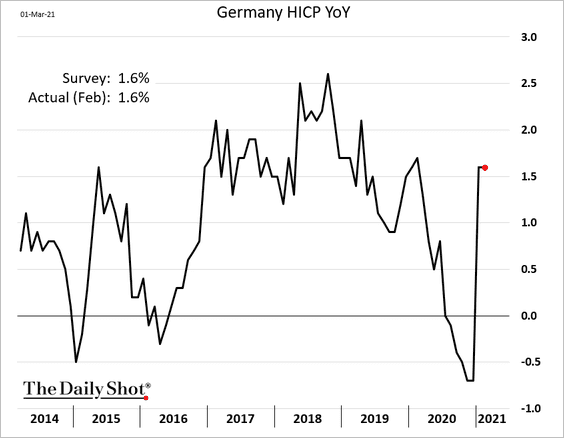
2. Inflation picked up this year.
• Italy:
• Germany:
• Germany core CPI:
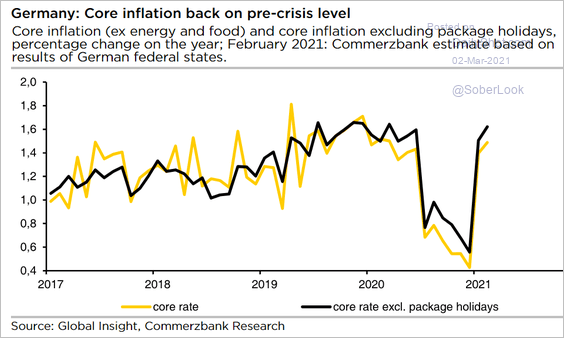 Source: Commerzbank Research
——————–
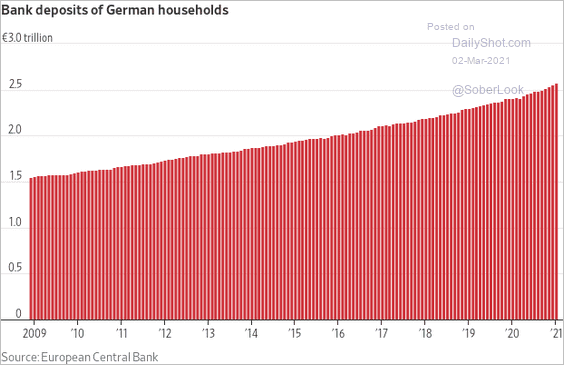
3. As deposits swell, German lenders are starting to charge customers for holding money at the bank.
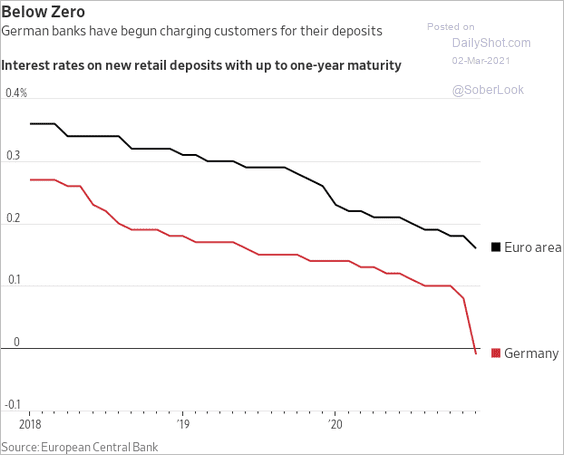 Source: @WSJ Read full article
 Source: @WSJ Read full article
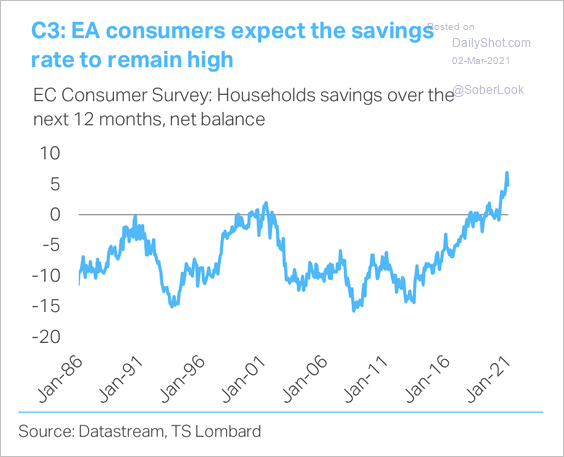
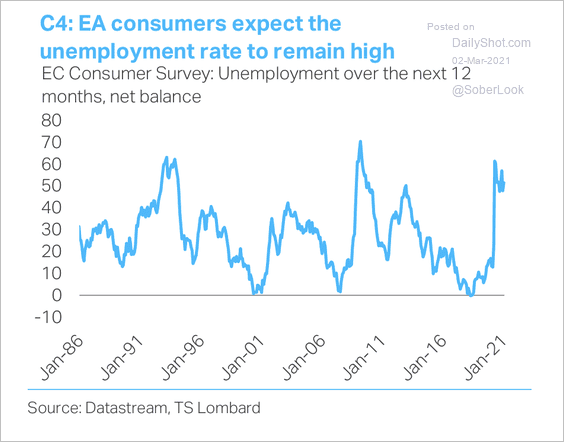
And consumers across the euro area expect to save more as the employment outlook remains uncertain (two charts).
 Source: TS Lombard
 Source: TS Lombard
——————–
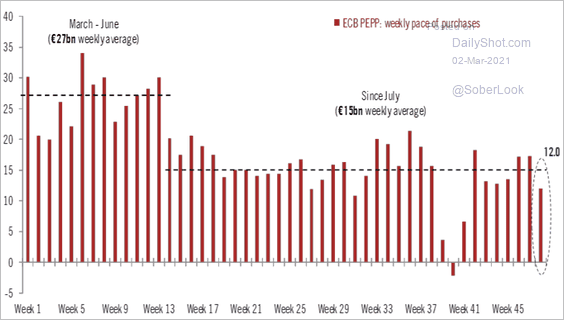
4. The ECB’s latest weekly securities purchases were weaker than expected. It’s surprising, given the pickup in yields.
 Source: @fwred
Back to Index
Europe
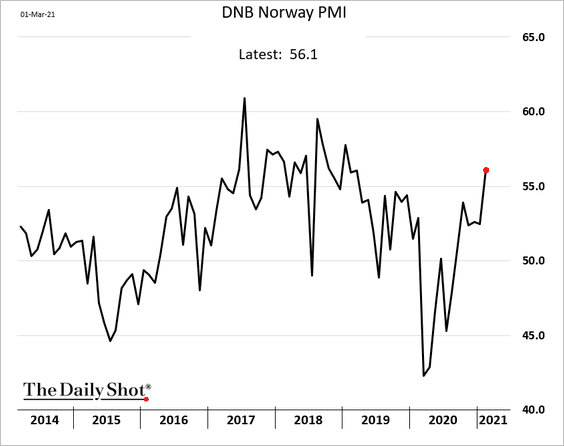
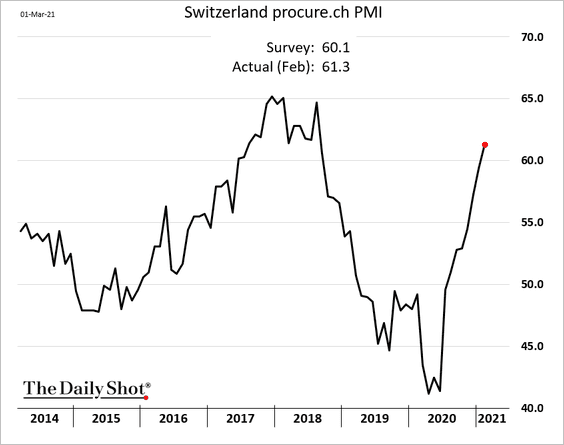
1. Just as we saw across the Eurozone, factories boosted production elsewhere in Europe.
• Norway:
• Switzerland:
• Poland:
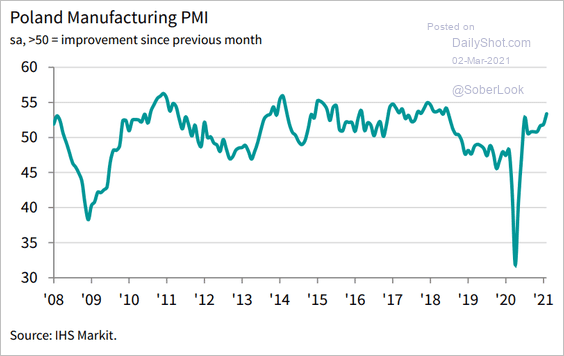 Source: IHS Markit
——————–
2. What is the effect of a 1% public investment increase on private investment?
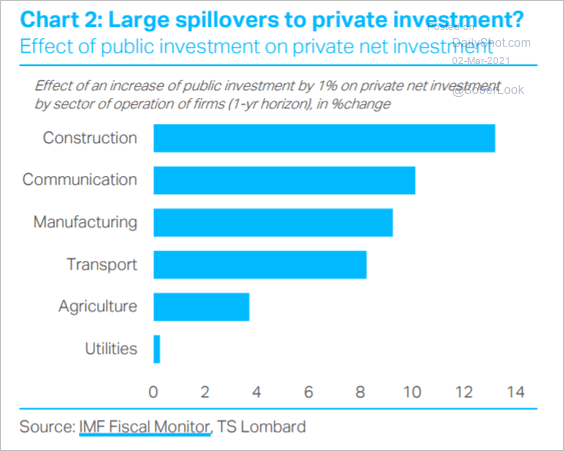 Source: TS Lombard
3. How patient are European buyers with online deliveries?
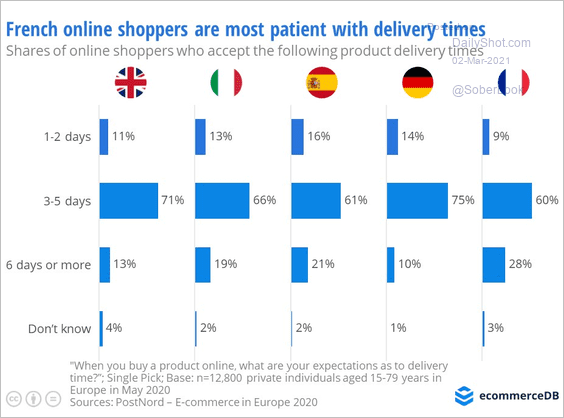 Source: ecommerceDB Read full article
Back to Index
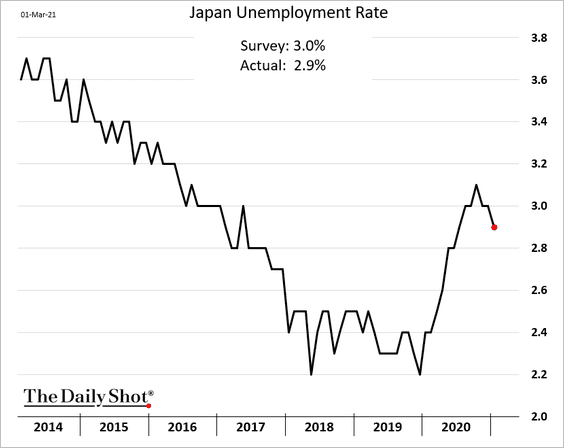
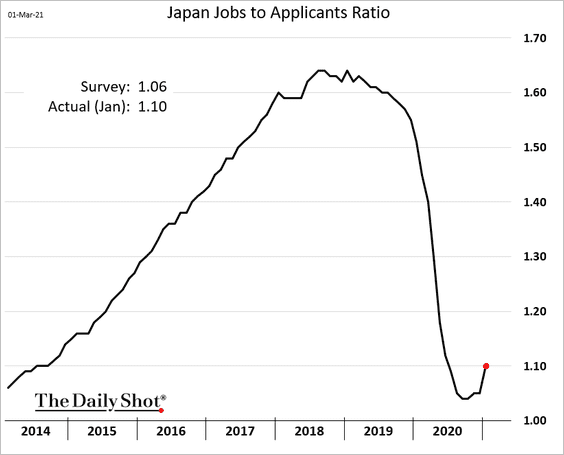
Japan
1. The labor market is recovering.
• The unemployment rate:
• Jobs-to-applicants ratio:
——————–
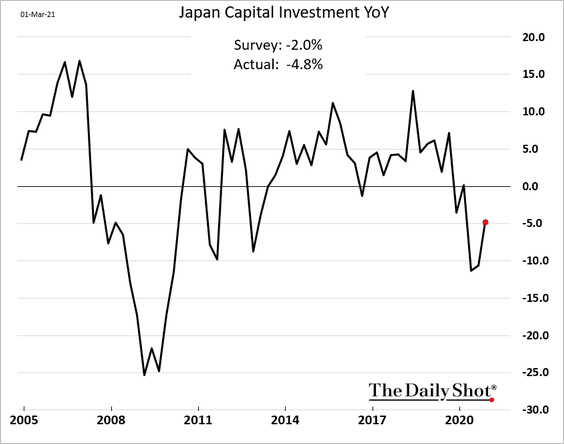
2. Japan’s recovery in capital investment will take some time.
3. Japan’s central bank (BoJ) is a publicly listed entity, trading on the Jasdaq (Belgium, Greece, and Switzerland also have publicly listed central banks). BoJ shares soared on Monday.
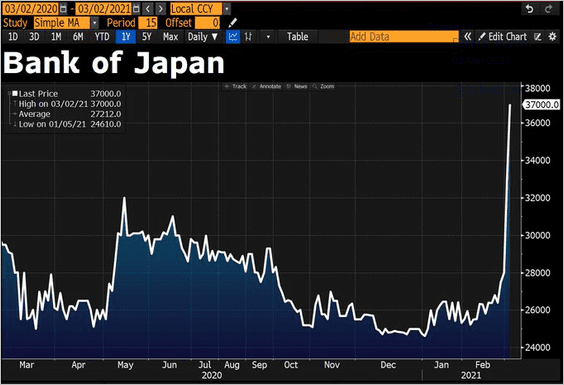 Source: @DavidInglesTV
Back to Index
Asia – Pacific
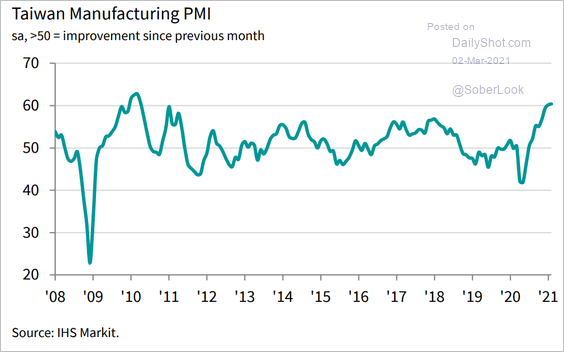
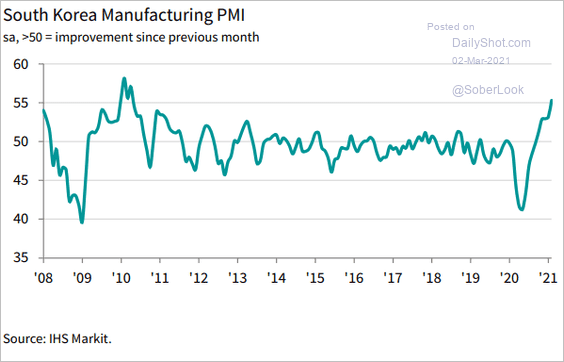
1. Manufacturing PMIs point to faster expansion last month.
• Taiwan:
 Source: IHS Markit
• South Korea:
 Source: IHS Markit
——————–
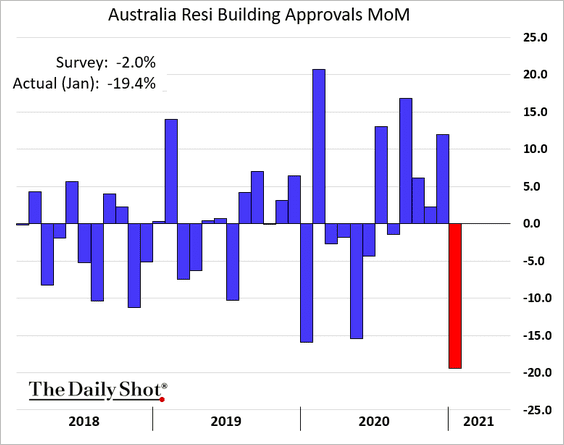
2. Australia’s building approvals declined sharply in January.
3. This chart shows New Zealand’s terms of trade index.
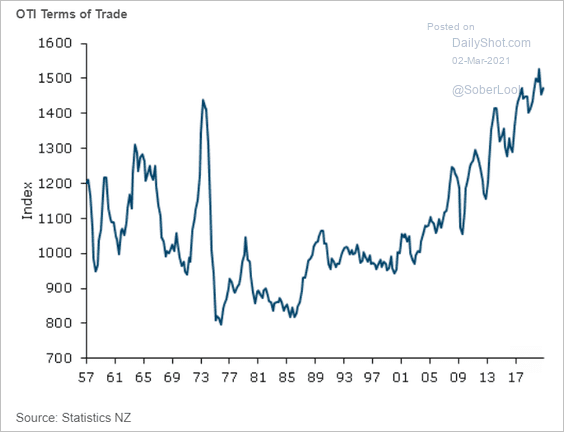 Source: ANZ Research
Back to Index
Emerging Markets
1. ASEAN manufacturing activity stalled last month.
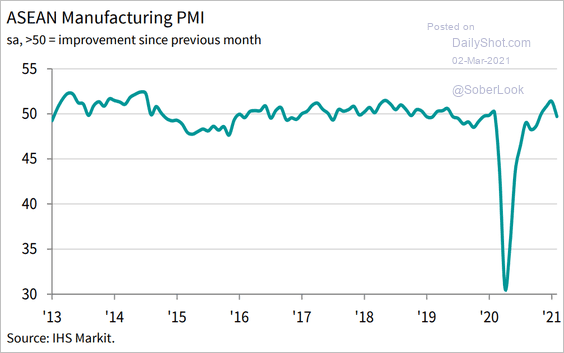 Source: IHS Markit
• Malaysia:
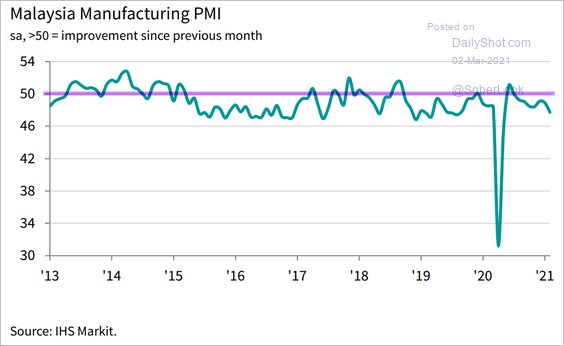 Source: IHS Markit
• Thailand:
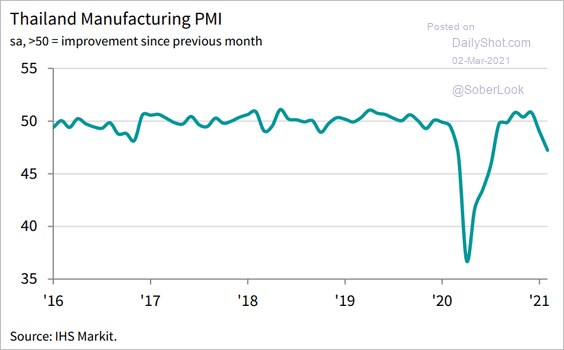 Source: IHS Markit
——————–
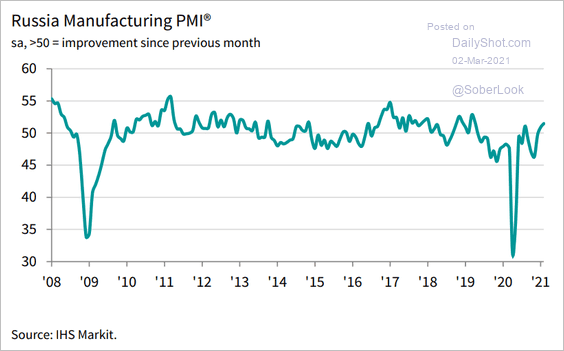
2. Here are a few other manufacturing PMI trends.
• Russia (back in growth mode):
 Source: IHS Markit
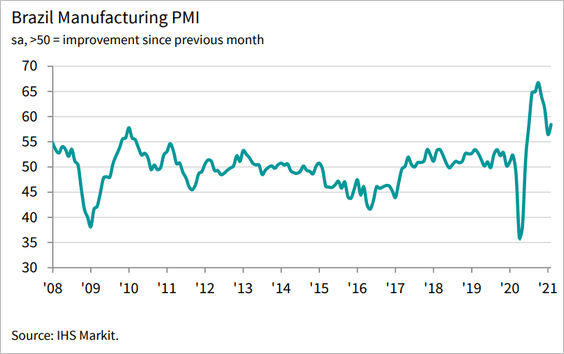
• Brazil (still quite strong):
• Colombia (stalling):
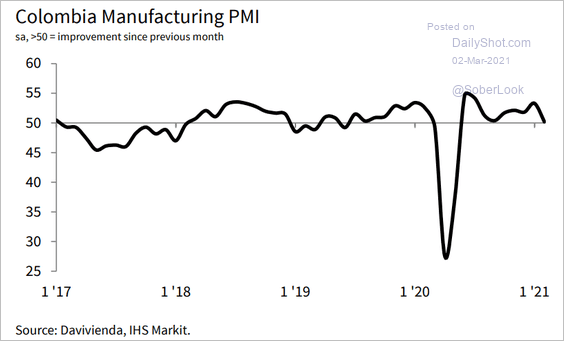 Source: IHS Markit
• Mexico (still struggling):
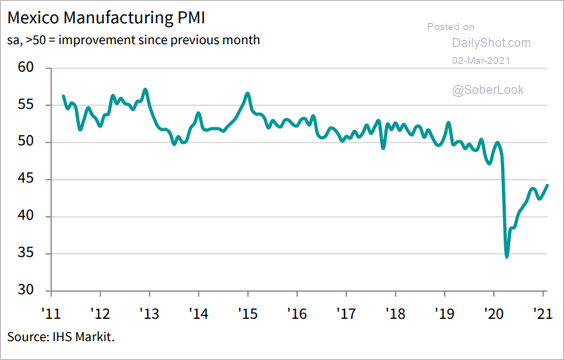 Source: IHS Markit
——————–
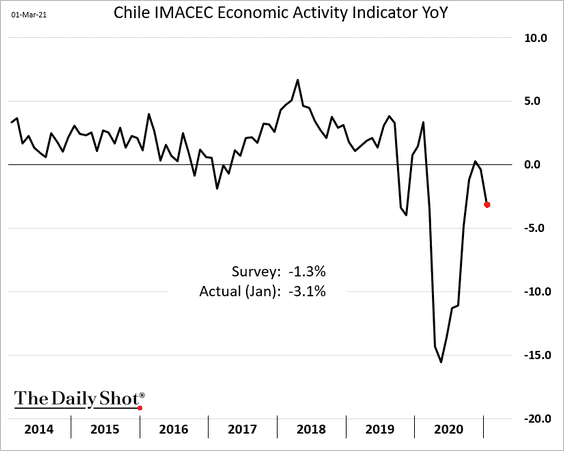
3. As we saw previously, Chile’s economy lost some momentum in January.
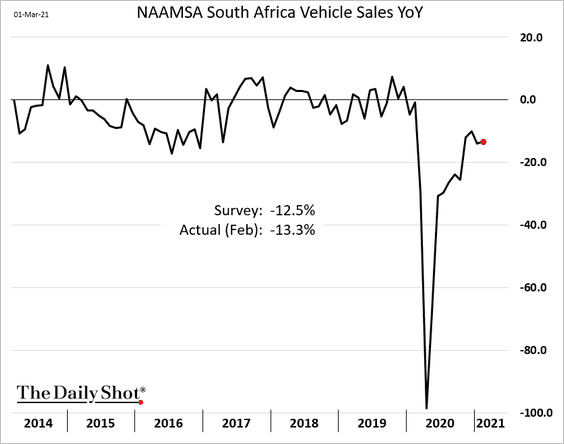
4. South Africa’s vehicle sales are yet to recover.
Back to Index
Commodities
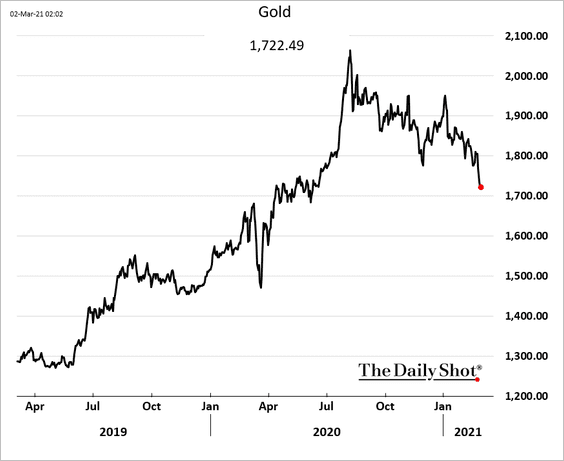
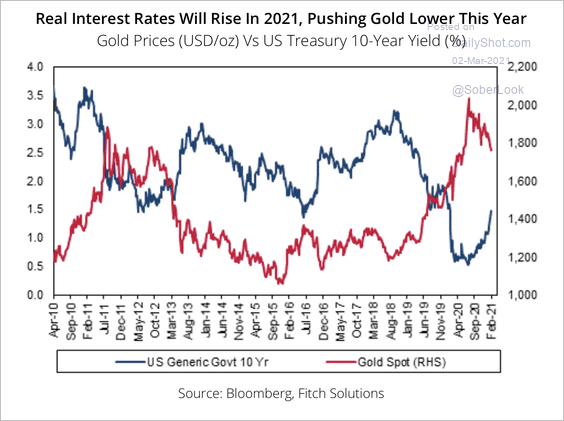
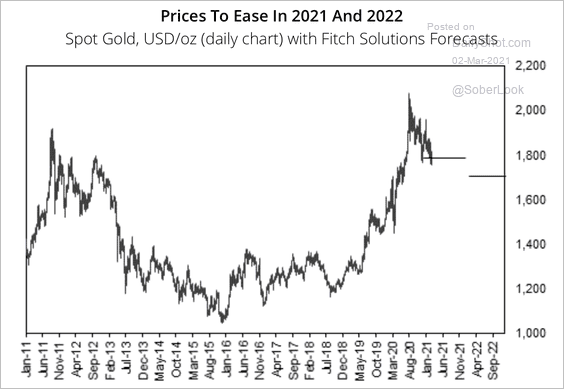
1. Gold has been drifting lower as US real rates bounce while the dollar’s decline appears to be over.
 Source: Fitch Solutions Macro Research
Fitch lowered its 2021 gold price forecast to $1,708 from $1,850 previously.
 Source: Fitch Solutions Macro Research
——————–
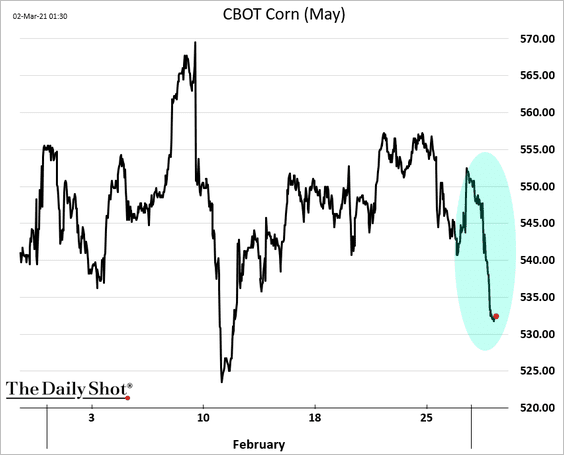
2. US corn futures fell, driven by fund selling.
 Source: @WSJ Read full article
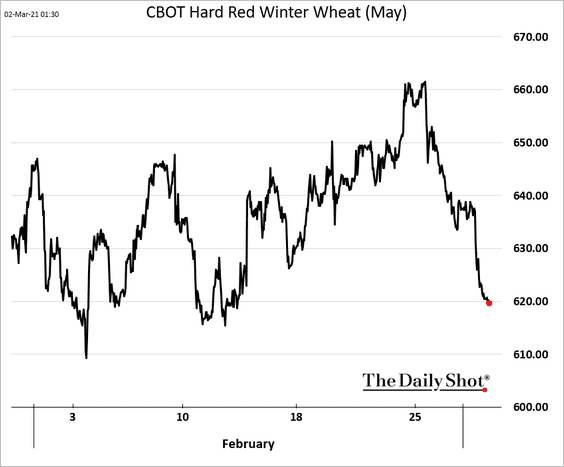
Wheat futures are softer as well amid increasing global supplies.
——————–
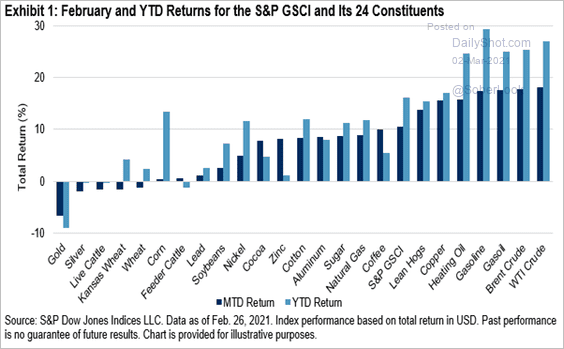
3. Here are the February and year-to-date returns across 24 commodities.
 Source: S&P Global Market Intelligence
Back to Index
Energy
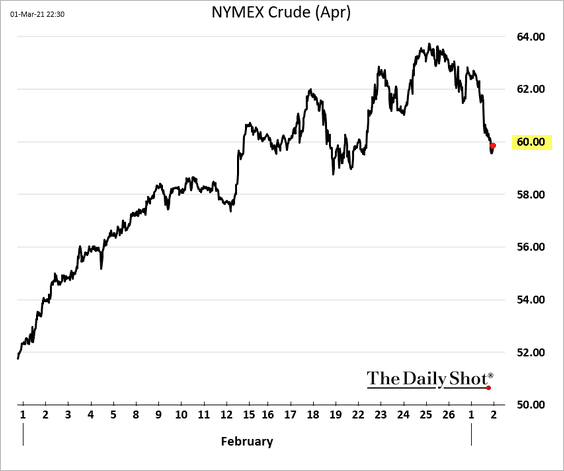
1. US crude oil futures are back below $60/bbl.
2. Without significant new drilling, US shale output will decline sharply.
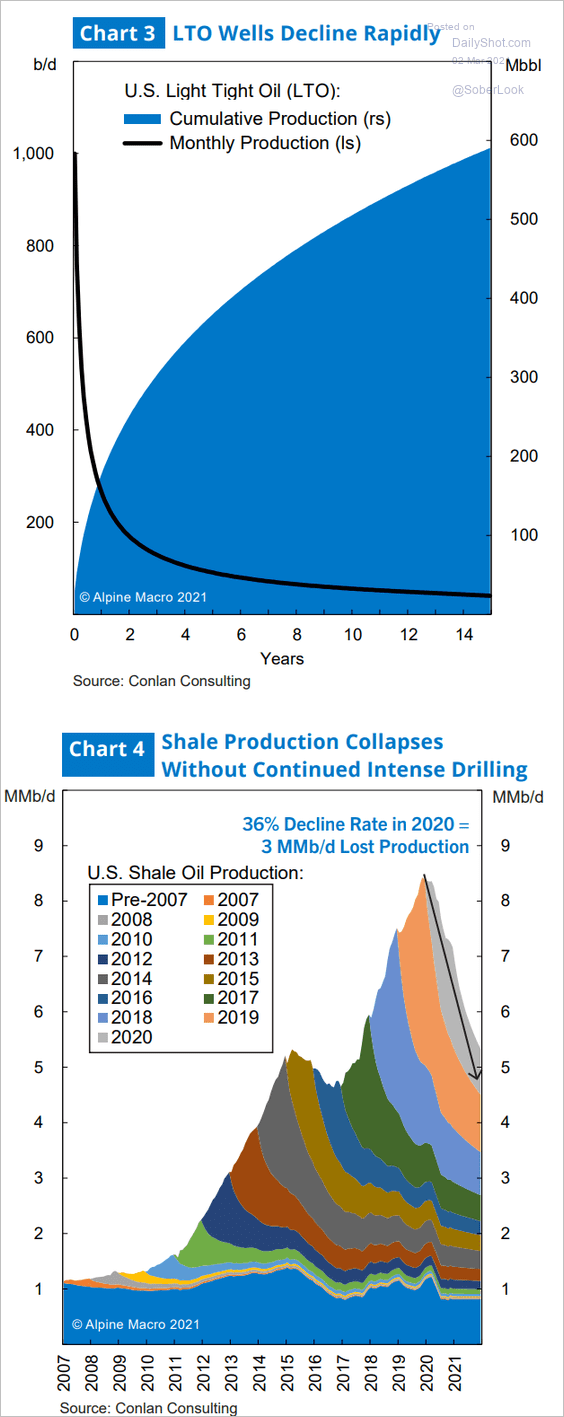 Source: Alpine Macro
Back to Index
Equities
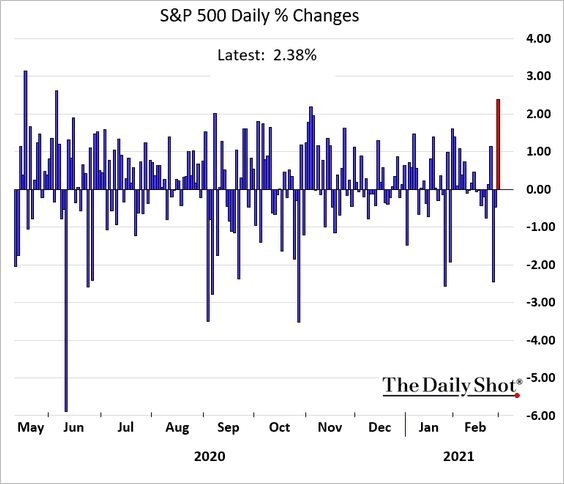
1. Stocks rose sharply as global bond yields stabilized.
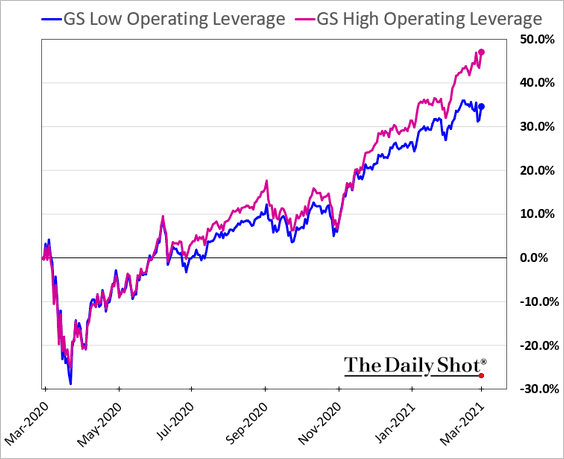
2. Driven by vaccine success and expected stimulus, the market is betting on acceleration in economic expansion. That’s why sectors like transportation and industrials are outperforming.
![]()
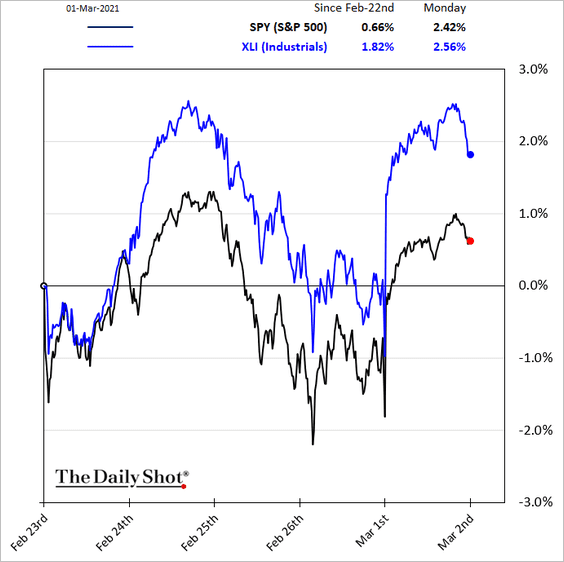
Faster economic growth will benefit companies with higher operating leverage.
——————–
3. How did stocks around the world perform in February?
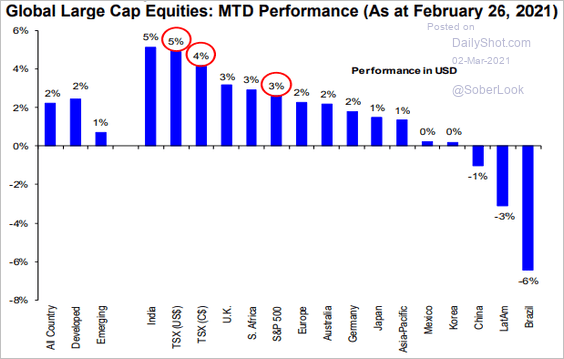 Source: Hugo Ste-Marie, Portfolio & Quantitative Strategy Global Equity Research, Scotia Capital
4. ETF inflows hit a record last month.
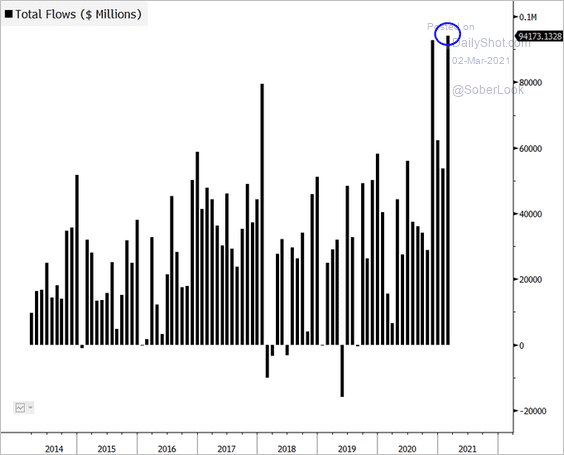 Source: @EricBalchunas, @cfb_18 Read full article
5. US stocks look extremely expensive on a price-to-sales basis.
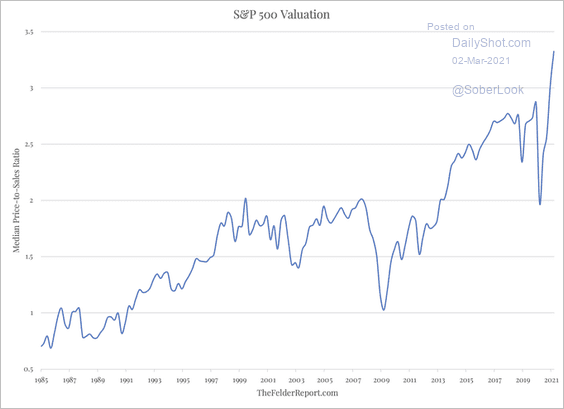 Source: @jessefelder
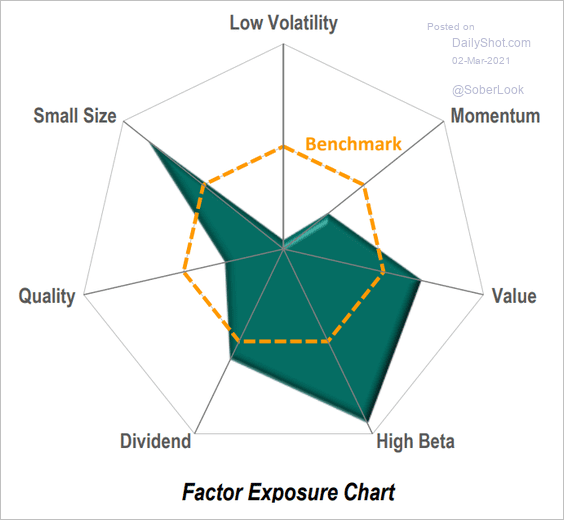
6. High-beta shares took off this year.
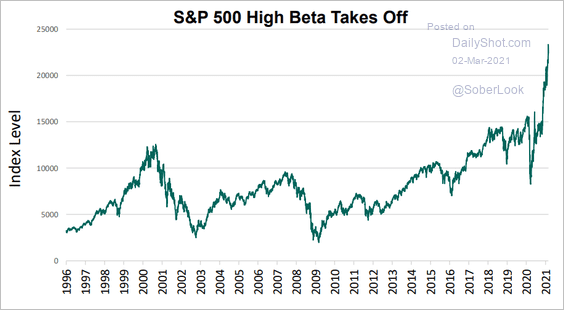 Source: S&P Global Market Intelligence
Many high-beta stocks are smaller firms – the small-cap rally helped.
 Source: S&P Global Market Intelligence
——————–
7. SPACs drove the recent sharp increase in public listings of zero-revenue companies.
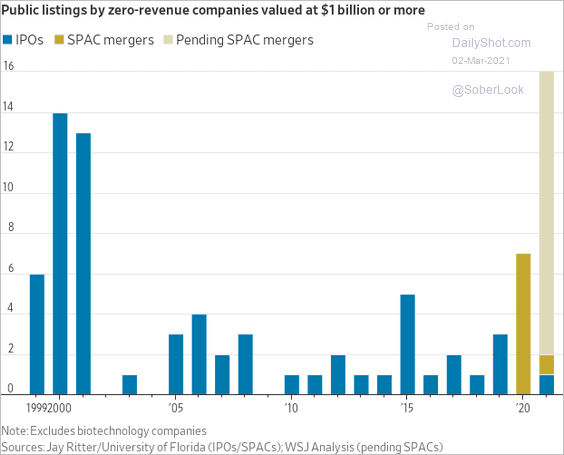 Source: @WSJ Read full article
Back to Index
Rates
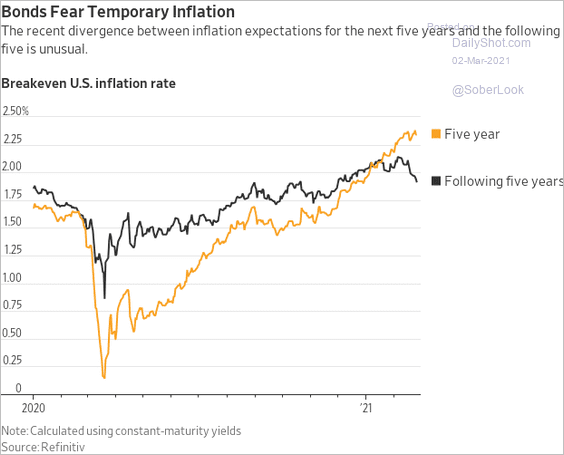
1. The five-year breakeven rate continues to climb.
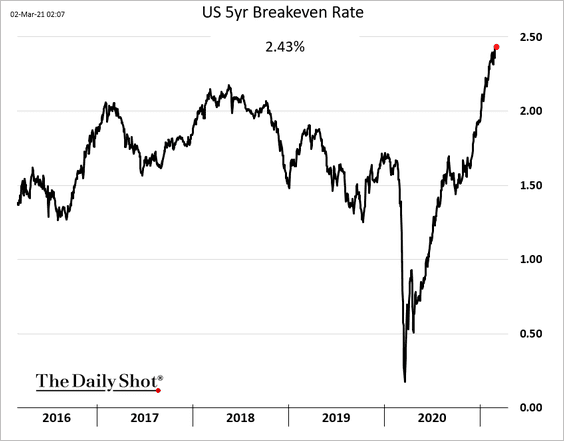
However, as we saw yesterday, the market is pricing in lower inflation in the following five years.
 Source: @WSJ Read full article
——————–
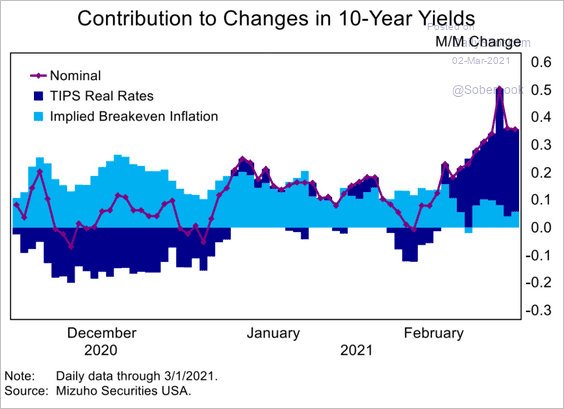
2. Here is the attribution of the 10yr Treasury yield changes over time.
 Source: Mizuho Securities USA
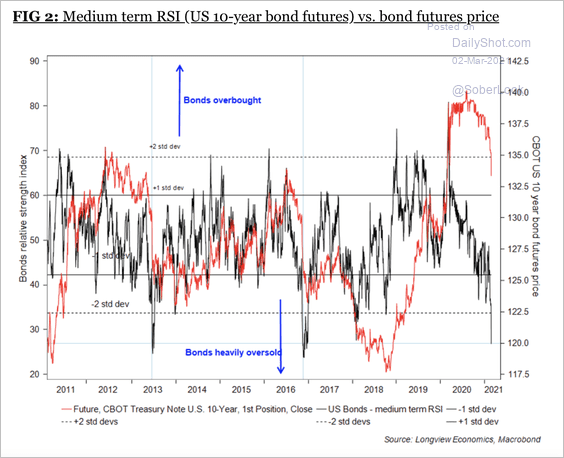
3. The 10-year Treasury note is oversold, while net-long futures positioning is starting to decline.
 Source: Longview Economics
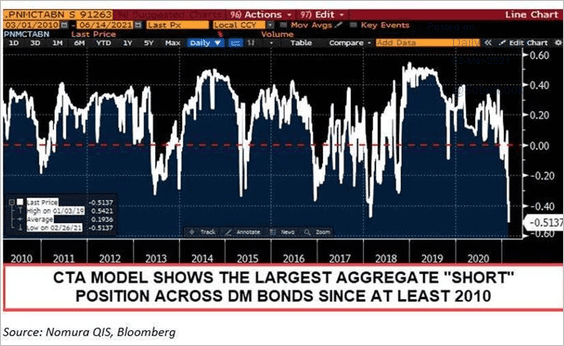
Moreover, Nomura’s model shows extreme short positions across global bond markets.
 Source: @DriehausCapital
——————–
4. Historically, high put option volume in the iShares 20+ Treasury bond ETF (TLT) has preceded more weakness.
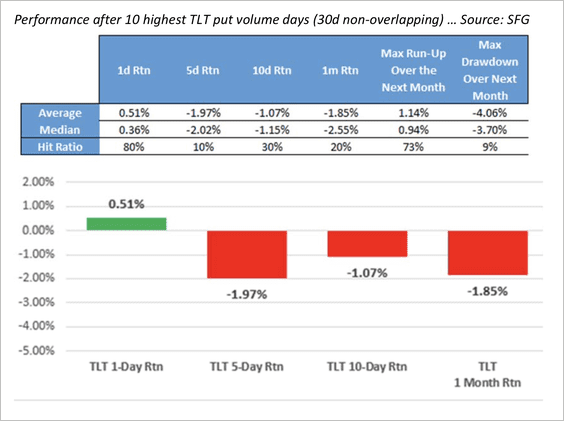 Source: Chris Murphy; Susquehanna Derivative Strategy
5. Mortgage hedging caused a sharp increase in swap trading volumes.
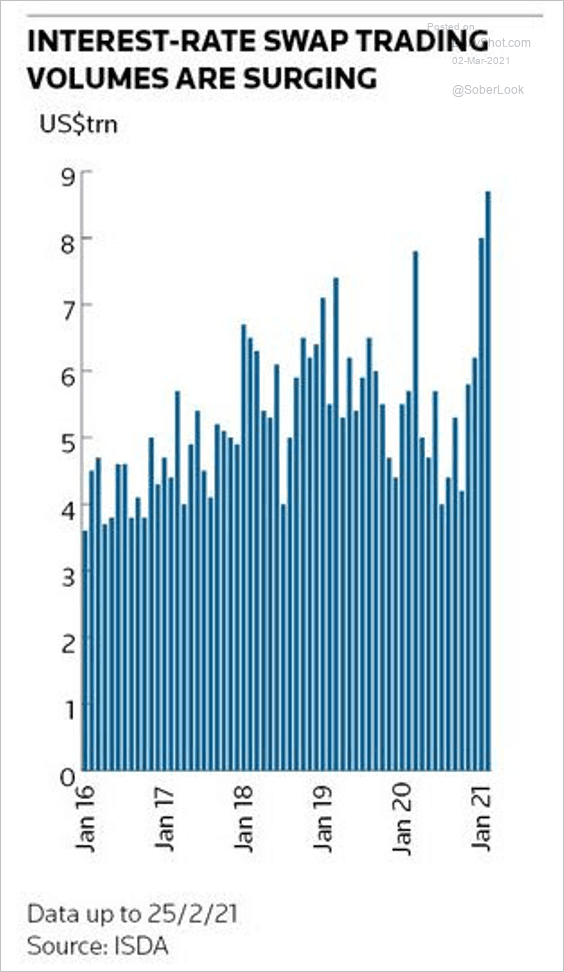 Source: IFR Read full article
6. Is the market too hawkish on the timing and the pace of Fed rate hikes?
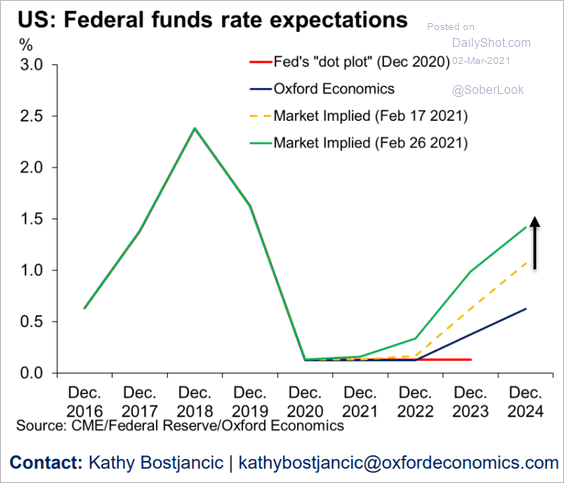 Source: Oxford Economics
Back to Index
Global Developments
1. Here is the correlation between the 10yr Treasury yield and currencies of advanced economies (vs. USD).
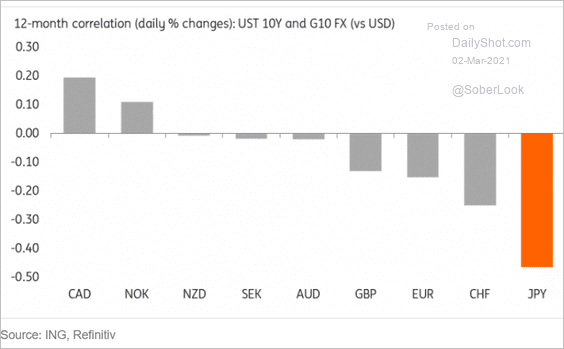 Source: ING
2. This chart shows February and year-over-year returns across asset classes.
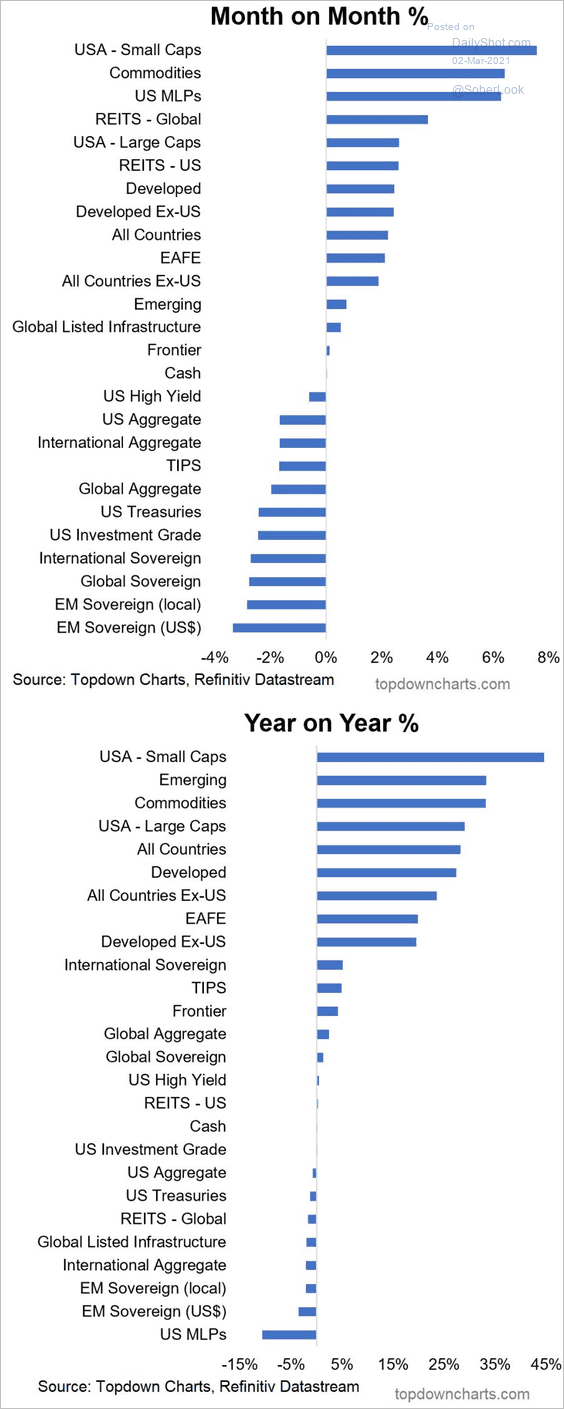 Source: @topdowncharts
3. Some countries saw increases in new COVID infections last week.
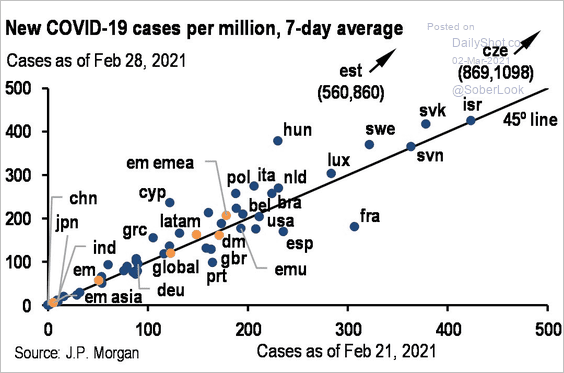 Source: JP Morgan; @carlquintanilla
——————–
Food for Thought
1. Pyramid distribution of US equity returns since 1825:
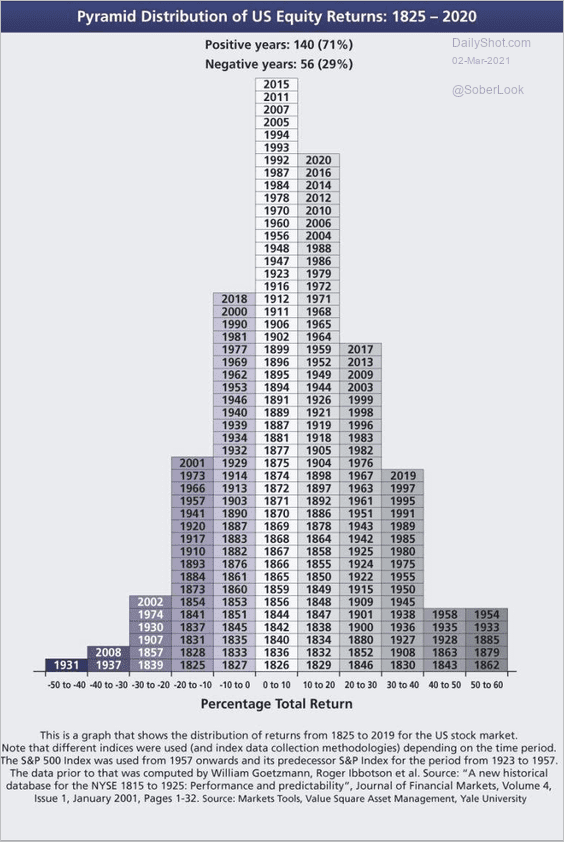 Source: @jsblokland
2. Average age of large dams:
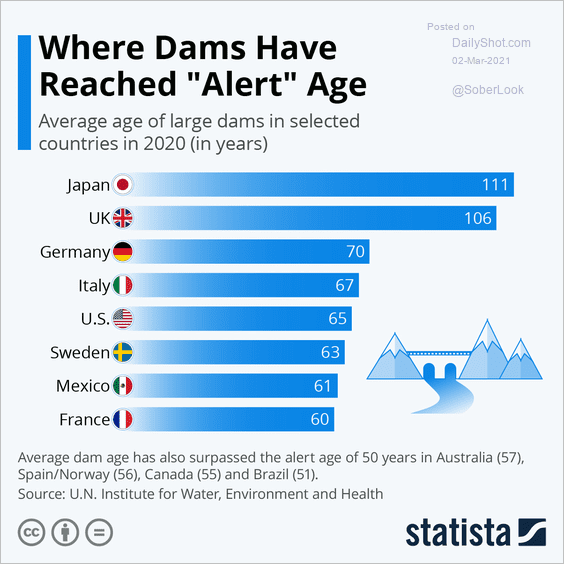 Source: Statista
3. US gains in inflation-adjusted incomes by income percentile:
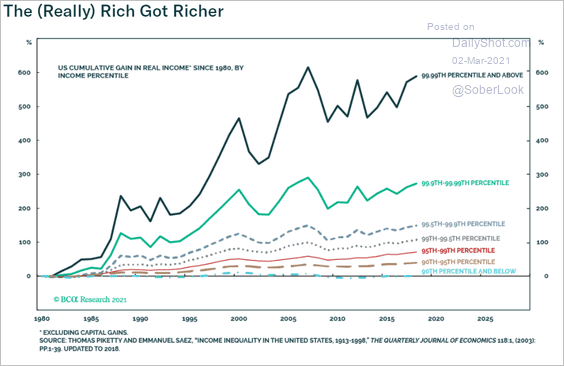 Source: BCA Research
4. US mandatory spending vs. investment:
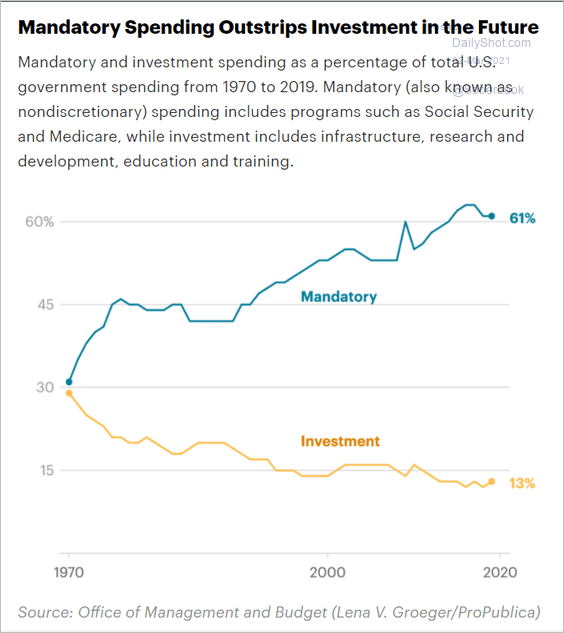 Source: ProPublica Read full article
5. College graduates’ share of the population:
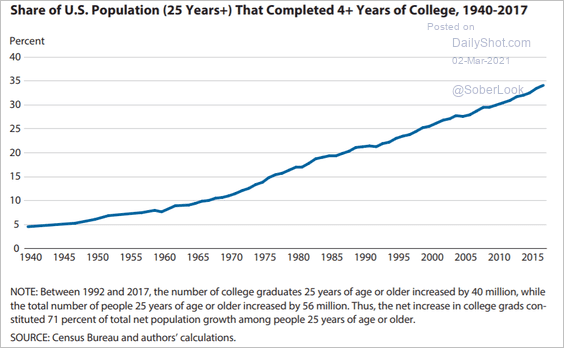 Source: @stlouisfed Read full article
6. US vaccination progress:
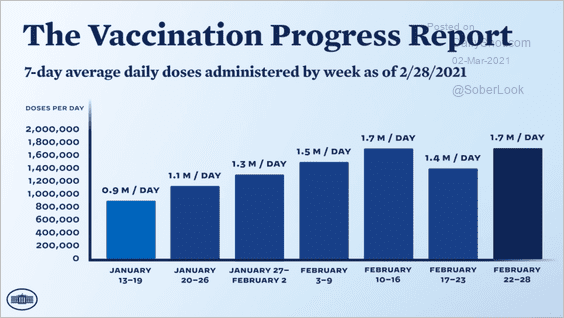 Source: @WHCOVIDResponse
7. COVID infection rates in children:
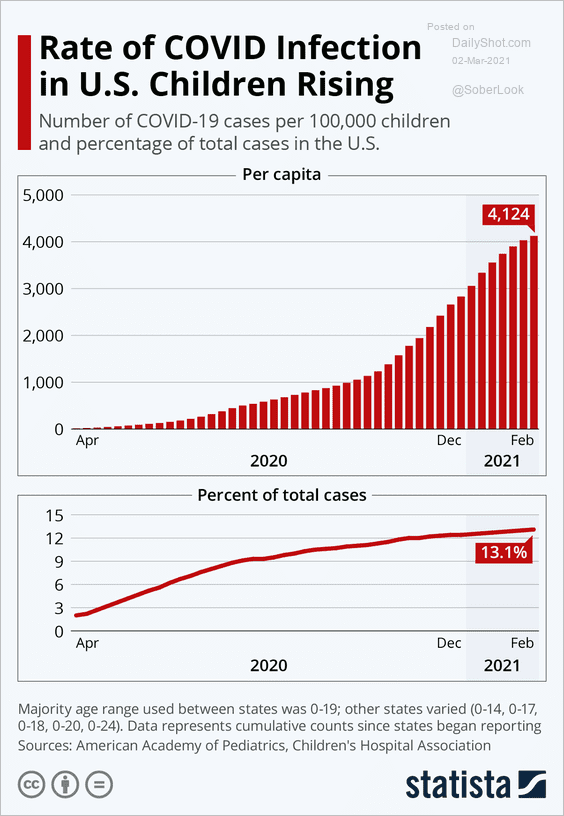 Source: Statista
8. Ted Cruz’s approval ratings:
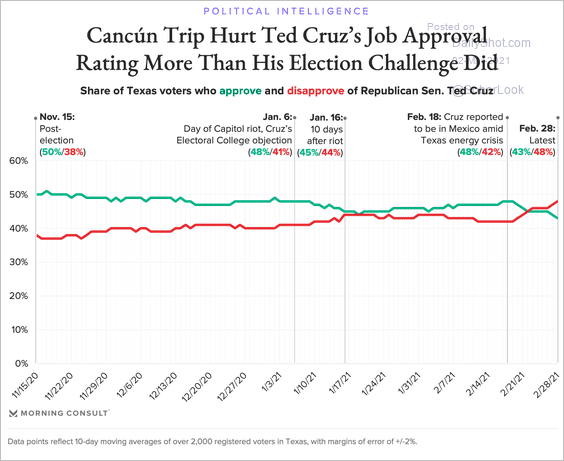 Source: @eyokley Read full article
9. Zoom meeting attention span:
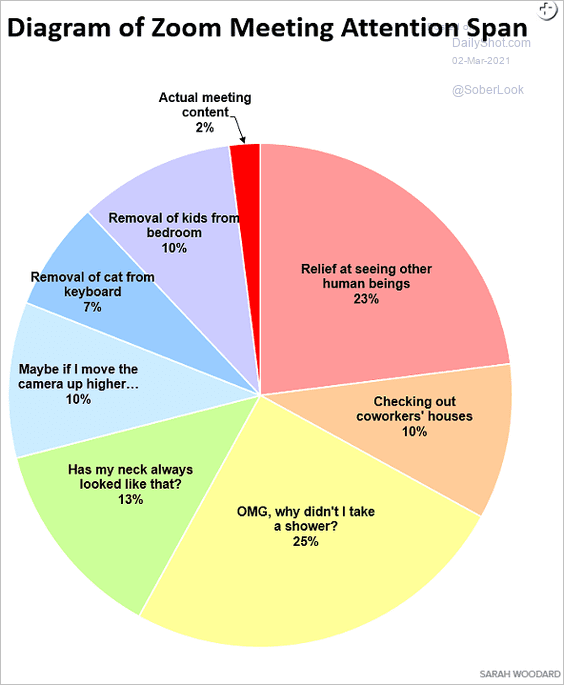 Source: Seven Days
——————–
Back to Index