
The Daily Shot: 04-Mar-21
• The United States
• The United Kingdom
• The Eurozone
• Europe
• Asia – Pacific
• China
• Commodities
• Energy
• Equities
• Rates
• Food for Thought
The United States
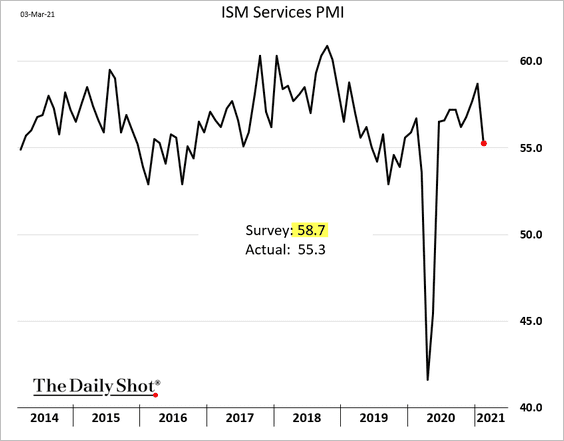
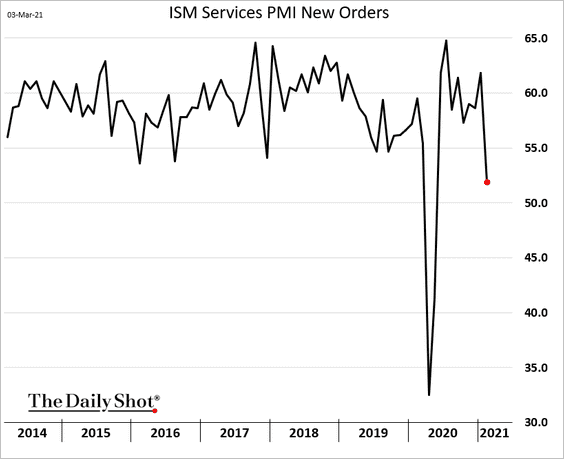
1. The ISM Services PMI report showed some loss of momentum last month as growth in new orders slowed sharply (2nd chart).
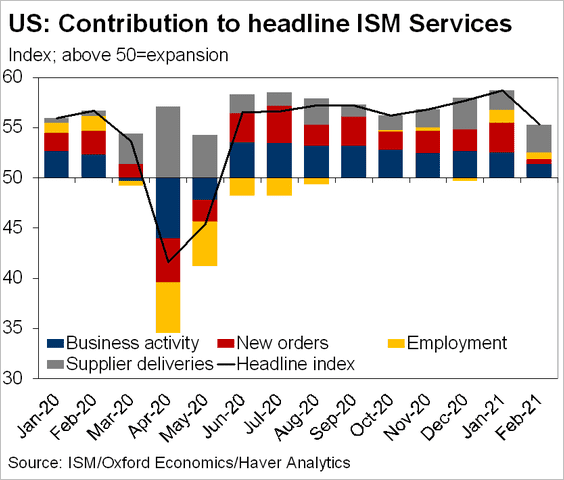
Here are the contributions to the services PMI over time. Supplier delivery bottlenecks kept the index from deteriorating further.
 Source: @TheTerminal, Bloomberg Finance L.P.
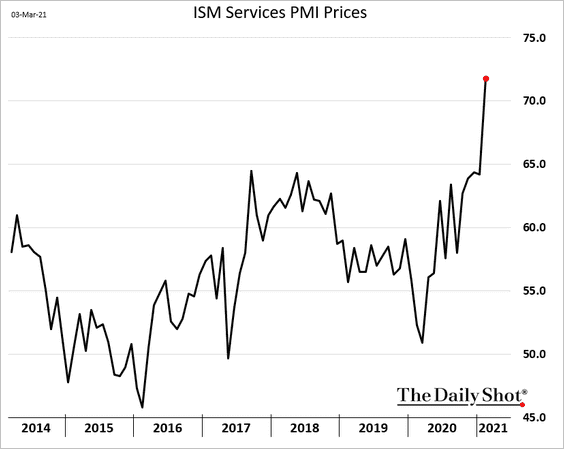
Rising input prices are becoming problematic.
——————–
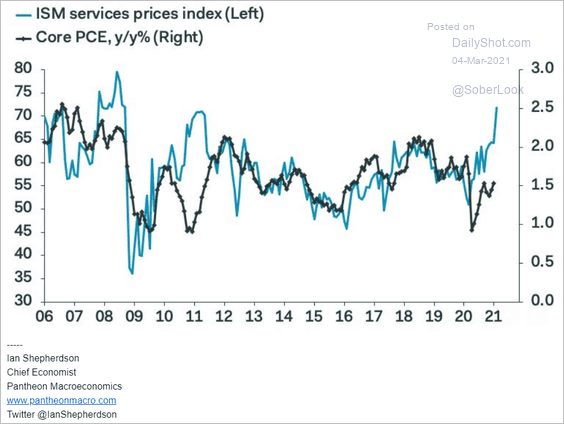
2. Here is the ISM price index (shown above) vs. the core PCE inflation.
 Source: Pantheon Macroeconomics
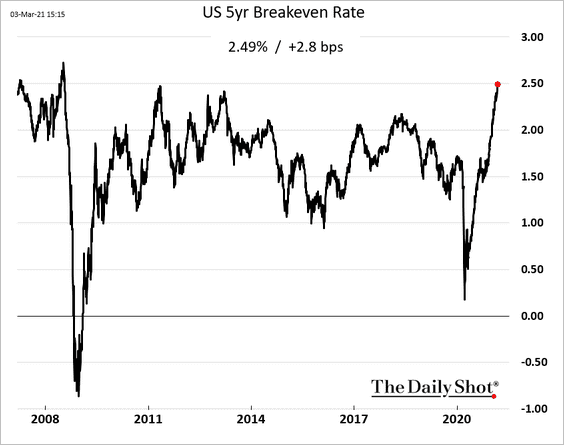
The 5-year breakeven rate (market-based inflation expectations) hit the highest level in over a decade.
——————–
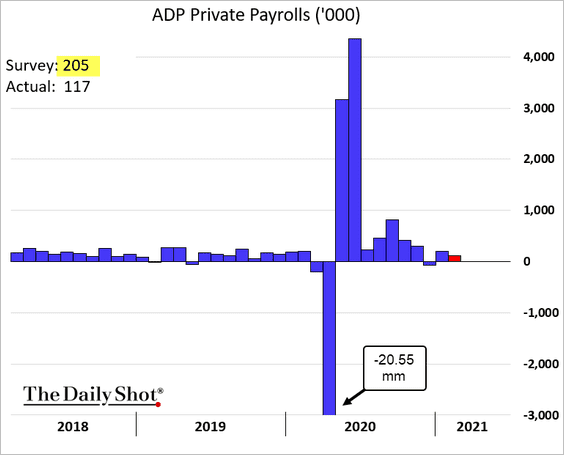
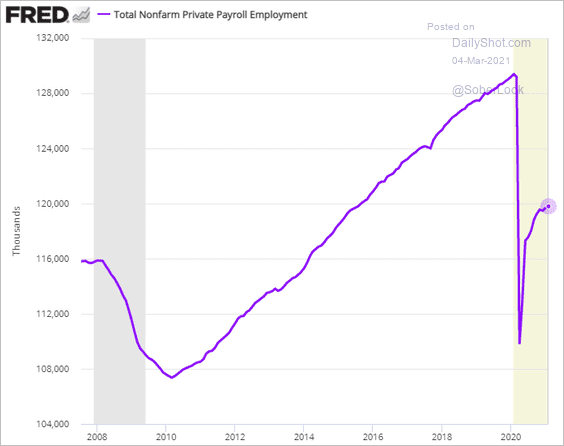
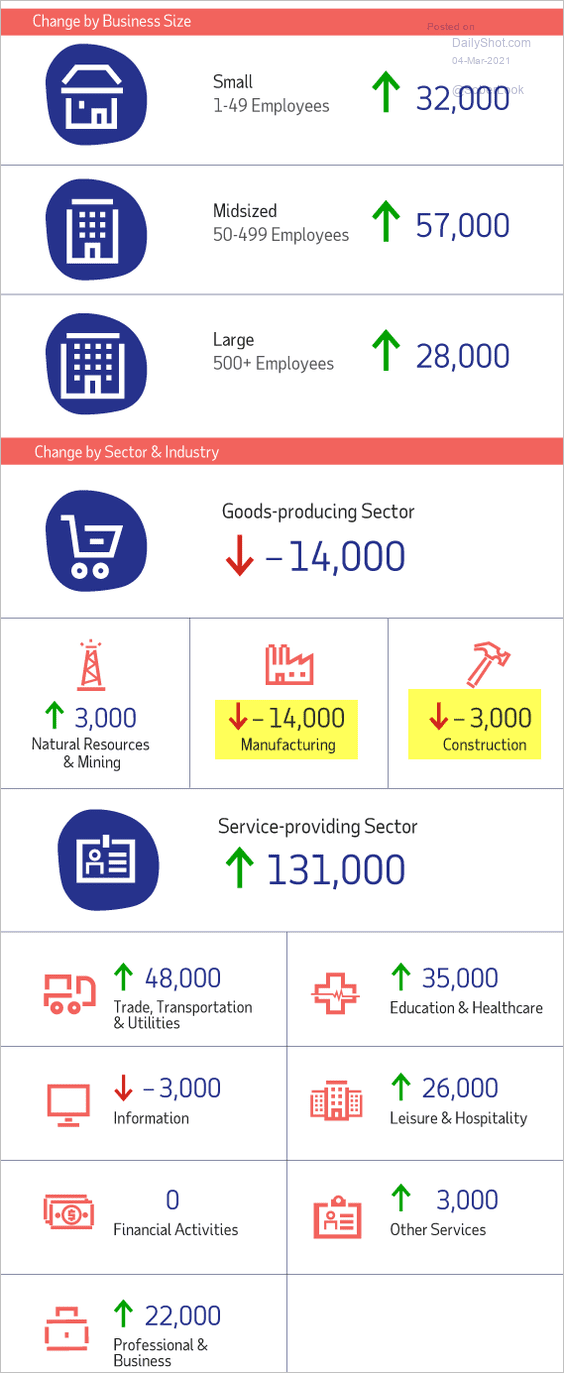
3. The ADP private payrolls report was disappointing, suggesting that the job market recovery remains tepid.
• Despite persistently strong survey data in the manufacturing sector, factory hiring appears to have stalled.

• Here is the ADP report summary.
 Source: ADP
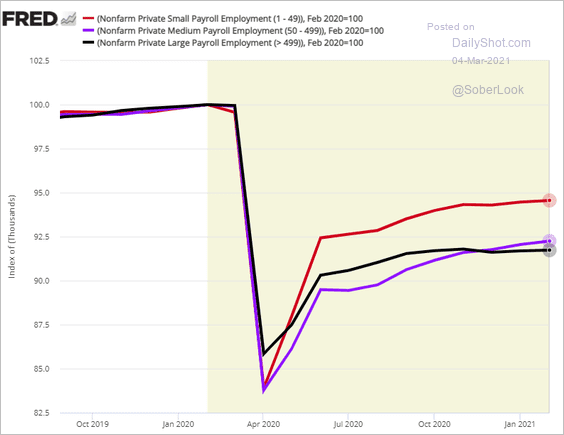
• This chart shows the relative employment recovery paths for businesses of different sizes.
——————–
4. Here are a couple of additional updates on the labor market.
• The Homebase small business data point to a modest uptick in the official employment report for February.
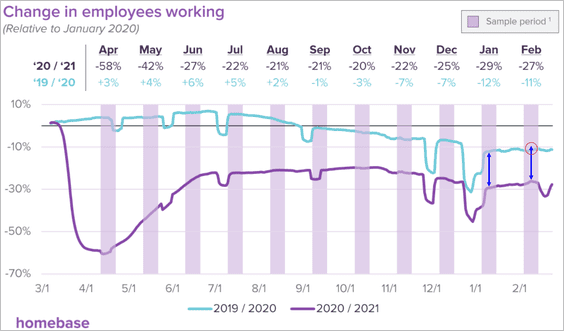 Source: Homebase
• Morgan Stanley expects a 60k increase in payrolls.
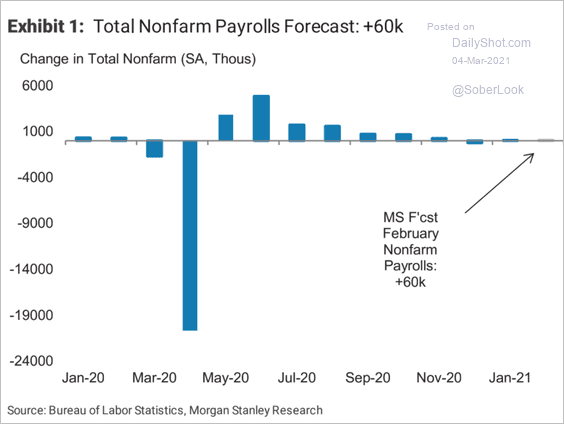 Source: Morgan Stanley Research
——————–
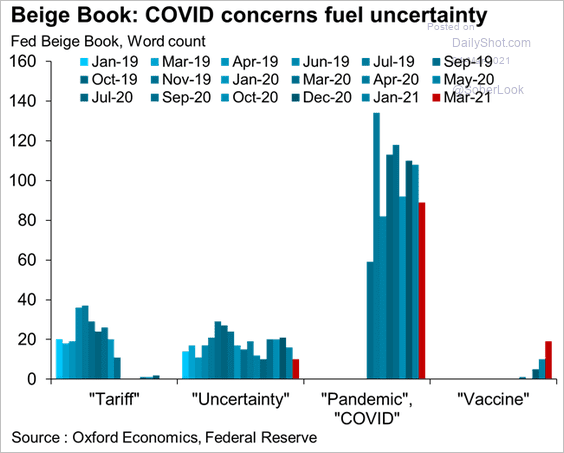
5. The Fed’s Beige Book report shows less uncertainty as businesses place their hopes on vaccination.
 Source: @GregDaco, @OxfordEconomics
6. Finally, we have some updates on the housing market.
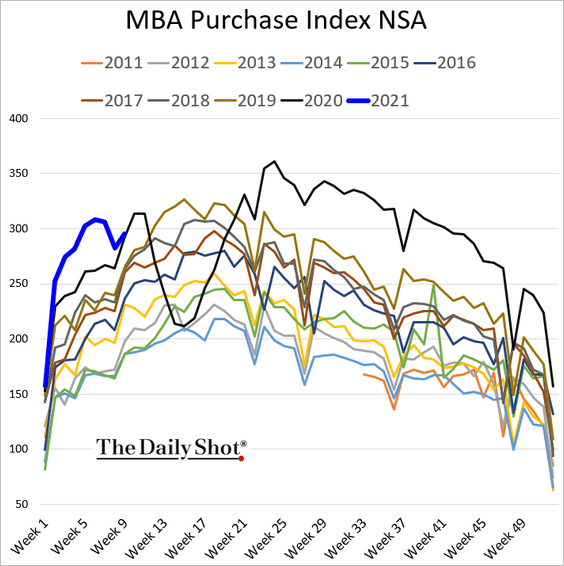
• Mortgage applications ticked higher but are now in line with last year’s level.
• Housing shortages are severe across most metro areas.
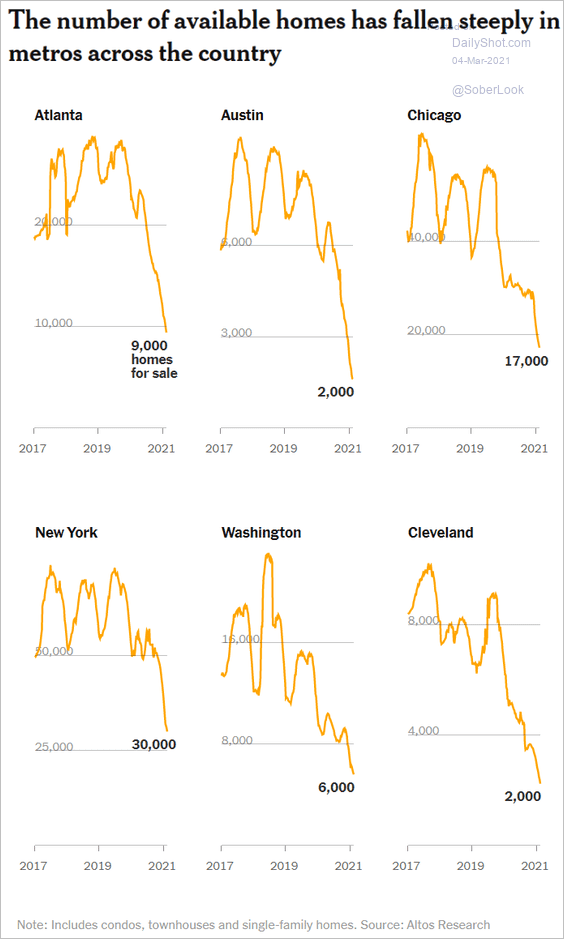 Source: @UpshotNYT Read full article
• This chart shows housing inventories by price tier.
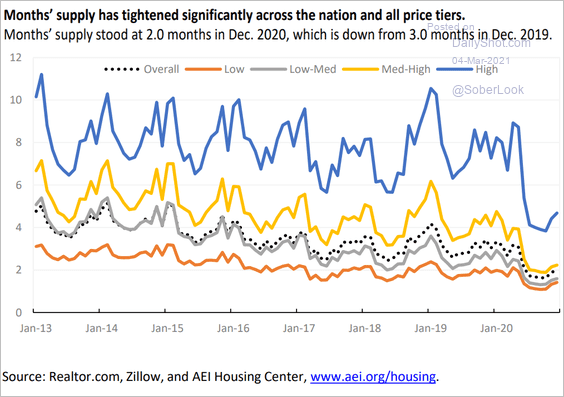 Source: AEI Housing Center
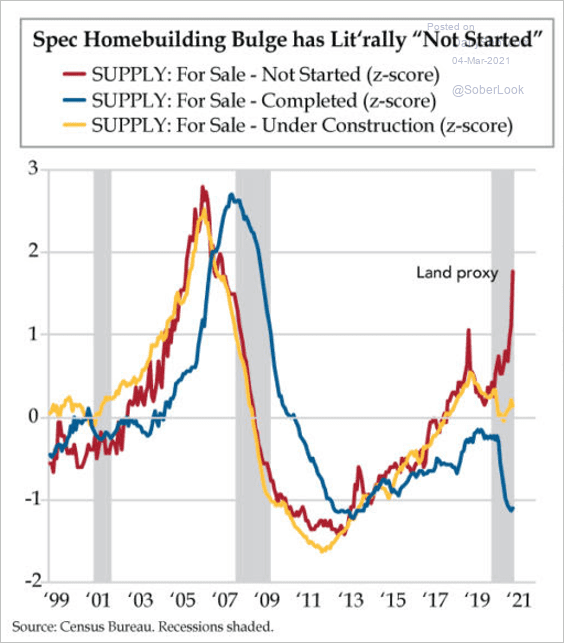
• Homebuilders are increasingly “pre-selling” housing amid robust demand.
 Source: The Daily Feather
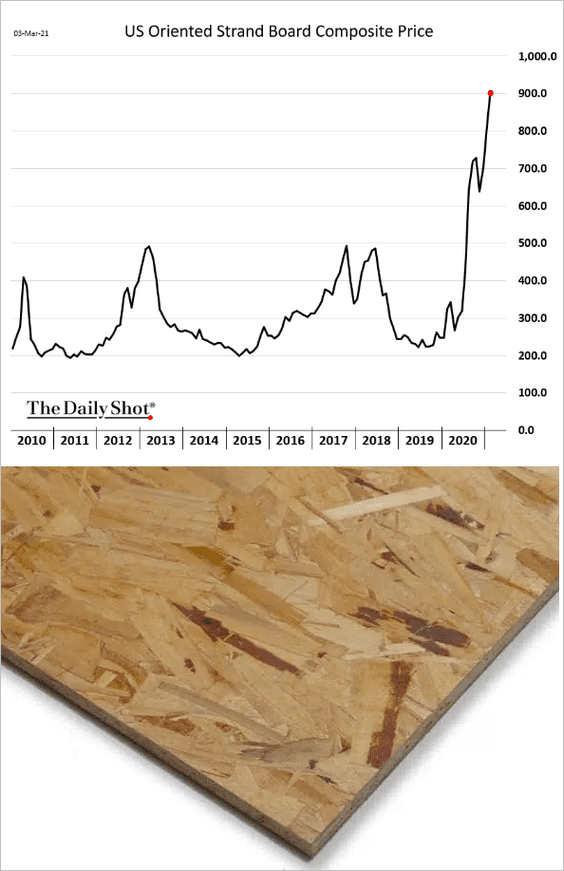
• Rising costs and supplier bottlenecks for building materials have been a challenge for homebuilders.
 Source: The Inquirer Read full article
– Oriented strand board price:
 Source: The Home Depot
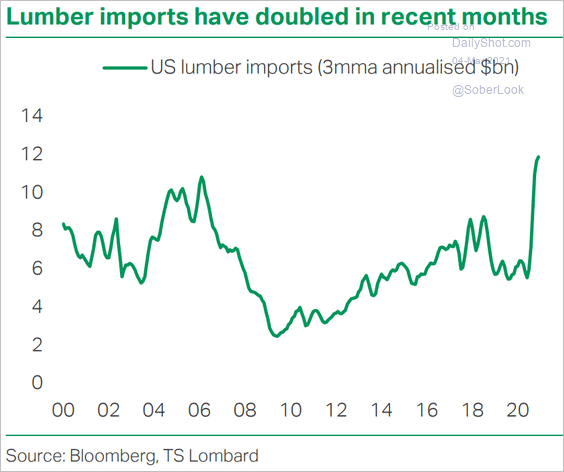
– US lumber imports (showing tight domestic supplies):
 Source: TS Lombard
Back to Index
The United Kingdom
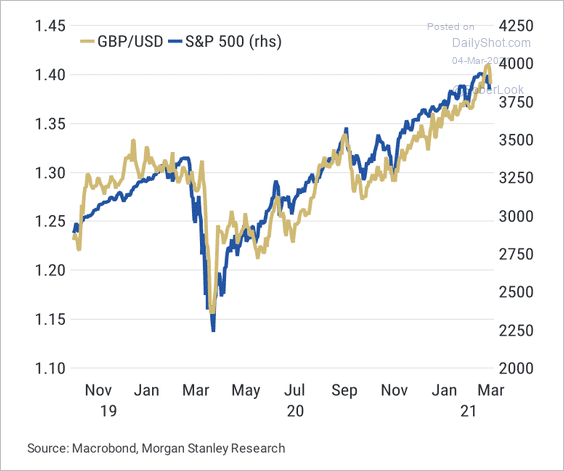
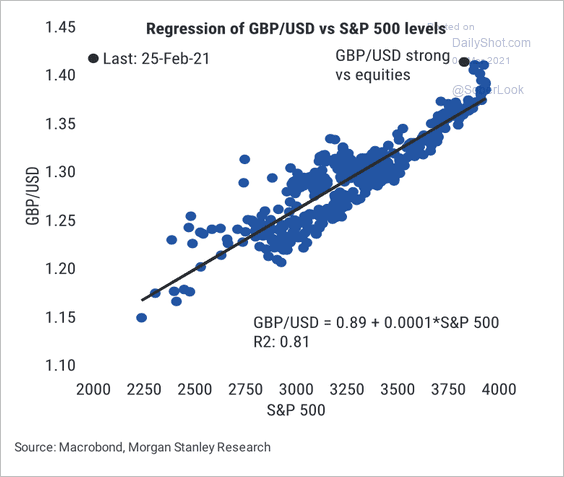
1. GBP/USD generally tracked the S&P 500 over the past year.
 Source: Morgan Stanley Research
But recently, GBP/USD has traded stronger than the S&P 500 would suggest.
 Source: Morgan Stanley Research
——————–
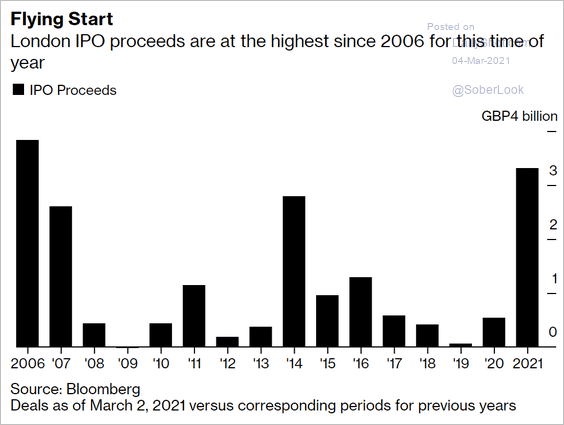
2. London IPO proceeds have taken off this year.
 Source: Bloomberg Read full article
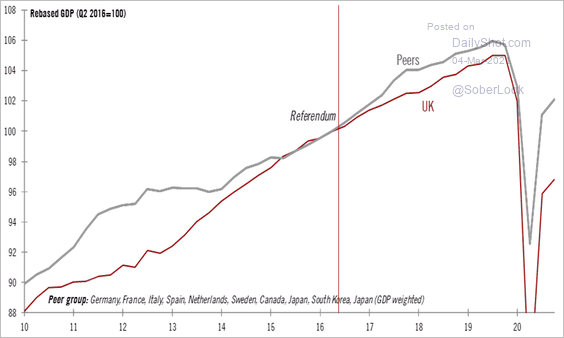
3. The UK GDP continues to lag peers.
 Source: @TCosterg
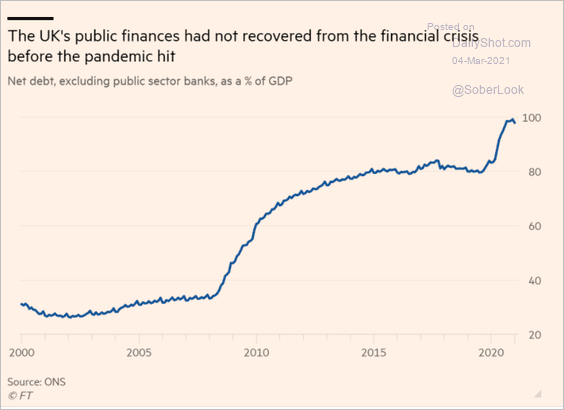
4. The debt-to-GDP ratio rose sharply last year.
 Source: @financialtimes Read full article
Borrowing as a share of GDP is expected to hit the highest level since WW-II.
 Source: Statista
Back to Index
The Eurozone
1. Service-sector activity remains in contraction territory, according to Markit PMI.
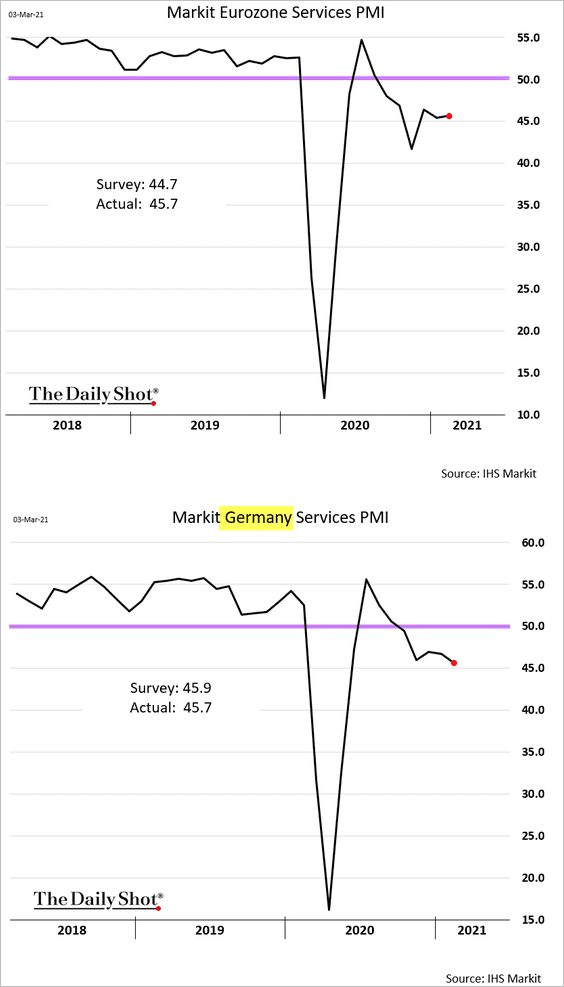
The divergence between services and manufacturing has widened.
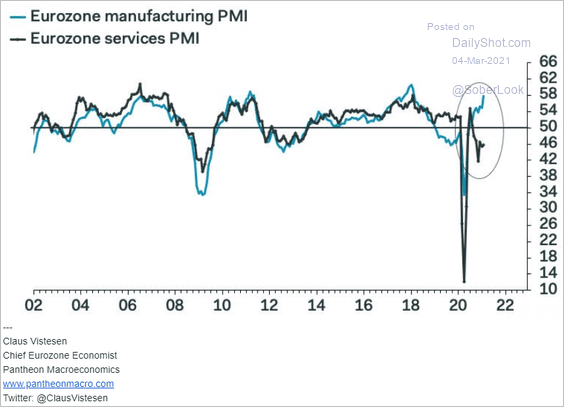 Source: Pantheon Macroeconomics
——————–
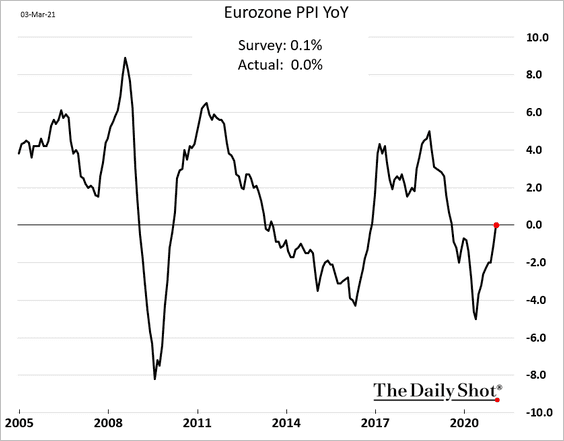
2. Producer prices are rebounding.
3. Here is what Germans want to do after the pandemic.
 Source: Deutsche Bank Research
Back to Index
Europe
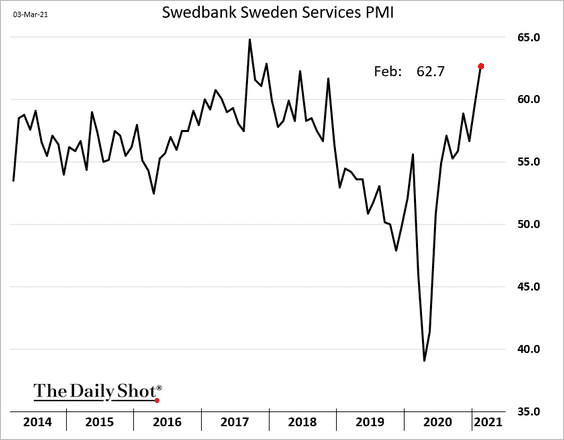
1. Sweden’s service sector is heating up.
2. Central Europe is facing another wave of infections.
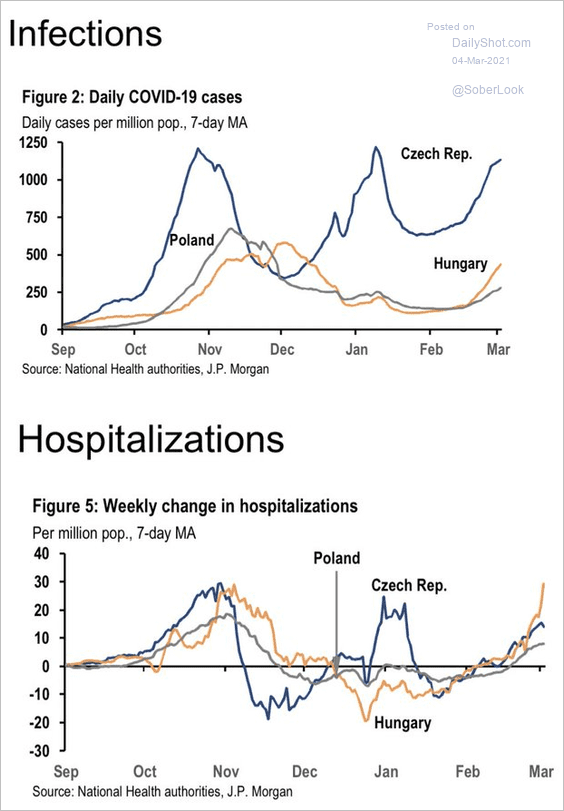 Source: JP Morgan; @carlquintanilla, @CNBC
3. The EU needs to accelerate vaccinations.
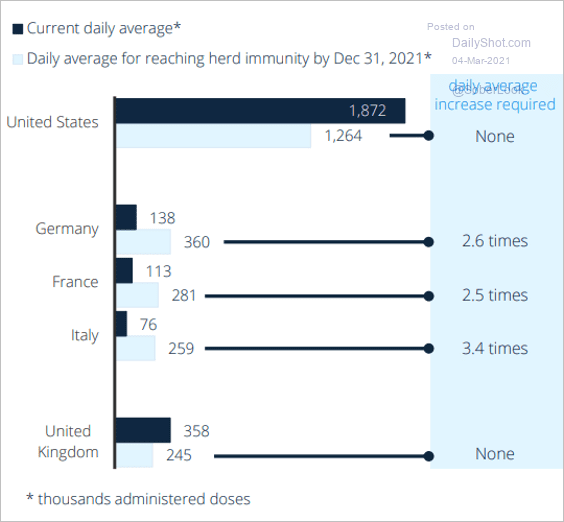 Source: Statista Read full article
4. EUR/CHF is rising along with the 10-year Bund yield.
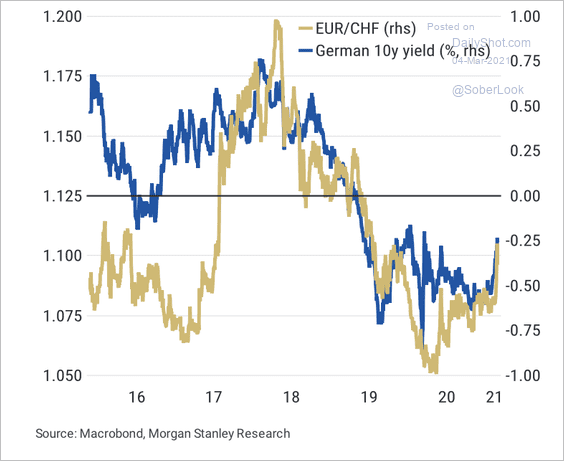 Source: Morgan Stanley Research
5. Here is an overview of the post-Brexit economic, trade, and travel agreements.
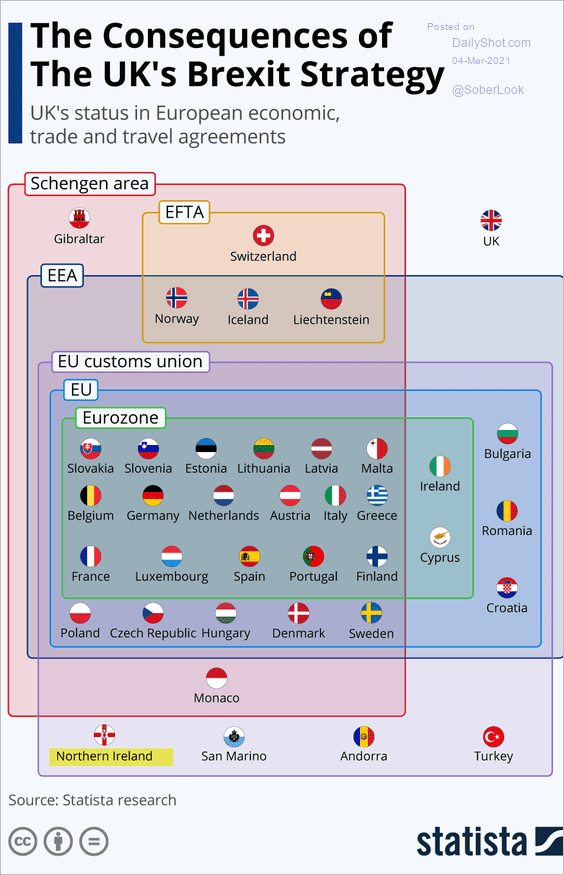 Source: Statista
Back to Index
Asia – Pacific
1. Yoshihide Suga’s cabinet approval has been falling.
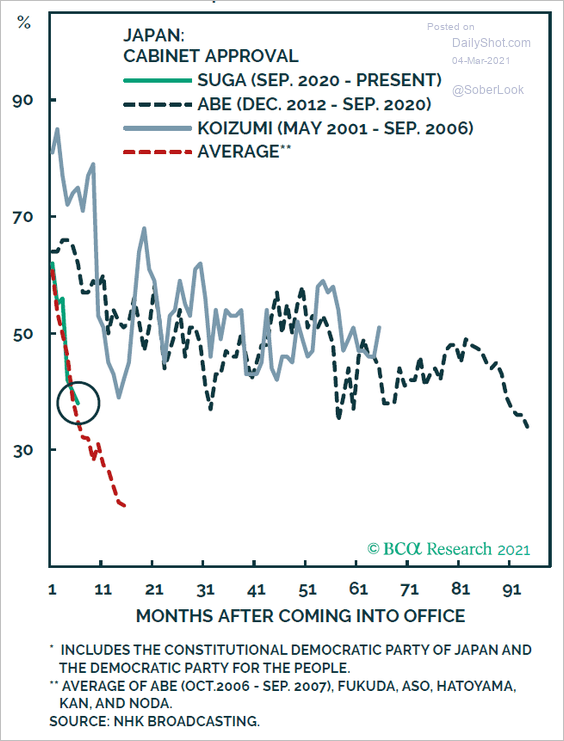 Source: BCA Research
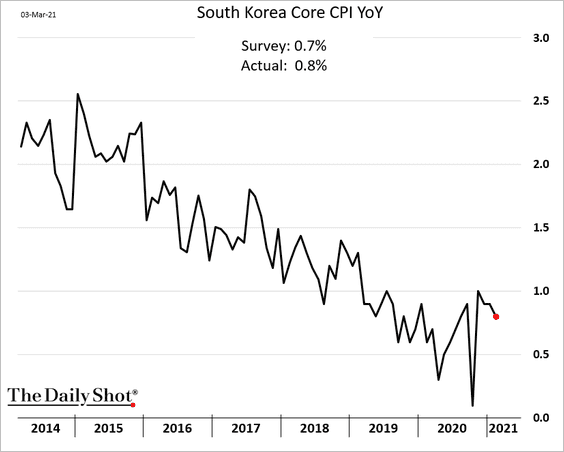
2. Here is South Korea’s core CPI.
3. Australia’s trade surplus hit a record high, boosted by iron ore and LNG exports.
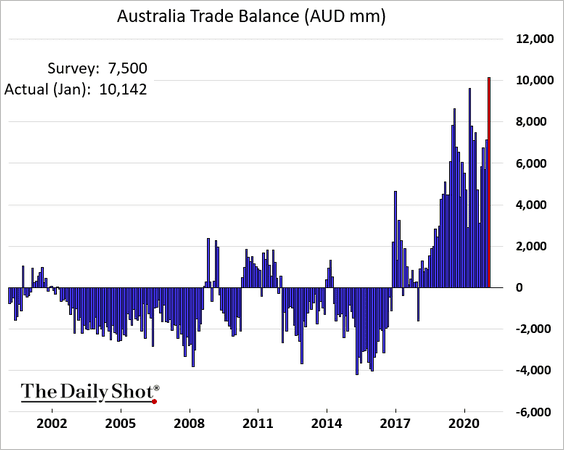
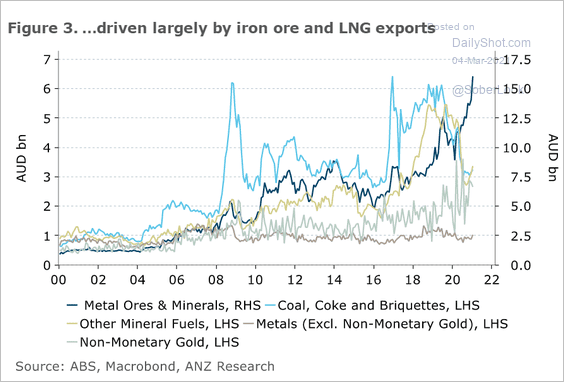 Source: ANZ Research
Back to Index
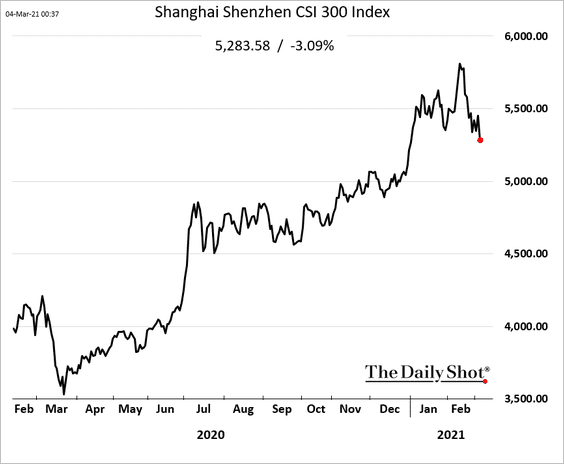
China
1. The stock market is under a bit of pressure.
2. Next, we have some charts on bond defaults (from Bloomberg).
• 2020 defaults:
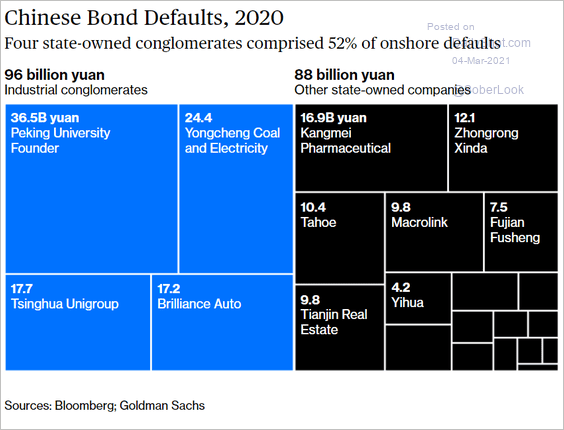 Source: Bloomberg Read full article
• Onshore debt default (Jan-Feb by year):
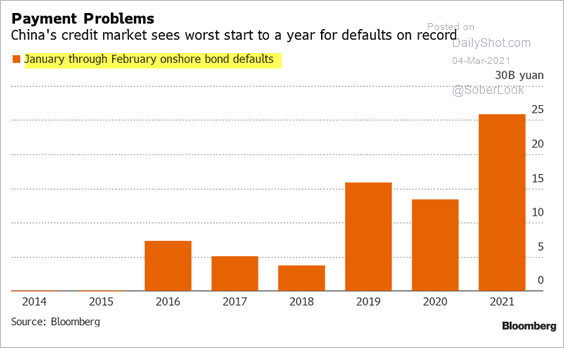 Source: @MollyDai Further reading
• Offshore debt defaults:
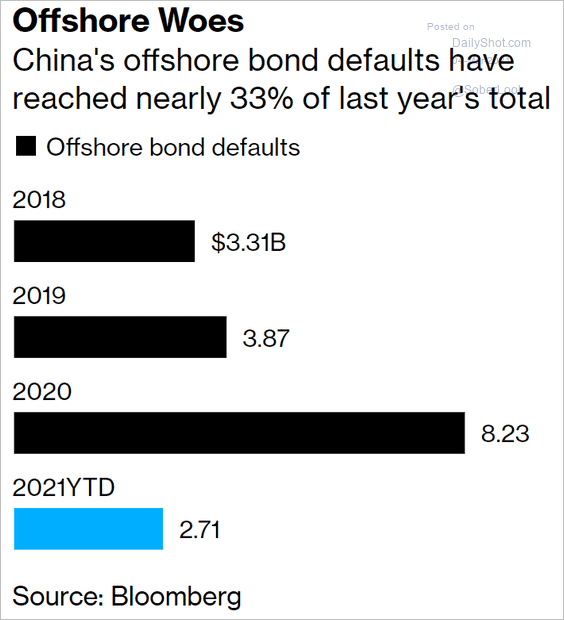 Source: @markets Read full article
——————–
3. China will attempt to become less dependent on semiconductor imports.
 Source: Gavekal Research
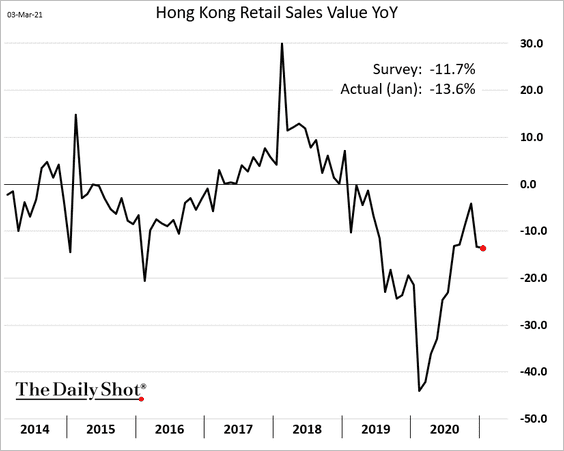
4. Hong Kong’s retail sales remain soft.
Back to Index
Commodities
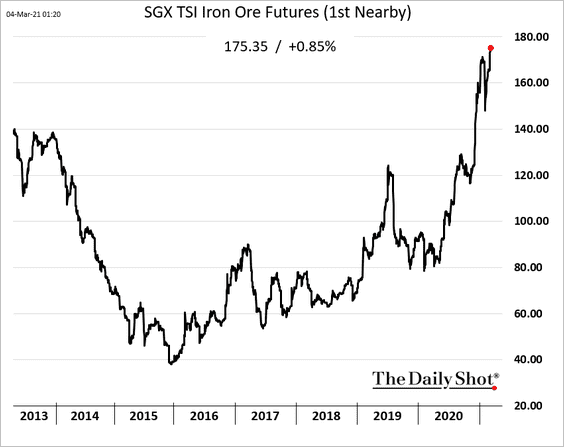
1. Singapore iron ore futures hit a multi-year high.
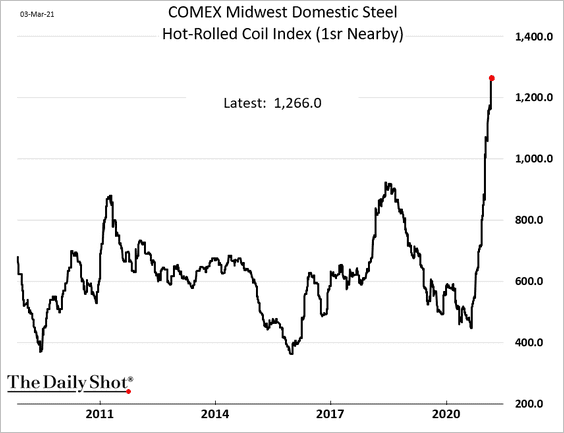
2. US steel prices keep climbing.
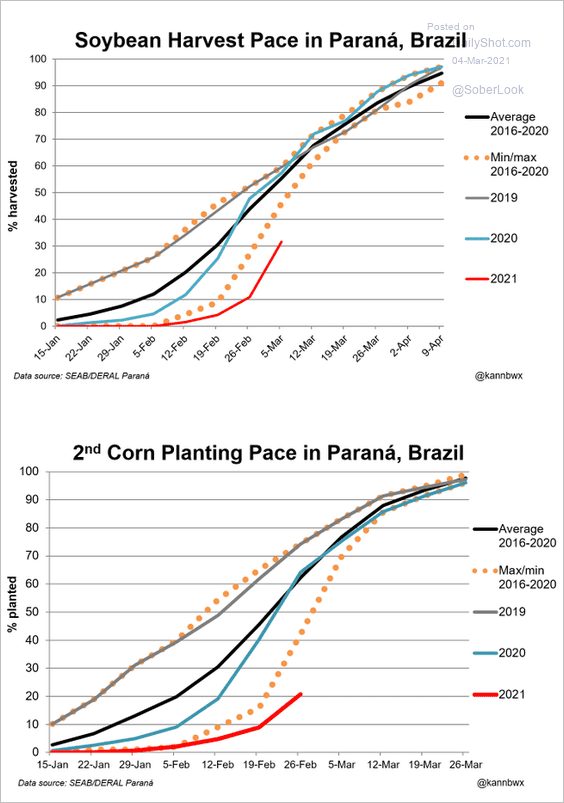
3. Brazil’s soybean harvest is running well behind schedule. Corn planting is lagging as well.
 Source: @kannbwx
Back to Index
Energy
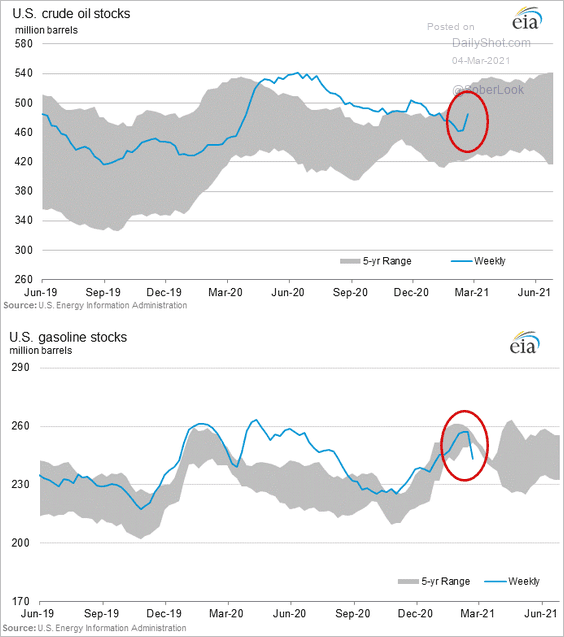
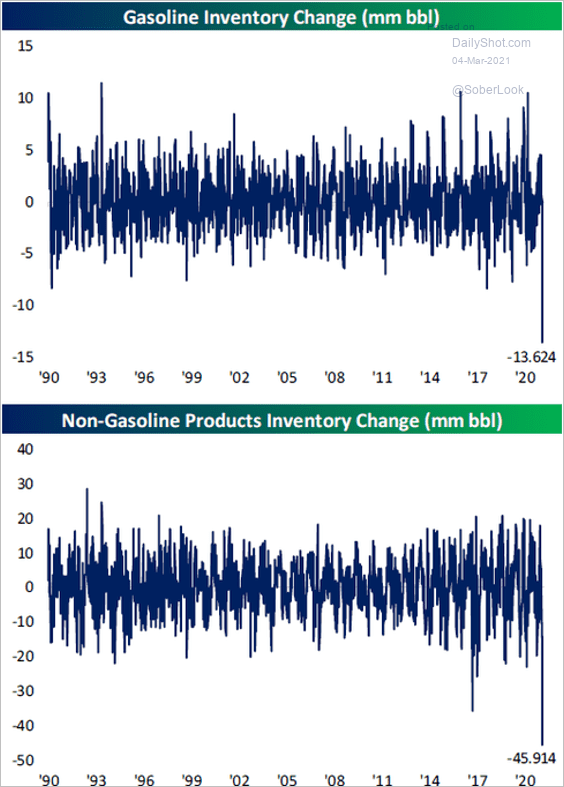
1. US energy markets are still recovering from the Texas deep freeze. With refinery capacity temporarily impaired, …
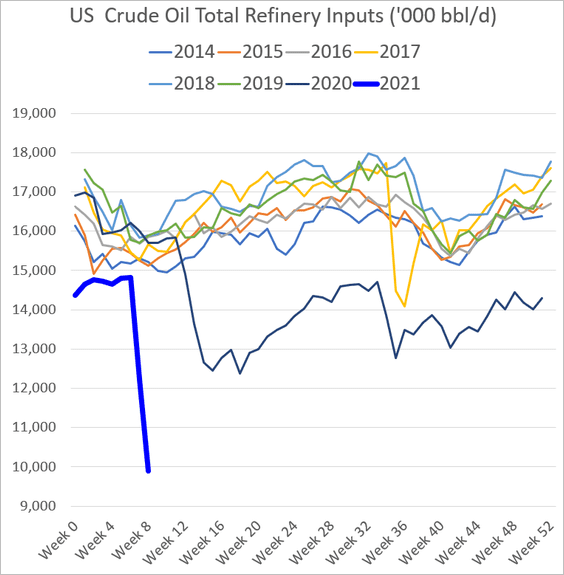
… crude oil inventories shot up while gasoline and other refined product stockpiles tumbled.
 Source: @bespokeinvest Read full article
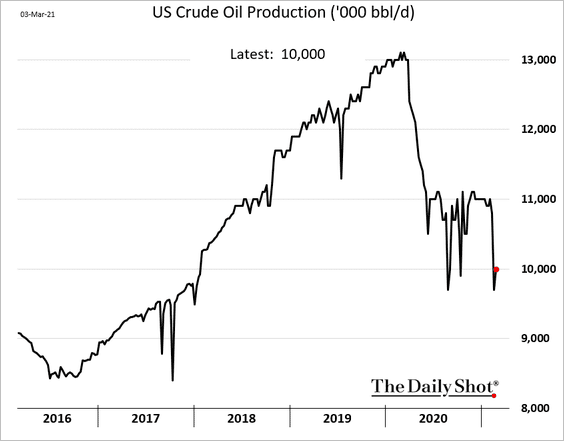
Oil production remained depressed.
——————–
2. Deutsche Bank expects OPEC to moderately increase its market share of crude oil production.
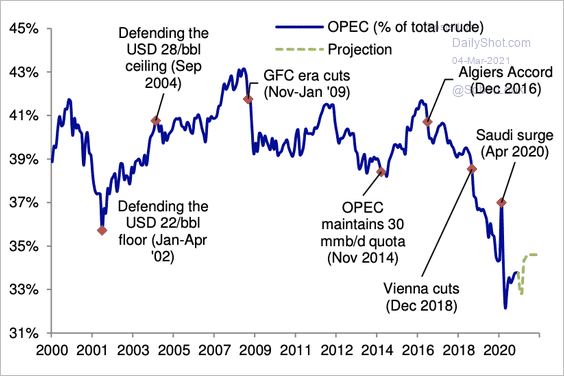 Source: Deutsche Bank Research
3. Here is US electricity generation by energy source.
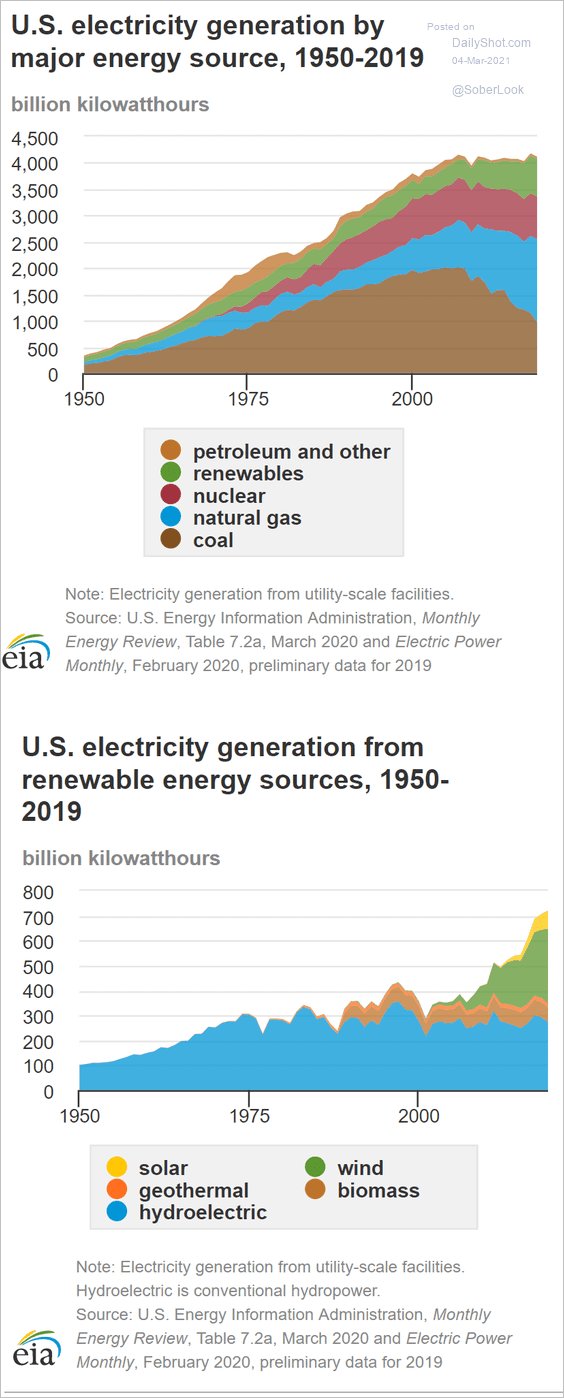 Source: @EIAgov Read full article
Back to Index
Equities
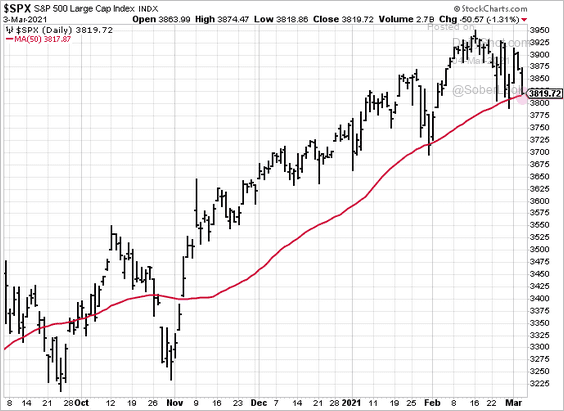
1. Once again, the S&P 500 is testing support at the 50-day moving average.
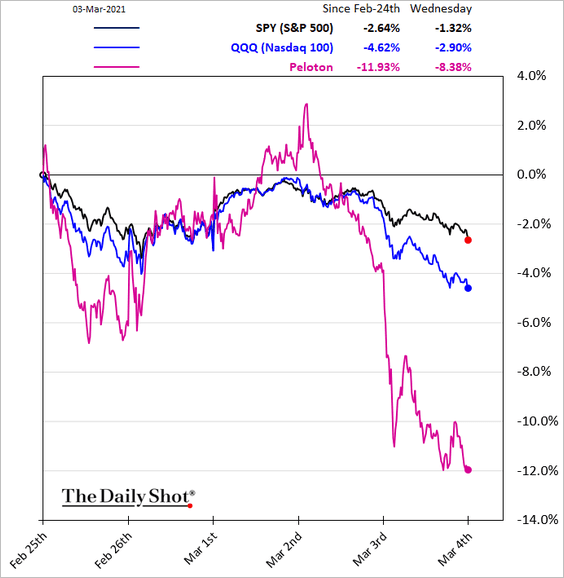
2. Tech stocks continue to be a drag on the US equity market.
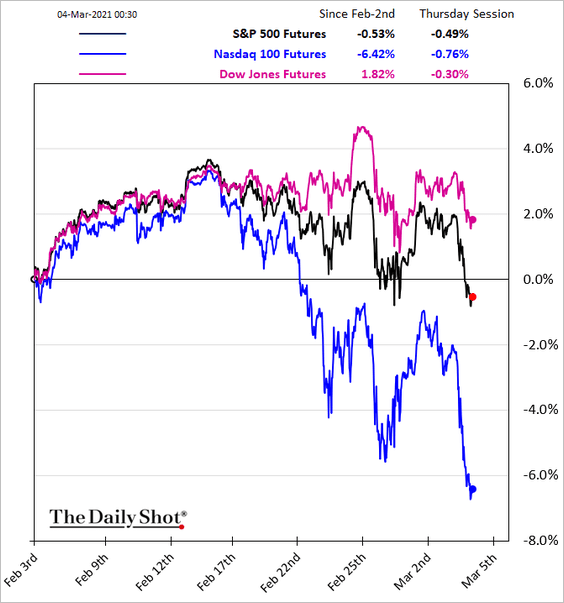
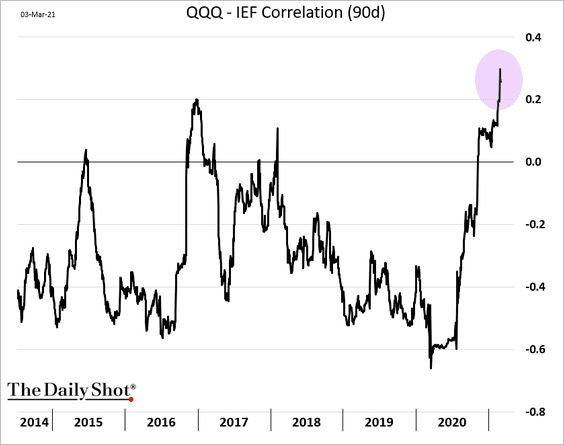
The Nasdaq 100 has been correlated with Treasury prices lately (QQQ = Nasdaq 100; IEF = 7-10yr Treasury ETF).
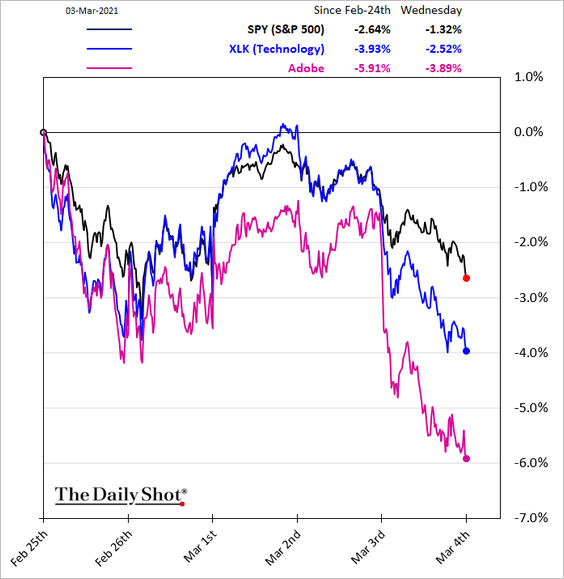
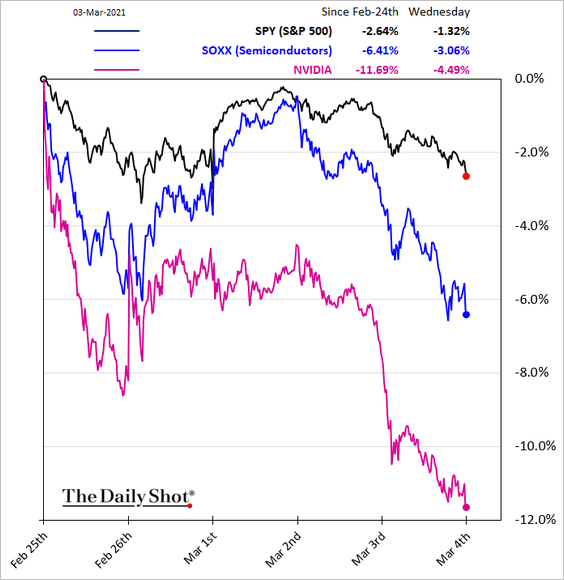
Below is the relative performance over the past five business days.
• Tech:
• Semiconductors:
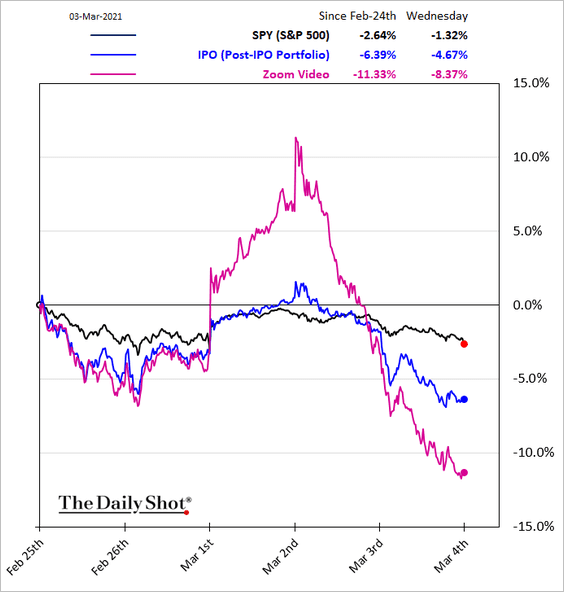
• Post-IPO stocks:
——————–
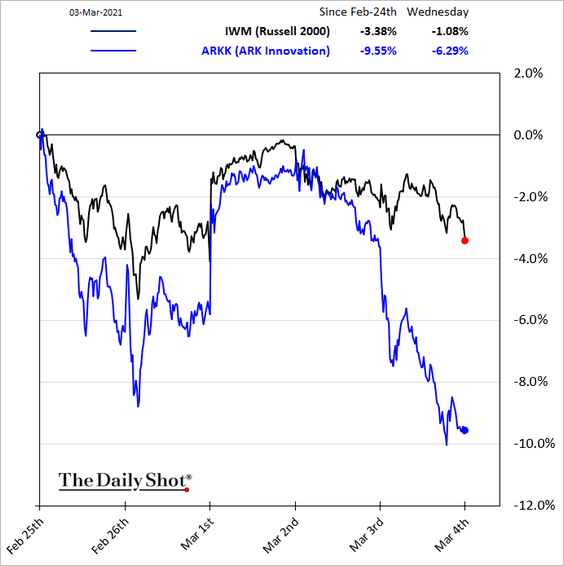
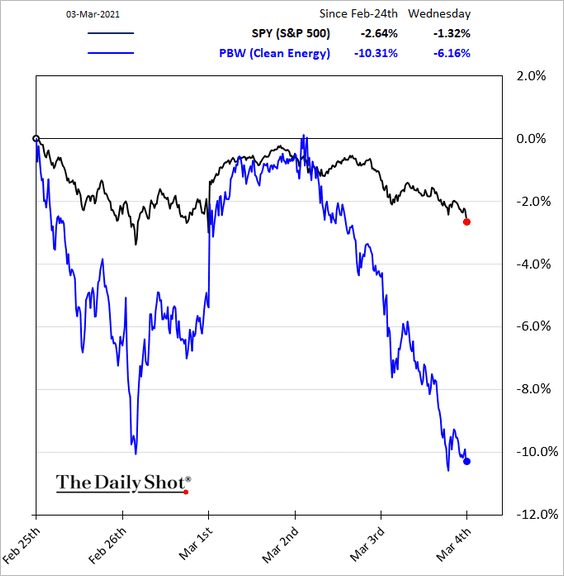
3. Some of the popular thematic ETFs took a hit.
• ARK Innovation:
• Clean energy:
——————–
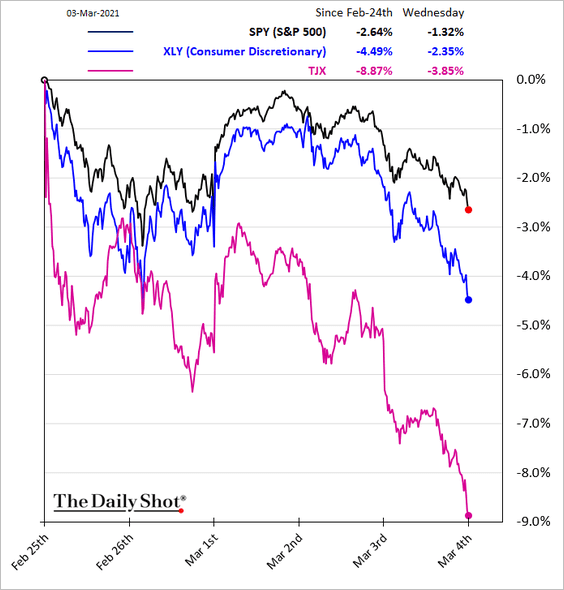
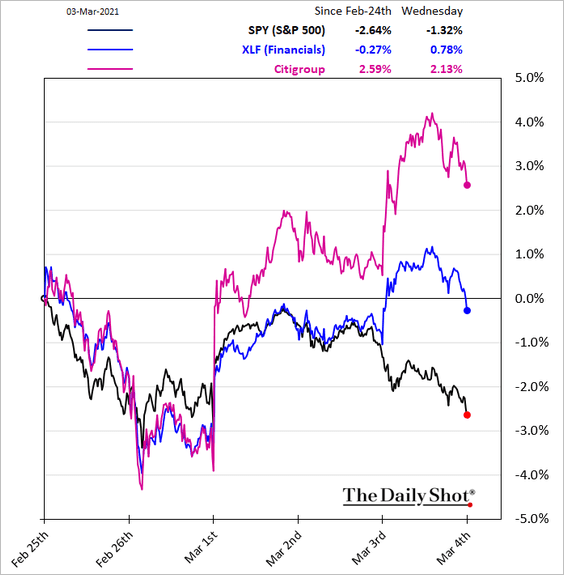
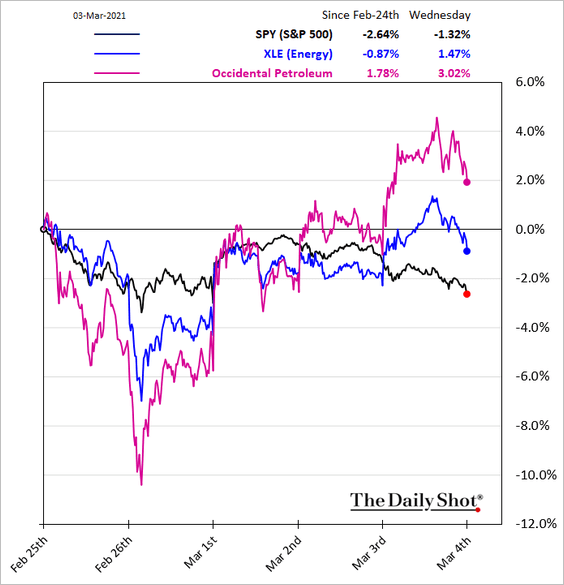
4. Here are a few additional sector trends.
• Consumer discretionary:
• Transportation:
![]()
• Financials:
• Energy:
——————–
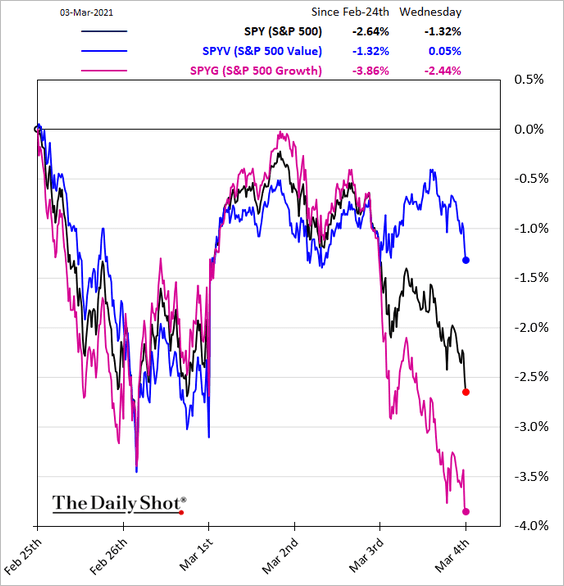
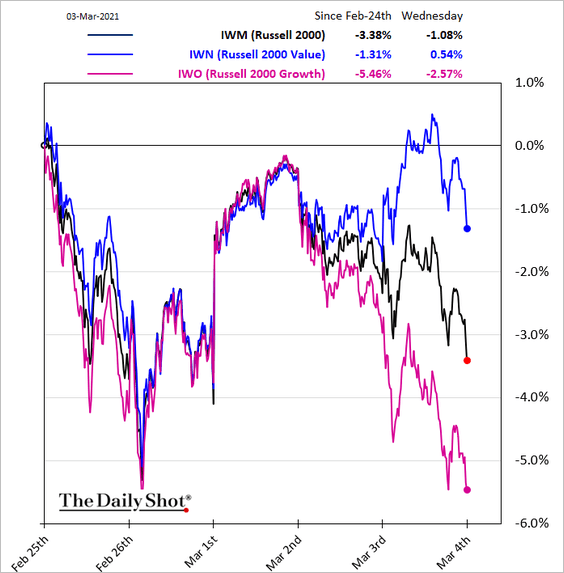
5. Next, we have some equity factor performance charts.
• Value vs. growth:
• Small-cap value vs. growth:
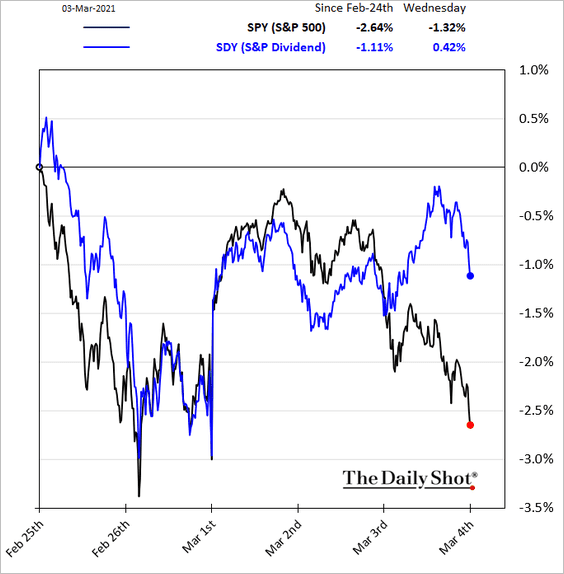
• High-dividend shares:
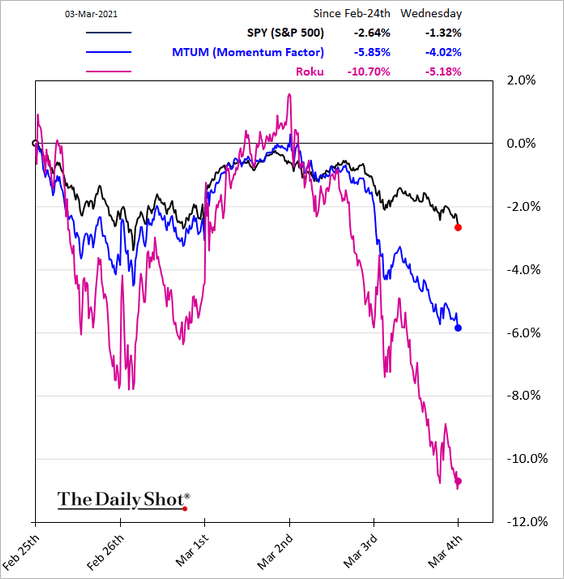
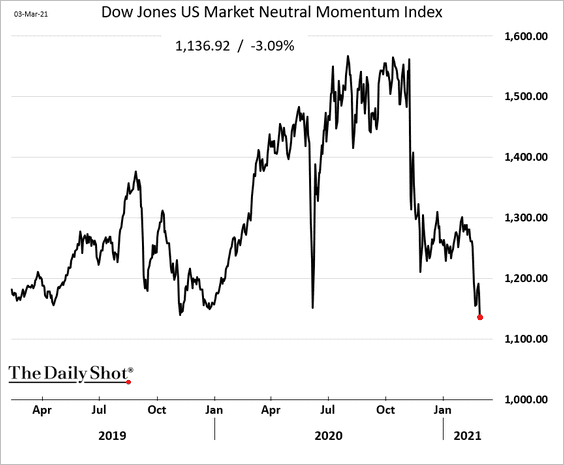
• Momentum (2 charts):
——————–
6. The global “sin index” (gambling, booze, and cigarettes) has been outperforming the broader market.
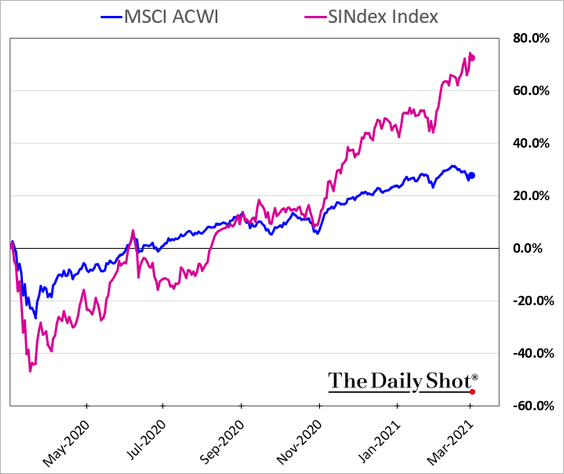 h/t Cormac Mullen
7. Share buybacks are coming back.
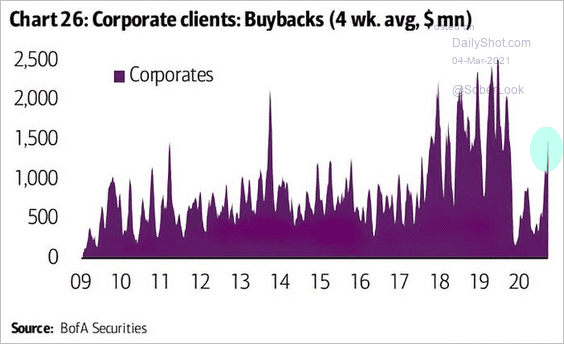 Source: @ISABELNET_SA, @BofAML
——————–
Rates
1. The charts below from Arbor Data Science show an estimated decomposition of Treasury yield changes.
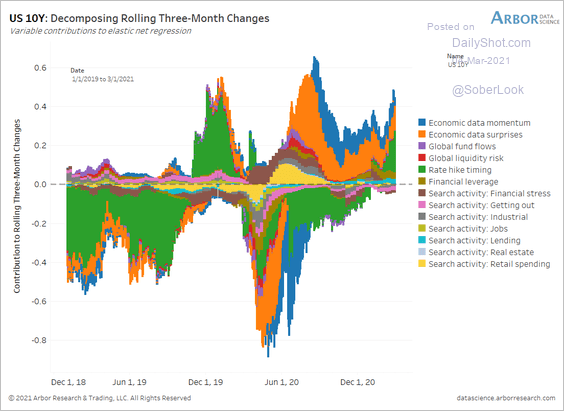 Source: Arbor Research & Trading
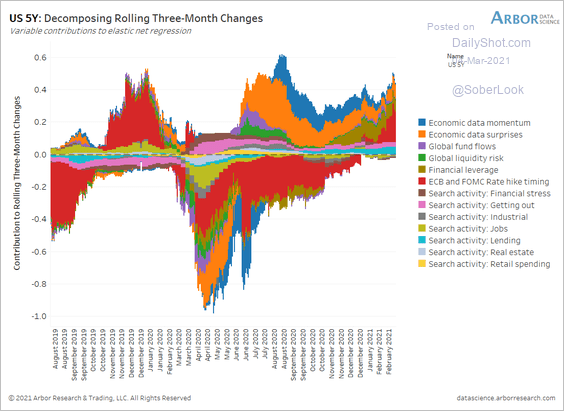 Source: Arbor Research & Trading
——————–
2. The recent drawdown in long-term US Treasury bonds is still below prior extremes.
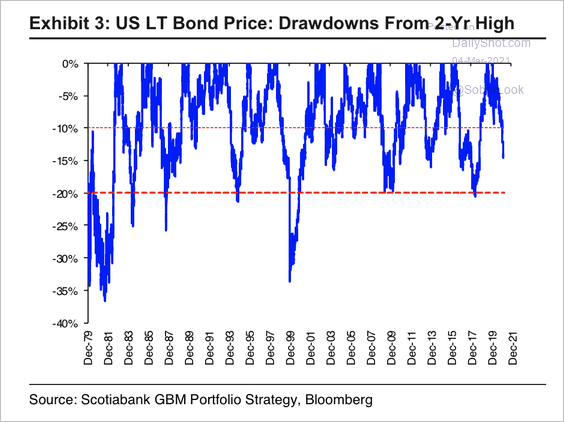 Source: Scotiabank Economics
3. Demand for Treasury securities is not expected to keep up with the issuance.
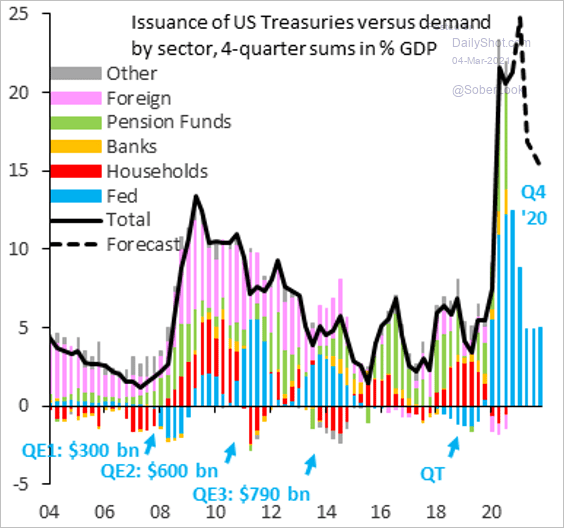 Source: @RobinBrooksIIF
——————–
Food for Thought
1. The biggest sovereign wealth funds:
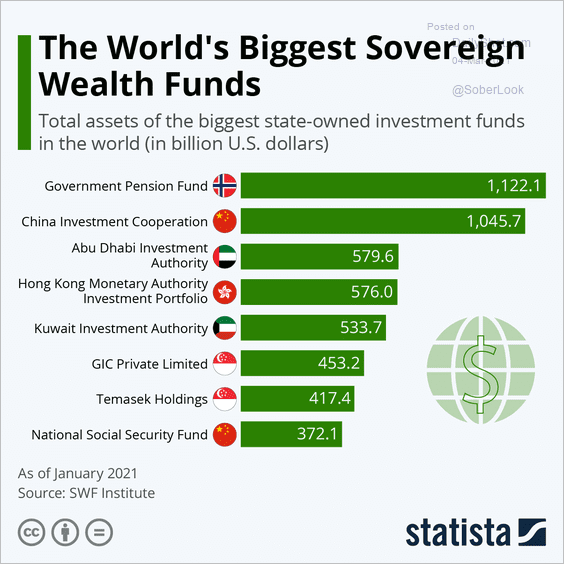 Source: Statista
2. US banknotes (paper money) in circulation:
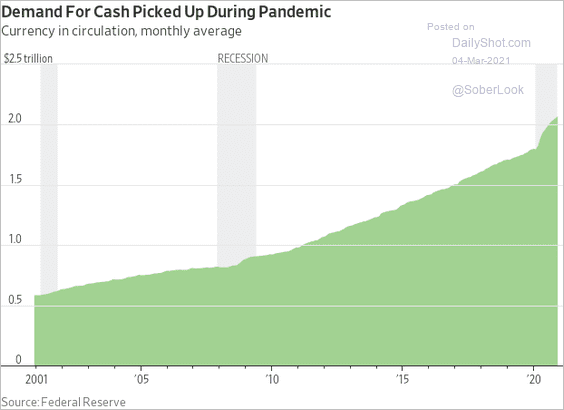 Source: @WSJ Read full article
3. Sales of alcohol:
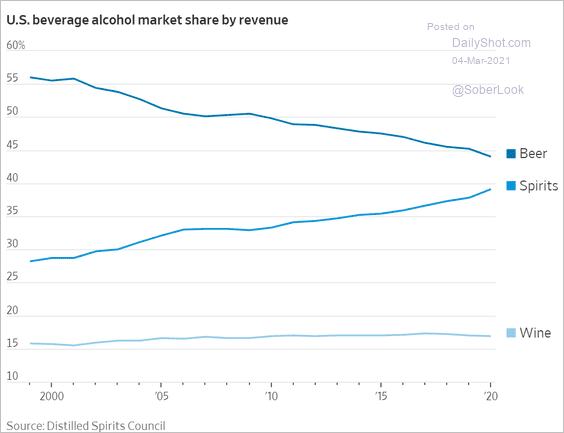 Source: @WSJ Read full article
4. Myanmar arrests and deaths:
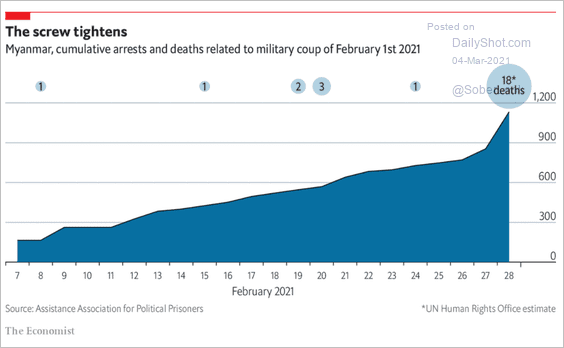 Source: The Economist Read full article
5. Corruption rankings:
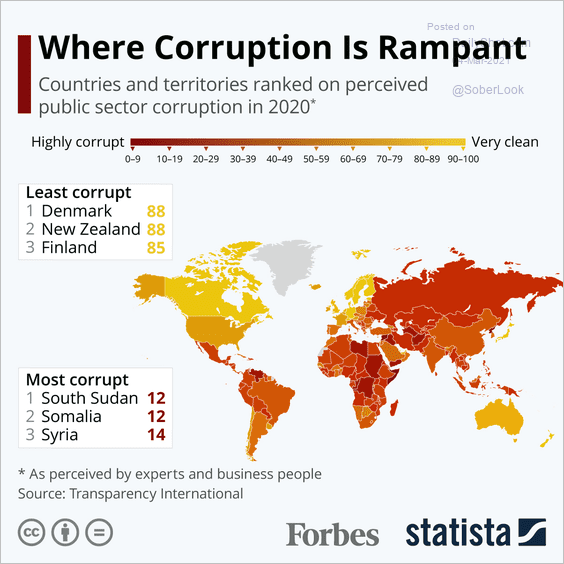 Source: Statista
6. Satisfaction with the way things are going in the US:
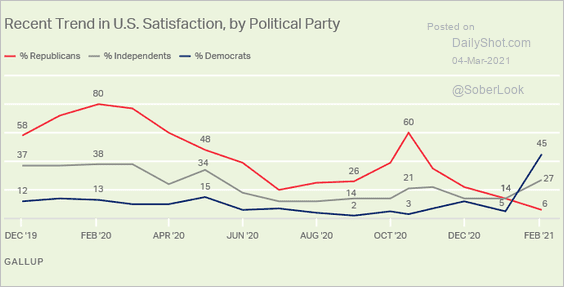 Source: Gallup Read full article
7. Support for the $1.9 trillion stimulus bill:
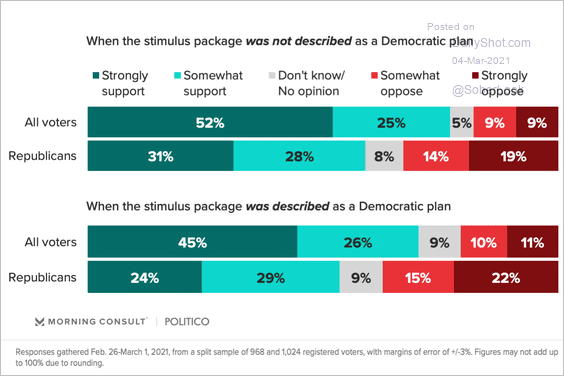 Source: Morning Consult Read full article
8. Changes in US federal agency employment:
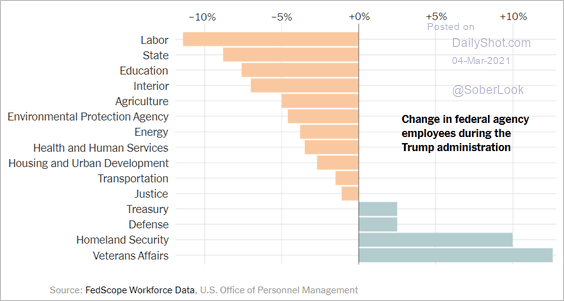 Source: The New York Times Read full article
9. Unexpected medical bills:
 Source: YouGov
10. Different representations of the Union Jack:
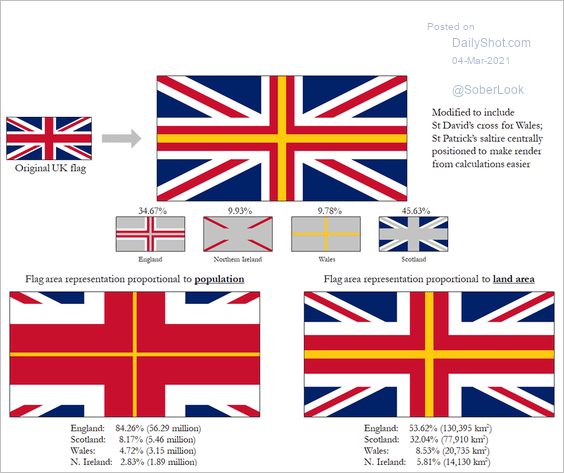 Source: Reddit
——————–
Back to Index