
The Daily Shot: 11-Mar-21
• The United States
• The Eurozone
• Europe
• Asia – Pacific
• China
• Emerging Markets
• Cryptocurrency
• Commodities
• Energy
• Equities
• Rates
• Global Developments
• Food for Thought
The United States
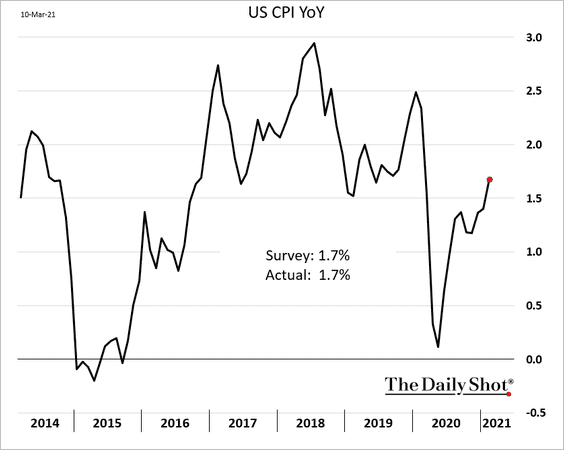
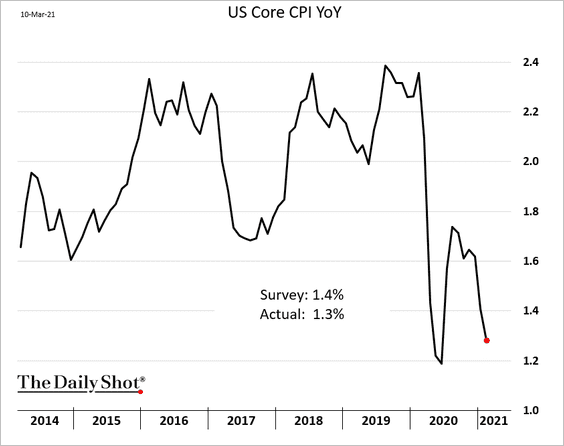
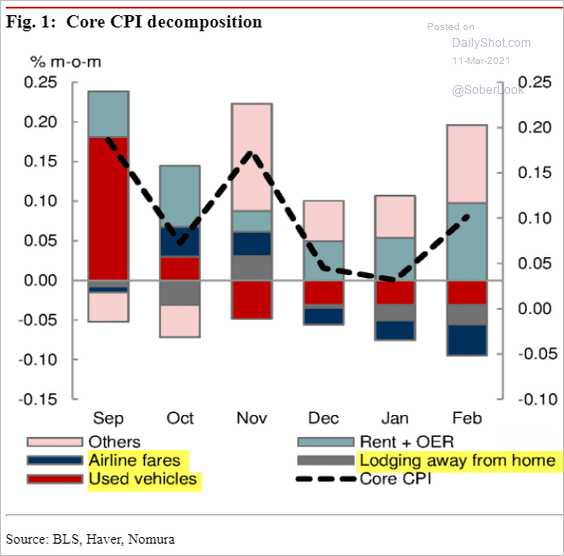
1. The CPI report was a bit softer than expected as the core inflation (2nd chart) continues to drift lower.
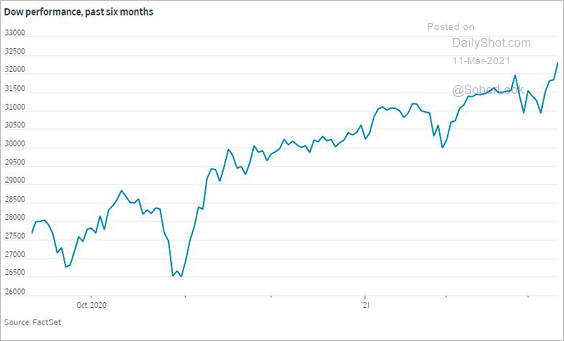
• The Dow hit a new record in response to the tepid inflation data.
 Source: @WSJmarkets Read full article
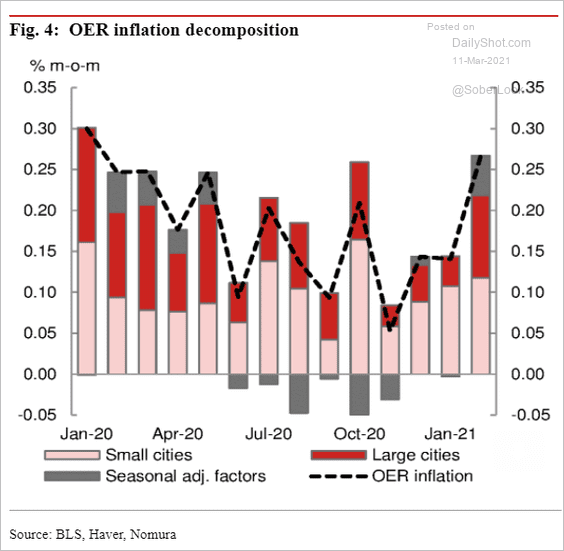
• On a year-over-year basis, rent CPI continues to trend lower, while the owners’ equivalent rent (OER) stabilized last month.
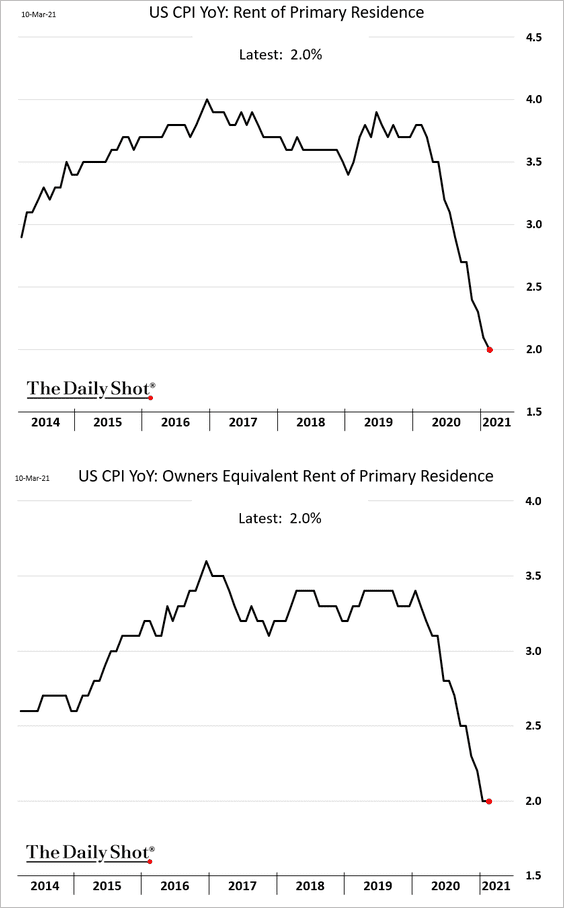
On a monthly basis, however, these measures ticked higher. Here is the OER breakdown.
 Source: Nomura Securities
A substantial portion of the drag on core inflation in February came from three sectors: airline fares, used cars, and hotels.
 Source: Nomura Securities
Here are the three trends.
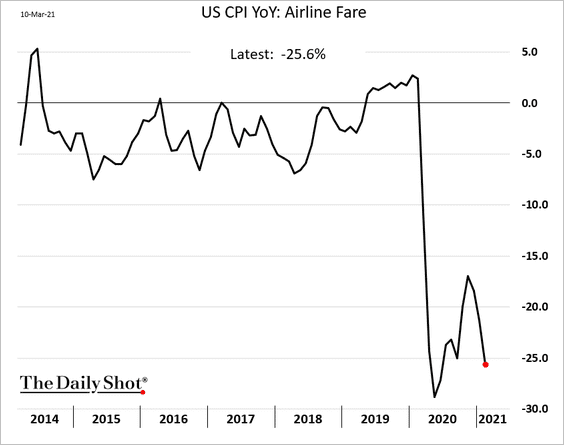
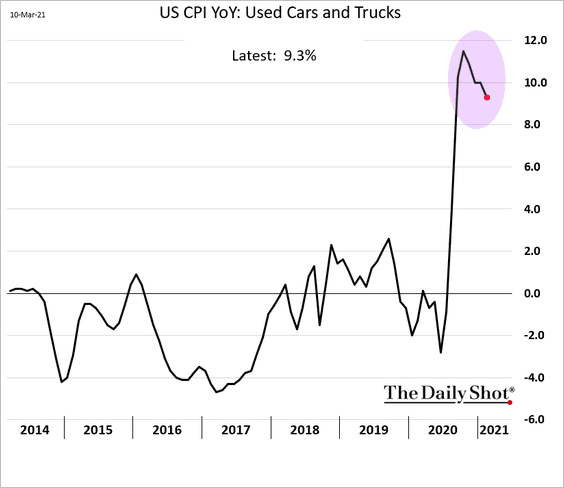
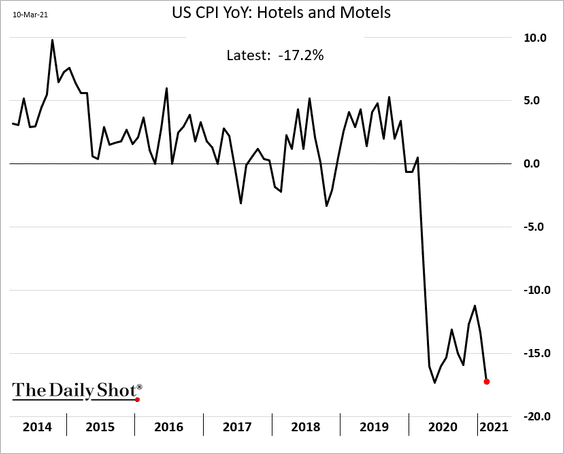
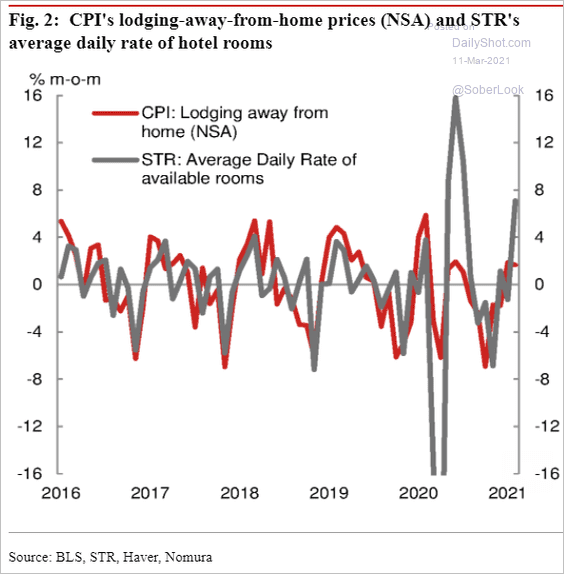
But as we saw yesterday (#2 here), these trends are reversing.
– Hotels:
 Source: Nomura Securities
– Used cars:
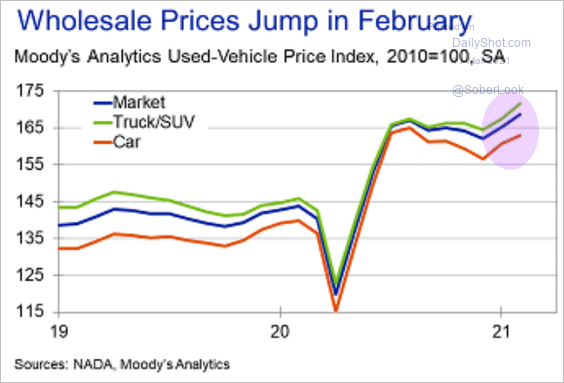 Source: Moody’s Analytics
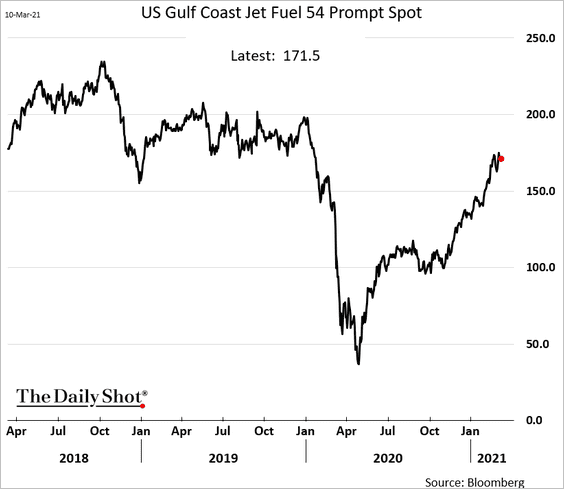
– Higher jet fuel costs will force airlines to boost prices this spring.
• Here are some inflation forecasts.
– ING:
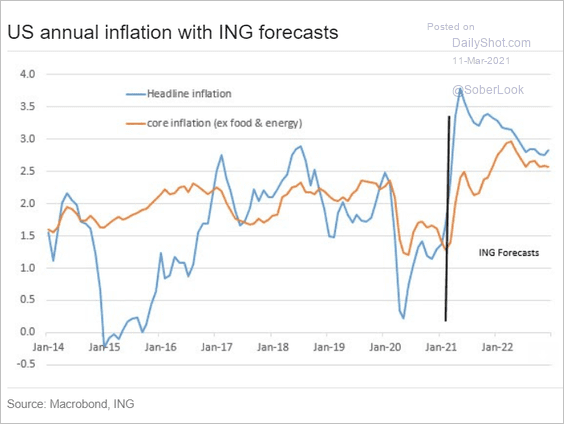 Source: ING
– Oxford Economics:
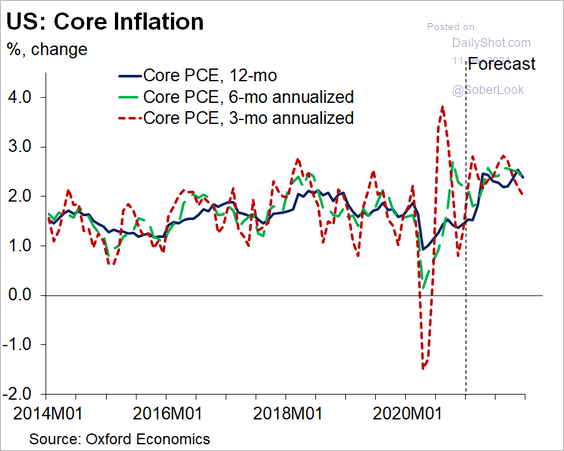 Source: @GregDaco
– Morgan Stanley (core PCE):
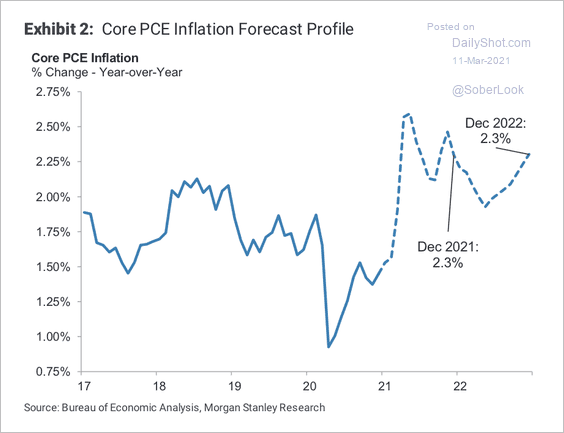 Source: Morgan Stanley Research
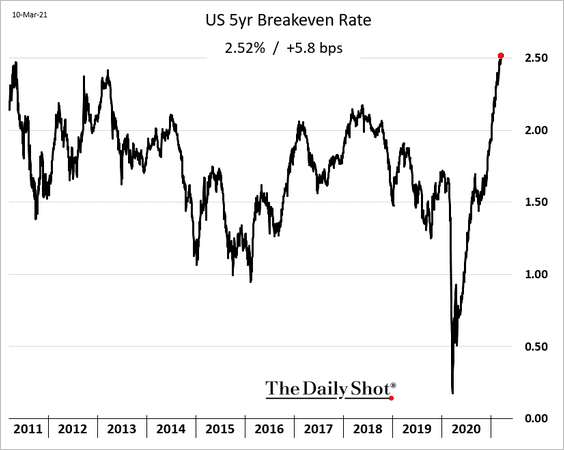
The five-year breakeven rate (market-based inflation expectations) keeps climbing.
• The public’s interest in inflation has spiked this year. Here is inflation-related Google search activity since 2004.
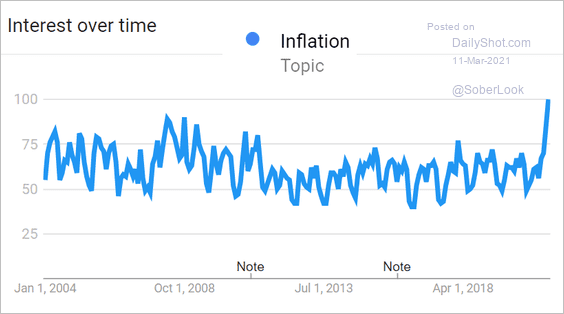 Source: Google Trends
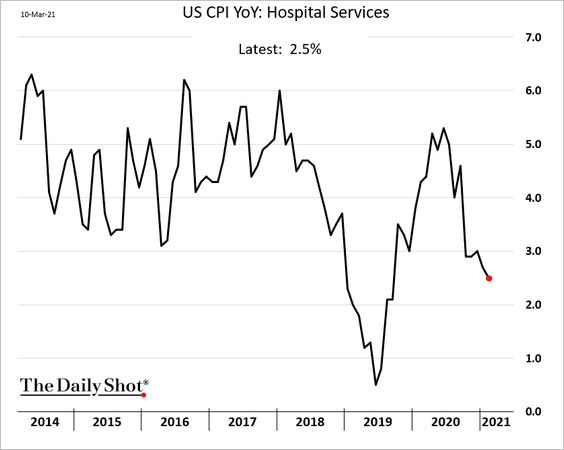
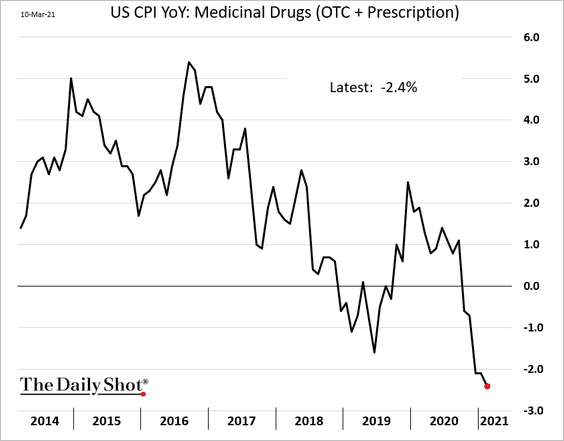
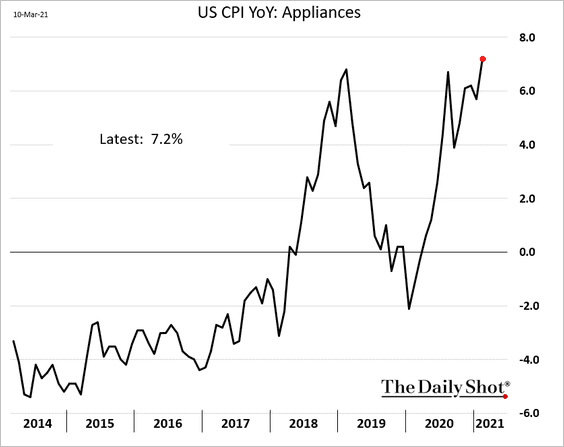
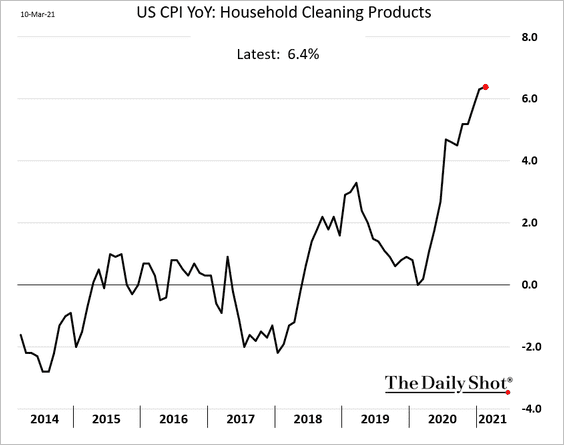
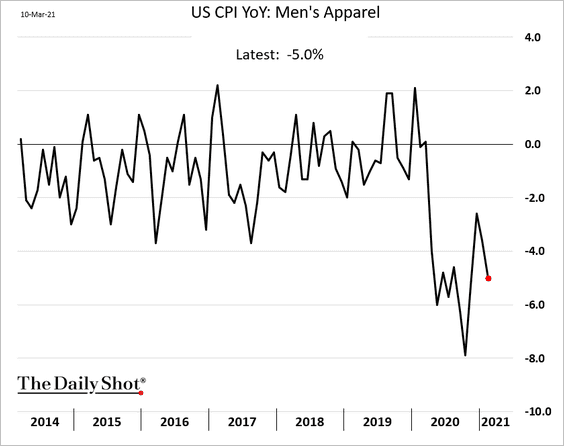
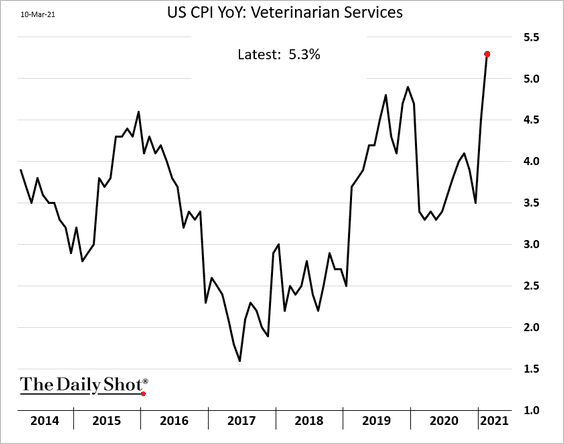
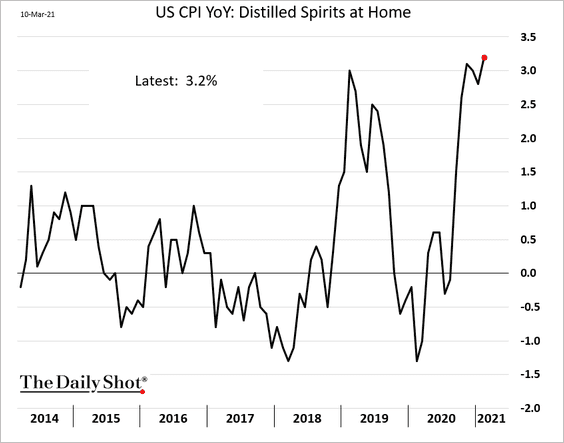
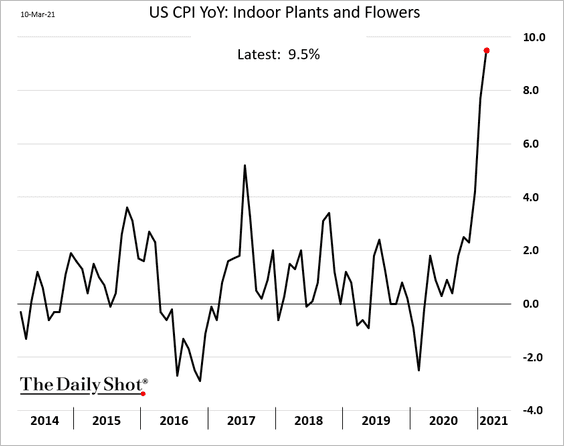
• Staying with our tradition, here are a few other CPI components. Most of the latest trends are due to pandemic-related sector changes and spending patterns.
– Hospital services and medications:
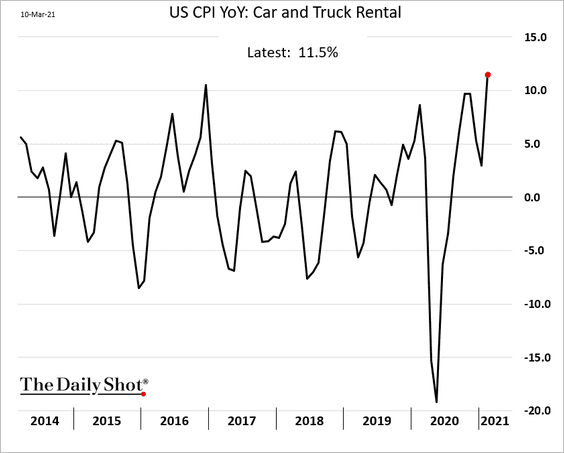
– Car rentals:
– Appliances:
– Cleaning products:
– Men’s apparel:
– Veterinary services:
– Booze:
– Indoor plants:
– Haircuts (a leading indicator for inflation?):
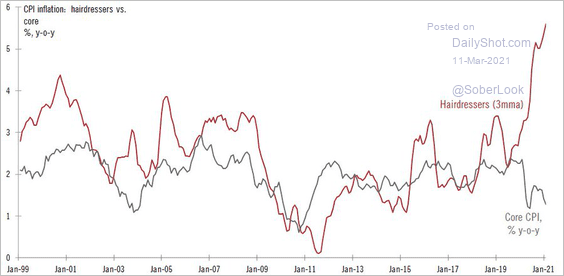 Source: @TCosterg
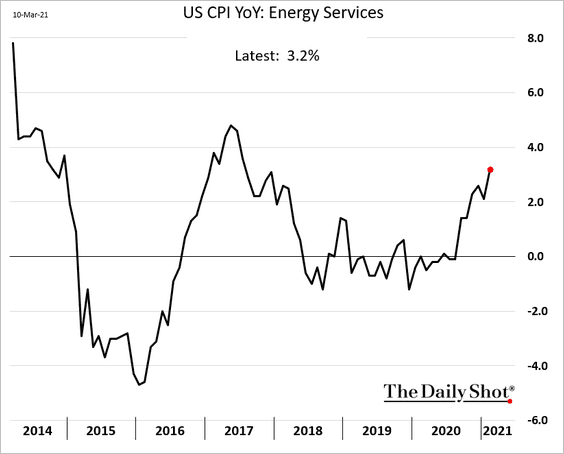
– Energy services popped due to the Texas deep freeze.
——————–
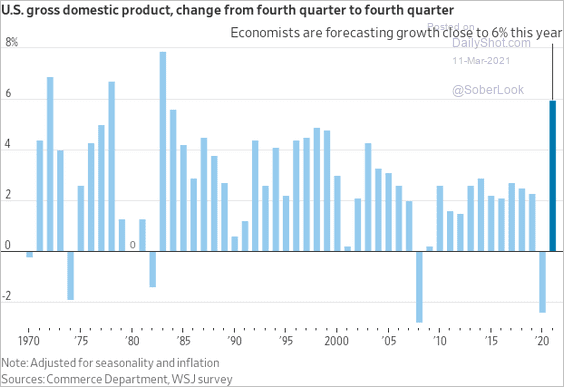
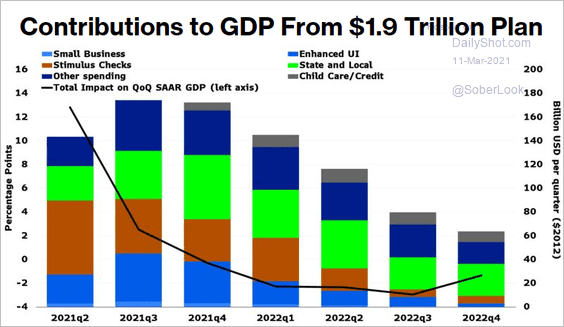
2. Government stimulus is expected to generate the fastest annual growth in nearly four decades.
 Source: @WSJ Read full article
 Source: @bpolitics Read full article
Almost all new government payments are now boosting incomes (as wage loss slows).
![]() Source: Morgan Stanley Research
Source: Morgan Stanley Research
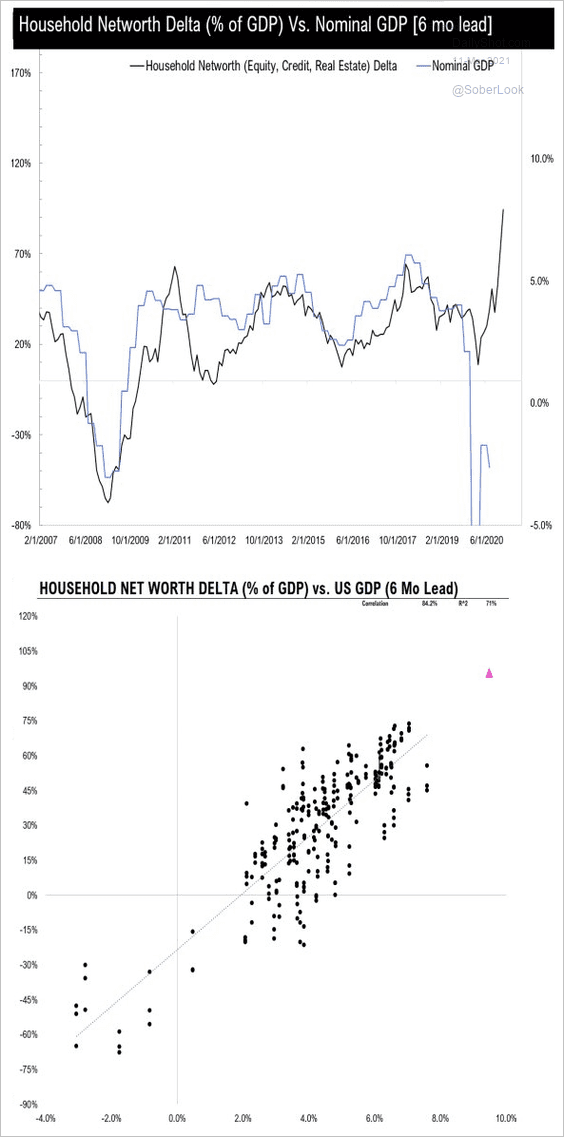
Savings have risen sharply. Houses and stocks have seen massive price gains. Can the ongoing increase in household wealth catapult the GDP to double-digit growth this year? What are the implications for inflation and bond yields? Here is a chart from Pervalle Global.
 Source: @TeddyVallee
——————–
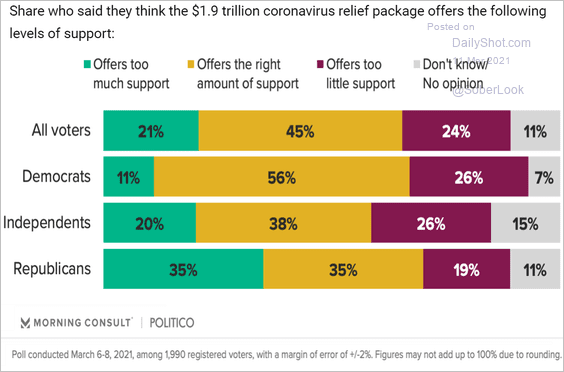
3. Overall, Americans don’t think that the $1.9 trillion package is too much stimulus.
 Source: Morning Consult Read full article
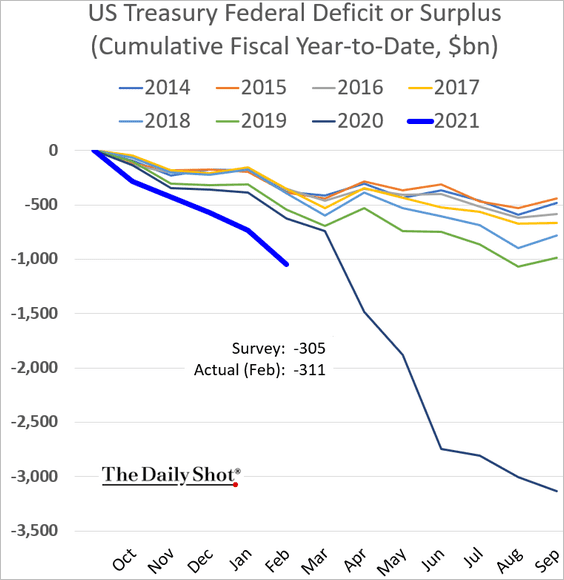
4. The budget deficit continues to widen. We will have more on the topic shortly.
Back to Index
The Eurozone
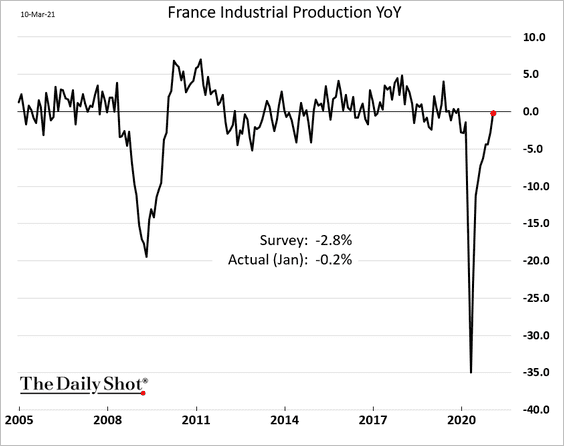
1. French industrial production topped economists’ forecasts.
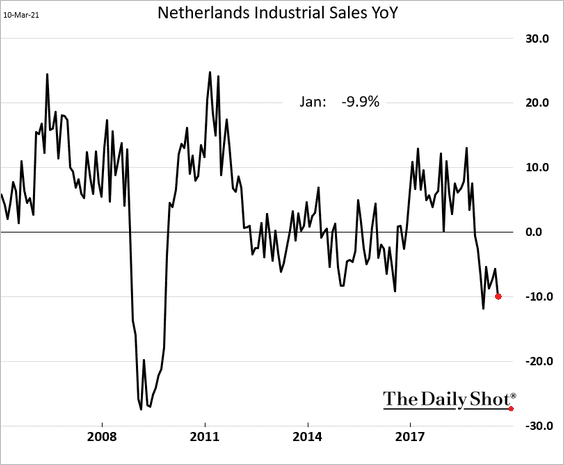
2. Dutch industrial sales are still down 10% from a year ago.
3. Italy’s demographic trends continue to worsen.
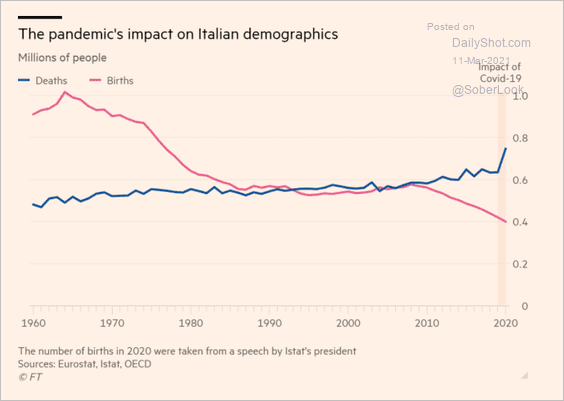 Source: @financialtimes Read full article
Back to Index
Europe
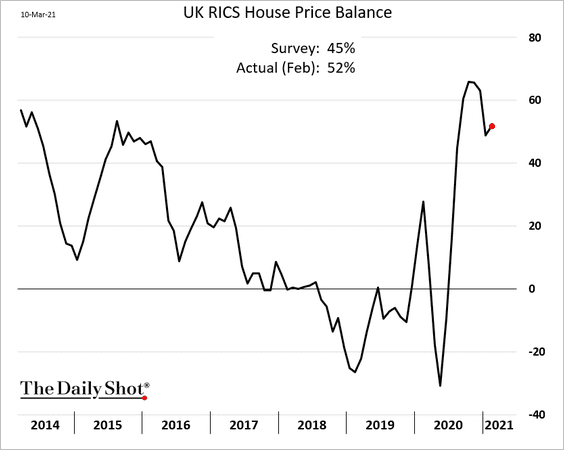
1. The UK’s housing market is holding up well.
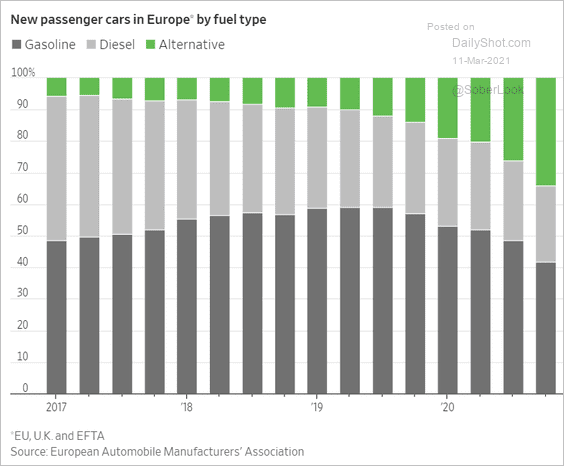
2. Here is the distribution of new car sales in Europe (by fuel type).
 Source: @WSJ Read full article
Back to Index
Asia – Pacific
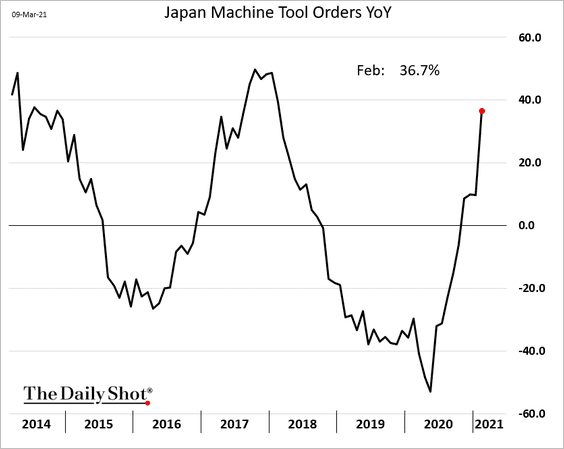
1. Japan’s machine tool orders have accelerated.
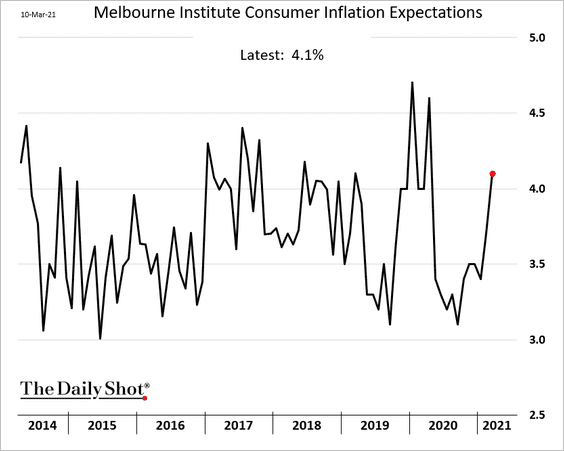
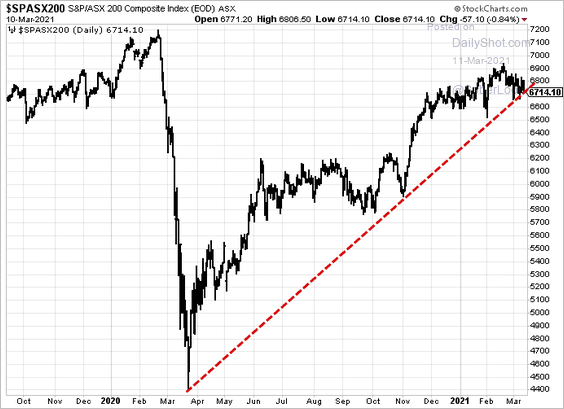
2. Consumer inflation expectations in Australia are rebounding.
Separately, Australia’s benchmark stock index is at support.
 h/t @ThuyOng
——————–
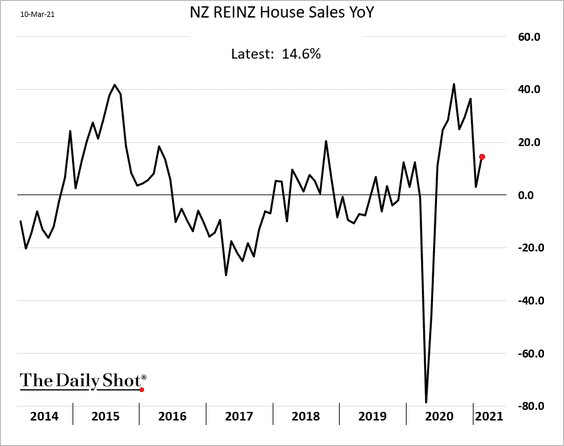
3. New Zealand’s housing market remains hot.
• Sales:
• Prices:
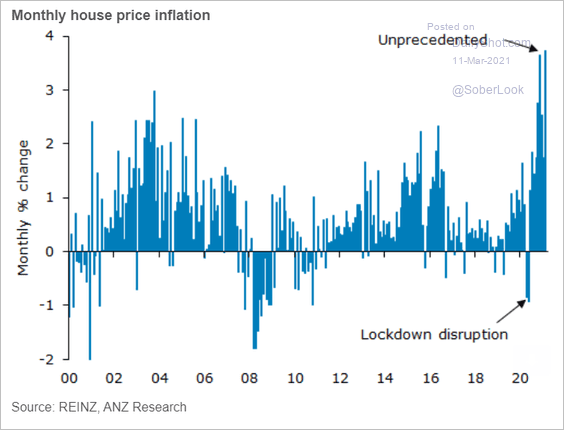 Source: ANZ Research
Back to Index
China
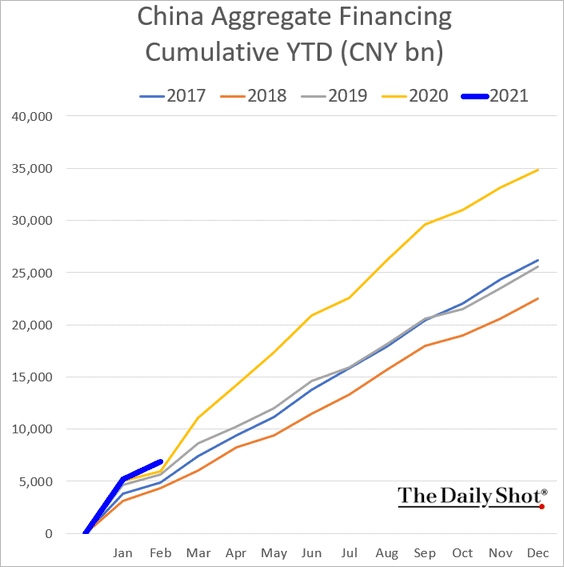
1. Last month’s credit expansion topped forecasts. Here is the year-to-date bank loan growth.
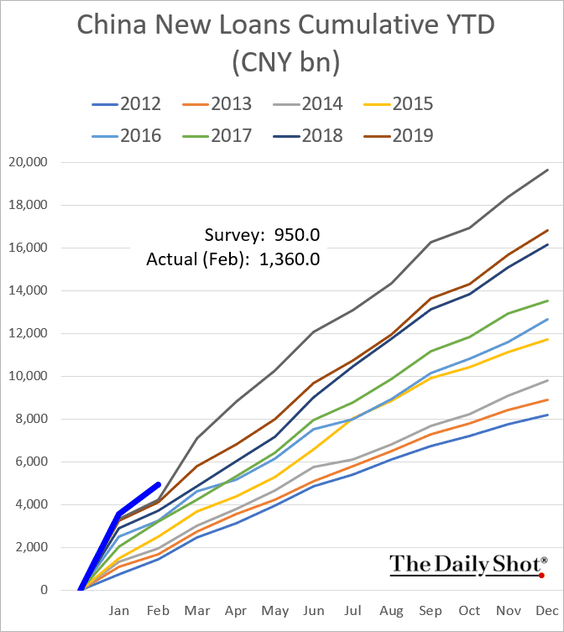
This chart shows the “aggregate” financing, which includes bonds.
——————–
2. Will we see a spike in CapEx this year?
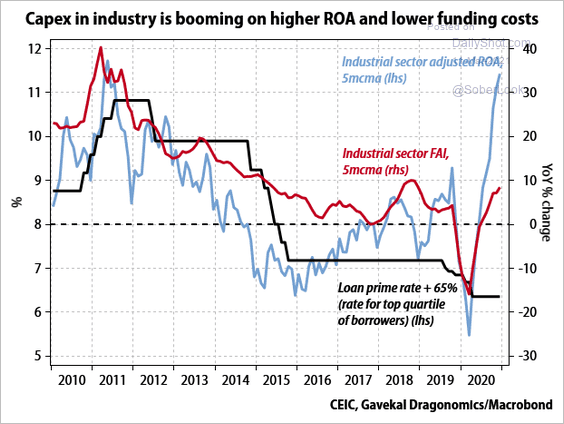 Source: Gavekal Research
3. Here are the urbanization and industrialization trends for China.
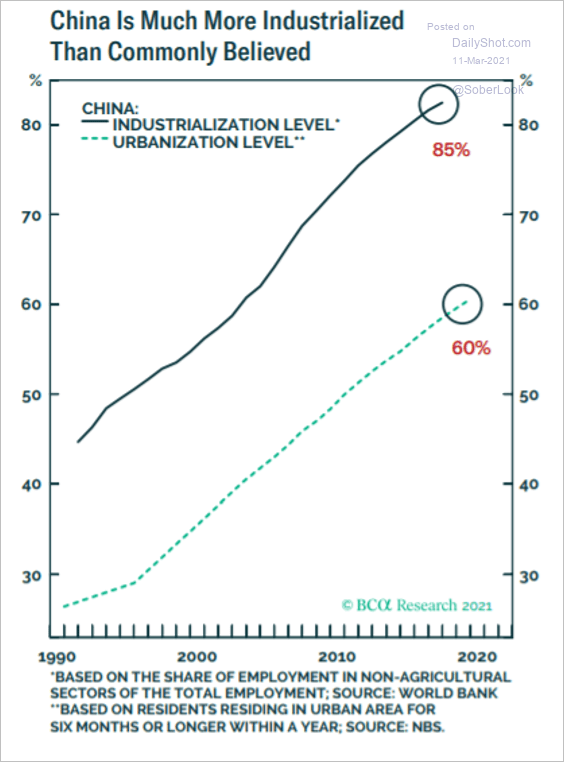 Source: BCA Research
4. Mainland investors have been pulling out of Hong Kong stocks.
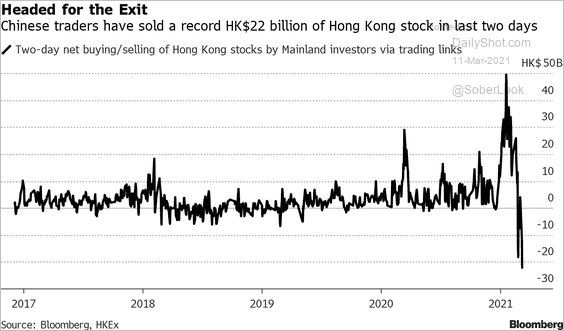 Source: @JeannyYu, @TheTerminal
Back to Index
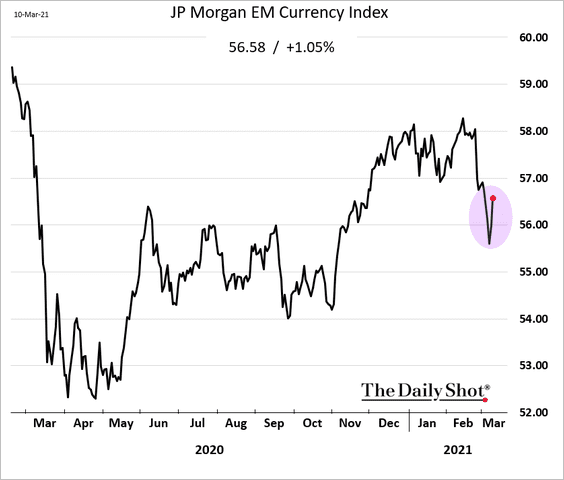
Emerging Markets
1. EM currencies bounced on improved risk appetite.
The Brazilian real was up over 2%.
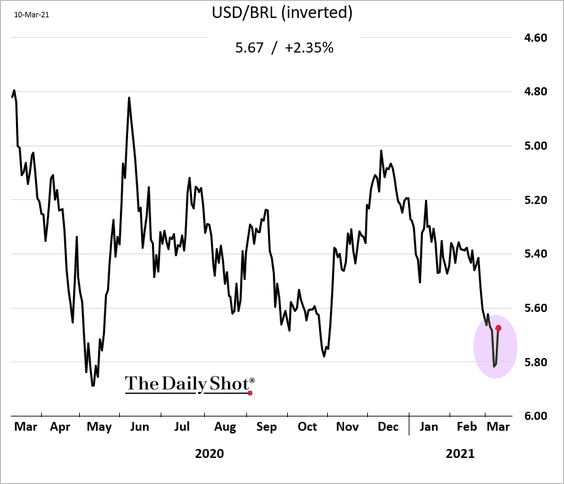
——————–
2. Brazil is struggling to contain the pandemic.
 Source: @axios Read full article
• New cases:
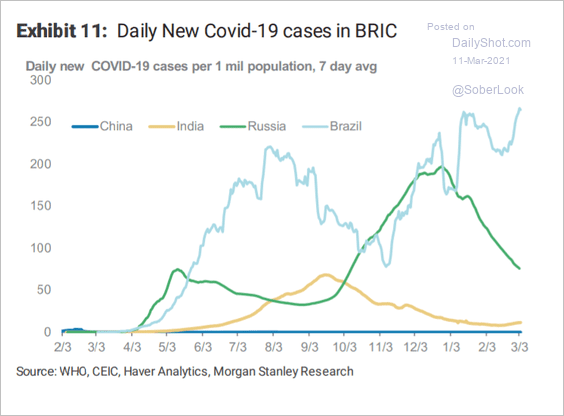 Source: Morgan Stanley Research
• Deaths:
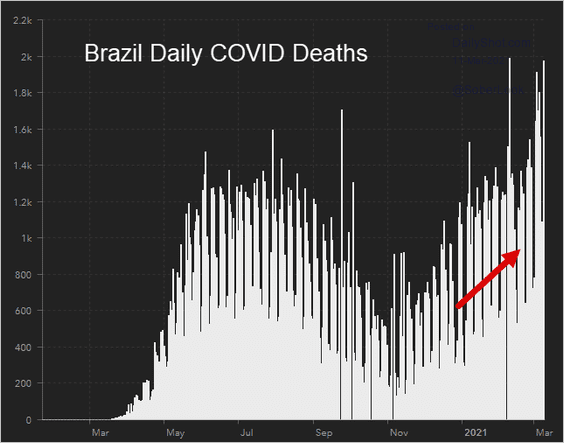 Source: Johns Hopkins University & Medicine
——————–
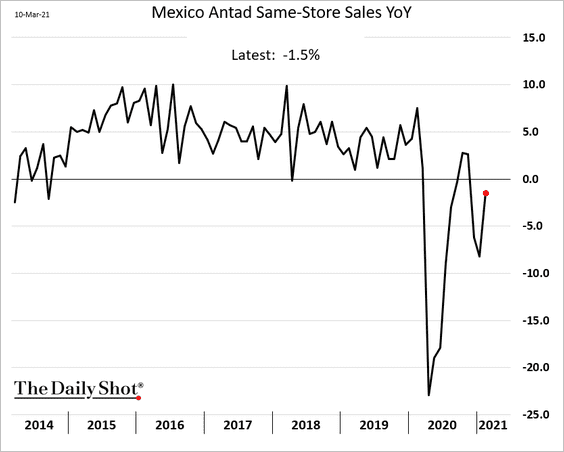
3. Mexico’s same-store sales rebounded last month.
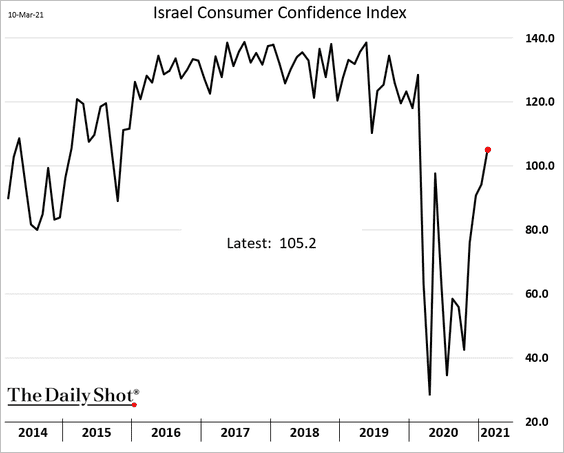
4. Israel’s consumer confidence is recovering in response to the vaccination success.
Back to Index
Cryptocurrency
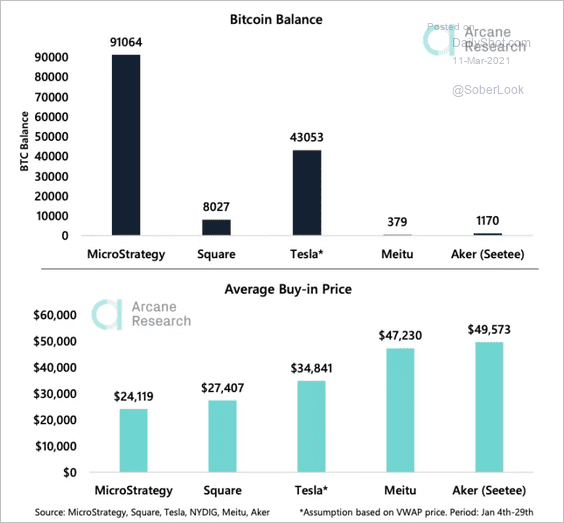
1. This chart shows corporate treasury Bitcoin balances and average buy-in prices. The corporate Bitcoin buying trend has spread from the US to Hong Kong and Scandinavia.
 Source: Arcane Crypto Read full article
 Source: @axios Read full article
——————–
2. Bitcoin has strong support from the $48,000 level, which coincided with unusually large withdrawals from Coinbase Pro wallets (movement from wallet to storage could signal intention to hold instead of trade).
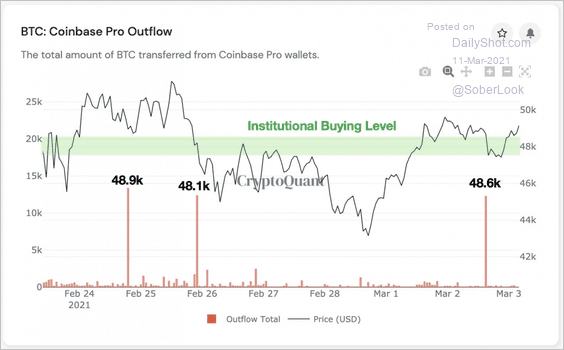 Source: CryptoQuant Read full article
Bitcoin is holding support, but the uptrend from January is slowing as seen by the RSI divergence.
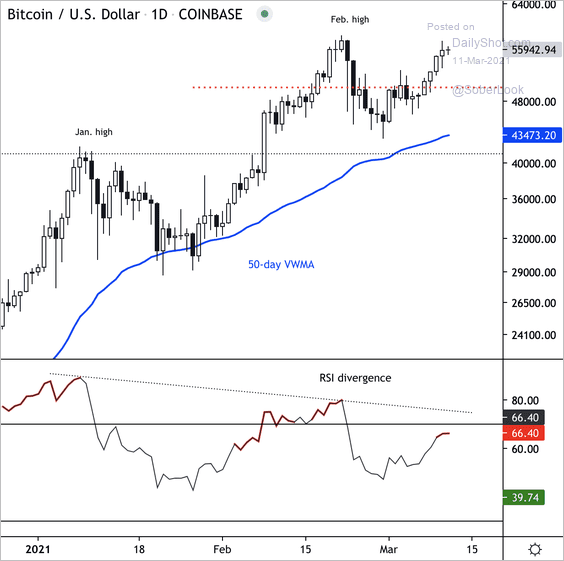 Source: Dantes Outlook
——————–
3. Bitcoin is now more volatile than ether, based on the 1-month realized vol spread.
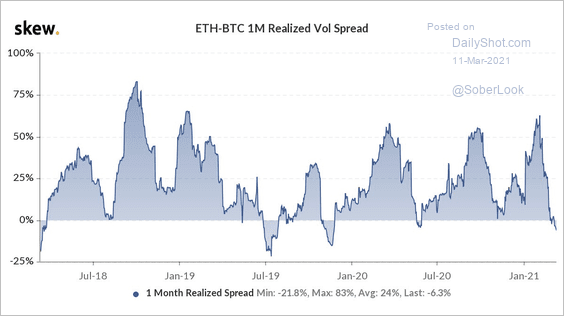 Source: @skewdotcom
Back to Index
Commodities
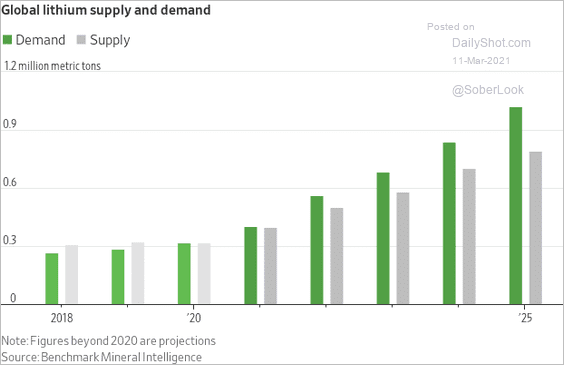
1. Lithium prices are rebounding as the market tightens (2nd chart).
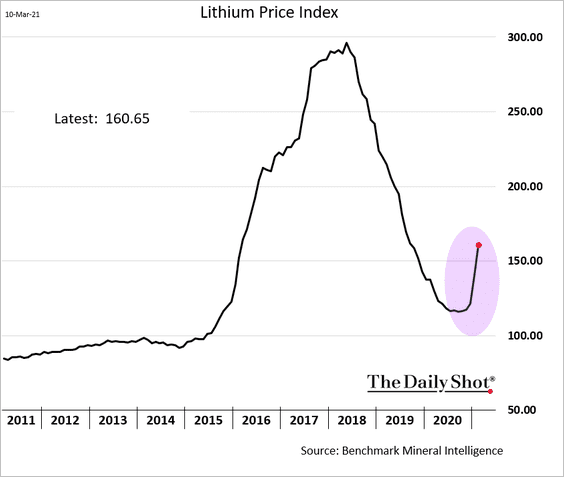
 Source: @WSJ Read full article
——————–
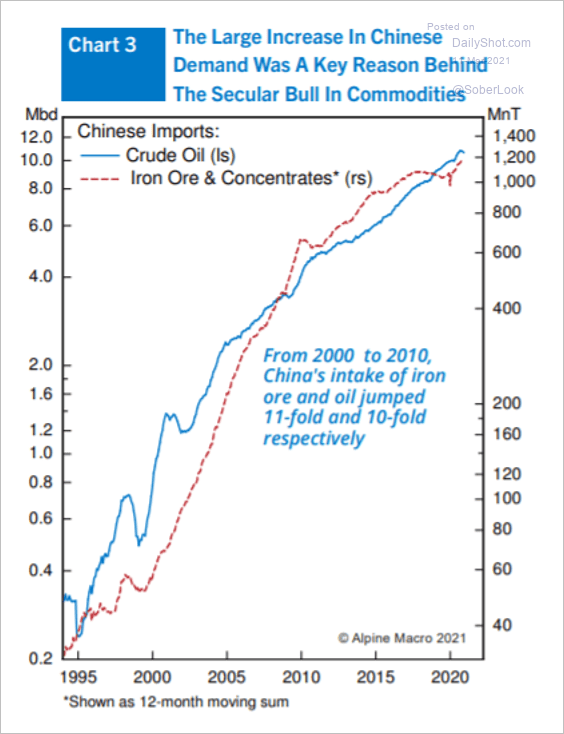
2. This chart shows China’s imports of crude oil and iron ore.
 Source: Alpine Macro
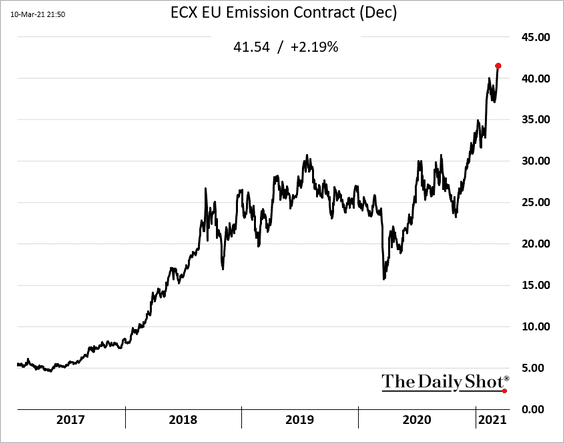
3. European emissions futures are rallying amid stronger environmental regulations in the EU.
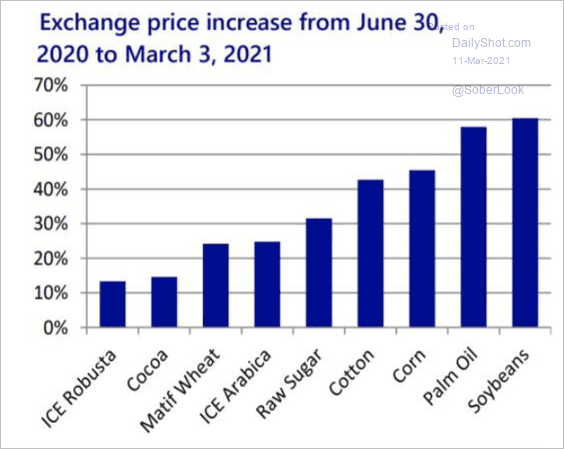
4. The S&P GSCI Agriculture Index soared to the highest level since 2014.
 Source: Rabobank
Most of the rise in agriculture performance over the past year has been driven by soybeans, palm oil, and corn, …
 Source: Rabobank
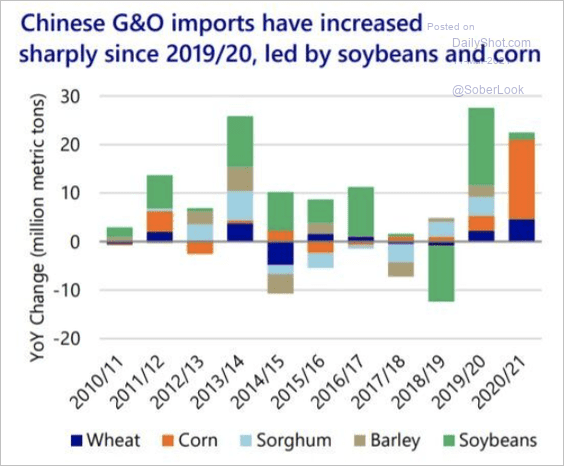
… boosted by strong Chinese demand.
 Source: Rabobank
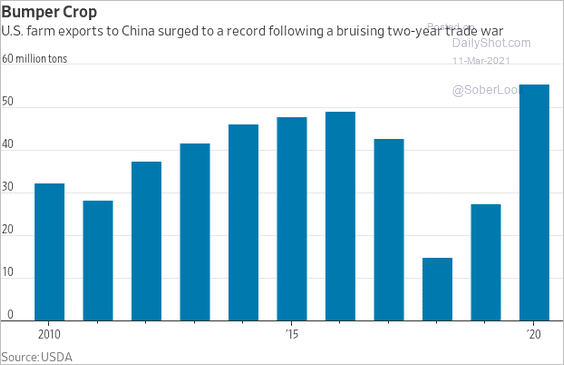
• That demand sent US farm exports to China to a new record.
 Source: @WSJ Read full article
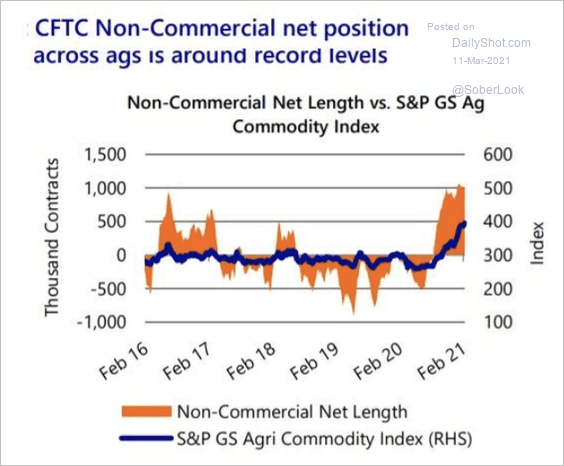
• Speculative long positioning in agriculture futures appears stretched.
 Source: Rabobank
——————–
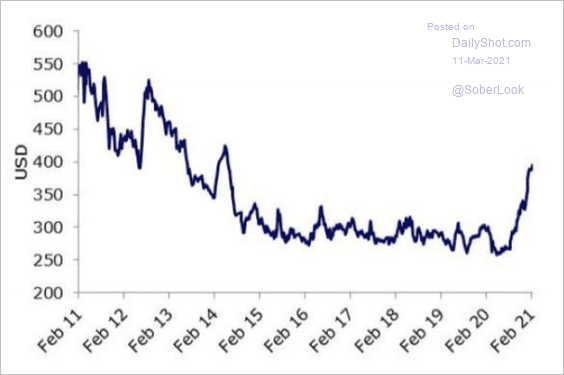
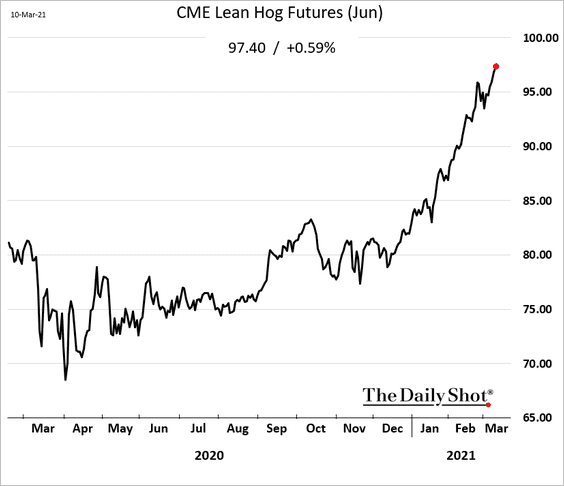
5. Related to the trends above, US hog futures continue to climb.
Back to Index
Energy
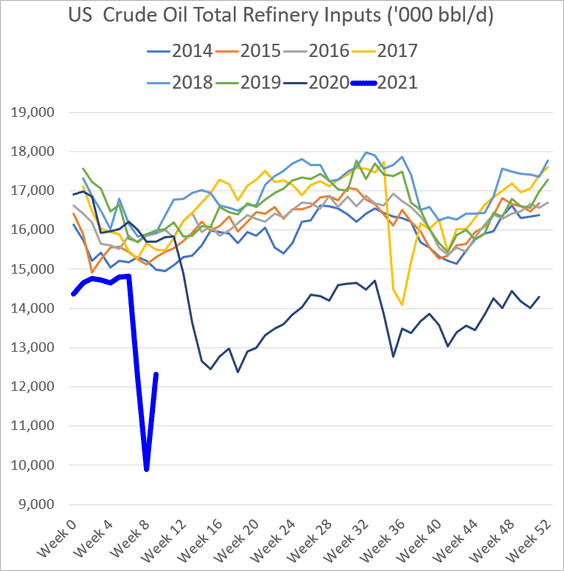
1. The Texas “deep freeze” impact is still visible in the US energy markets. Refinery inputs have not yet recovered.
Crede oil inventories are still elevated.
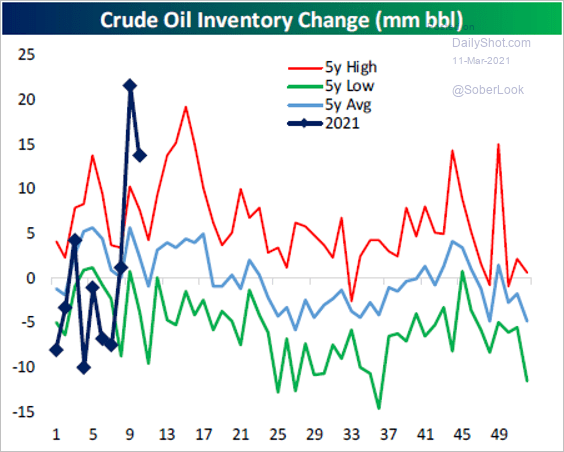 Source: @bespokeinvest Read full article
——————–
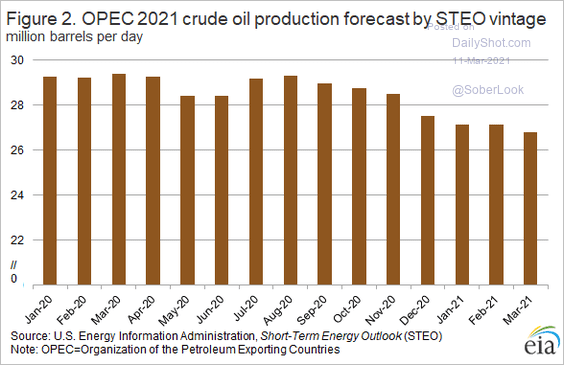
2. US crude oil production is back to 11 million barrels per day.
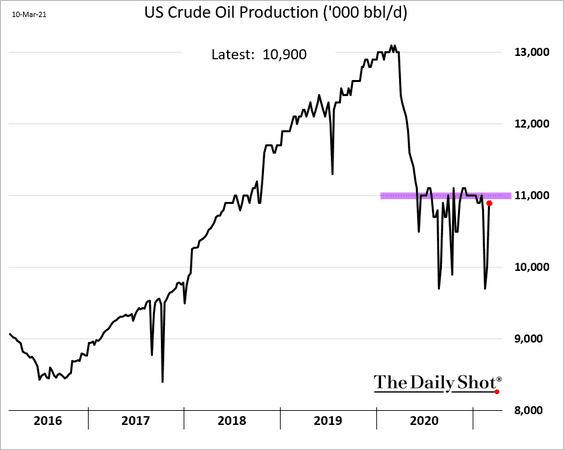
Will we see US output rise further as OPEC holds back and prices keep rising?
 Source: @EIAgov
——————–
3. Will weak refinery margins cap crude oil price gains?
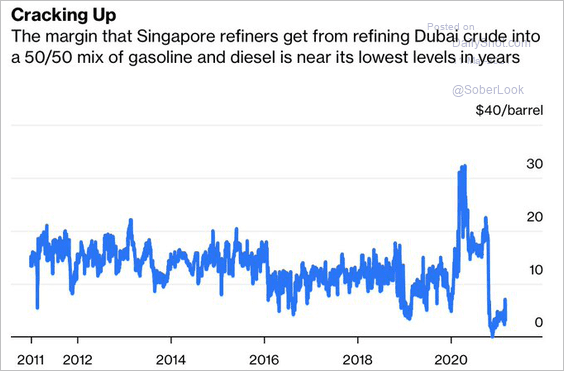 Source: @aeberman12 Read full article
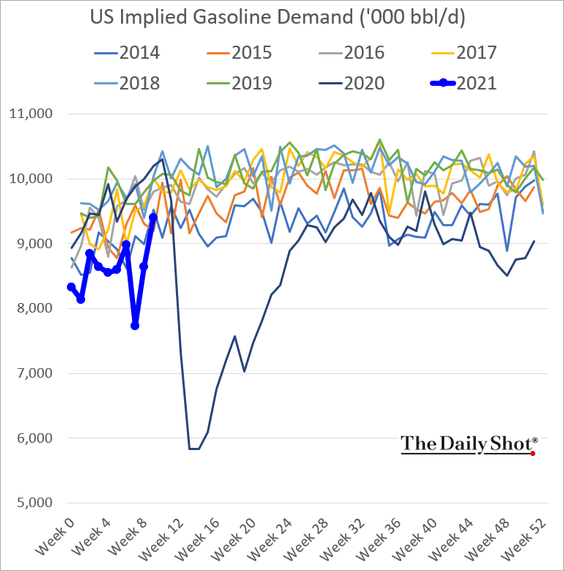
4. US gasoline demand has rebounded.
5. This chart shows US natural gas exports.
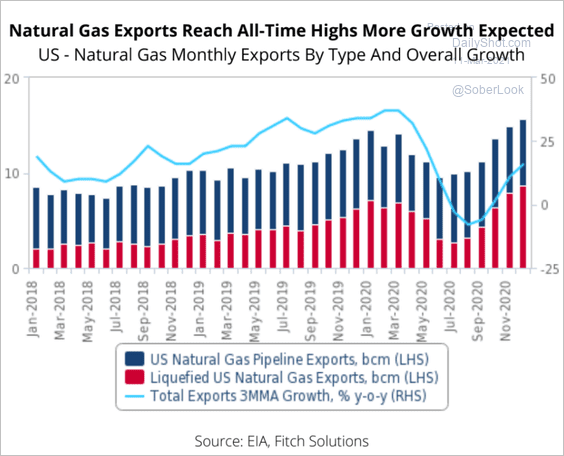 Source: Fitch Solutions Macro Research
Back to Index
Equities
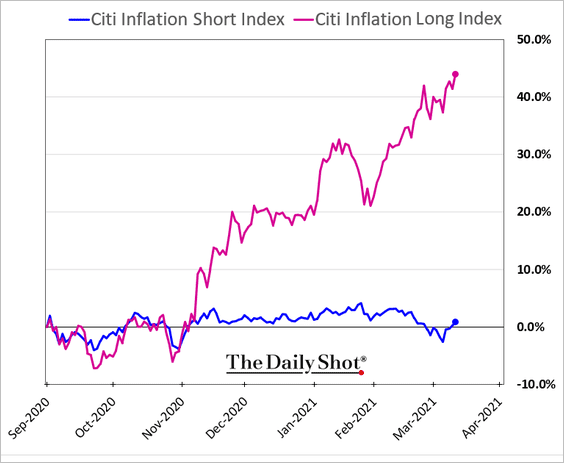
1. The market is increasingly pricing in higher inflation ahead. Stocks sensitive to rising prices have outperformed sharply since the vaccine announcement.
2. It’s been a good month for value stocks.
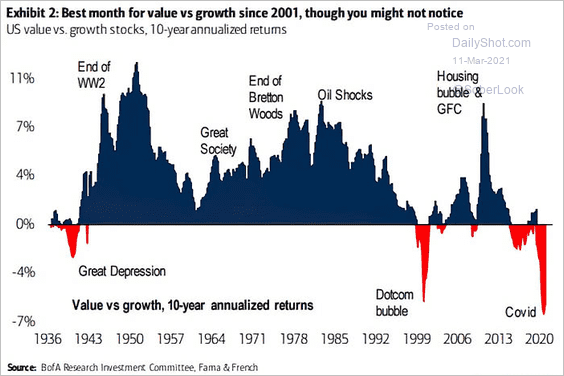 Source: @ISABELNET_SA, @BofAML
3. Retail investor sentiment is extremely bullish.
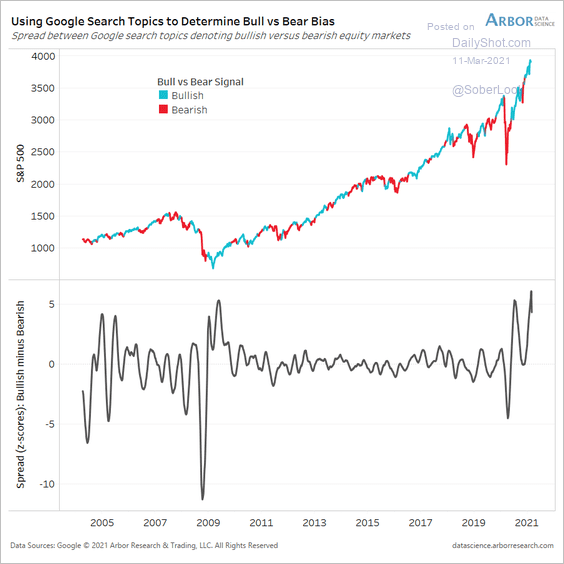 Source: Arbor Research & Trading
And retail investors have been right.
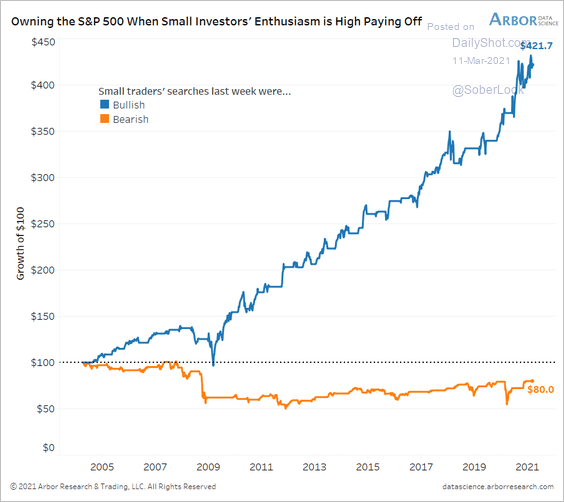 Source: Arbor Research & Trading
Back to Index
Rates
1. Long-term inflation expectations have increased by only 40 basis points since August when the breakeven yield curve inverted. The market is expecting a temporary boost to inflation. By the way, some have suggested that the curve inversion is driven by a steeper backwardation in the crude oil curve.
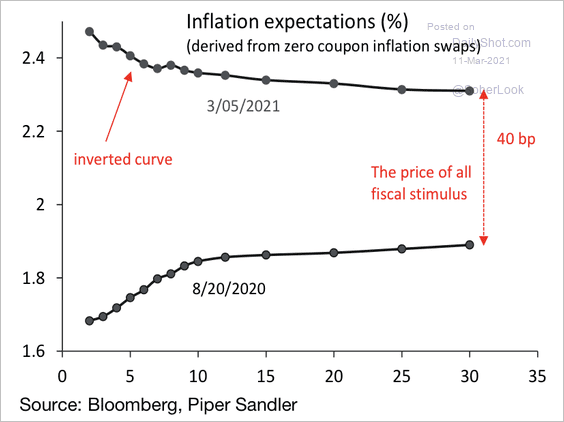 Source: Piper Sandler
——————–
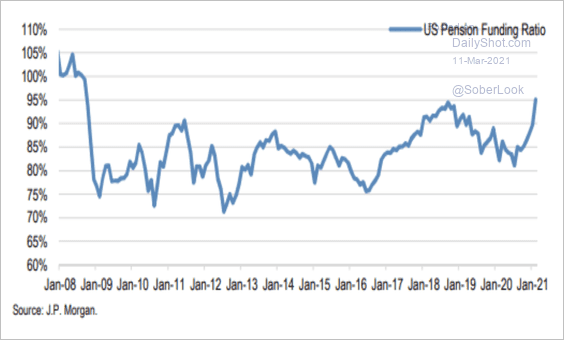
2. The rise in bond yields (and higher equity prices) has led to an increase in the US pension funding ratio (around 95%), according to III Capital Management.
 Source: III Capital Management
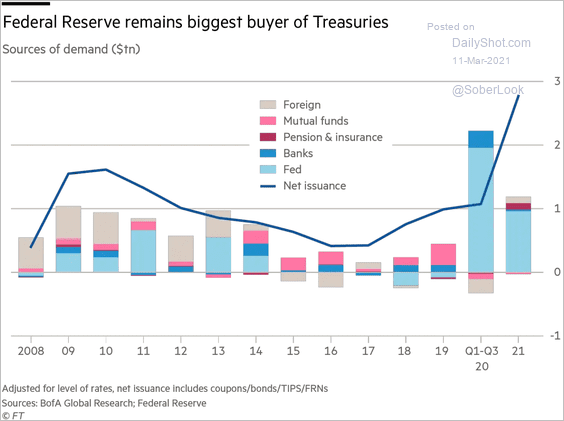
3. The Fed remains the biggest buyer of Treasuries.
 Source: @financialtimes Read full article
4. Trades betting on higher rates and a steeper yield curve appear crowded.
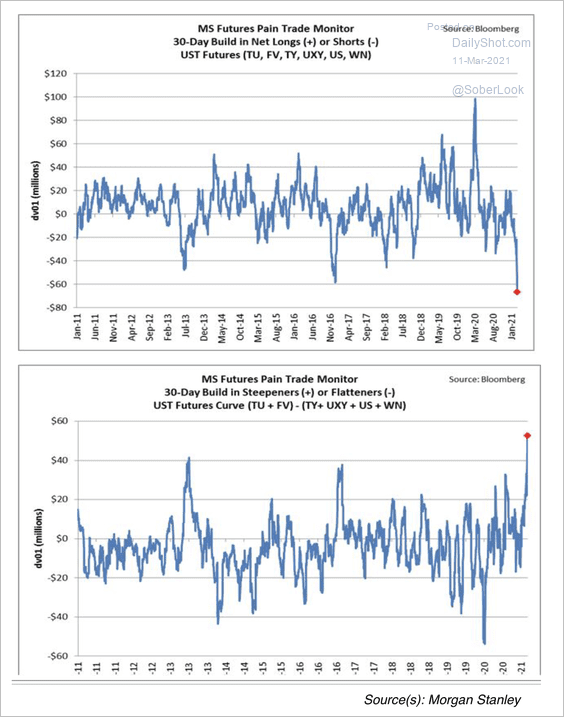 Source: III Capital Management
5. This chart shows Treasury debt auction sizes.
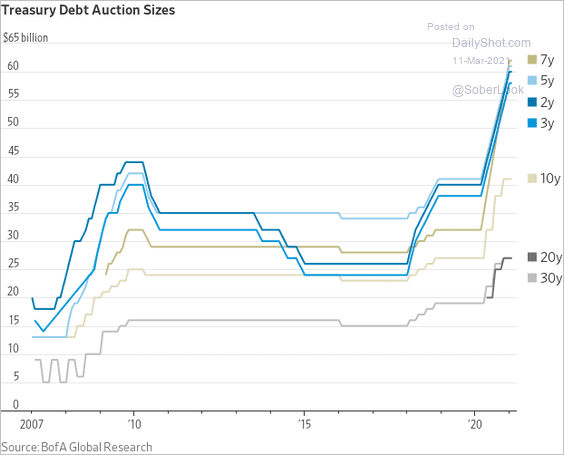 Source: @WSJ Read full article
6. Yields have risen globally.
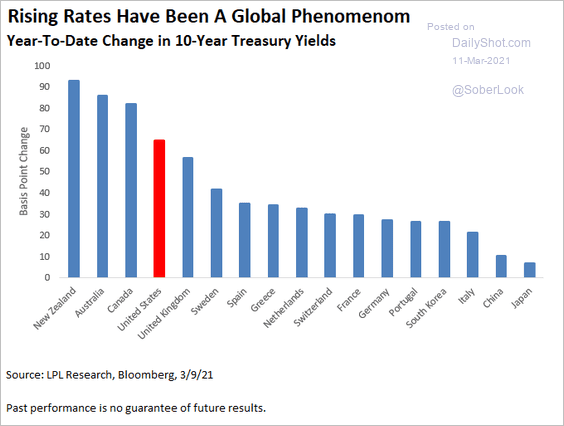 Source: LPL Research
7. Finally, we have the fed funds rate vs. market expectations.
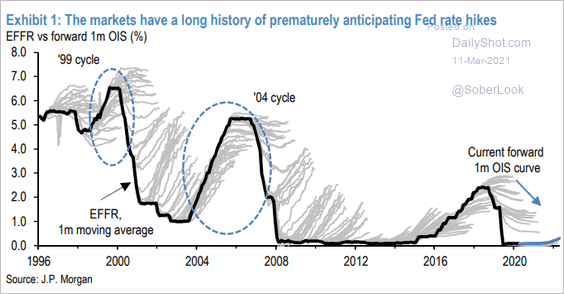 Source: JP Morgan; @tracyalloway
Back to Index
Global Developments
1. Household savings have surged during the pandemic.
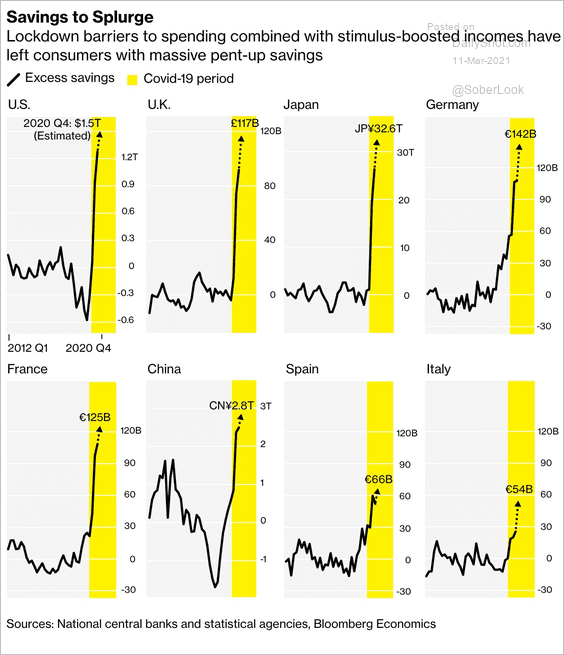 Source: @BBGVisualData Read full article
2. The dollar is testing resistance at its 200-day moving average.
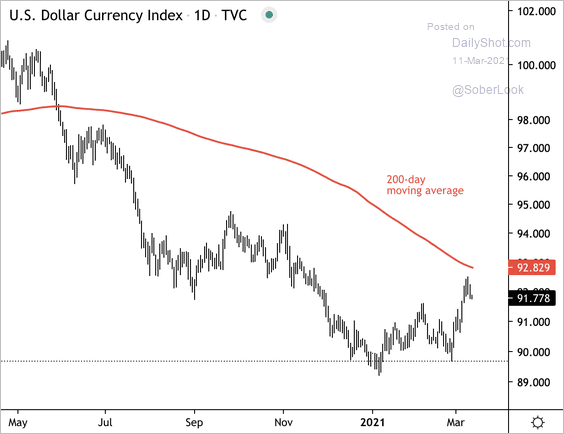 Source: Dantes Outlook
3. Have freight costs peaked?
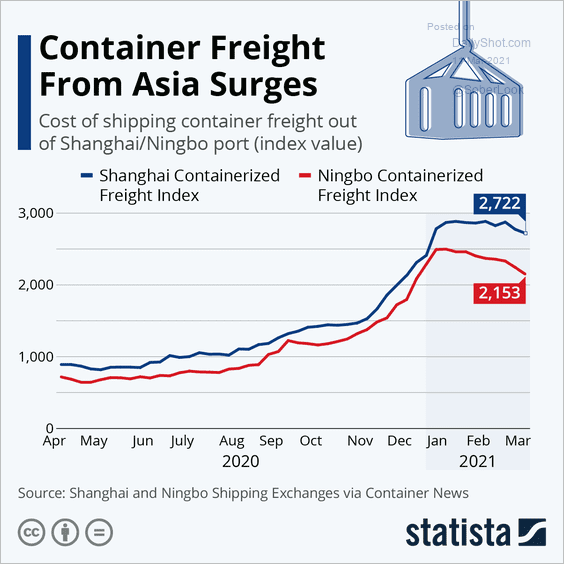 Source: Statista
4. Here is a look at market phases since the March 2020 crash, according to BofA.
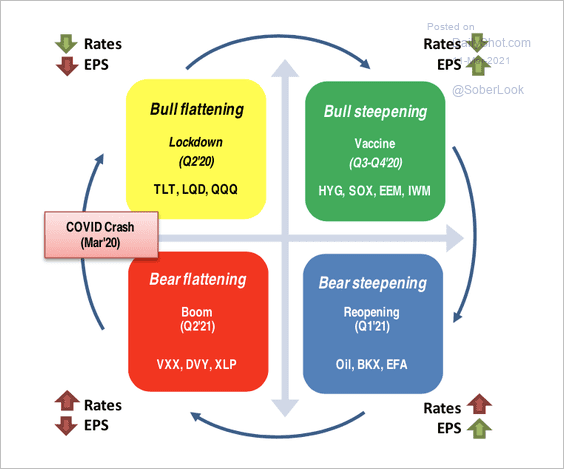 Source: BofA Global Research
5. This chart shows the contributions to global growth.
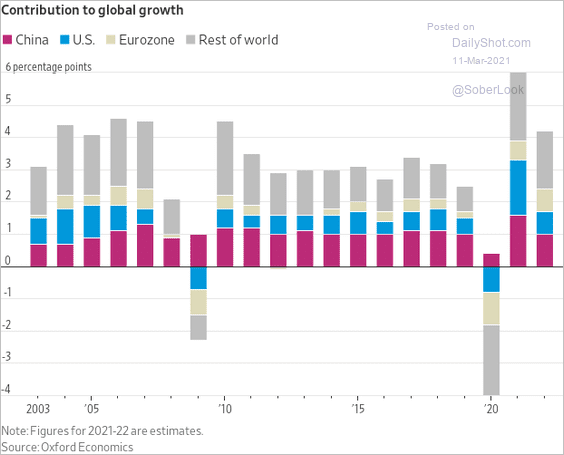 Source: @WSJ Read full article
——————–
Food for Thought
1. Spending intentions for the third stimulus check:
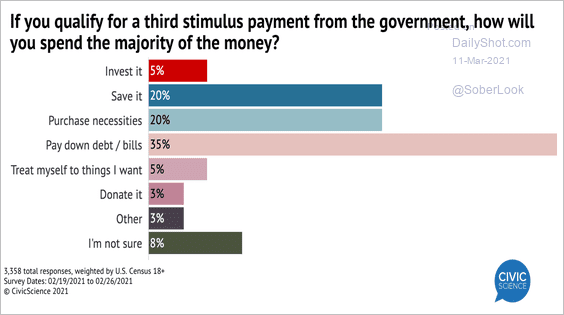 Source: CivicScienc Read full article
Renters with financial hardships:
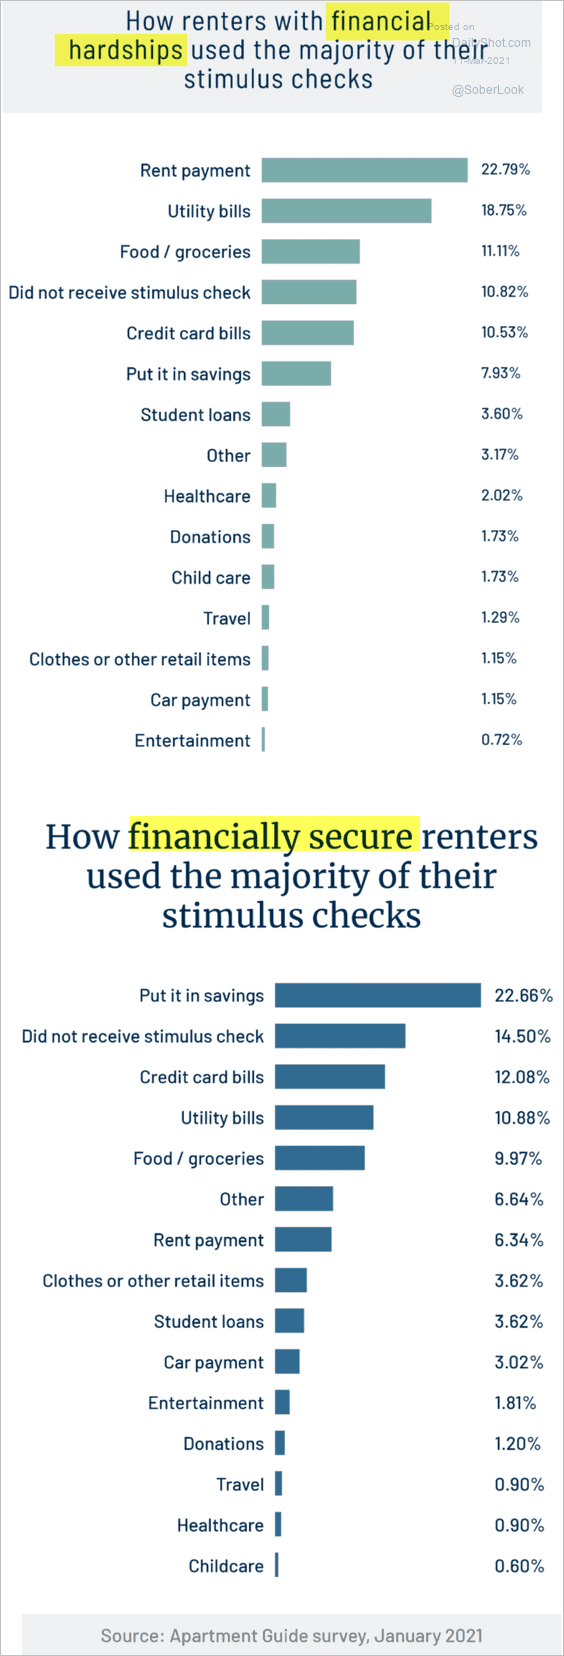 Source: Apartment Guide
——————–
2. US deposit trends by gender:
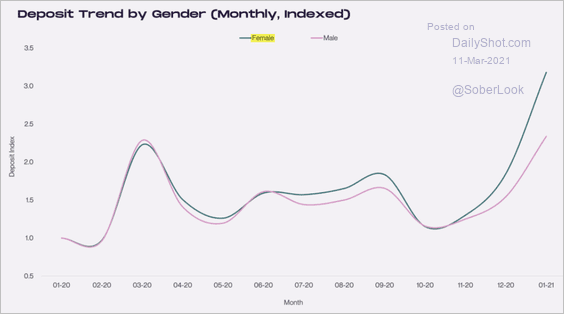 Source: cardify Read full article
3. AMC’s pre-COVID revenues and expenses (thin margins):
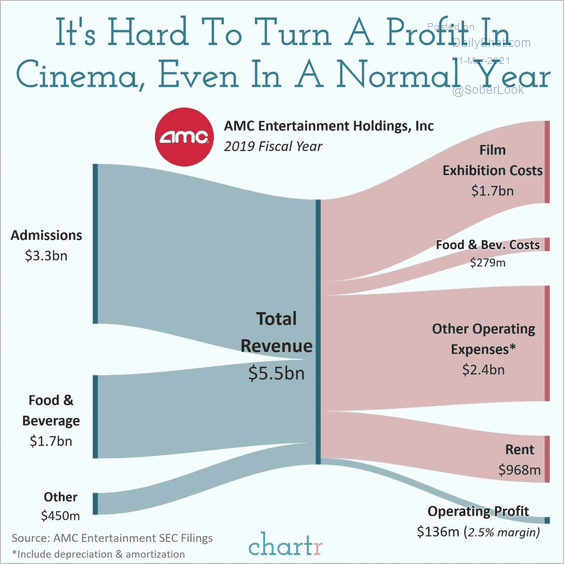 Source: @chartrdaily
4. Where do young investors hold their investments?
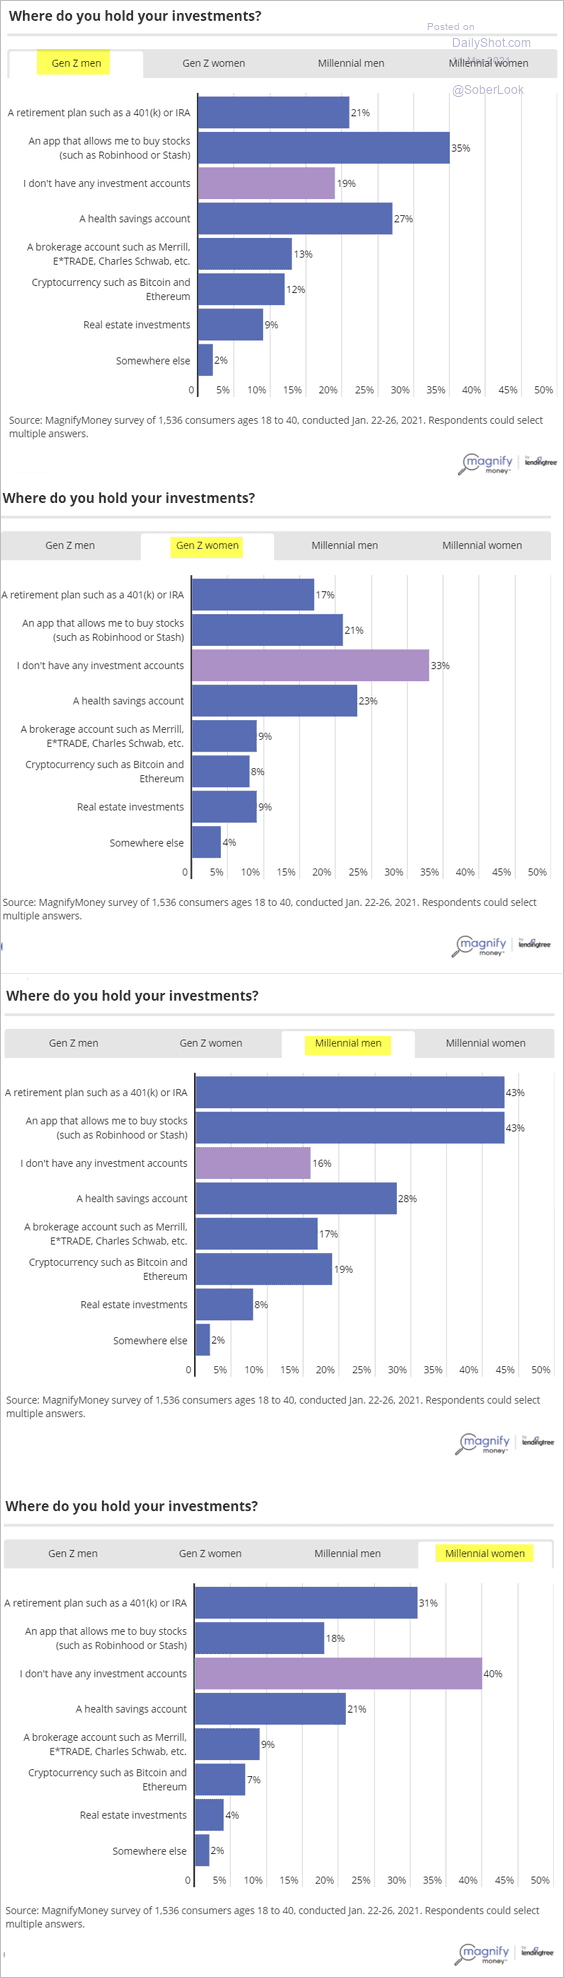 Source: MagnifyMoney Read full article
5. US federal legislation trend:
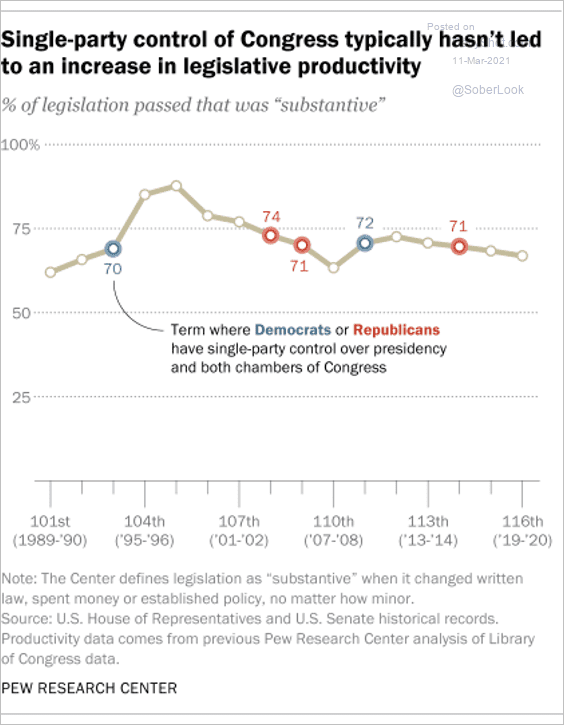 Source: @FactTank Read full article
6. Strongest carbon emission policies:
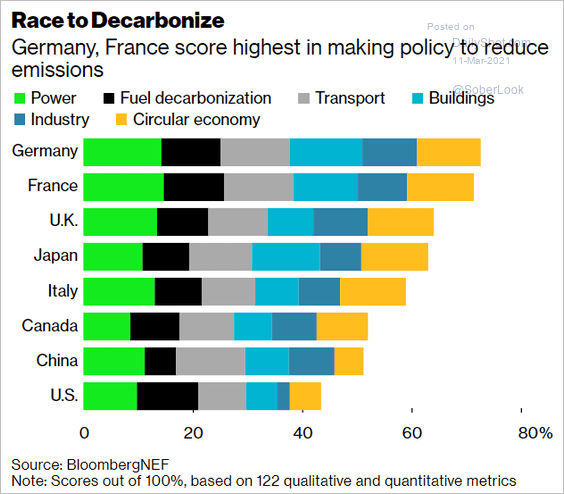 Source: @business Read full article
7. The distribution of global biomass:
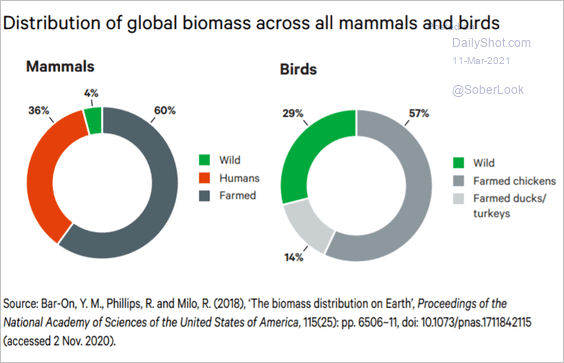 Source: Chatham House Read full article
8. No vaccine intentions:
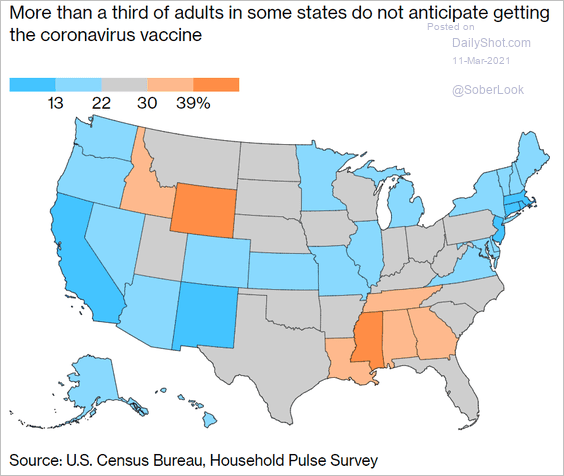 Source: @business Read full article
9. Ship log entries from 1740 to 1855:
 Source: Peter Atwood
——————–
Back to Index