
The Daily Shot: 17-Mar-21
• The United States
• Canada
• Europe
• Asia – Pacific
• China
• Emerging Markets
• Commodities
• Equities
• Credit
• Rates
• Food for Thought
The United States
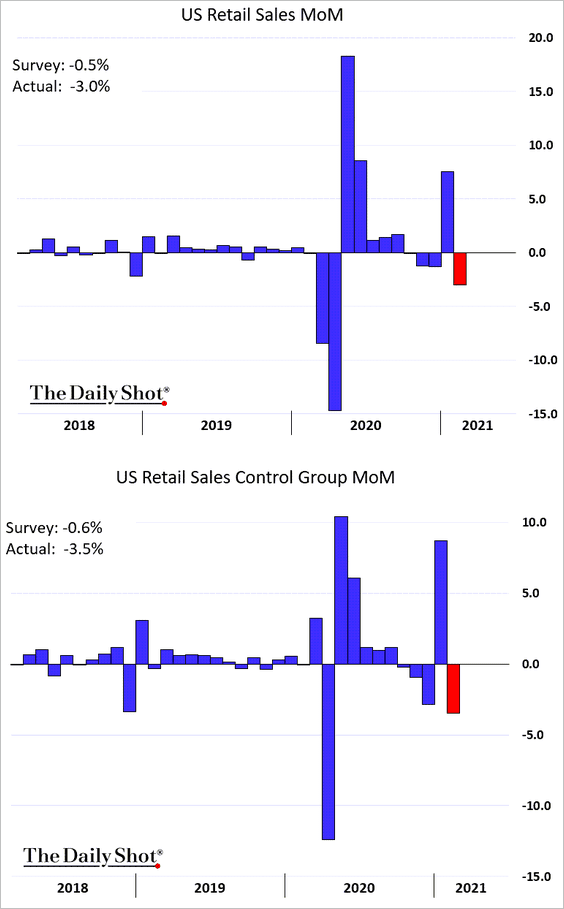
1. The February deep freeze took a toll on retail sales. The declines were more severe than expected.
• The sharp spending drop in Texas is visible in credit card data.
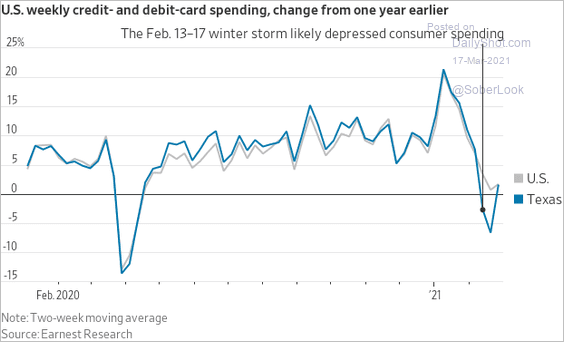 Source: @jeffsparshott
• Online spending also fell, due in part to power outages.
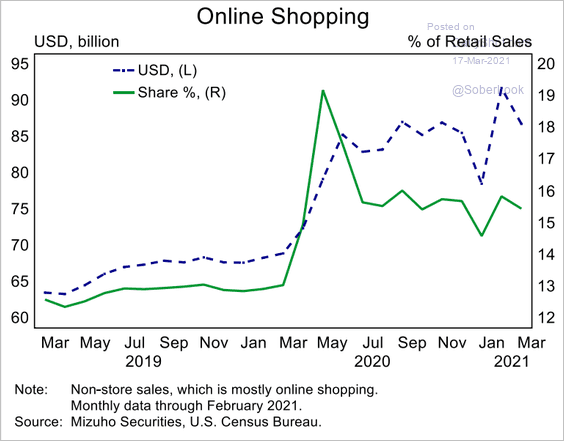 Source: Mizuho Securities USA
• Only gas stations saw an increase in retail sales last month (2nd chart).
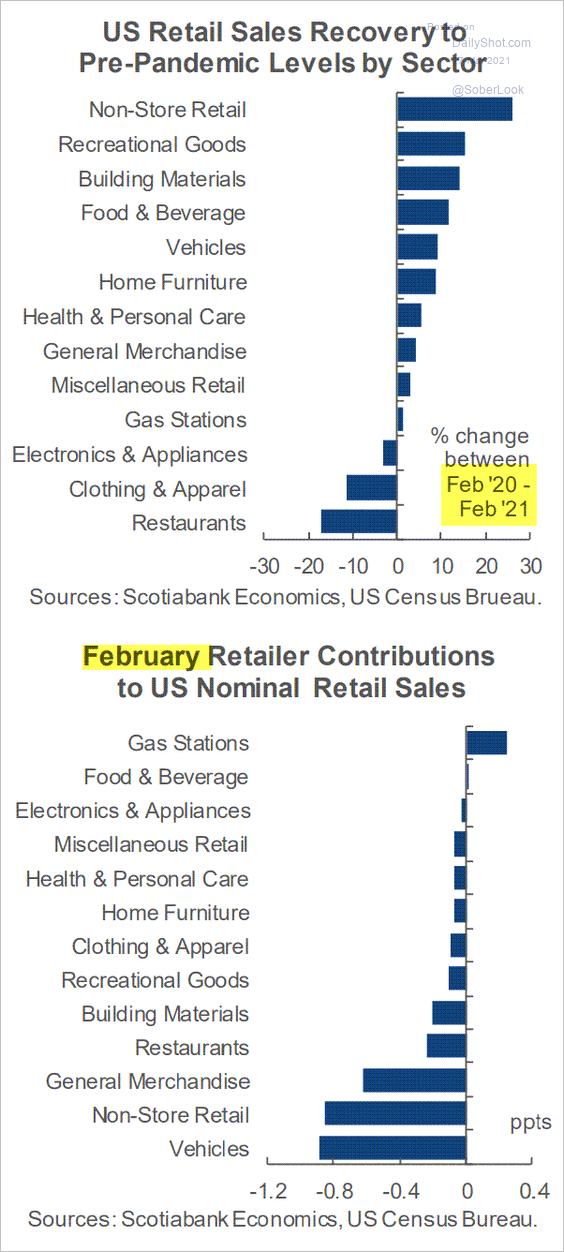 Source: Scotiabank Economics
• Here are the paths in retail sales for select sectors.
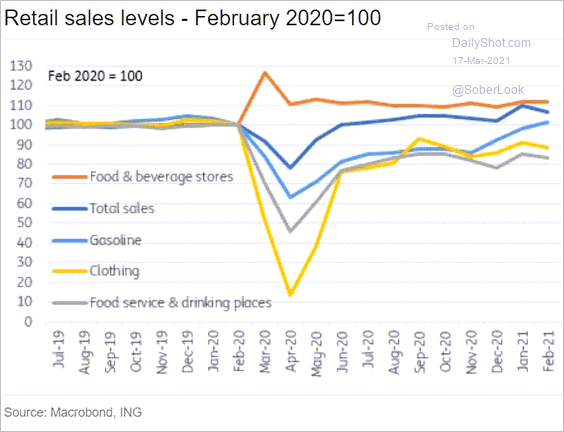 Source: ING
• Retail sales were still well above pre-COVID levels (the chart below shows the “core” retail sales).
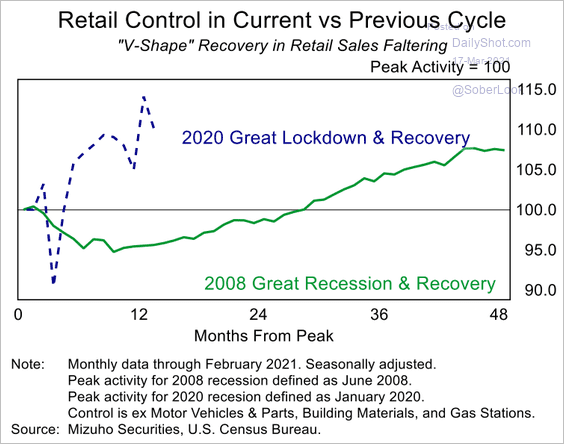 Source: Mizuho Securities USA
——————–
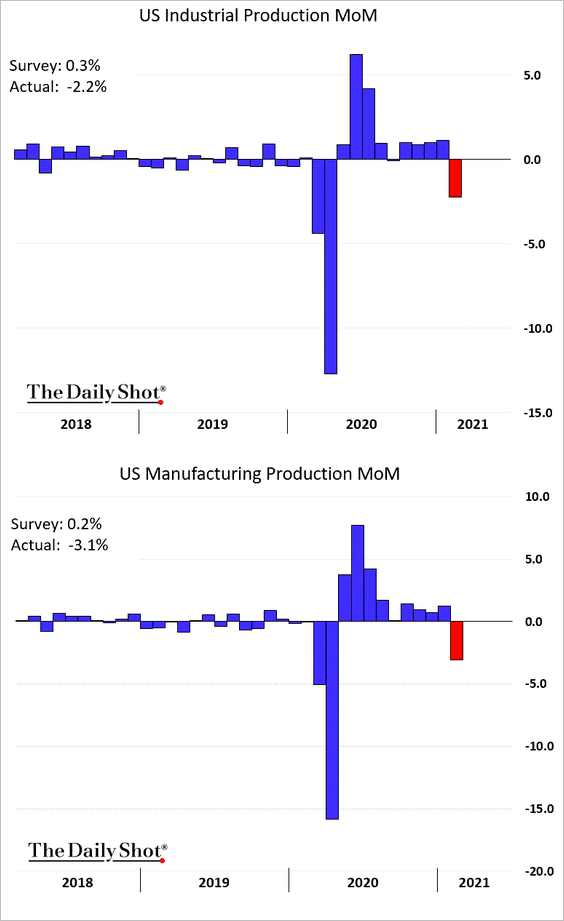
2. Last month’s industrial production also took a hit due to weather as well as chip shortages.
• Here is a comparison to the previous recession.
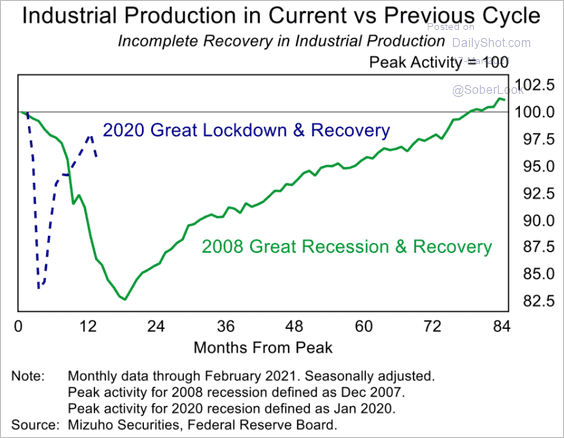 Source: Mizuho Securities USA
• This chart shows factory output by market group.
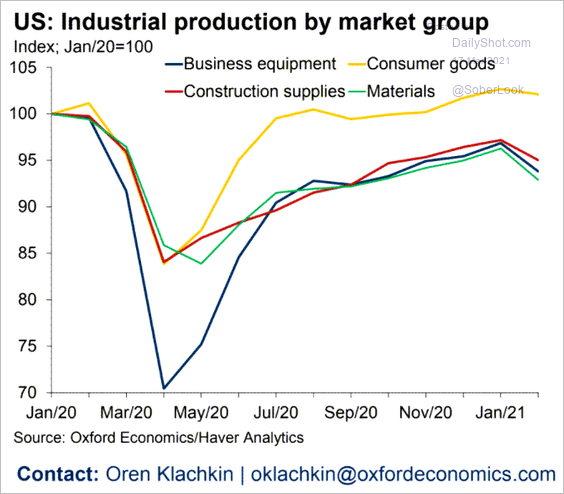 Source: Oxford Economics
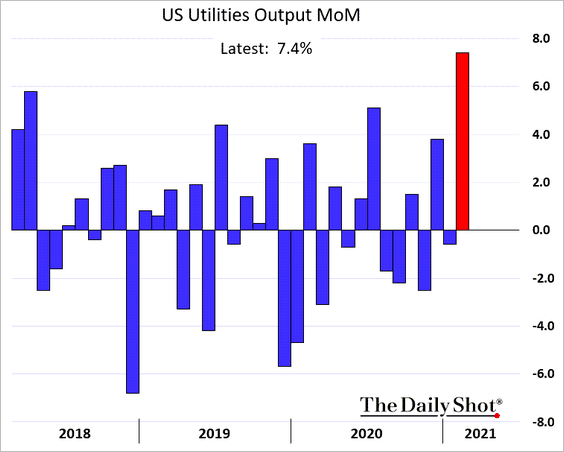
• Capacity utilization dropped.

• However, the deep freeze boosted utilities’ output.
——————–
3. After the economic releases (above), the Atlanta Fed’s GDPNow model sharply downgraded the Q1 growth projections.
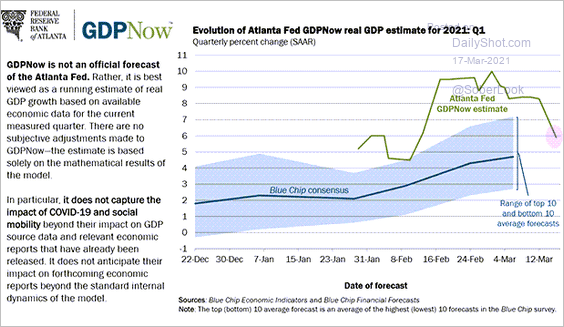 Source: Atlanta Fed
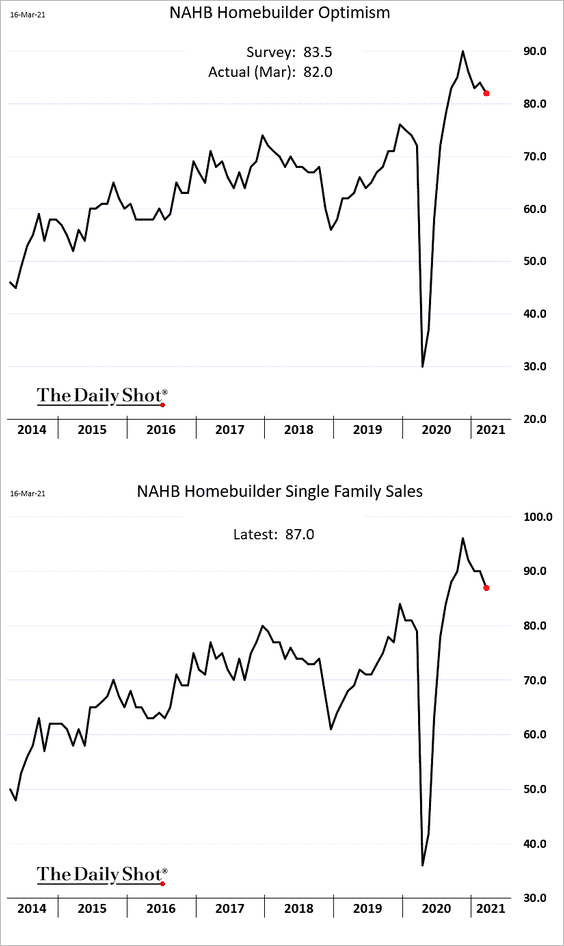
4. Next, we have some updates on the housing market.
• Homebuilder optimism was a bit lower than expected due to somewhat softer sales and near-record lumber prices.
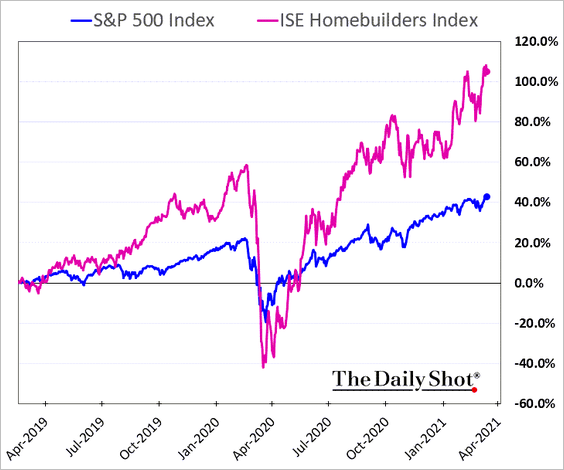
• Homebuilder shares continue to outperform.
• New housing units are massively undersupplied. The US will increasingly face housing shortages in the years ahead.
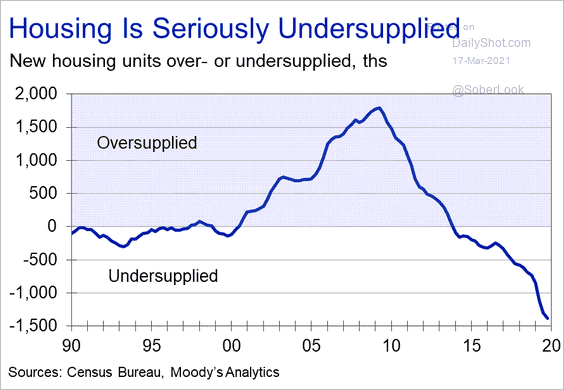 Source: Moody’s Analytics
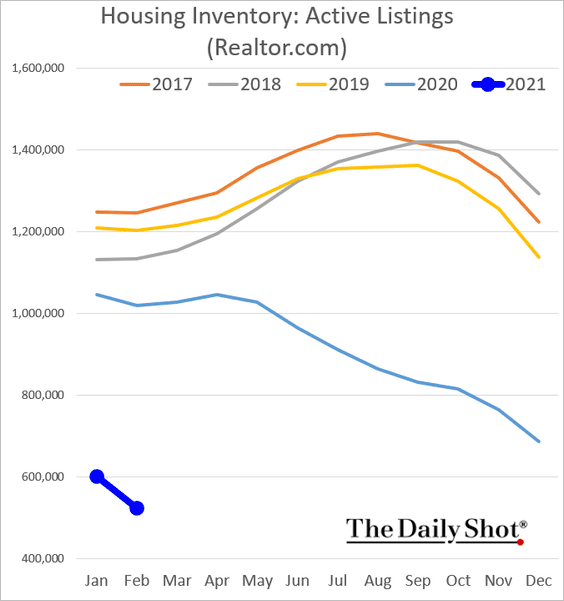
• Inventories of homes for sale are at extreme lows.
• This chart shows mortgage originations by credit score (both purchase and refi loans).
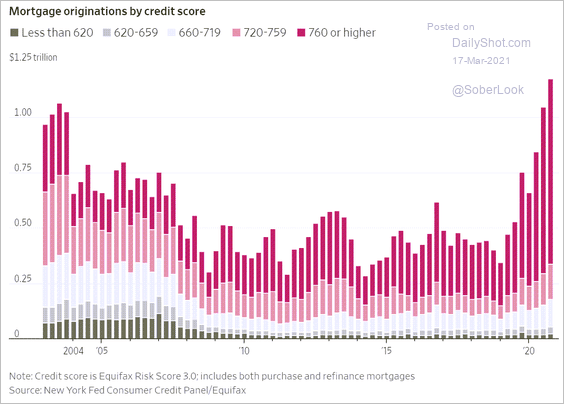 Source: @WSJ Read full article
• Second home/investor mortgage share has risen sharply.
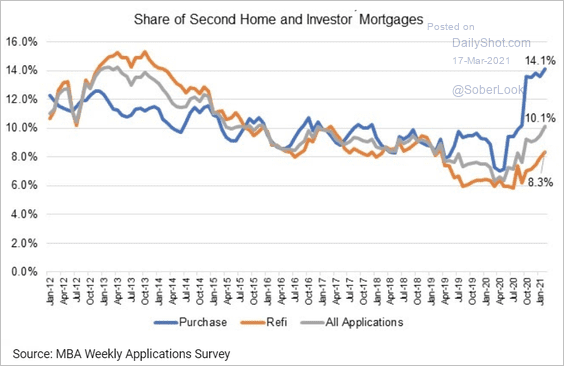 Source: Mortgage Bankers Association
——————–
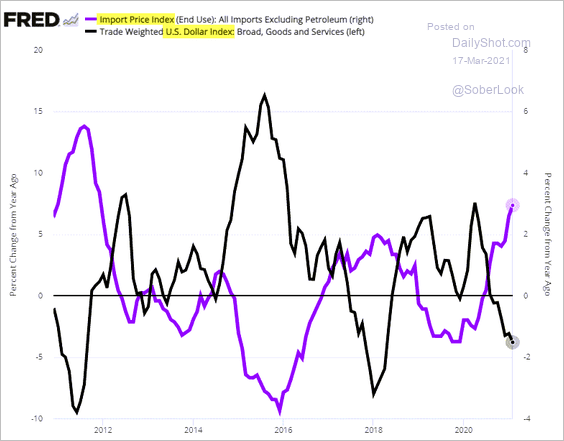
5. Import price inflation continues to grind higher, supported by a weaker US dollar.
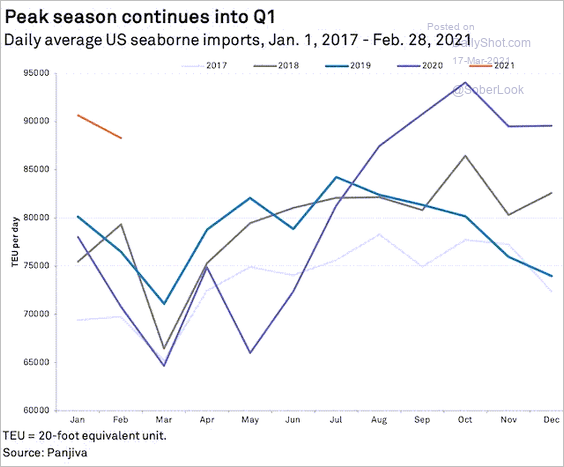
6. US seaborne imports remain elevated.
 Source: S&P Global Market Intelligence
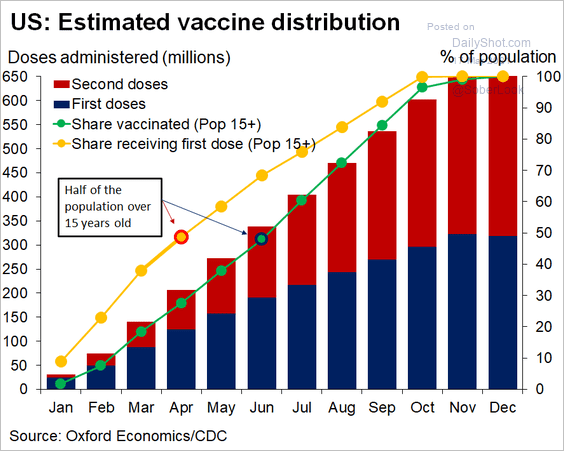
7. According to Oxford Economics, there should be enough vaccine doses by October/November to vaccinate the entire population.
 Source: @GregDaco
Back to Index
Canada
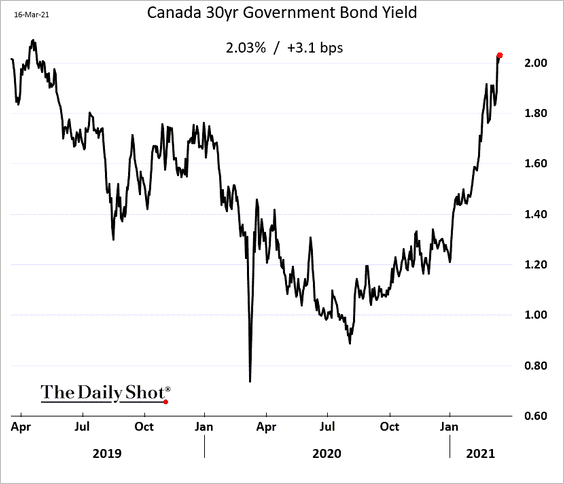
1. The 30yr bond yield is now above 2%.
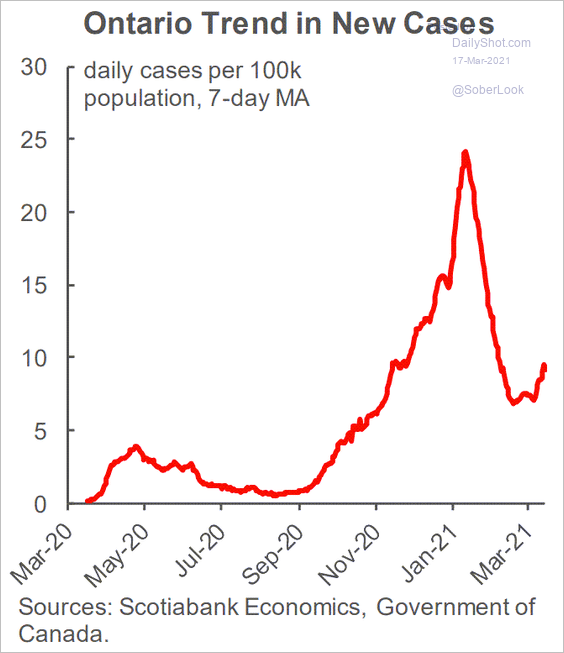
2. Another COVID wave?
 Source: Scotiabank Economics
Back to Index
Europe
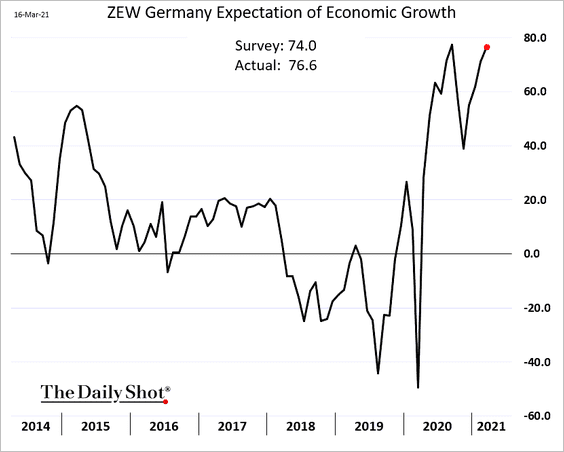
1. The ZEW index points to rebounding economic optimism in Germany.
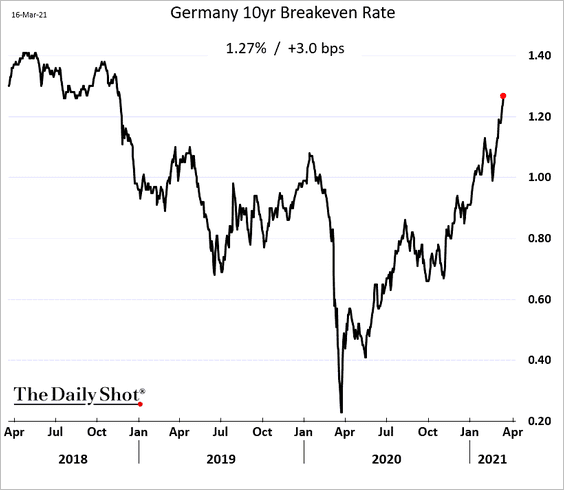
2. German market-based inflation expectations are surging.
3. Here is the US-Germany 10yr bond spread.
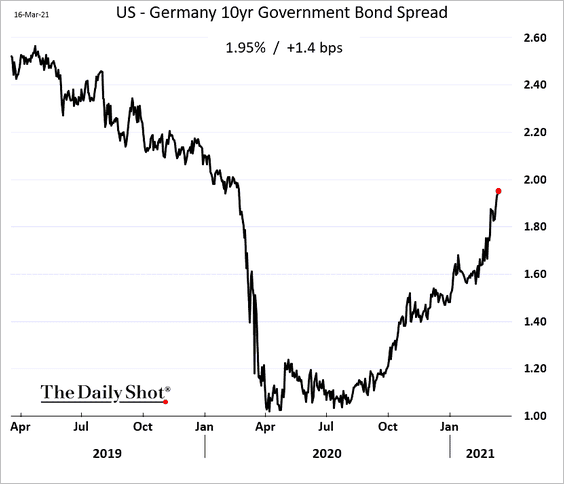
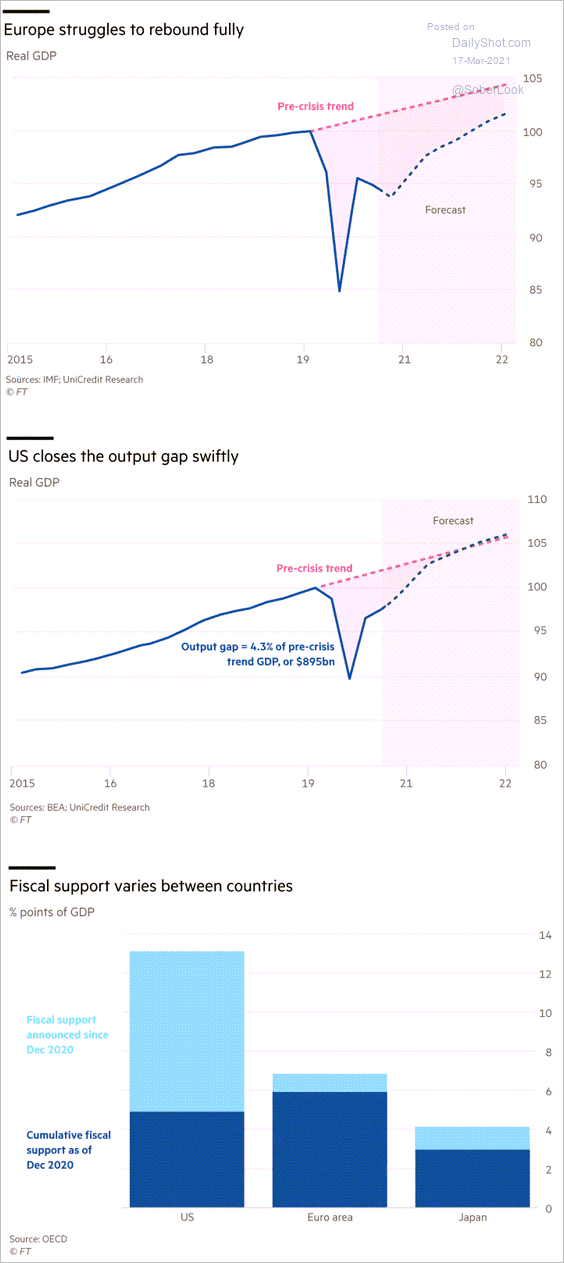
The widening spread is driven in part by the divergence in economic growth expectations – primarily due to the gap in fiscal stimulus between the US and Europe. A potential oversupply of Treasuries also contributes to wider spreads.
 Source: @financialtimes Read full article
——————–
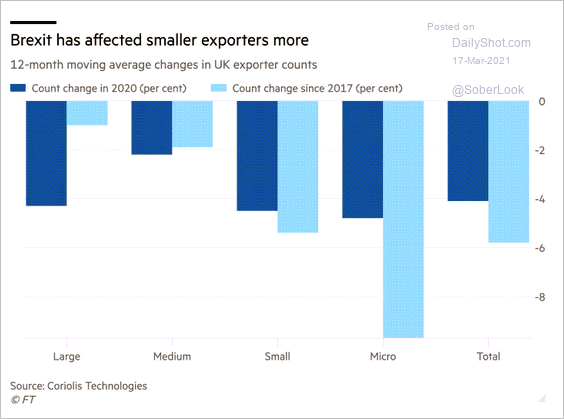
3. The number of exporters in the UK has been declining.
 Source: @financialtimes Read full article
Back to Index
Asia – Pacific
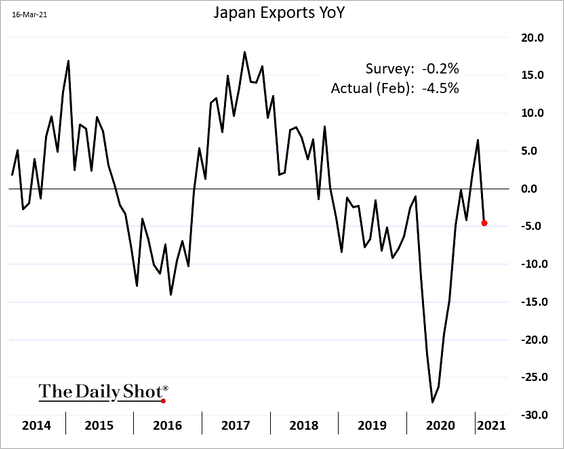
1. Japan’s exports weakened sharply last month.
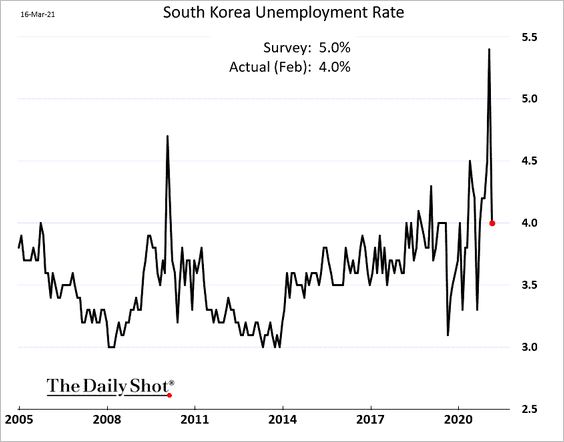
2. South Korea’s unemployment rate declined more than expected.
3. This set of charts from ANZ shows why New Zealand’s red hot housing market is likely to cool soon.
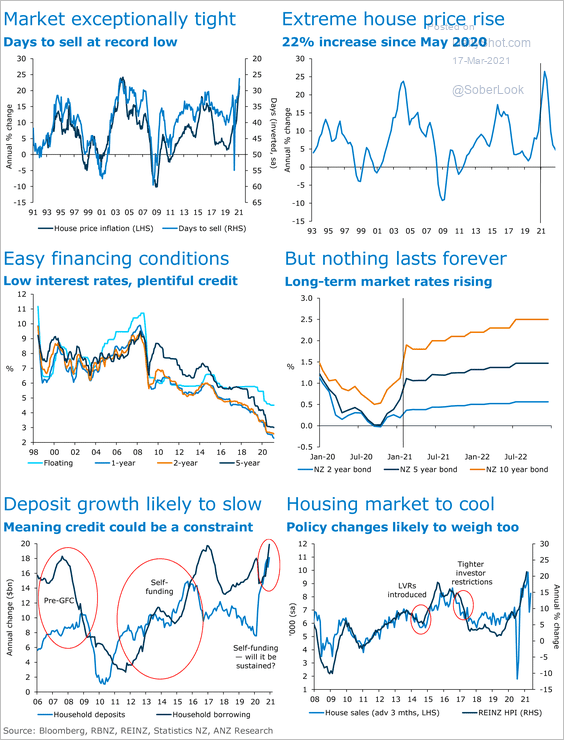 Source: ANZ Research
Back to Index
China
1. According to Evercore ISI, China’s current quarter GDP will be 17% above Q1 of last year (base effects).
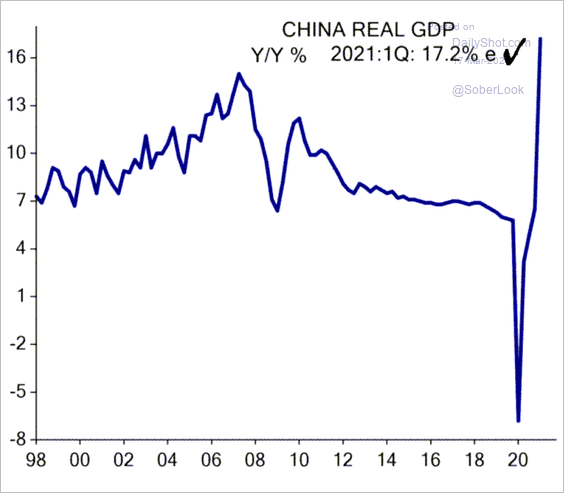 Source: Evercore ISI
2. Residential land prices in major cities have risen massively over the past decade.
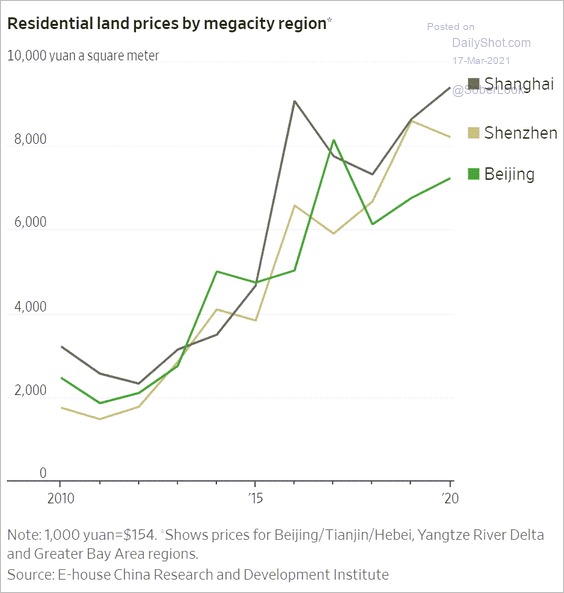 Source: @WSJ Read full article
3. The quota for local government special bond issuance earmarked for infrastructure has barely changed from last year’s high, according to Alpine Macro.
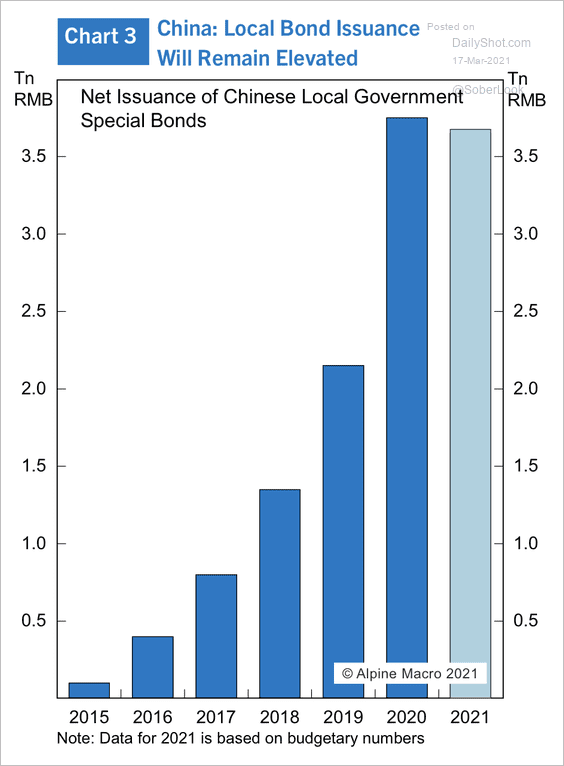 Source: Alpine Macro
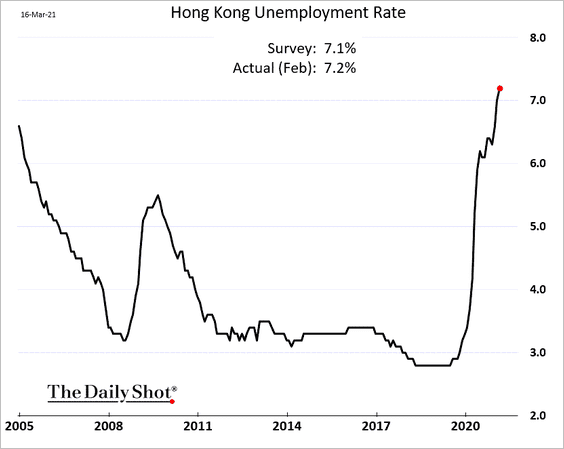
4. Hong Kong’s unemployment rate keeps grinding higher.
Back to Index
Emerging Markets
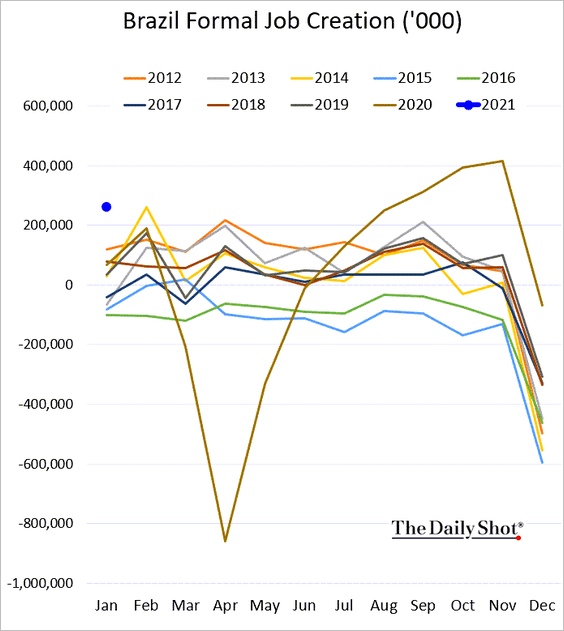
1. Brazil’s labor market started the year on a strong note.
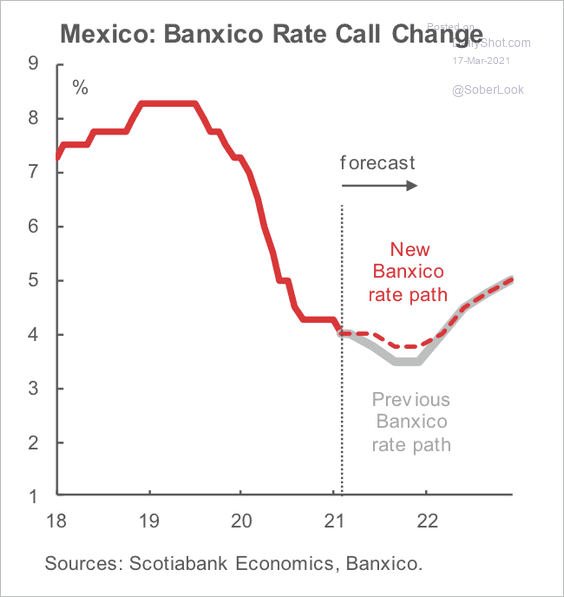
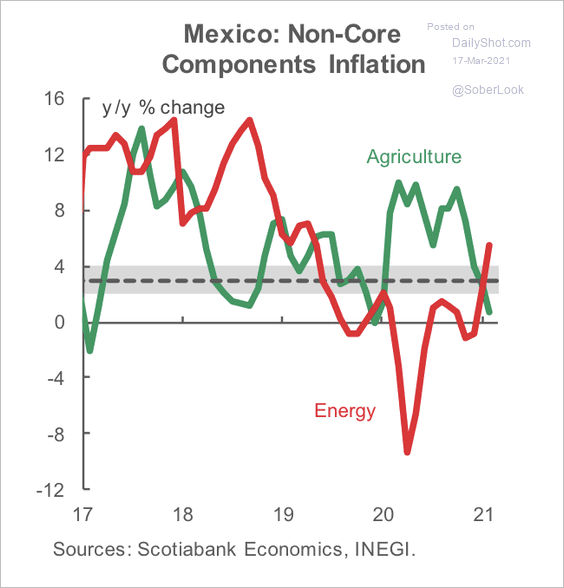
2. Scotiabank anticipates Mexico’s central bank to cut rates by 25 basis points in Q3, followed by a hold of the target rate at 3.75% through the end of the year.
 Source: Scotiabank Economics
Mexico’s energy price CPI has risen over the past year while agriculture inflation declined.
 Source: Scotiabank Economics
——————–
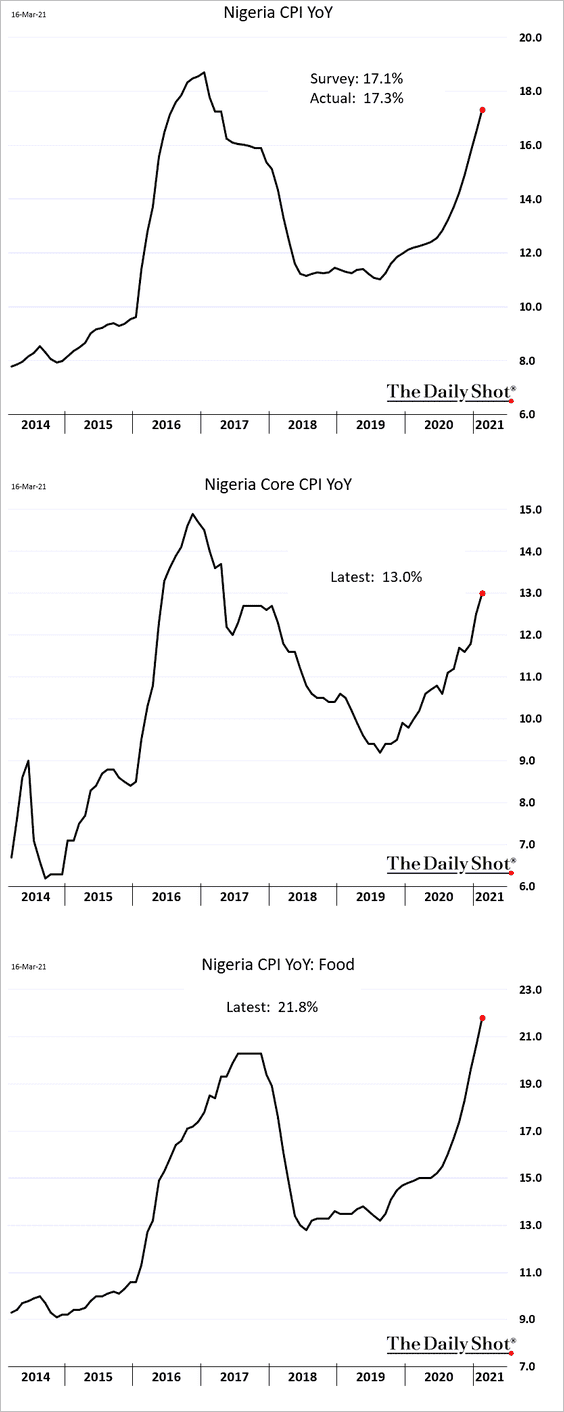
3. Nigeria’s inflation climbed above 17%, with food price gains nearing 22%.
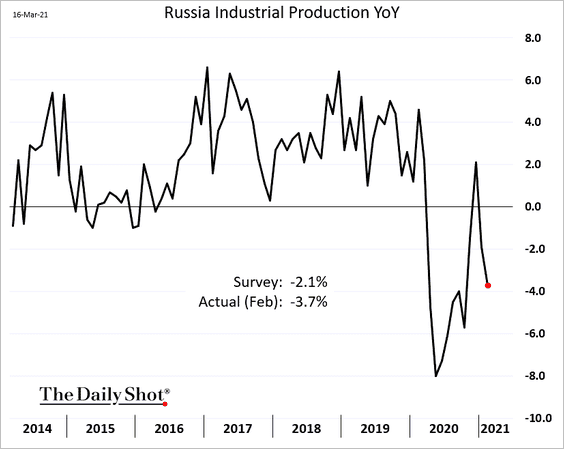
4. Russia’s industrial production tumbled this year.
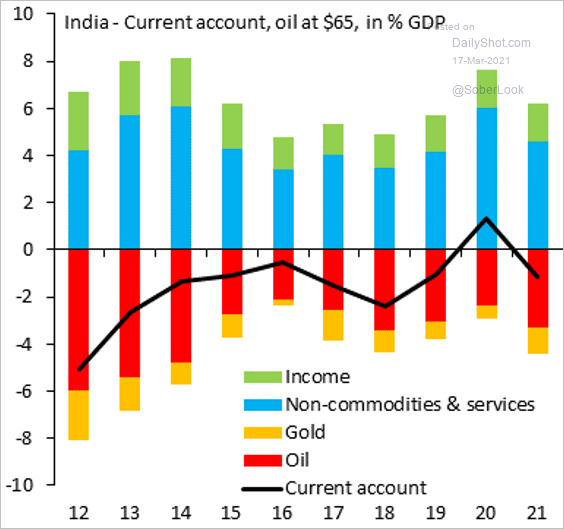
5. India remains vulnerable to rising oil prices.
 Source: @SergiLanauIIF
6. Fitch expects EM currencies to consolidate as the MSCI EM Currency Index tested resistance.
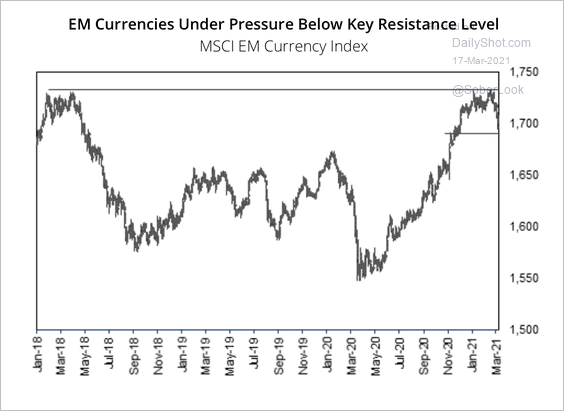 Source: Fitch Solutions Macro Research
Over the short-term, rising US yields could continue to weigh on EM currencies (2 charts).
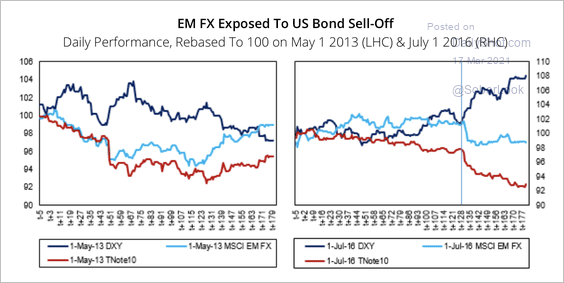 Source: Fitch Solutions Macro Research
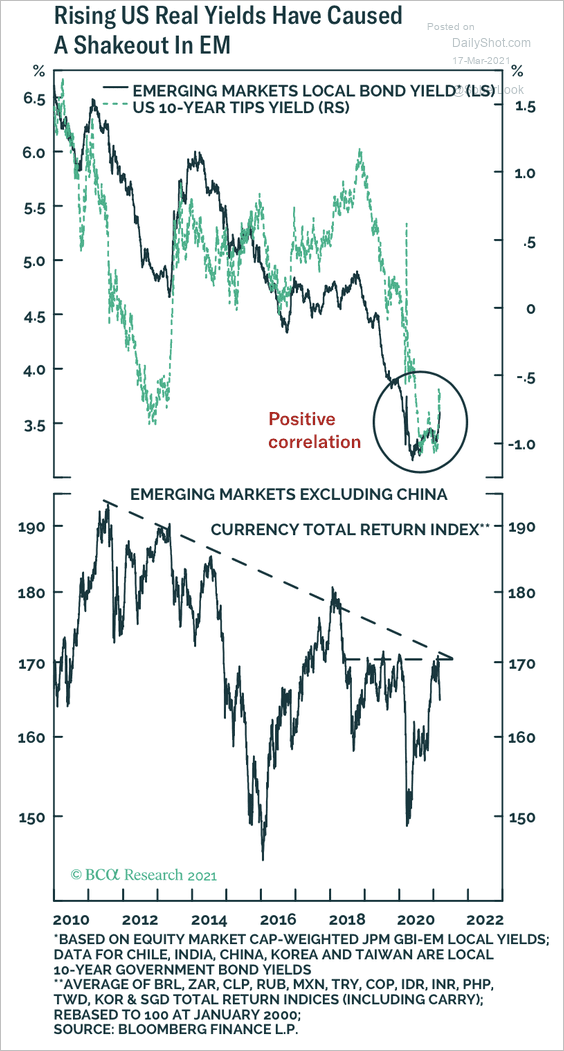 Source: BCA Research
Back to Index
Commodities
1. Copper supply has grown more slowly than other commodities.
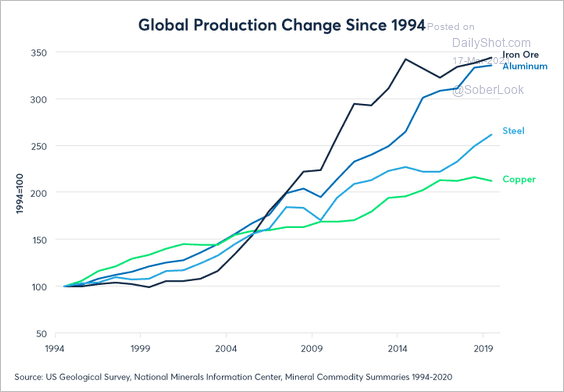 Source: CME Group Read full article
Copper implied volatility is still higher than pre-pandemic levels.
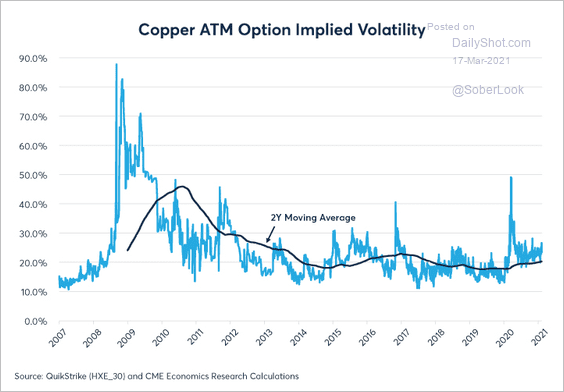 Source: CME Group Read full article
——————–
2. Soybean shipments are flooding out of Brazil.
 Source: @kannbwx
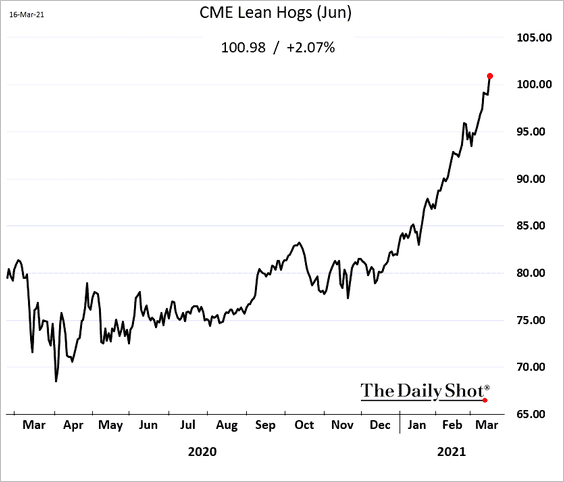
3. June CME lean hog futures are above $1.0/lb.
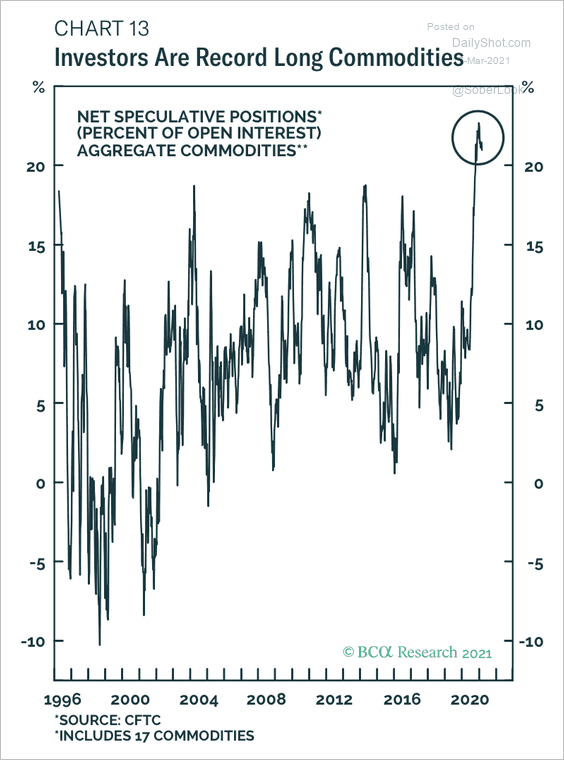
4. Net long positions in commodity futures are at an extreme.
 Source: BCA Research
Back to Index
Equities
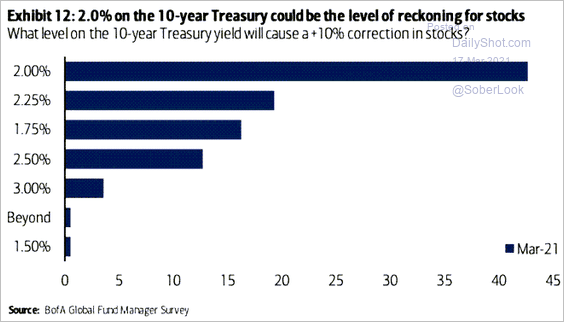
1. What level of Treasury yields will trigger a significant selloff in stocks? Fund managers have zeroed in on 2%.
 Source: @ISABELNET_SA, @BofAML
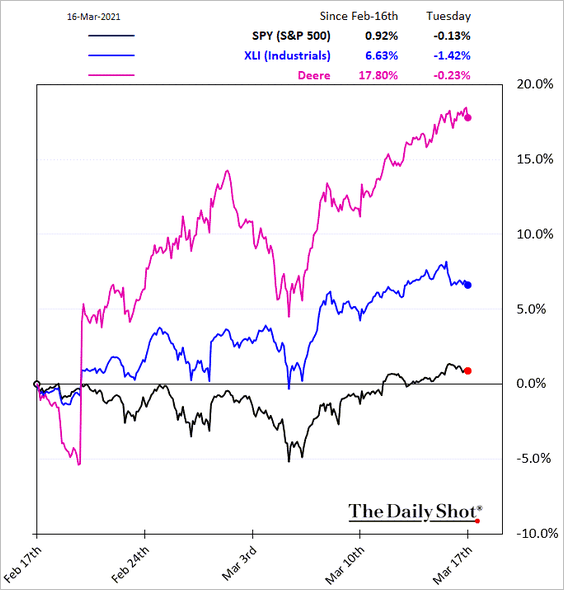
2. It’s been a good month for industrials.
3. According to Morgan Stanley, the current rebound in earnings is one of the fastest in recent history.
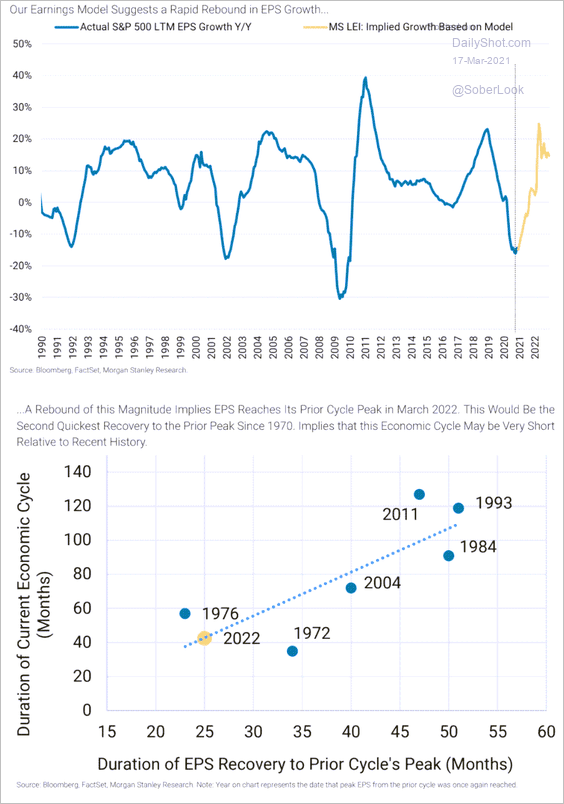 Source: Morgan Stanley Research
4. Short interest in US shares continues to trend lower.
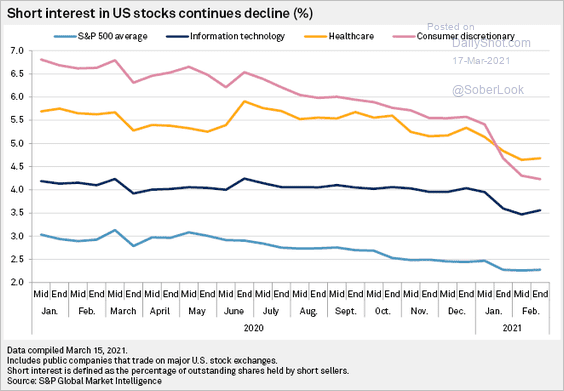 Source: S&P Global Market Intelligence
5. This chart shows fund manages’ dramatic positioning shift from defensive to cyclical sectors over the past year.
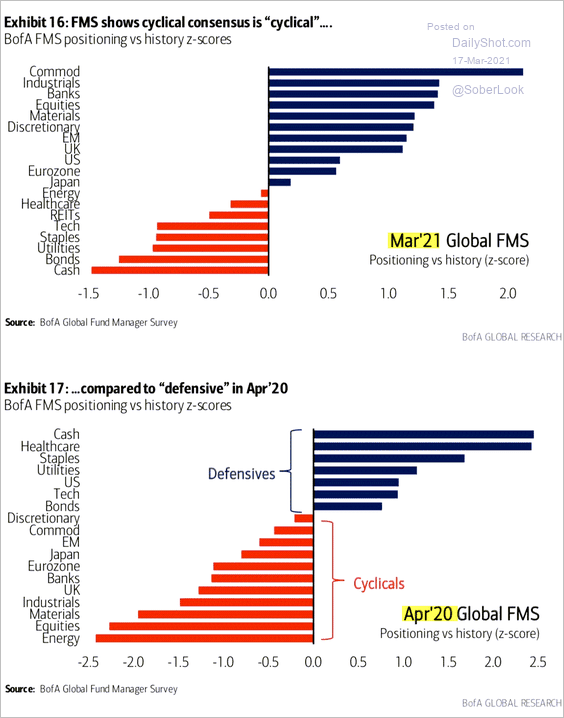 Source: BofA Global Research; @WallStJesus
6. The next chart shows ETF fees by strategy over the past three years.
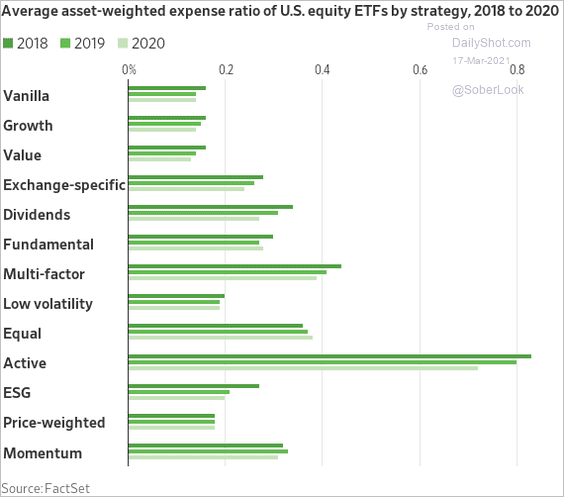 Source: @WSJ Read full article
Back to Index
Credit
1. Corporate investment-grade spreads are holding near the lows despite rising yields.
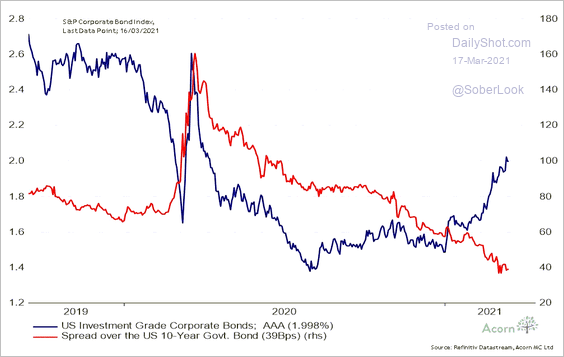 Source: @RichardDias_CFA
2. High-yield default rates have been more moderate than what we saw after the financial crisis.
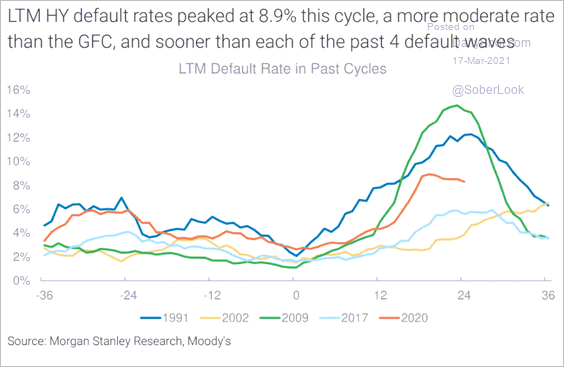 Source: Morgan Stanley Research
Back to Index
Rates
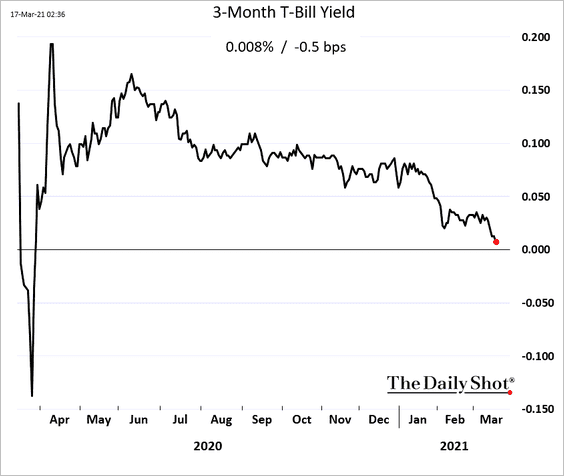
1. The 1-month T-Bill yield is now negative amid rapidly rising liquidity.
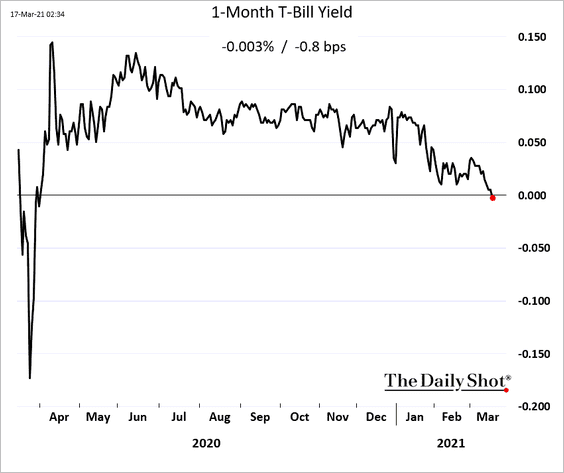
The 3-month yield is approaching zero.
——————–
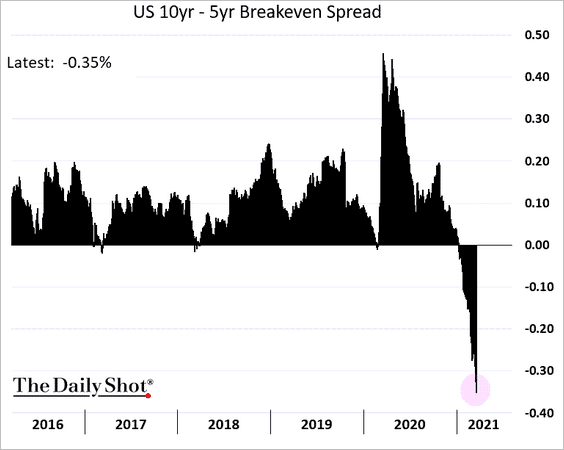
2. The 10yr US breakeven rate (inflation expectations) is at a multi-year high.
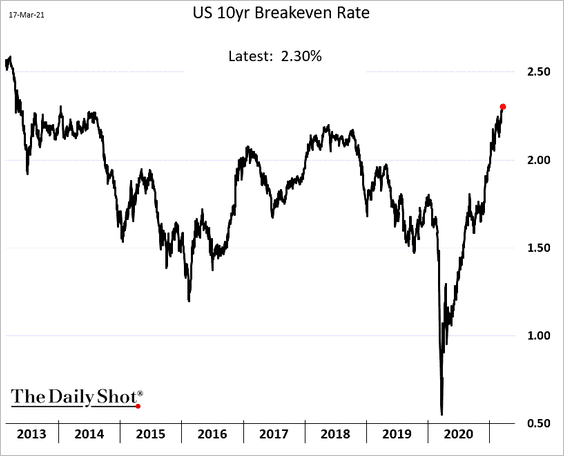
But it has been rising slower than the 5yr rate.
——————–
3. Here is the divergence in real yields (steepening TIPS curve).
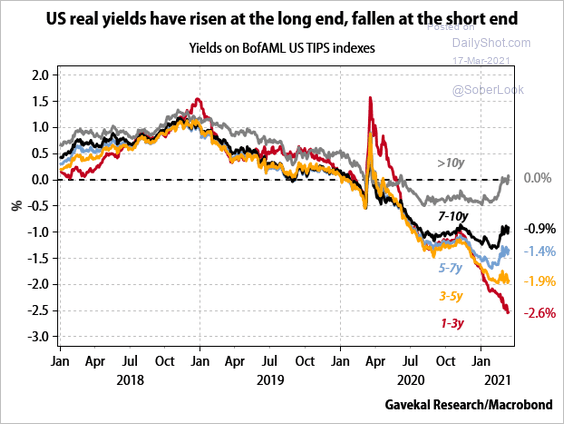 Source: Gavekal Research
4. The share of Treasuries held by foreigners has been declining. Will the trend change as yields climb further?
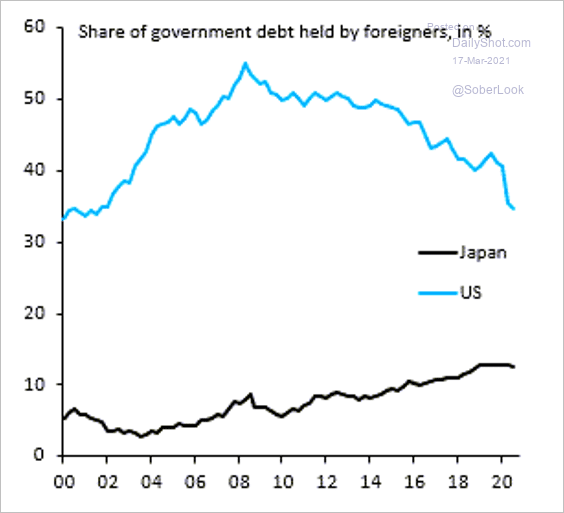 Source: @RobinBrooksIIF
——————–
Food for Thought
1. Working from home means working longer hours.
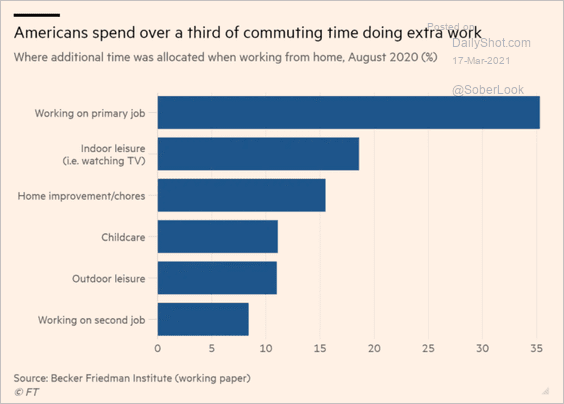 Source: @financialtimes Read full article
2. 23% of US workers want to keep working remotely.
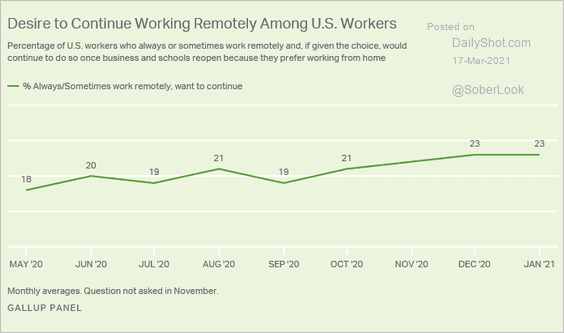 Source: Gallup Read full article
3. Senate delegations by state:
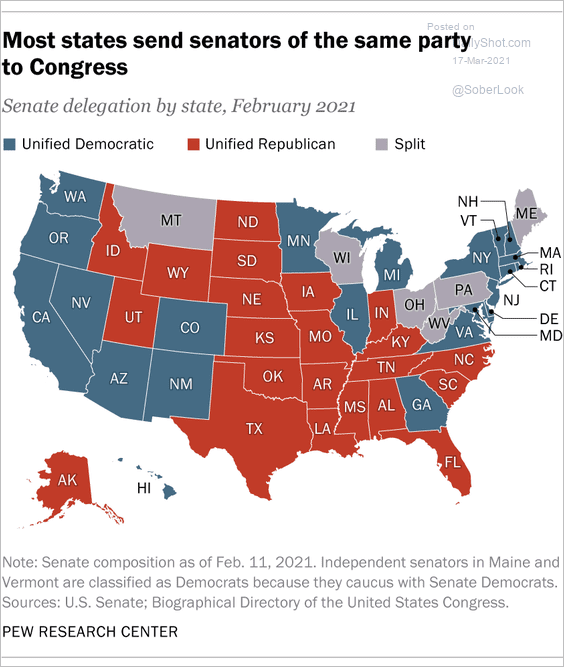 Source: Pew Research Center Read full article
4. Foreign-born share of the House of Representatives:
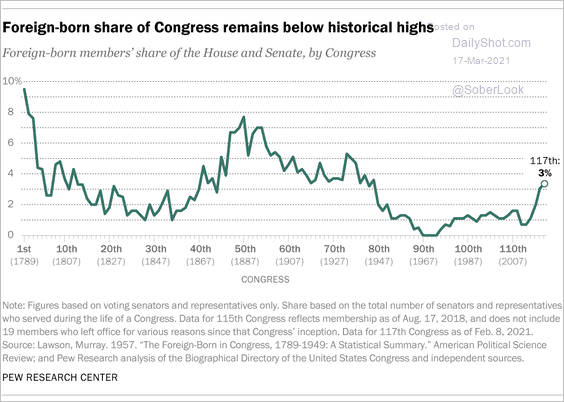 Source: Pew Research Center Read full article
5. The US Congress, by religious affiliation:
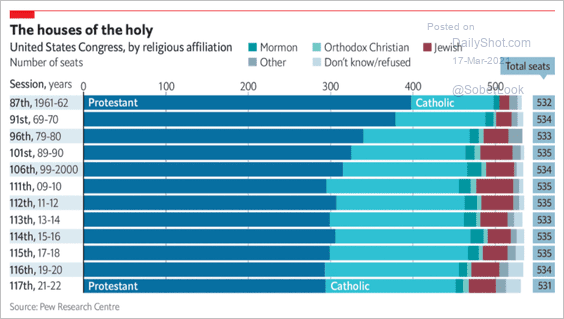 Source: The Economist Read full article
6. US southwest border apprehensions:
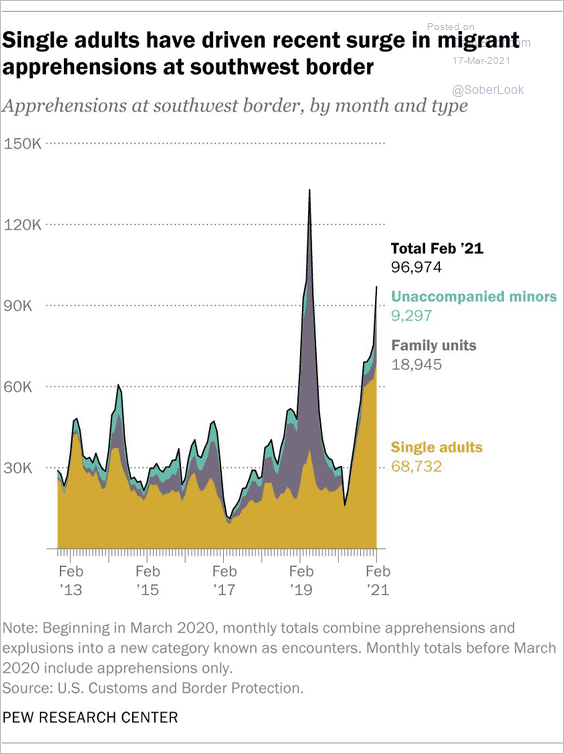 Source: @johngramlich Read full article
7. OECD electricity production, by source:
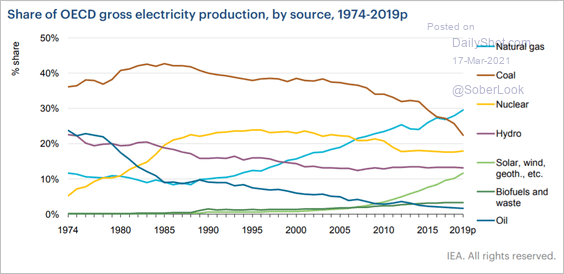 Source: IEA
8. COVID vaccinations and deaths by age:
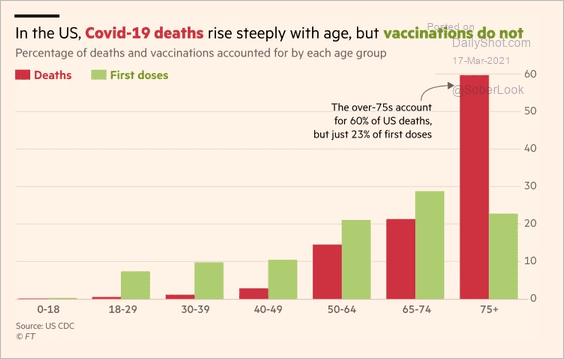 Source: @financialtimes Read full article
9. Share of financial assets by gender:
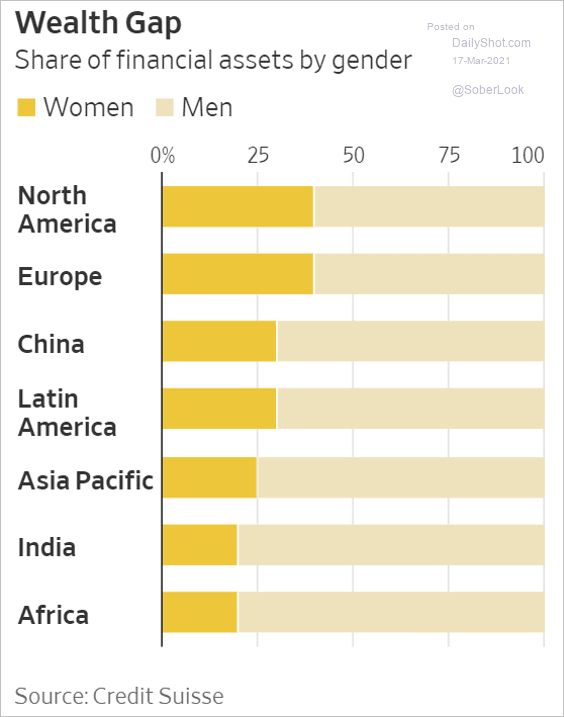 Source: @WSJ Read full article
10. Types of neural networks:
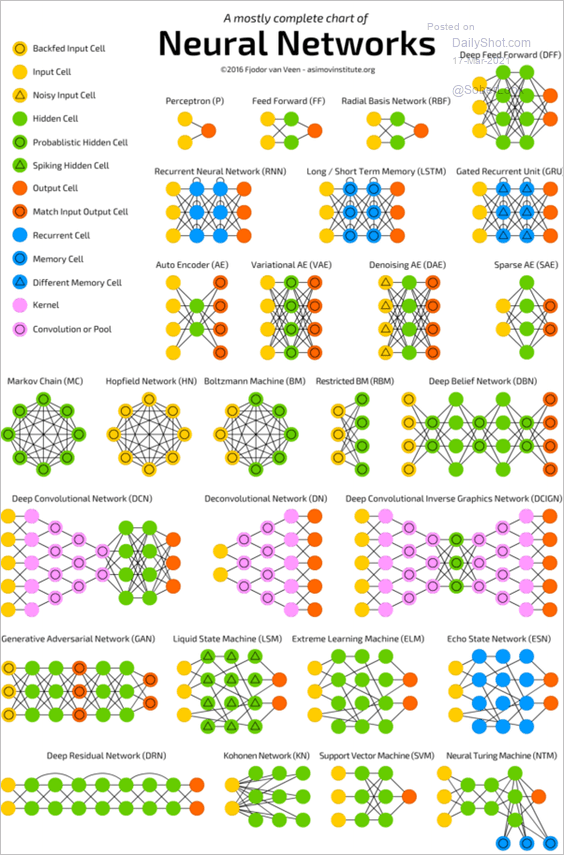 Source: The Asimov Institute
——————–
Back to Index