
The Daily Shot: 18-Mar-21
• The United States
• Canada
• Europe
• Asia – Pacific
• Emerging Markets
• Commodities
• Energy
• Equities
• Rates
• Food for Thought
The United States
1. The Fed held the line on its dovish stance, showing no signs of potential policy adjustments in the near-term. A few more FOMC members boosted their rate projections for 2022 and 2023, …
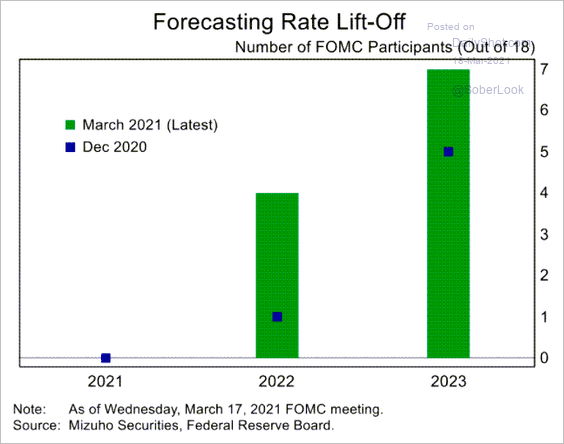 Source: Mizuho Securities USA
… but the bulk of the Committee expects rates to stay near zero. Here is the dot plot.
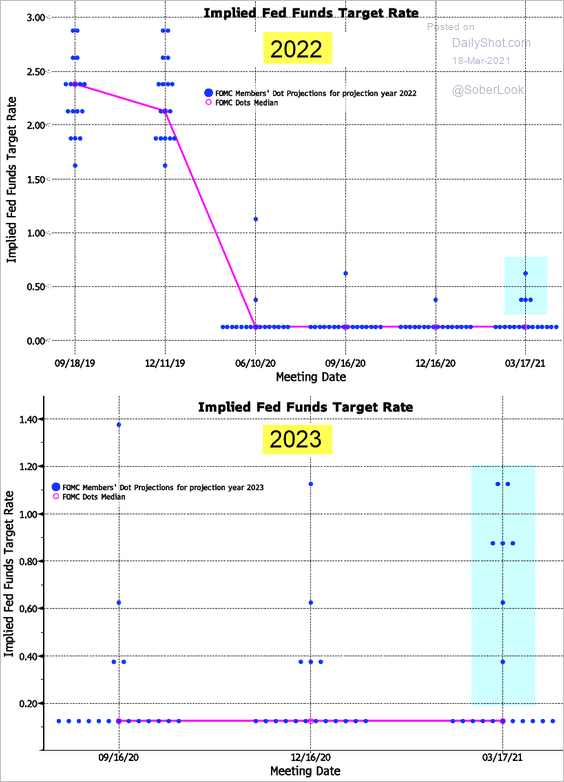 Source: @TheTerminal, Bloomberg Finance L.P.
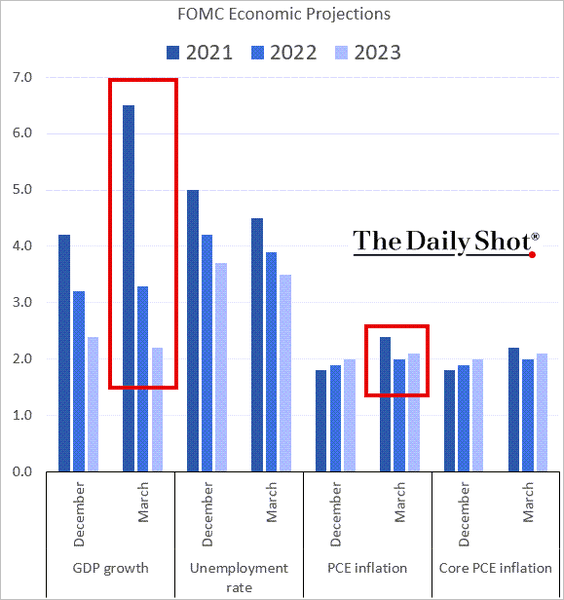
• The FOMC boosted its forecasts for this year’s GDP growth and inflation, but longer-term changes were modest. The Fed views the rise in inflation as transitory.
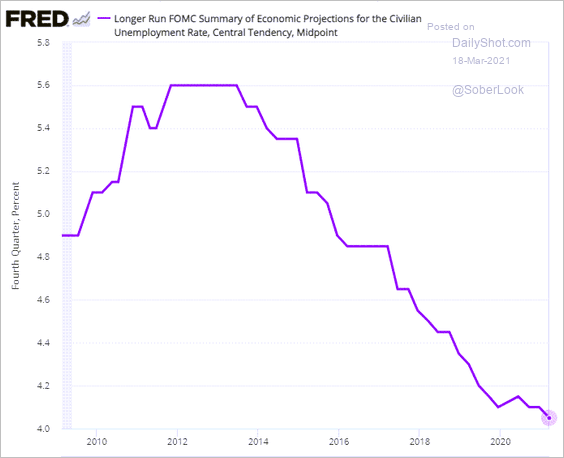
Projections for the long-run unemployment rate hit a new low. It means that the central bank sees the current labor market as being a long way from “full employment” (the unemployment rate is currently 6.2%).
• Nonetheless, according to Oxford Economics, the Fed will begin tapering in Q2 of next year.
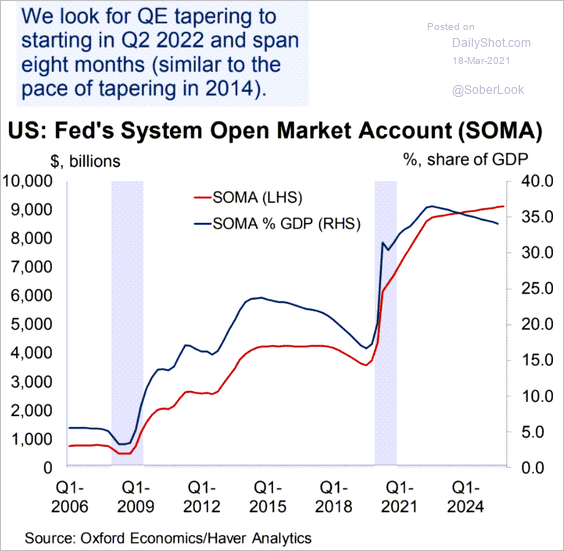 Source: Oxford Economics
——————–
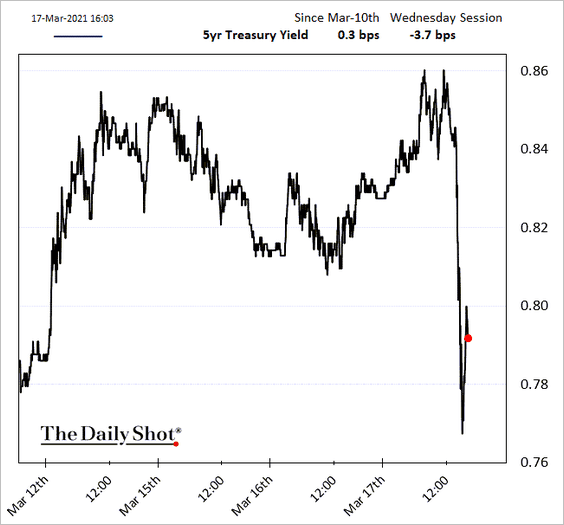
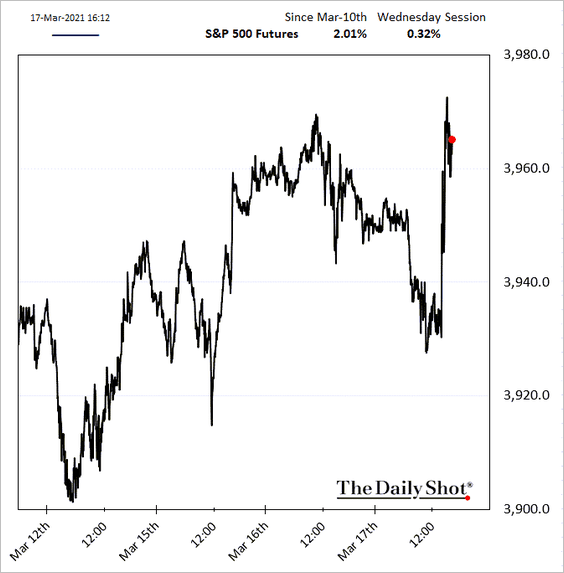
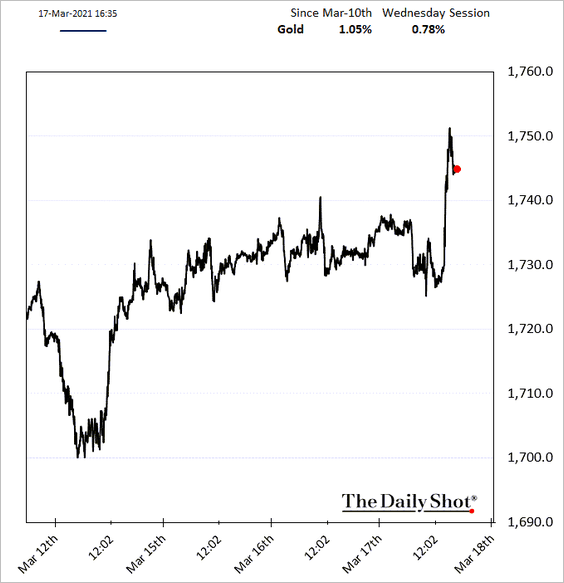
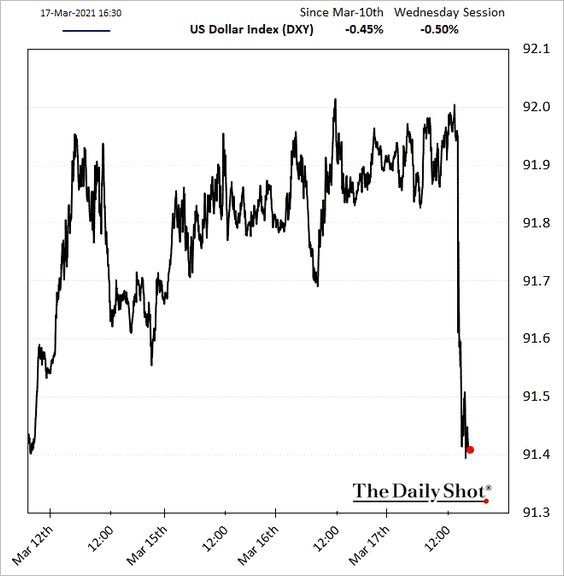
2. Below is the market response to the Fed’s dovish outlook.
• Bond yields tumbled, although longer-dated yields finished up on the day.
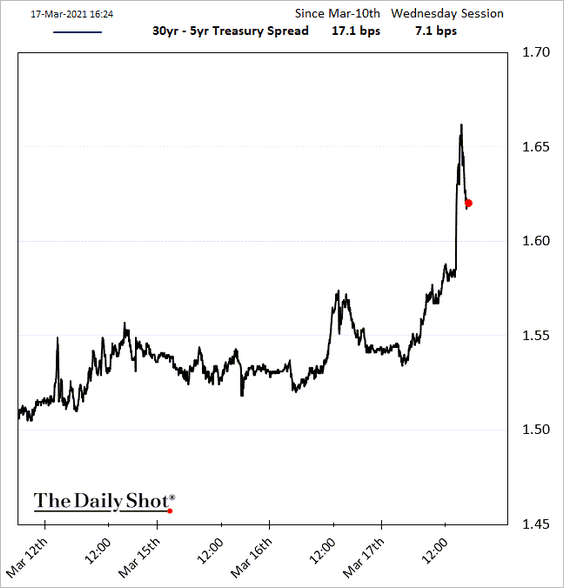
• The yield curve steepened.
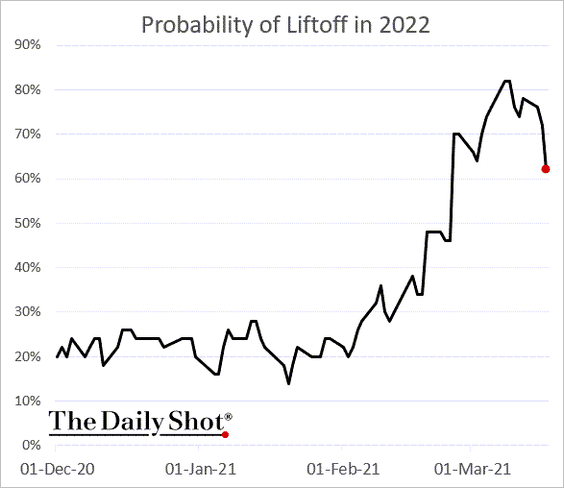
• The market-based probability of liftoff next year dropped.
• Stocks and gold saw gains.
• The dollar tumbled.
By the way, the GDP growth divergence between the US and the rest of G10 points to a stronger dollar ahead.
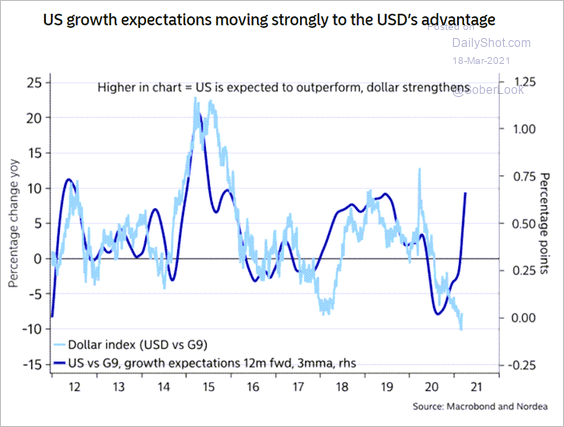 Source: Nordea Markets
Here is Goldman’s forecast for US near-term growth.
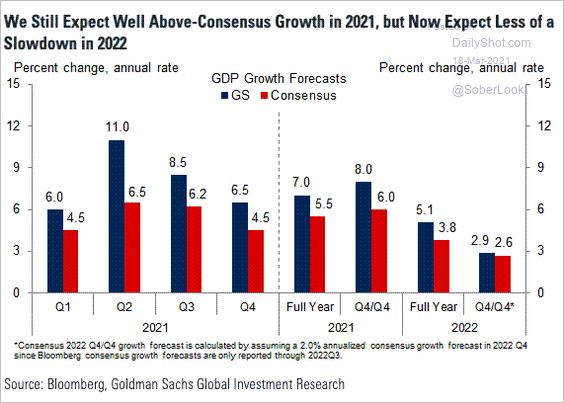 Source: Goldman Sachs; @paulkrugman
——————–
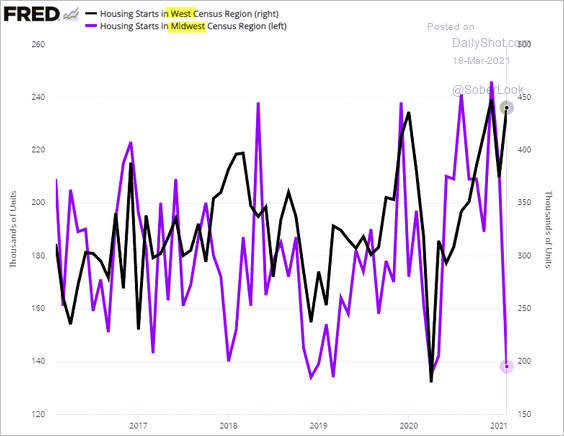
3. Next, we have some updates on the housing market.
• Housing starts dropped sharply last month, …
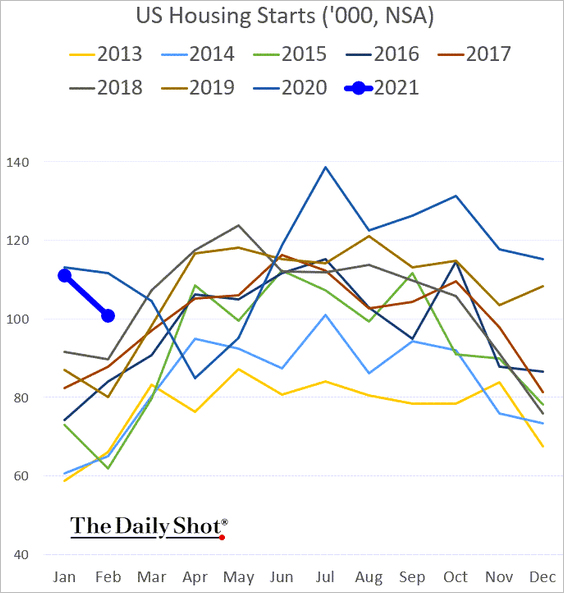
… with the residential construction report coming in well below forecasts.
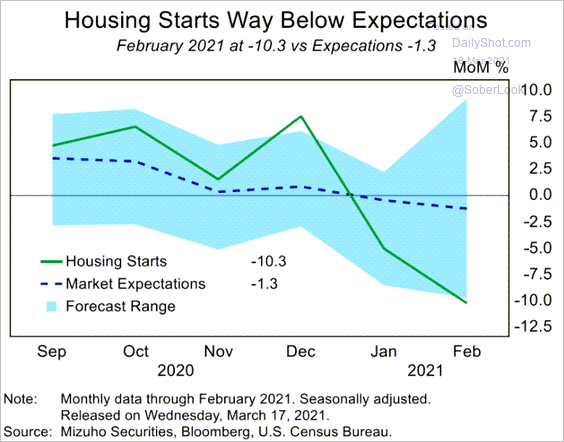 Source: Mizuho Securities USA
Part of the reason was the February deep freeze in parts of the country. For example, here is the divergence between housing starts in the West and Midwest regions.
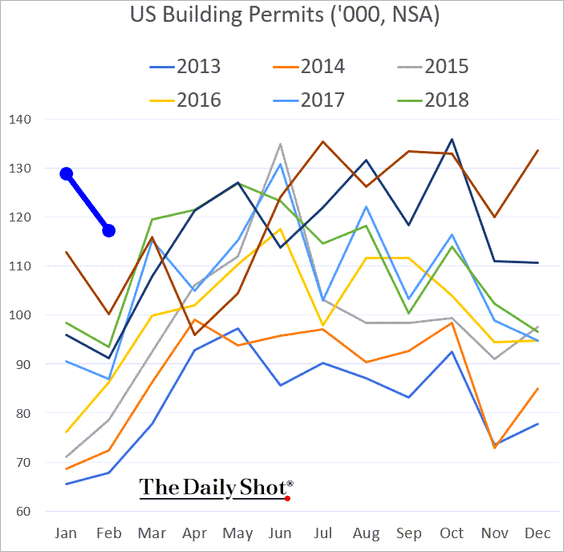
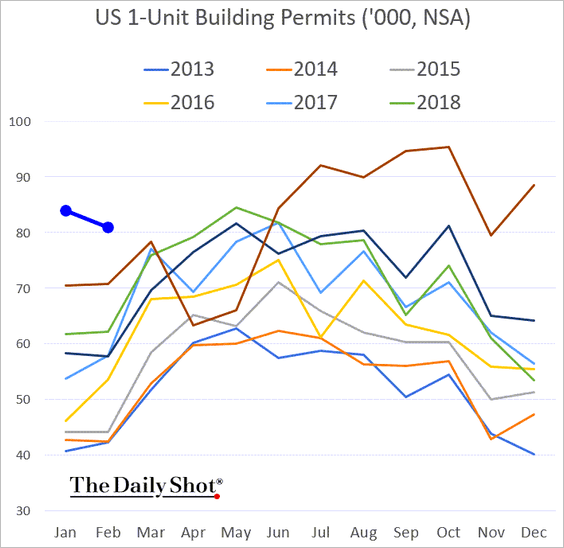
• Construction permits were softer as well but are still well above the levels we’ve seen in recent years.
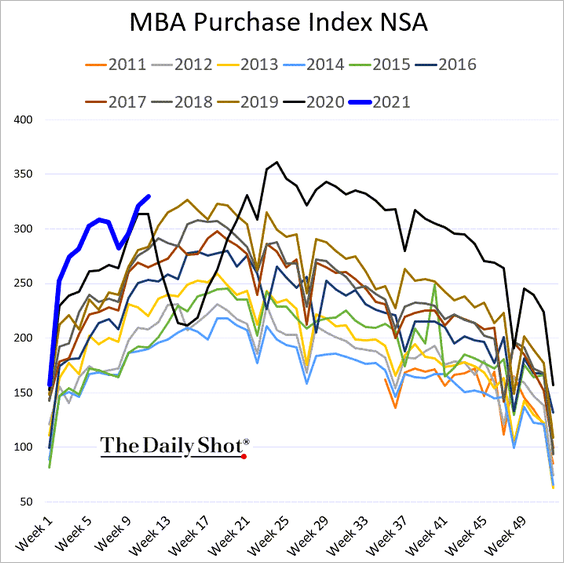
• Mortgage applications for house purchase remain robust for this time of the year.
• Rapidly rising home prices have created a divergence between purchase and refi loans.
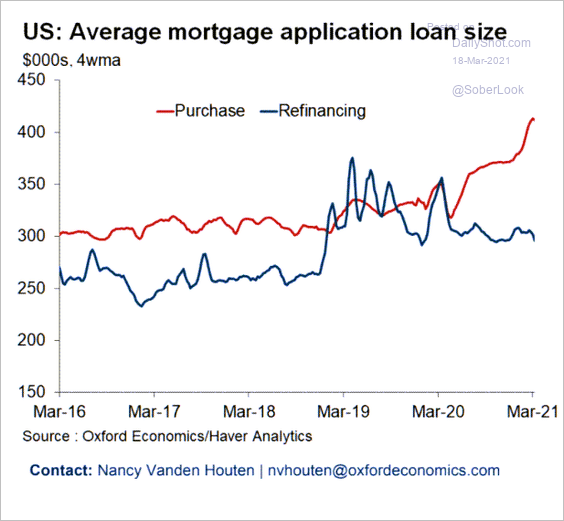 Source: Oxford Economics
• According to the AEI Housing Center, home price appreciation is currently running close to 14%.
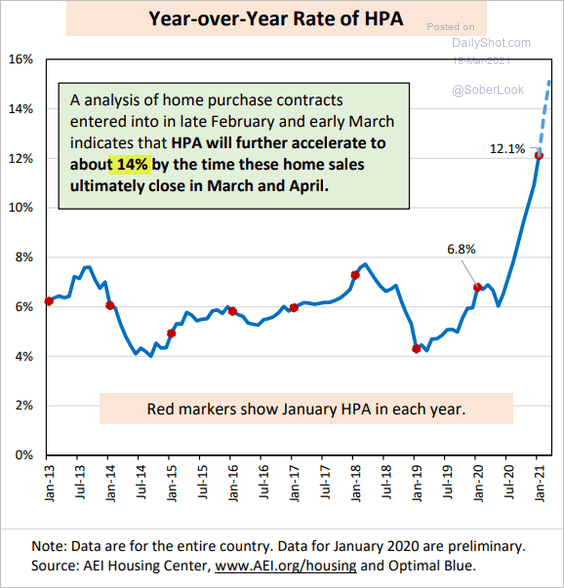 Source: AEI Center on Housing Markets and Finance
• This chart shows home price appreciation adjusted for inflation since 1975.
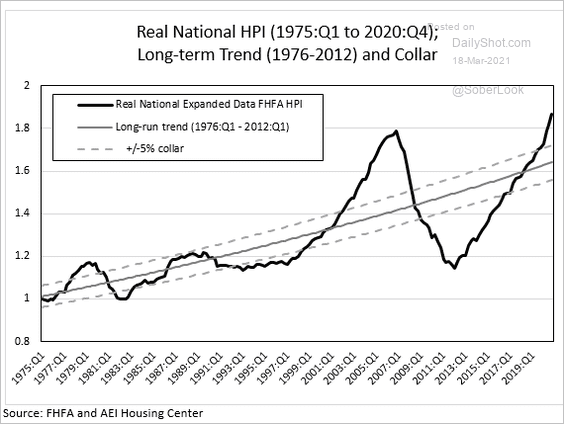 Source: AEI Center on Housing Markets and Finance
• Construction on many new sold homes hasn’t started yet.
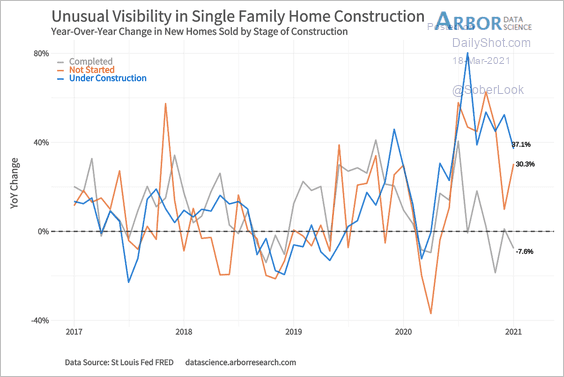 Source: Arbor Research & Trading
• Here is a map of home affordability.
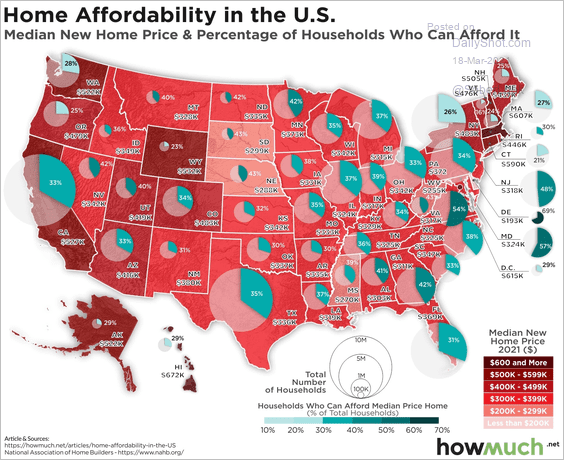 Source: @howmuch_net Read full article
• Homebuyers are increasingly making offers without seeing the house in person.
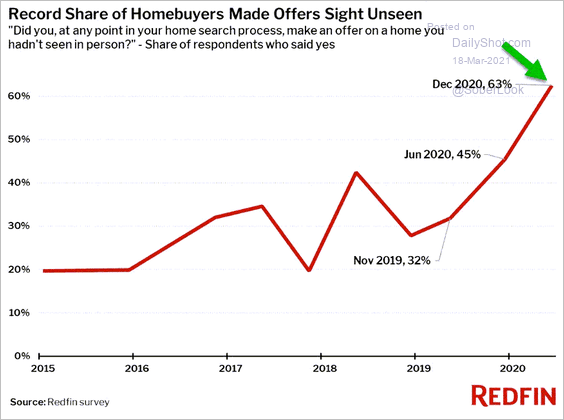 Source: Redfin; @Callum_Thomas
——————–
4. Multiple reports now suggest that consumer sentiment is improving rapidly.
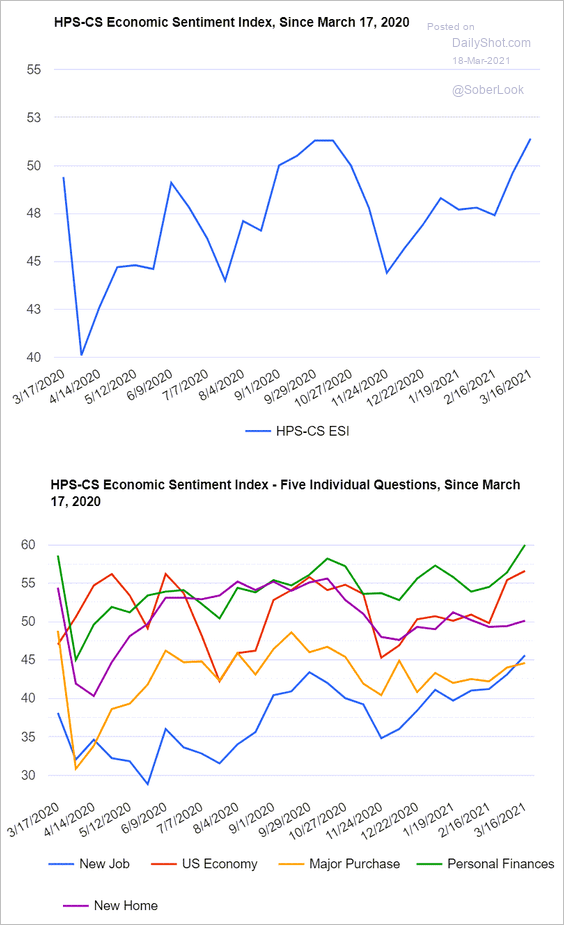 Source: @HPS_CS, @HPSInsight, @CivicScience
Back to Index
Canada
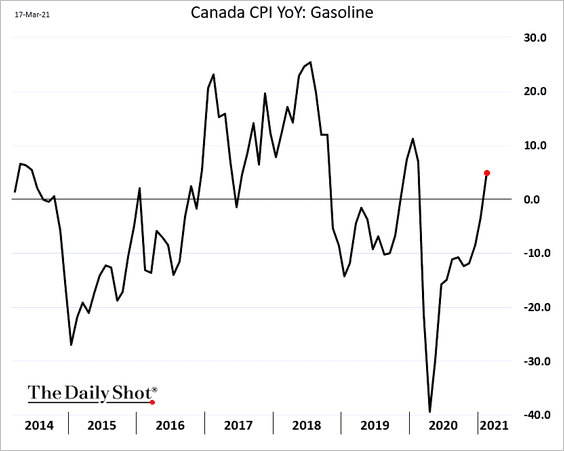
1. The inflation report was softer than expected.
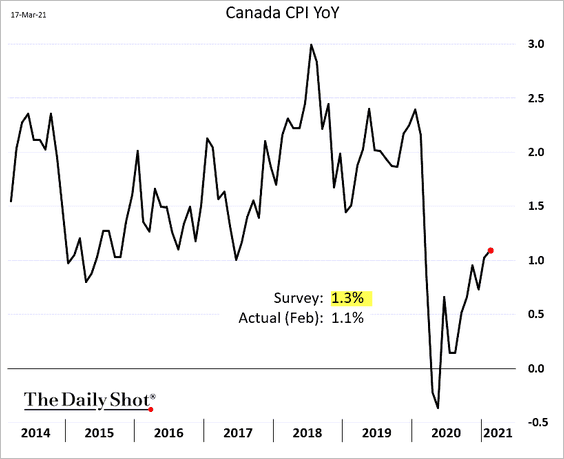
The headline CPI gains were driven by gasoline.
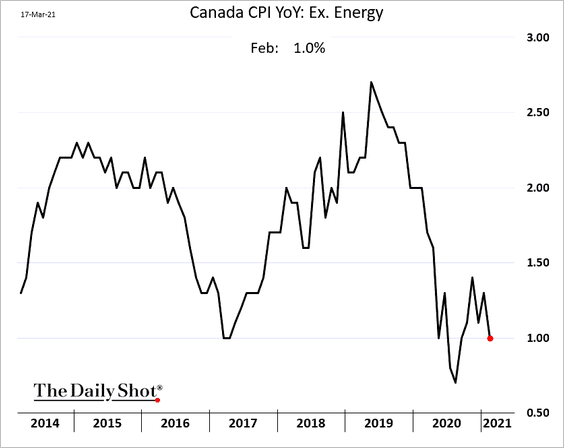
Excluding energy, the CPI declined.
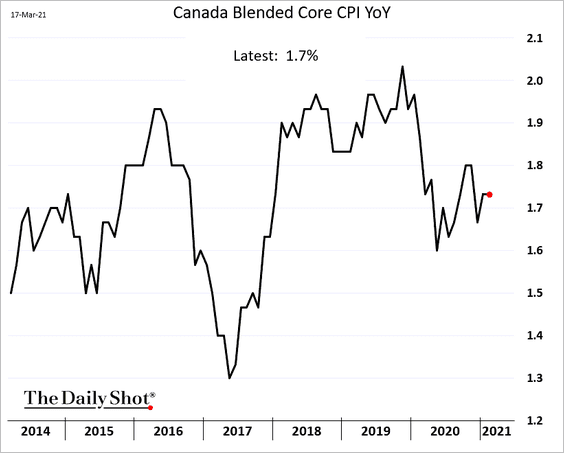
Here is the blended core CPI.
——————–
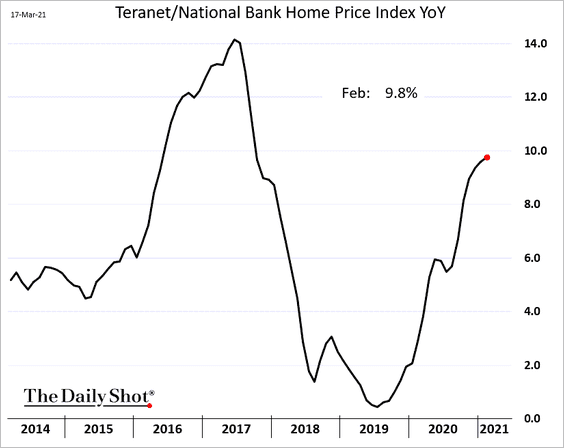
2. Home price appreciation is approaching 10%.
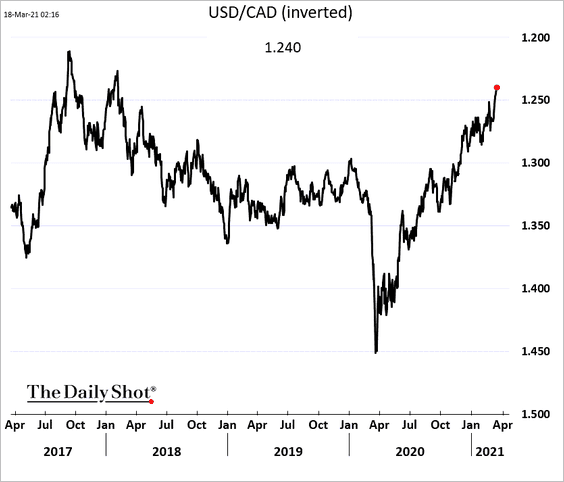
3. The loonie is at multi-year highs vs. USD.
4. The Oxford Economics recovery tracker is moving in the right direction.
![]() Source: Oxford Economics
Source: Oxford Economics
Back to Index
Europe
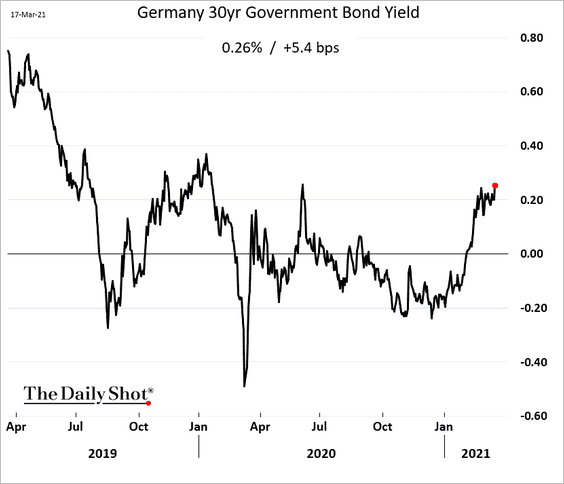
1. Longer-dated Bund yields are grinding higher.
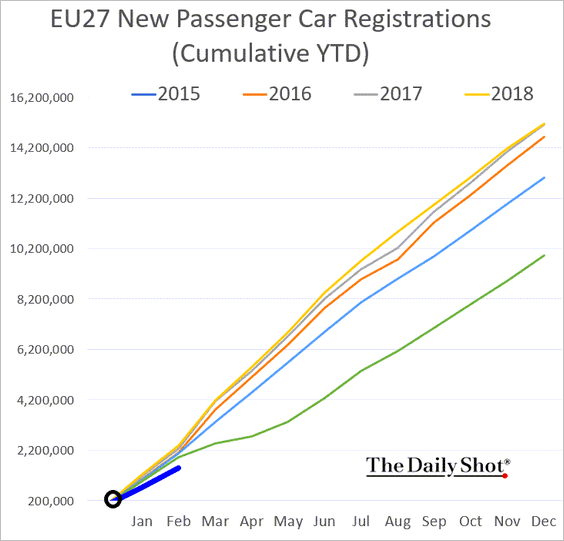
2. New car registrations in the EU remain well below previous years.
3. Many Europeans have been saving more than normal since the pandemic.
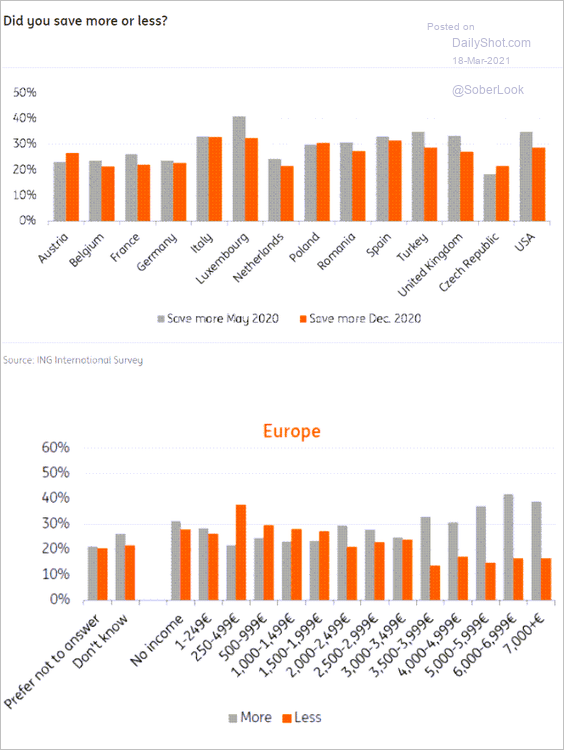 Source: ING
Back to Index
Asia – Pacific
1. The BoJ has slowed its JGB purchases.
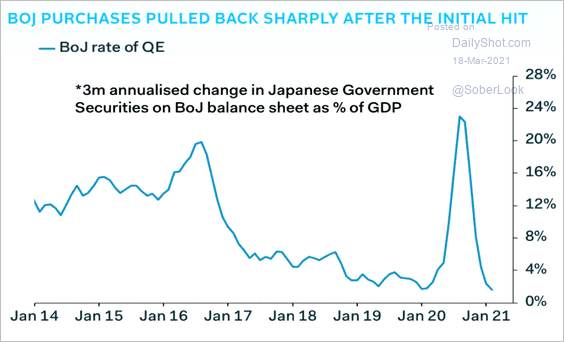 Source: Pantheon Macroeconomics
2. The iShares South Korea ETF (EWY) tends to strengthen in April.
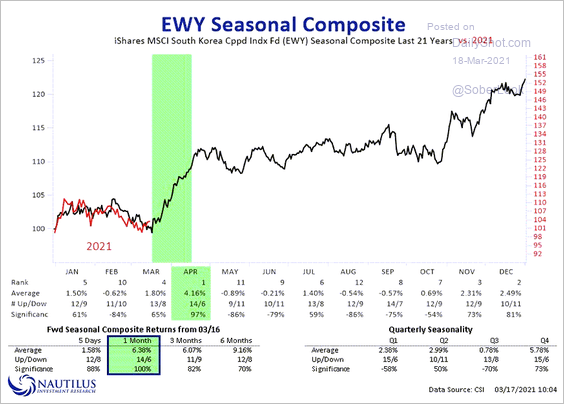 Source: @NautilusCap
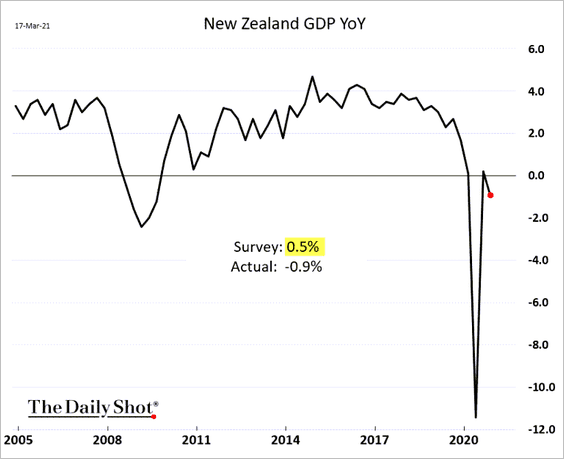
3. New Zealand’s economy unexpectedly contracted last quarter.
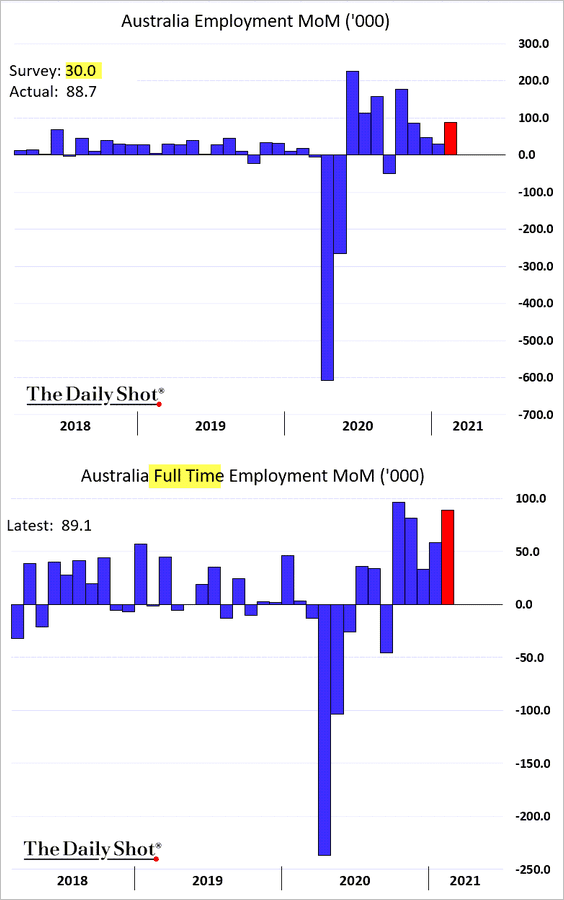
4. Next, we have some updates on Australia.
• The employment report topped market expectations.
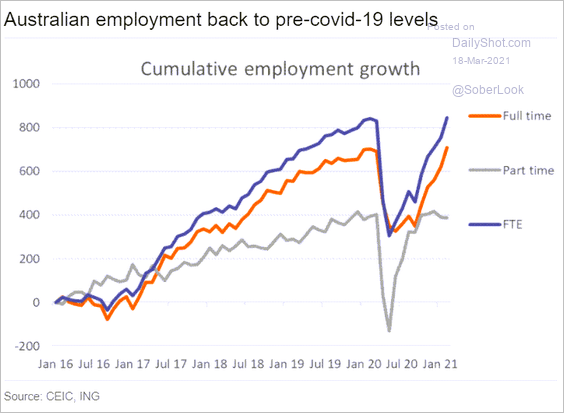 Source: ING
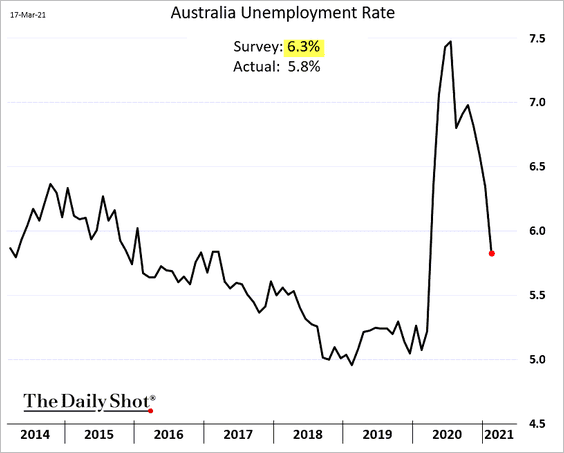
The unemployment rate dropped sharply.
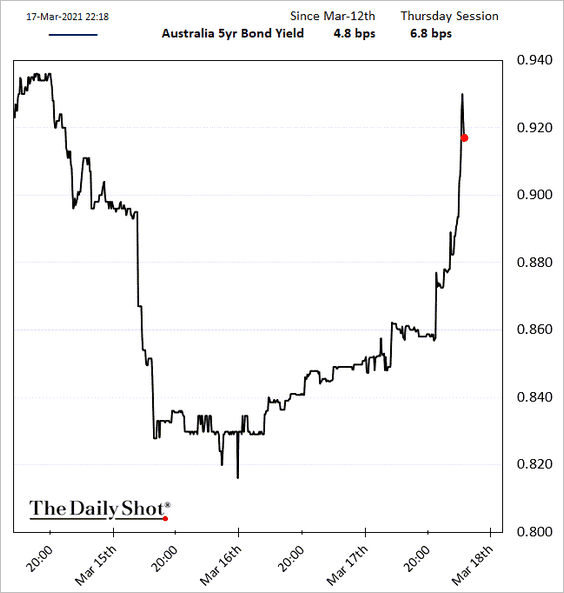
• Bond yields and the Aussie dollar climbed in response to the employment report.
• Coal exports to China have stopped.
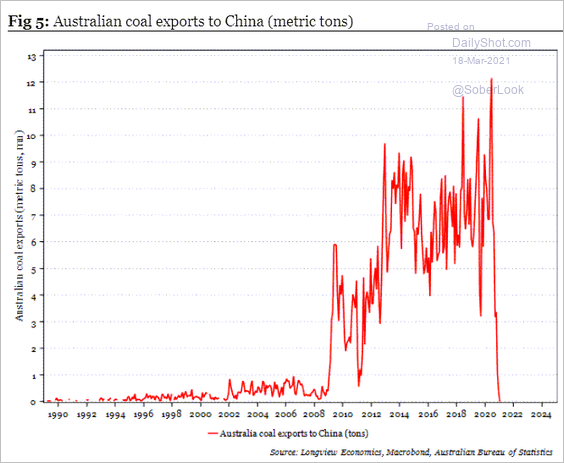 Source: Longview Economics
• Demand for higher-denomination banknotes rose sharply since the start of the pandemic.
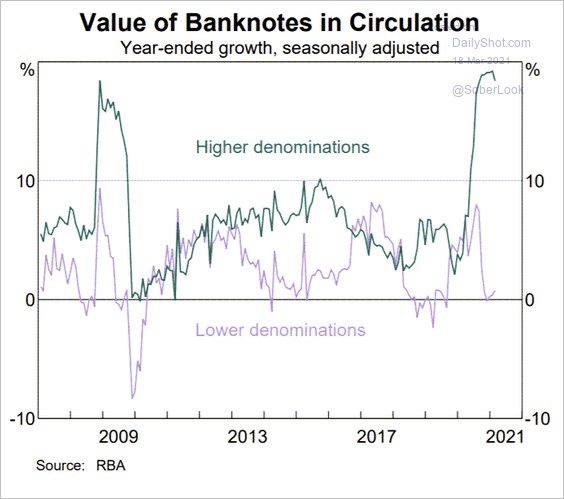 Source: RBA; @Callum_Thomas
Back to Index
Emerging Markets
1. Brazil’s central bank hiked rates by 75 bps (the market expected 50 bps). More hikes are on the way.
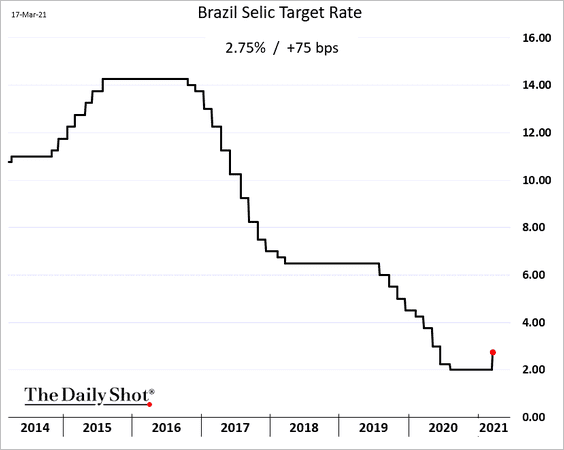
Due to reliance on floating-rate bonds, the government’s debt costs will rise rapidly as the central bank hikes.
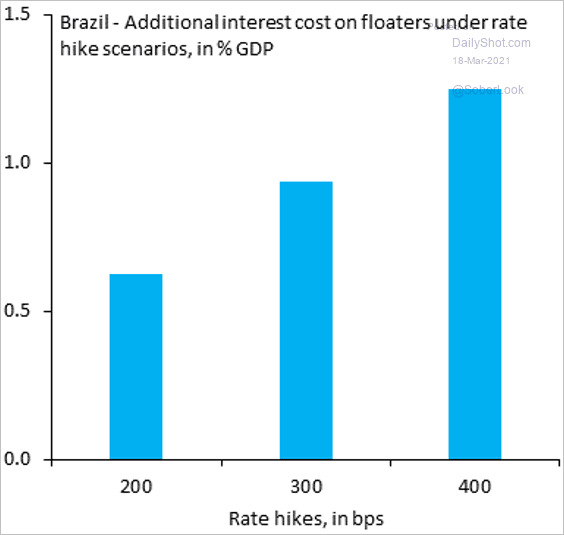 Source: @SergiLanauIIF
——————–
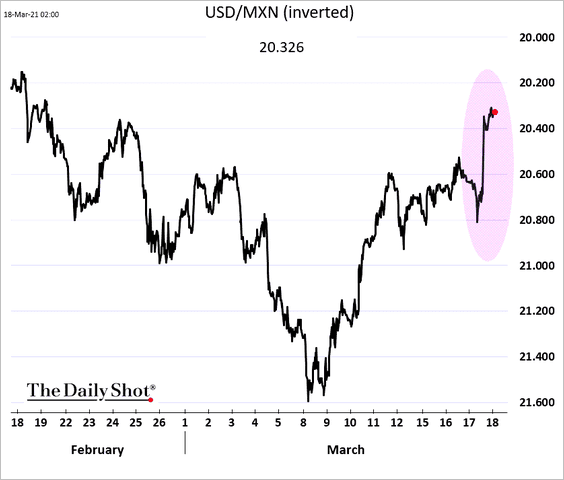
2. The Mexican peso rose sharply in response to the dovish FOMC.
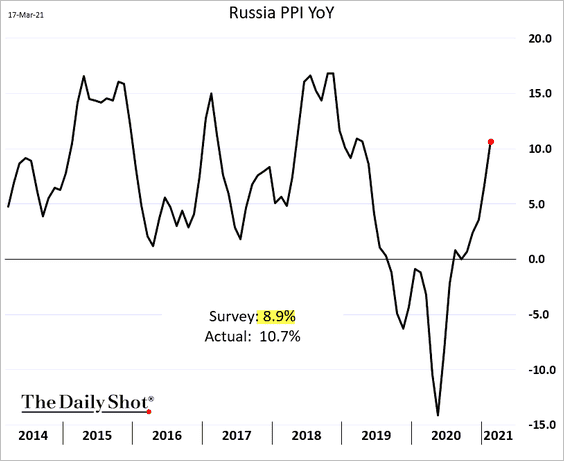
3. Russia’s producer prices are surging.
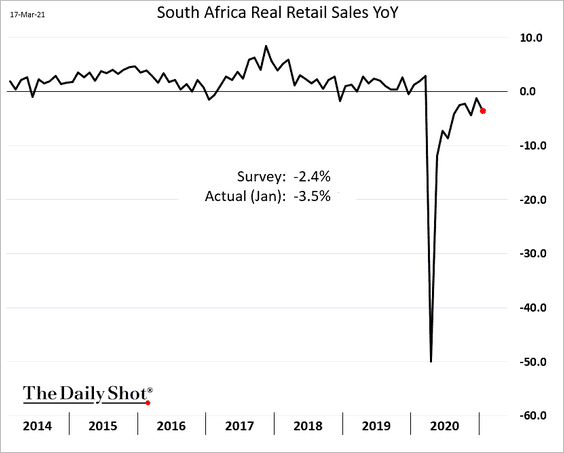
4. The recovery in South Africa’s retail sales has stalled.
5. The sharp rise in US long-term rates has translated into sizable outflows from EM.
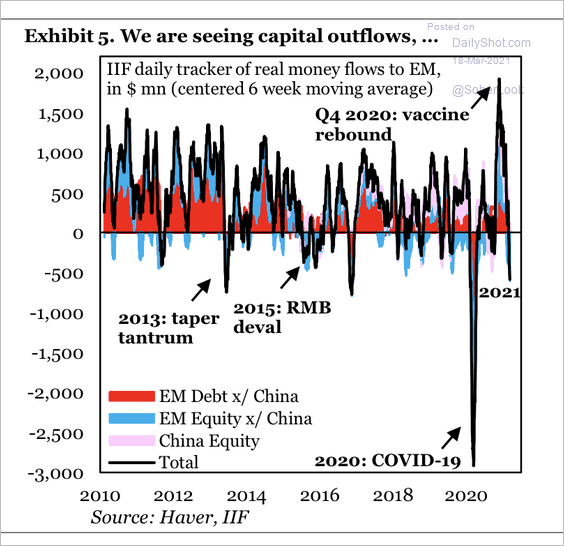 Source: IIF
6. But investor sentiment on EM stocks is very bullish.
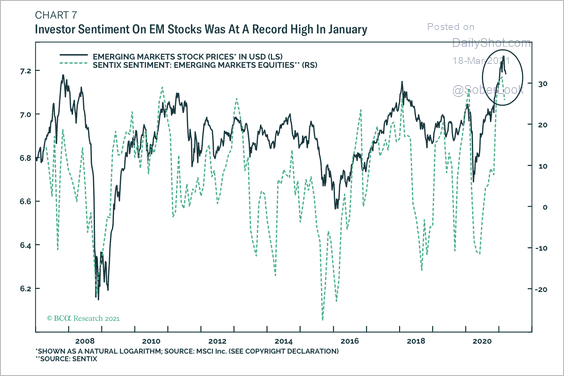 Source: BCA Research
Back to Index
Commodities
1. Copper and gold have diverged as the global economic outlook improves.
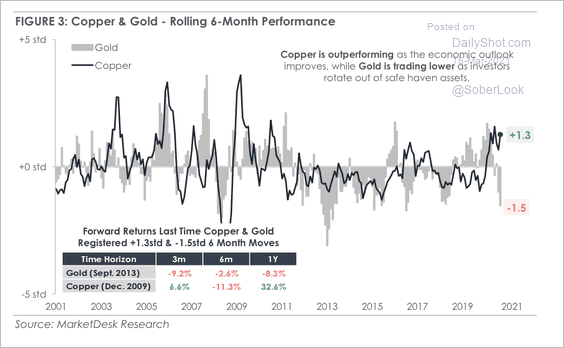 Source: MarketDesk Research
2. 86% of commodities (ex-energy and gold) are producing positive year-over-year returns, the highest since September 2011.
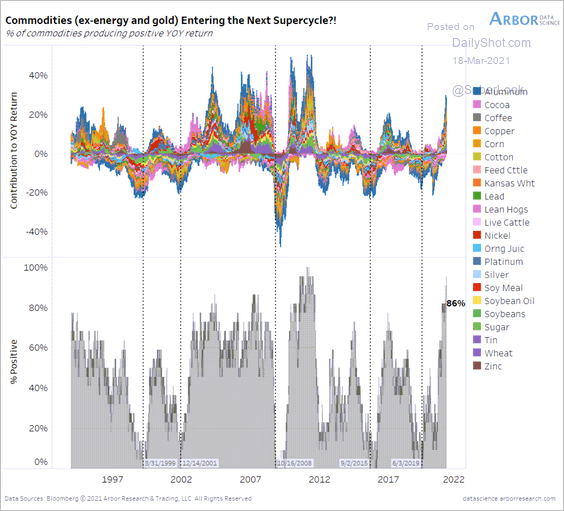 Source: Arbor Research & Trading
3. The Texas deep freeze last month created a shortage in plastics.
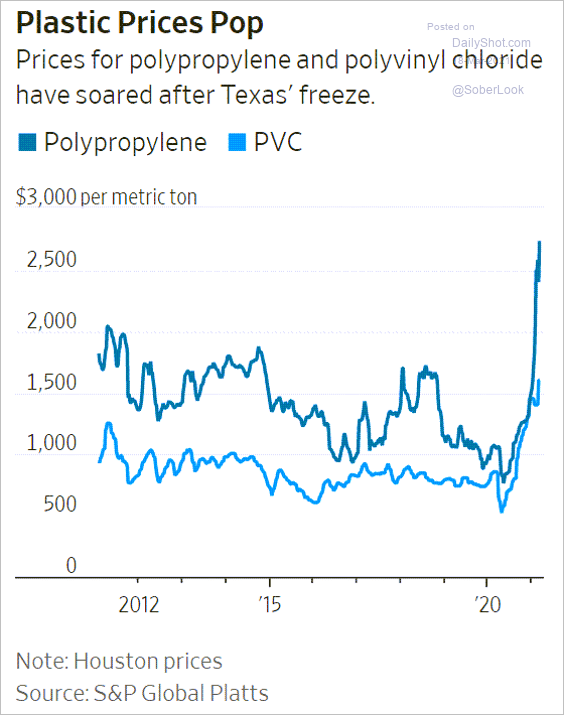 Source: @WSJ Read full article
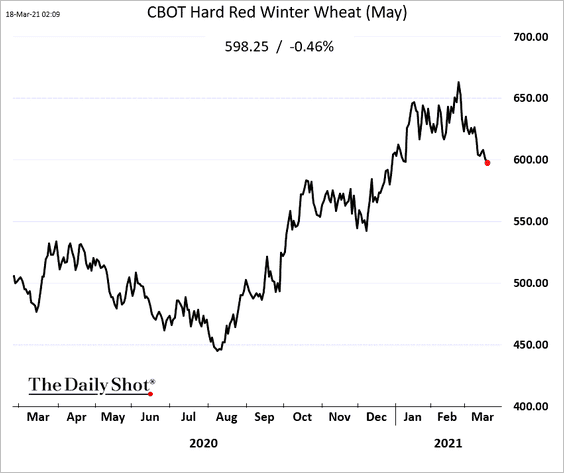
4. The US wheat rally is fading.
5. New cases of African swine fever in China have been boosting US lean hog prices but could be bad news for soybean meal (which is used to feed pigs).
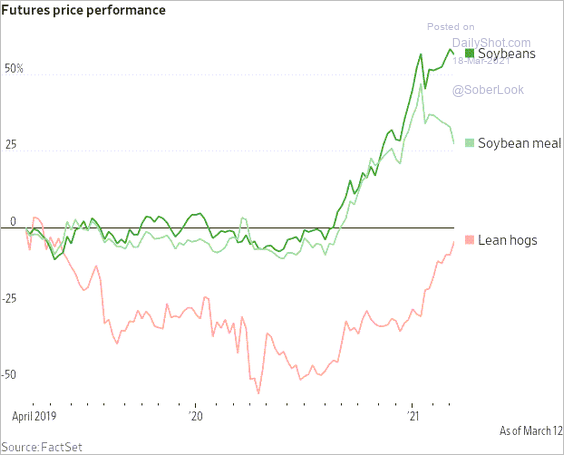 Source: @WSJ Read full article
Back to Index
Energy
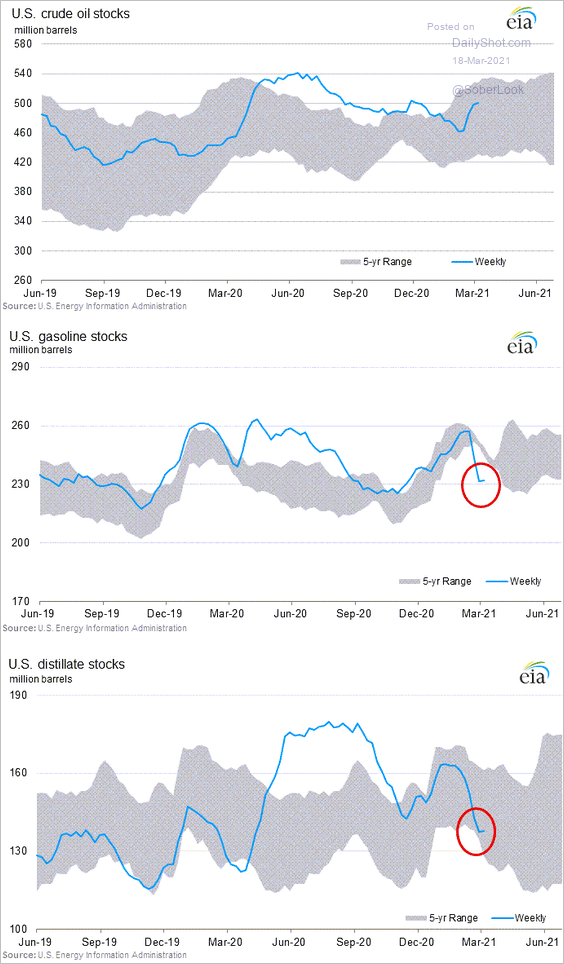
1. US refinery inputs continue to improve.
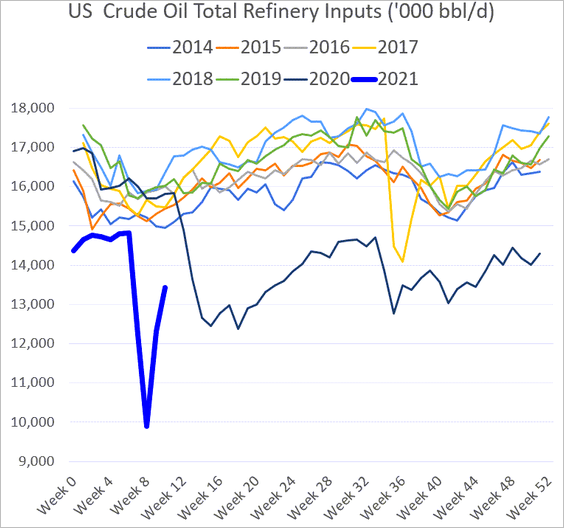
Gasoline and distillates inventories are no longer declining.
——————–
2. US retail gasoline prices have increased for 45 consecutive days.
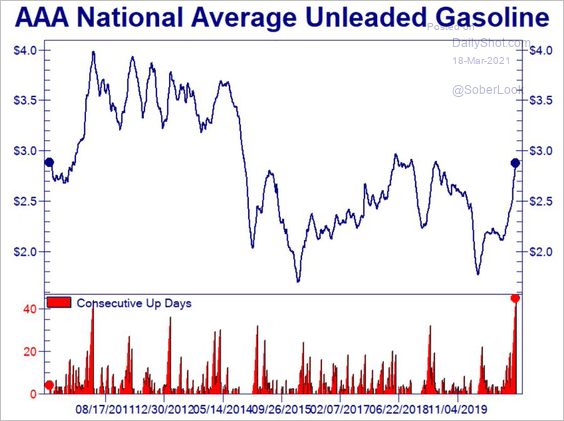 Source: @Not_Jim_Cramer
3. Has gasoline demand peaked?
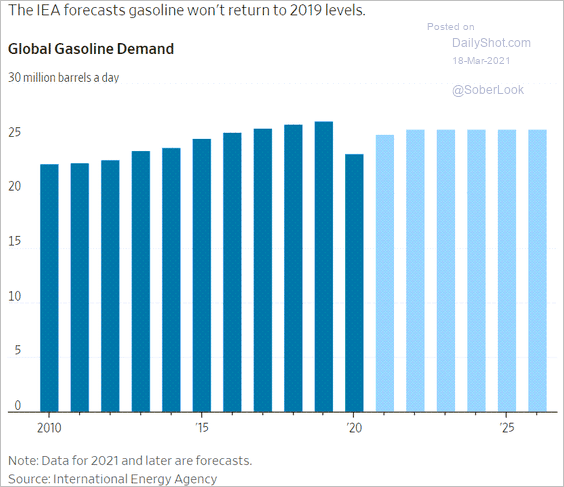 Source: @WSJ Read full article
4. Deutsche Bank estimates an $80 WTI oil price by the end of the year.
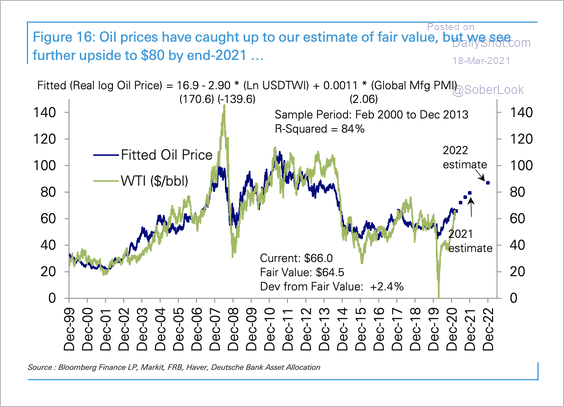 Source: Deutsche Bank Research
Back to Index
Equities
1. Value stocks are quickly becoming part of the momentum factor.
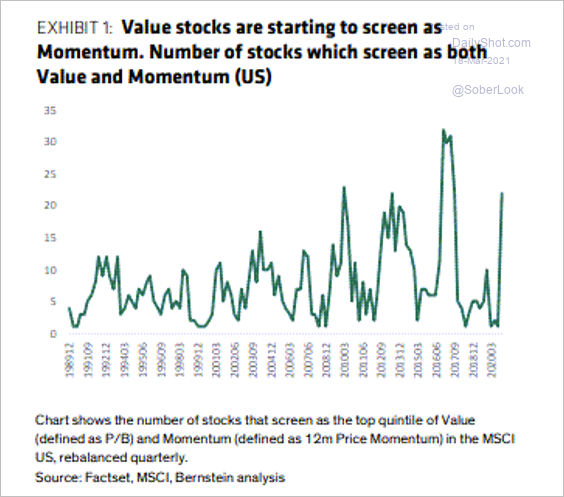 Source: Bernstein; @daniburgz
2. US small-cap value stocks have significantly outperformed large-cap growth stocks in recent months.
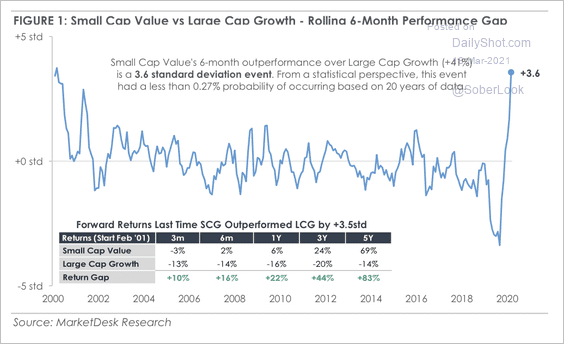 Source: MarketDesk Research
3. Cyclical sectors have outperformed over the past six months but are at risk of being overbought relative to historical averages.
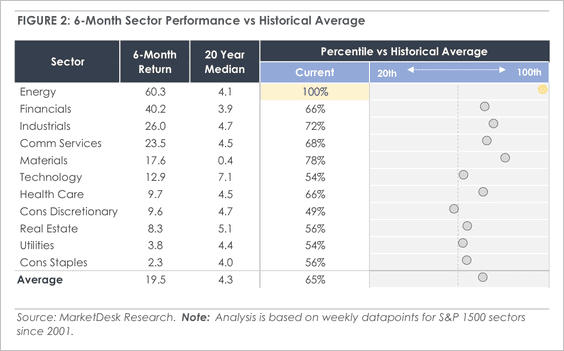 Source: MarketDesk Research
4. The market is increasingly focused on inflation.
• Fund managers’ inflation expectations:
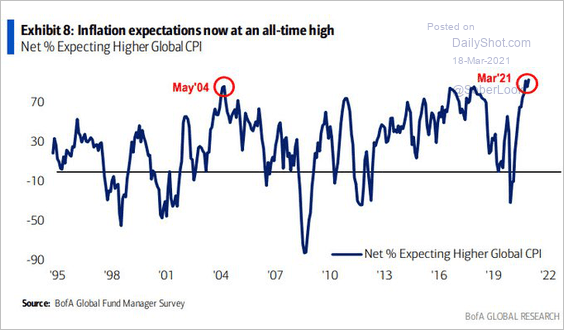 Source: BofA Global Research; @GlobalTelevsion
• S&P 500 companies mentioning inflation during earnings calls:
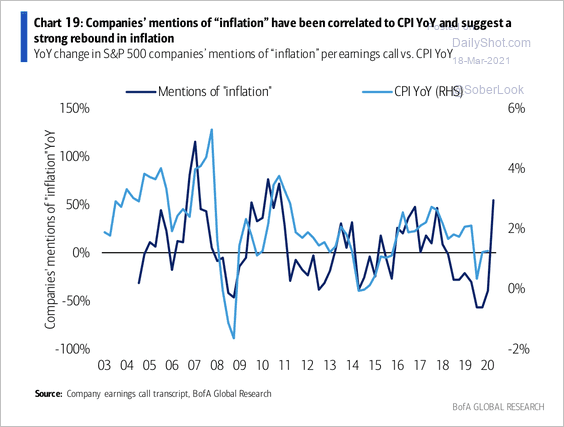 Source: BofA Global Research
——————–
5. How have US active equity funds performed on a 3-year basis?
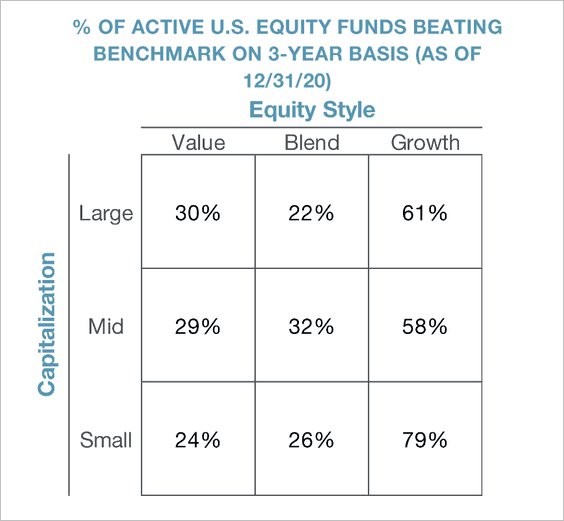 Source: Piper Sandler
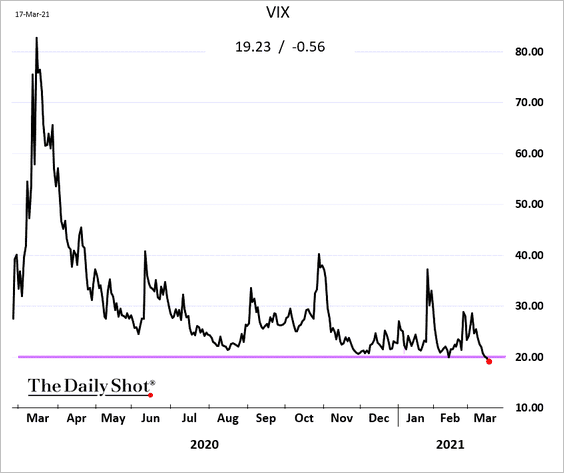
6. VIX is now firmly below 20 in response to the Fed’s dovish stance.
7. A good portion of the new government checks will be headed into the equity market (2 charts).
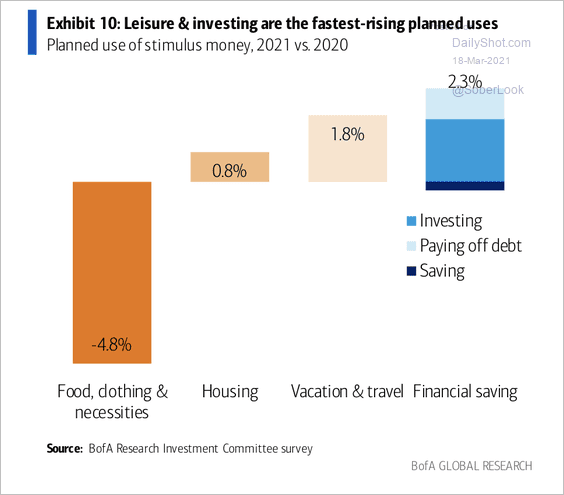 Source: BofA Global Research
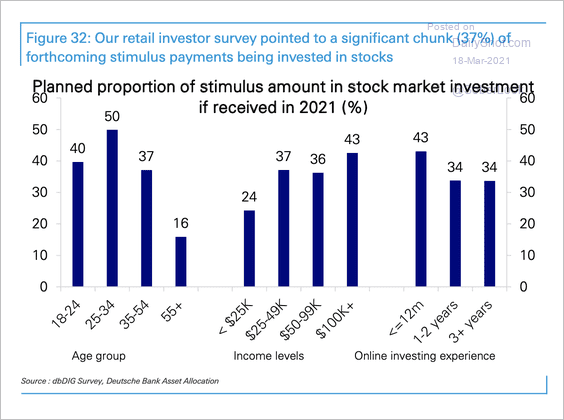 Source: Deutsche Bank Research
Back to Index
Rates
1. It’s been a tough few months for longer-dated Treasuries (2 charts).
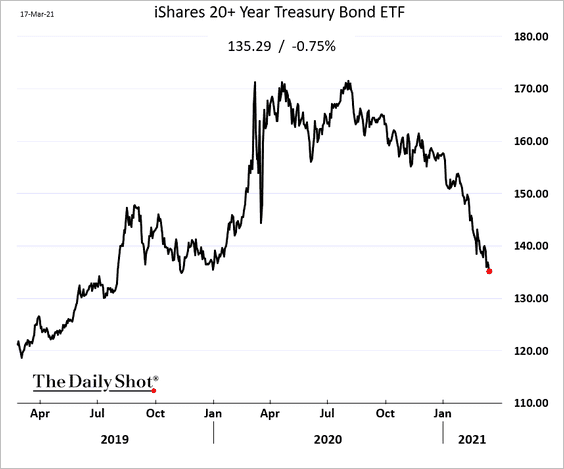
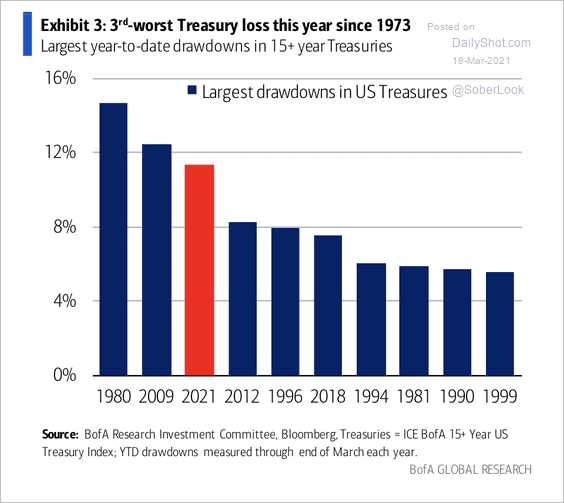 Source: BofA Global Research
——————–
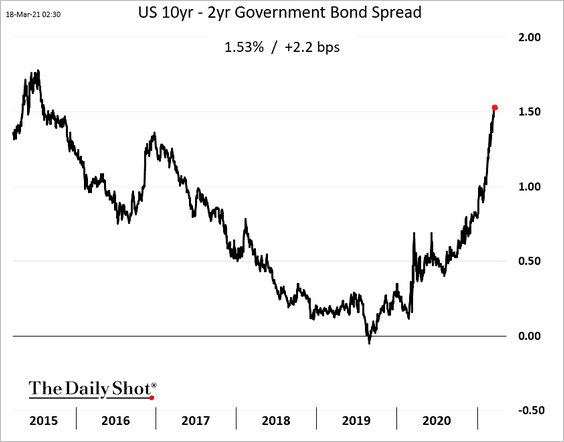
2. The yield curve continues to steepen.
3. Nominal yields have detached from inflation expectations.
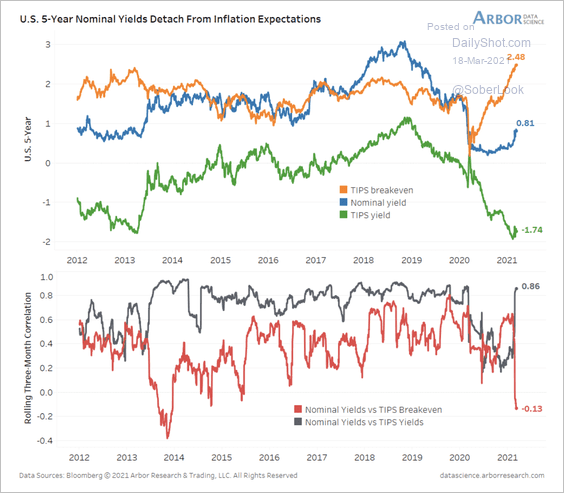 Source: Arbor Research & Trading
4. Recent gains in Treasury yields have been driven by rising term premium rather than the risk-neutral yield (short-term rate expectations).
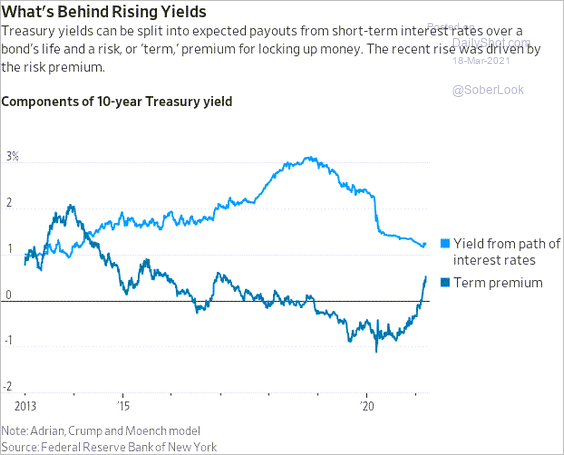 Source: @WSJ Read full article
——————–
Food for Thought
1. Radio’s media reach:
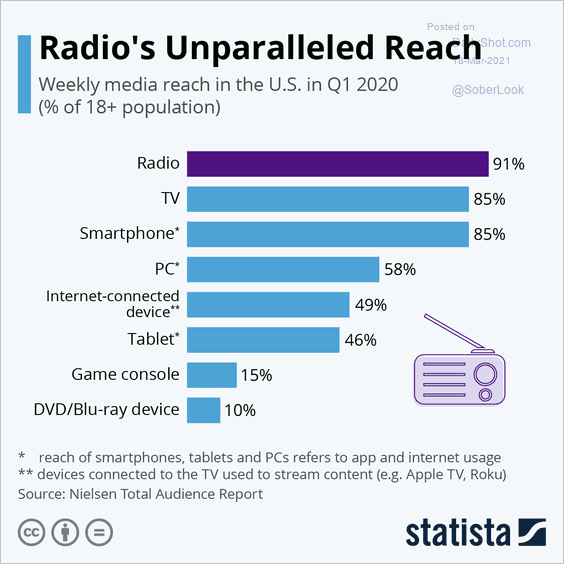 Source: Statista
2. Spending on welfare:
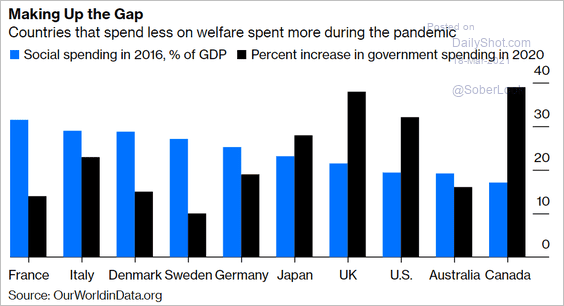 Source: @noahpinion, @bopinion Read full article
3. The US budget surplus/deficit since 1855:
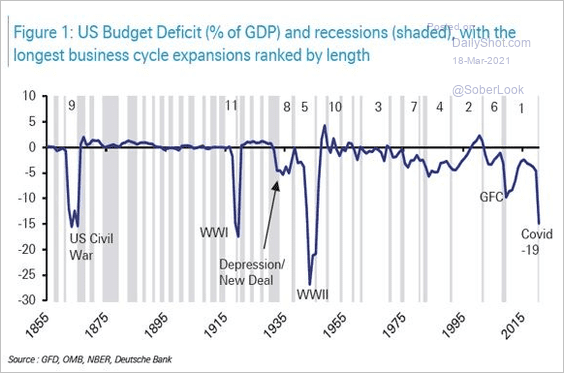 Source: Deutsche Bank Research
4. Views on student loan forgiveness:
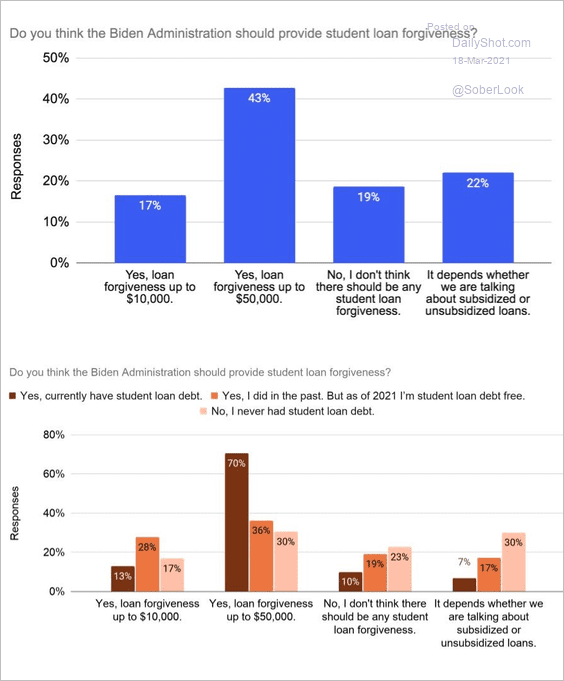 Source: Invisibly Read full article
5. Why make payments on student loans when debt forgiveness is coming?
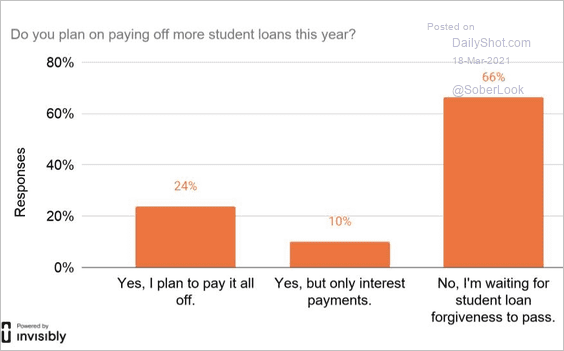 Source: Invisibly Read full article
6. Equality vs. life expectancy:
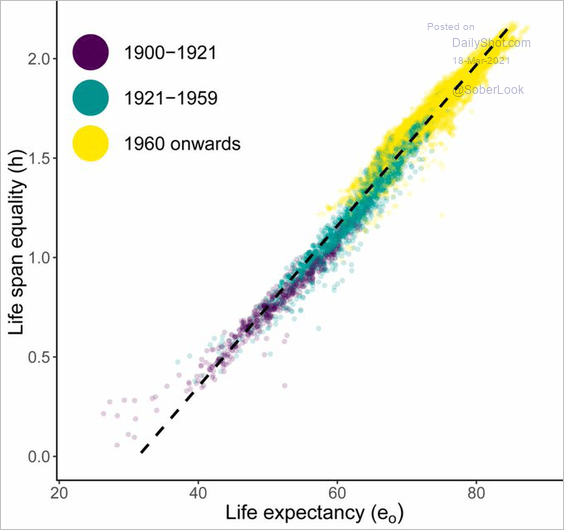 Source: @MaxCRoser
7. How partnered US adults met:
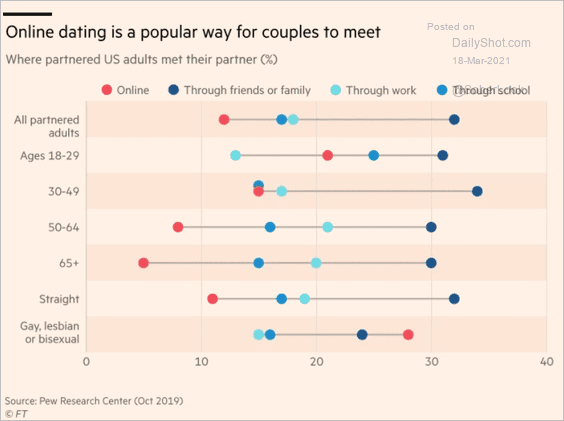 Source: @financialtimes Read full article
8. COVID cases in the US vs. EU:
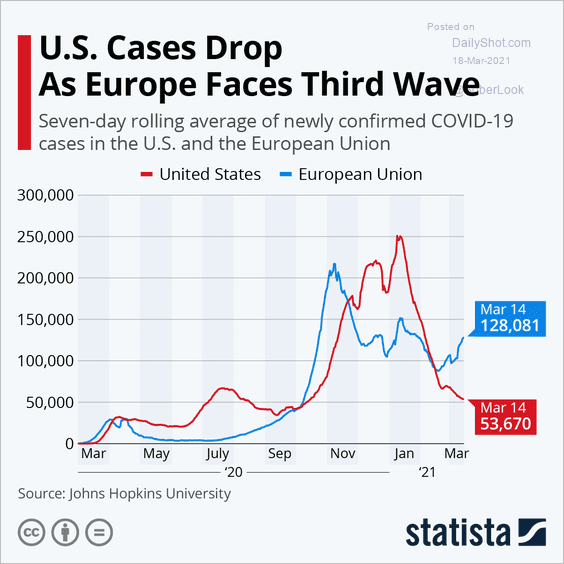 Source: Statista
9. Knowing someone who had COVID:
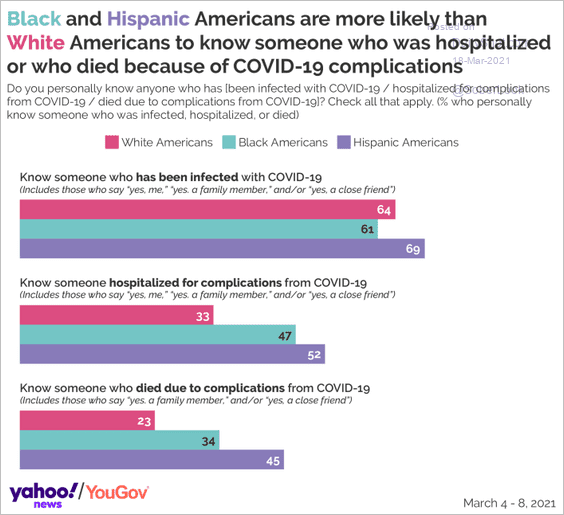 Source: @YouGovAmerica Read full article
10. March madness:
 Source: American Gaming Association
——————–
Back to Index