
The Daily Shot: 31-Mar-21
• The United States
• The United Kingdom
• The Eurozone
• Europe
• Asia – Pacific
• China
• Emerging Markets
• Cryptocurrency
• Commodities
• Equities
• Alternatives
• Credit
• Rates
• Global Developments
• Food for Thought
The United States
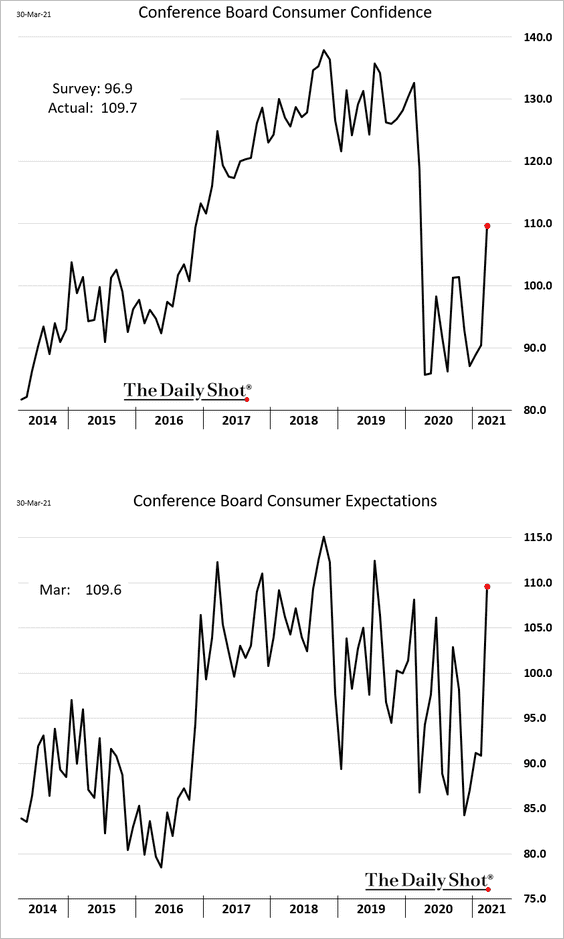
1. The Conference Board’s consumer confidence index surged in March, topping forecasts.
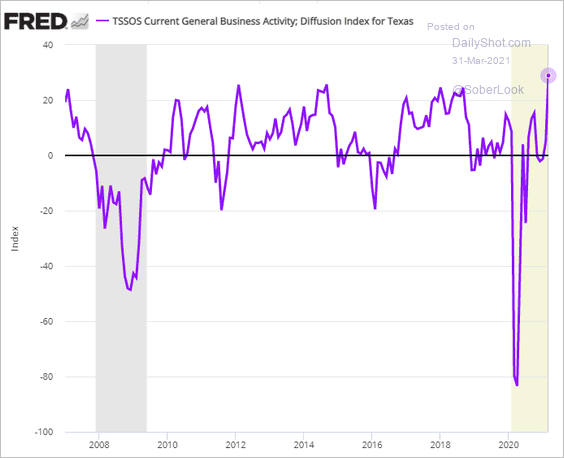
2. The Dallas Fed’s regional nonmanufacturing reports (see map) showed accelerating growth.
• Retail:
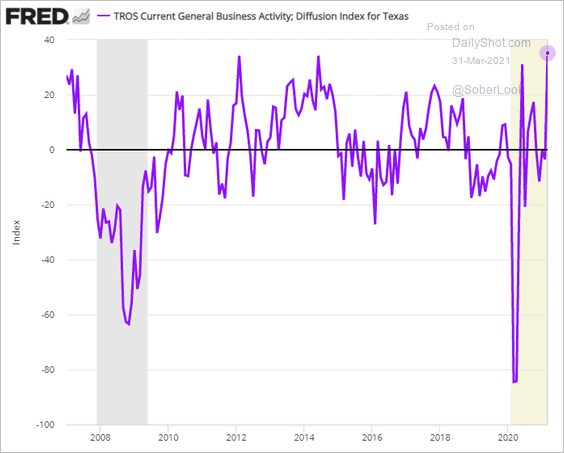
• Services:
——————–
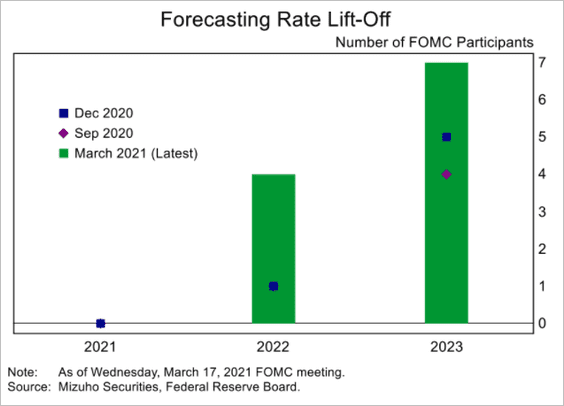
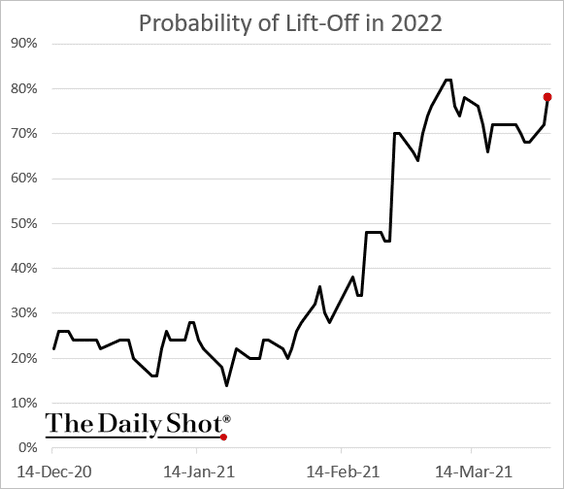
3. As discussed previously, only four FOMC members expect a rate hike (liftoff) next year.
 Source: Mizuho Securities USA
However, the market continues to assign close to an 80% probability of liftoff in 2022. It’s important to note that the Fed will not raise rates while conducting QE. It means that the central bank will need to announce tapering as soon as late this year to gradually reduce securities purchases. Given the Fed officials’ statements, that seems unlikely. There is a clear disconnect between the markets and the Fed’s communications.
——————–
4. How many jobs were created in March? The consensus estimate is 650k.
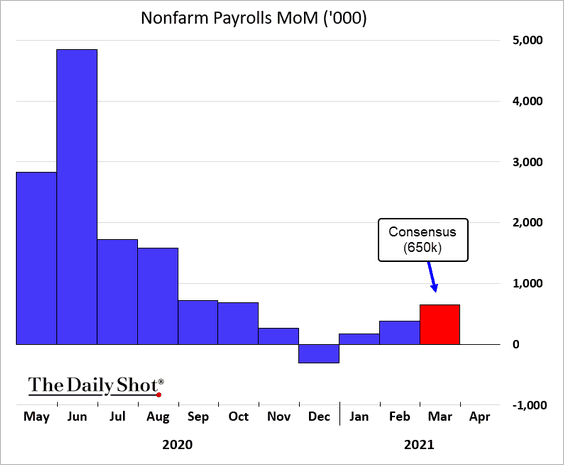
Here is a forecast from Oxford Economics.
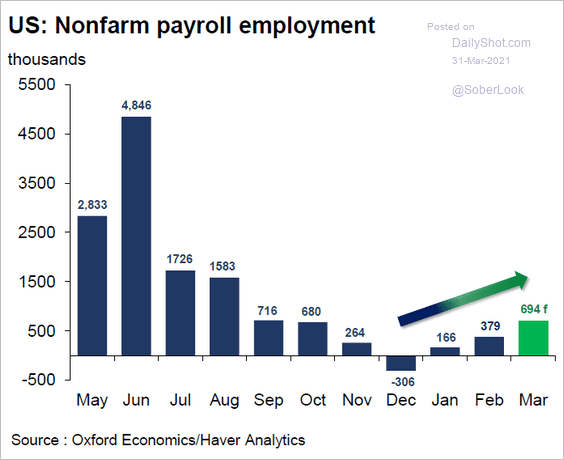 Source: Oxford Economics
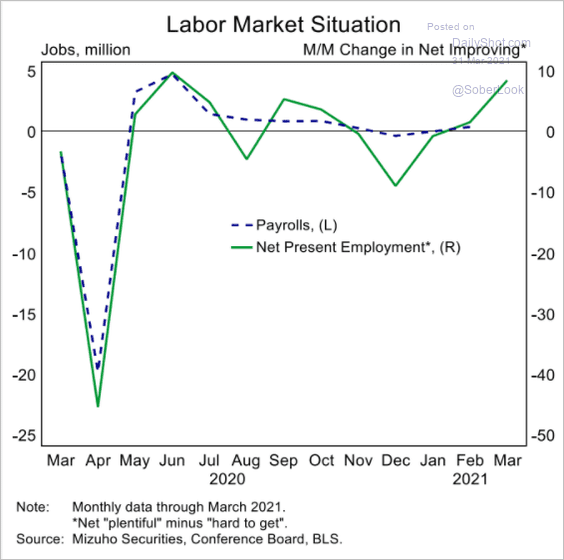
• The Conference Board’s labor differential (“jobs plentiful” – “jobs hard to get”) is rebounding.
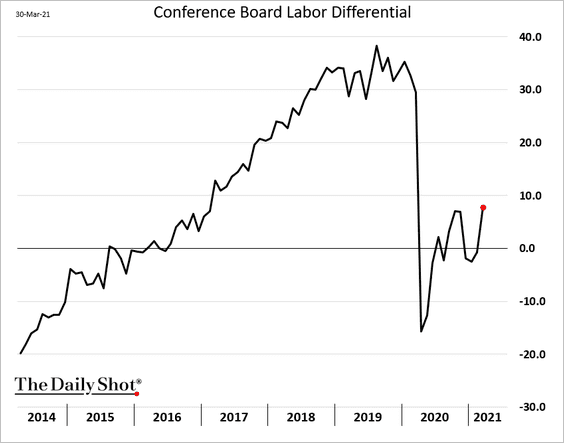
Here is the same index (month-over-month) plotted against the payrolls data.
 Source: Mizuho Securities USA
——————–
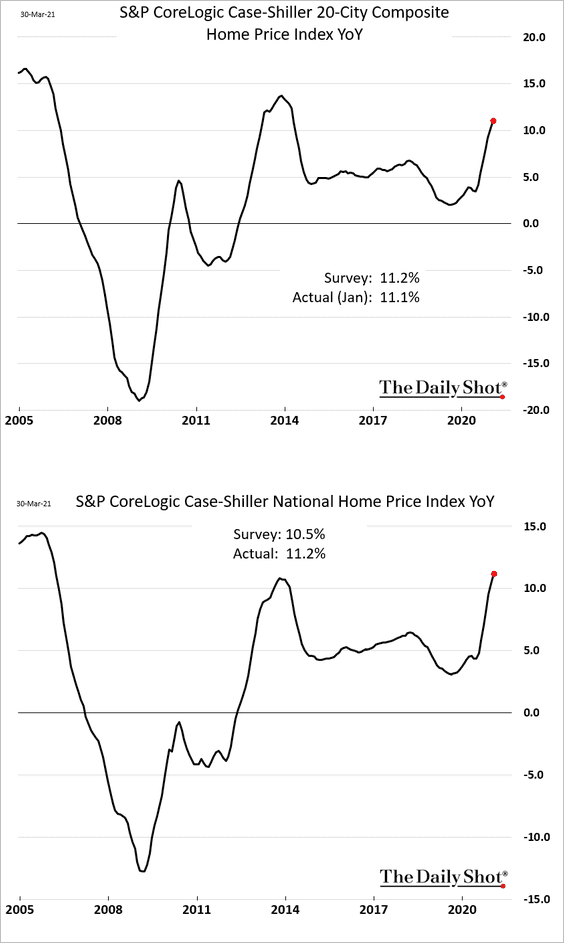
5. Next, we have some updates on the housing market.
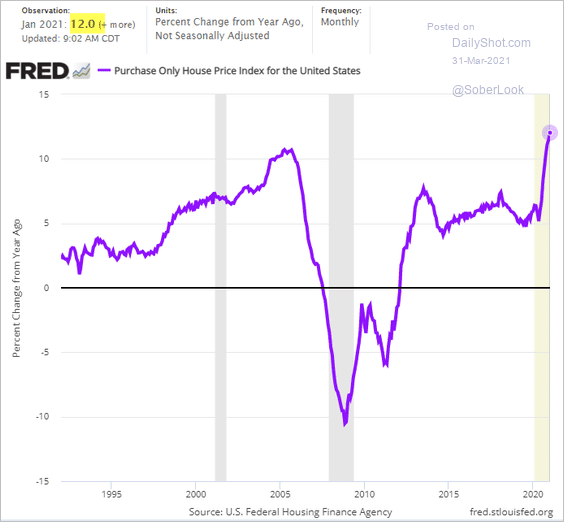
• Home price appreciation continues to climb.
– The Case-Shiller index:
– FHFA’s index:
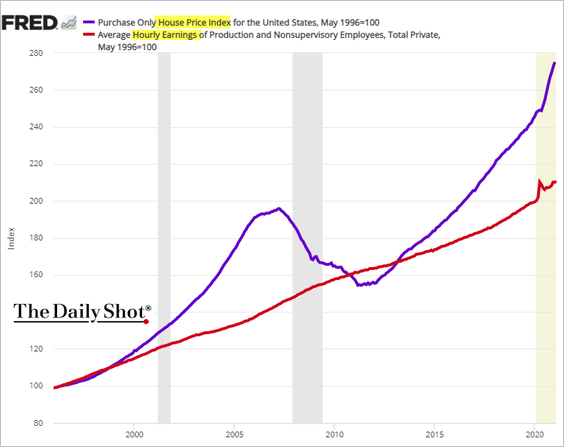
• Home price gains are increasingly outpacing wages.
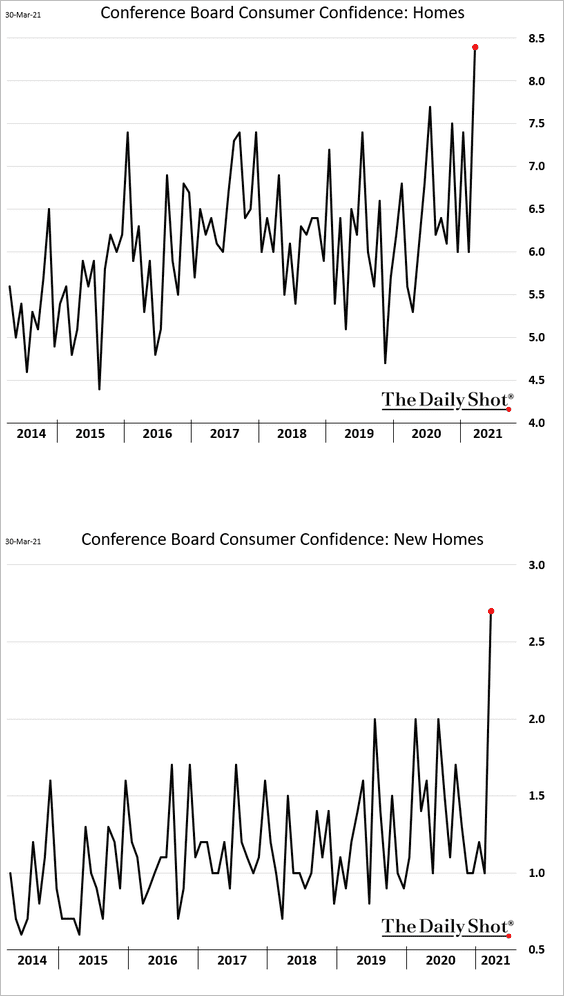
• According to the Conference Board, consumers are upbeat about the housing market.
• This chart shows the supply of homes by price tier.
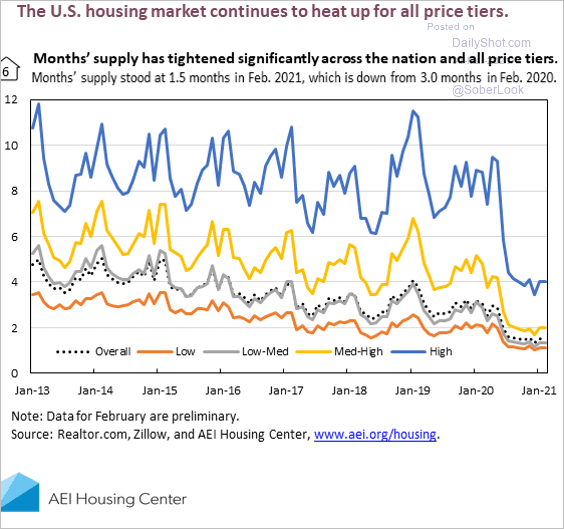 Source: AEI Housing Center
• Homeownership rates for all age cohorts bottomed between 2015 and 2018.
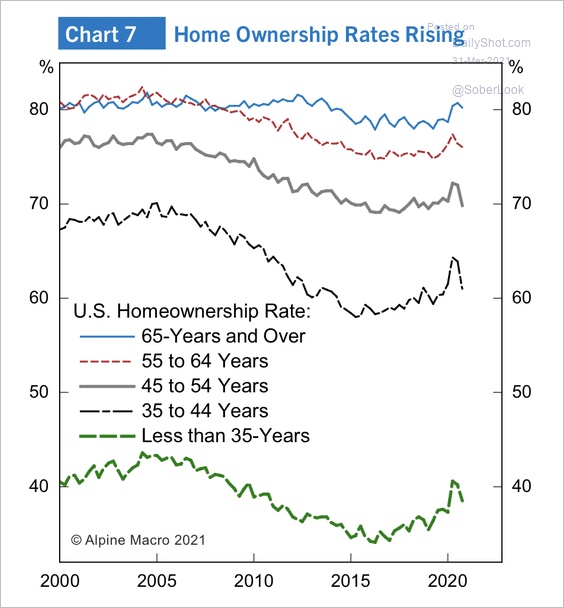 Source: Alpine Macro
• The mortgage debt-service ratio is still near historic lows.
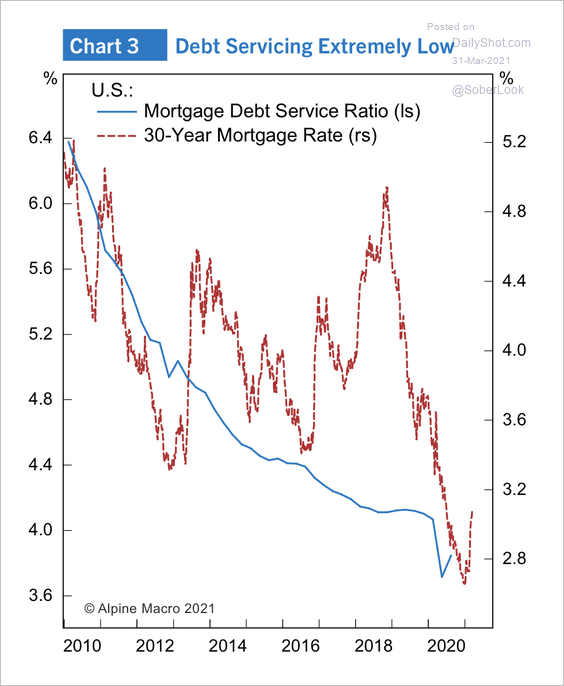 Source: Alpine Macro
• Refi mortgage applications are down as rates climb.
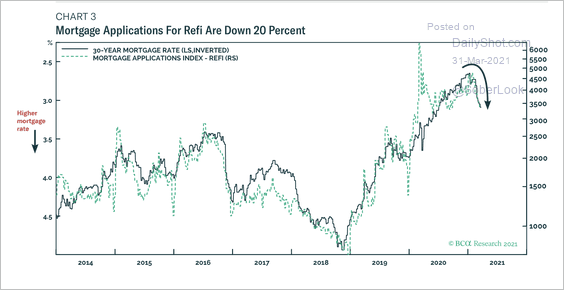 Source: BCA Research
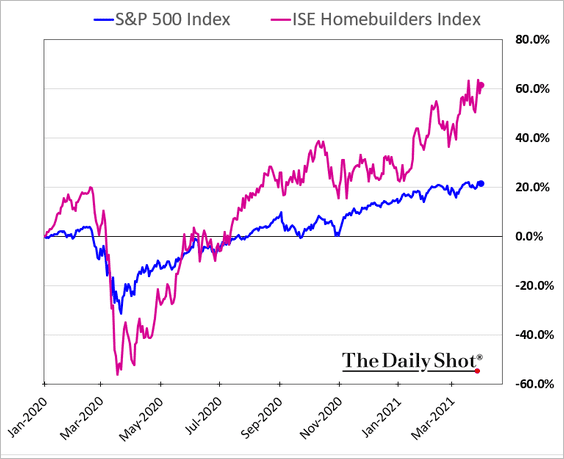
• Homebuilders’ shares continue to outperform.
——————–
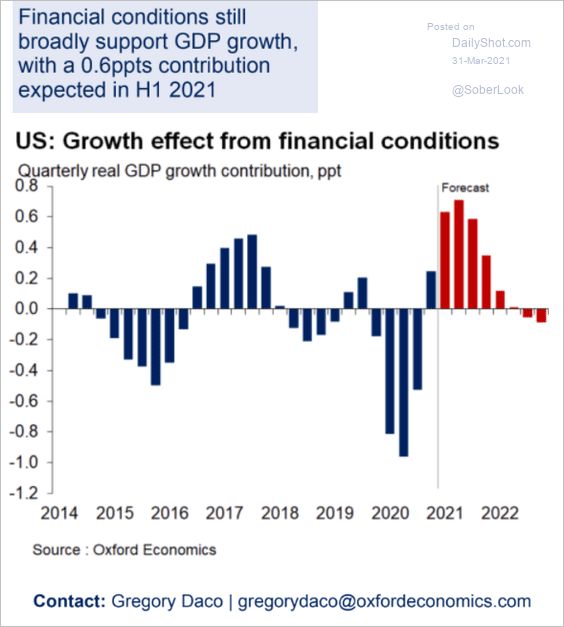
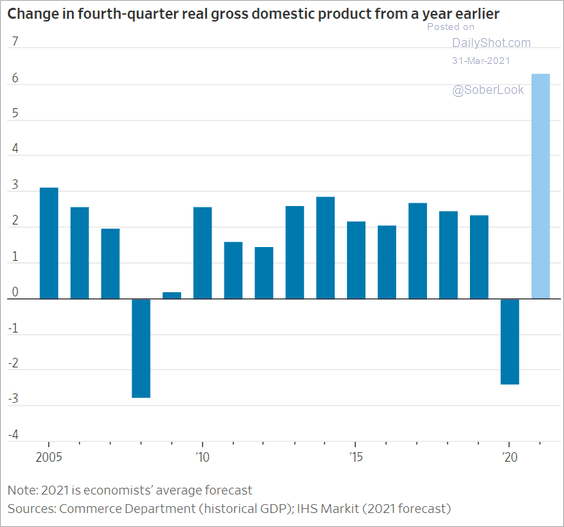
6. Accommodative financial conditions should boost GDP growth over the next few quarters.
 Source: Oxford Economics
7. US business activity (measured by PMIs) is outperforming the rest of the world.
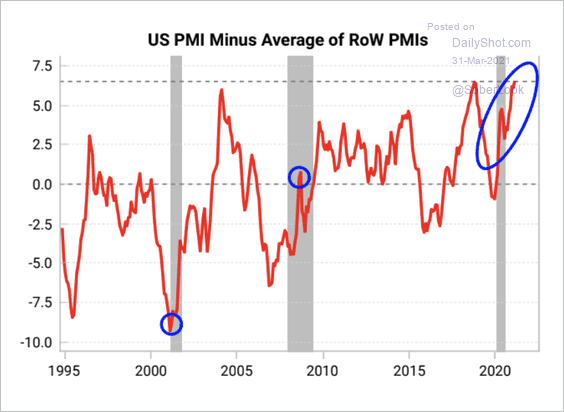 Source: Variant Perception
The US contribution to the world’s GDP is expected to be the highest since 1999.
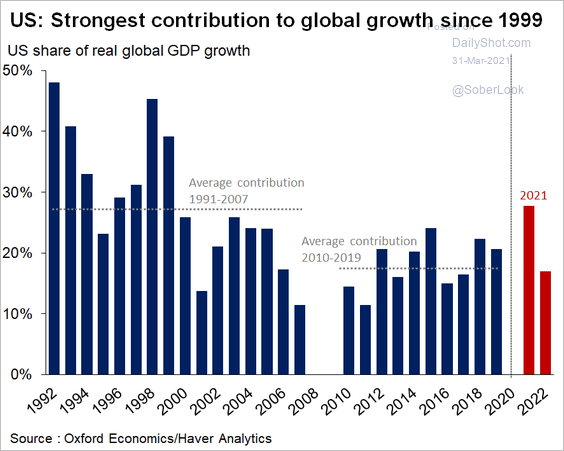 Source: @GregDaco, @OxfordEconomics
 Source: @WSJ Read full article
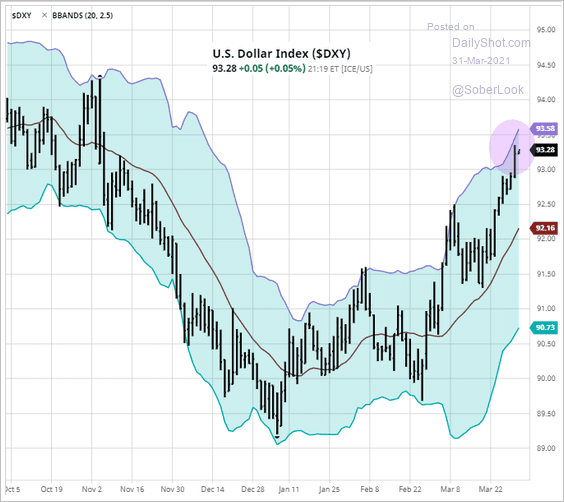
Combined with the vaccine progress, the nation’s economic outperformance is boosting the US dollar.
 Source: barchart.com, h/t @Tobin_Tweets
Back to Index
The United Kingdom
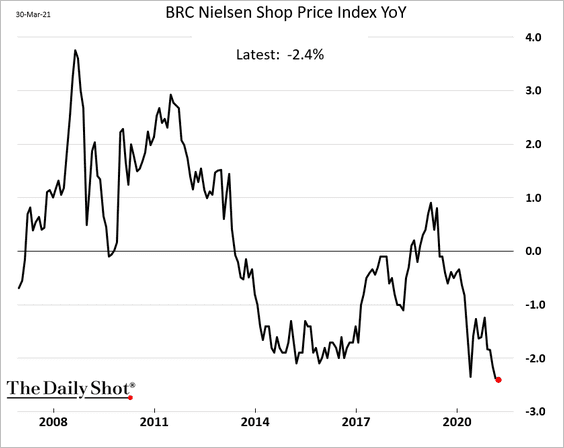
1. The BRC Shop Price index is still in deflation amid heavy discounting.
 Source: Yahoo! Finance Read full article
——————–
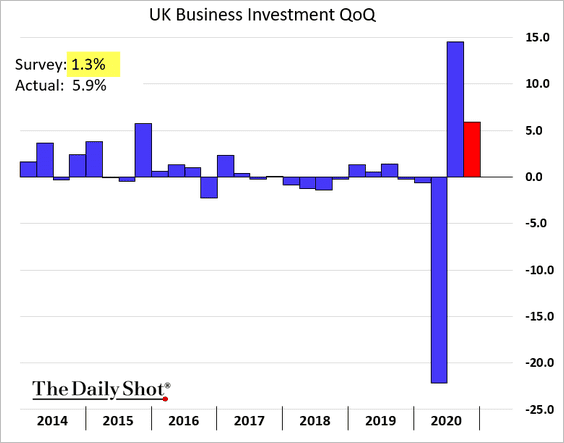
2. Last quarter’s business investment was stronger than initially reported.
3. UK demographics don’t look promising for growth.
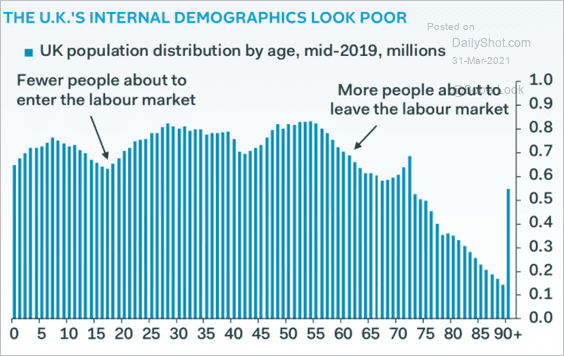 Source: Pantheon Macroeconomics
Back to Index
The Eurozone
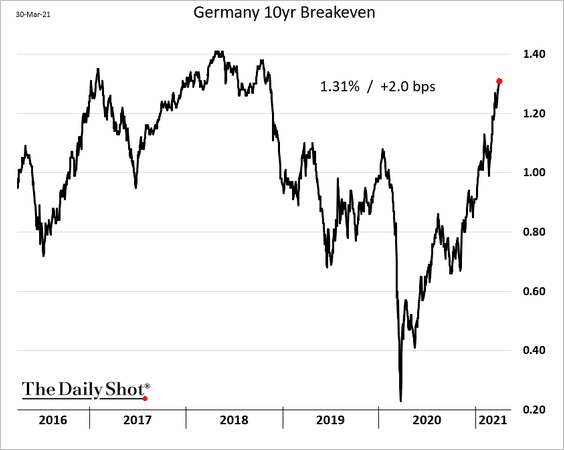
1. Germany’s inflation climbed further, in line with expectations.
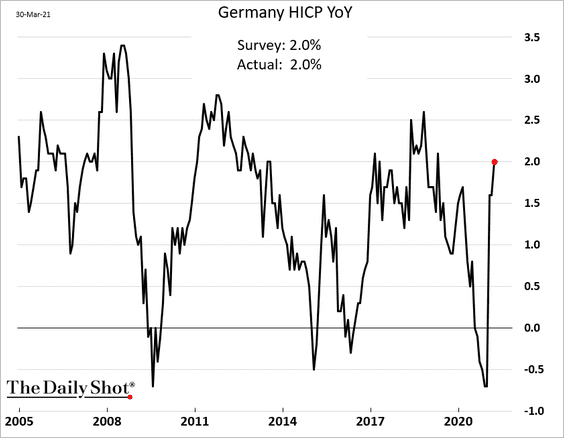
Energy was a significant factor in the latest increase.
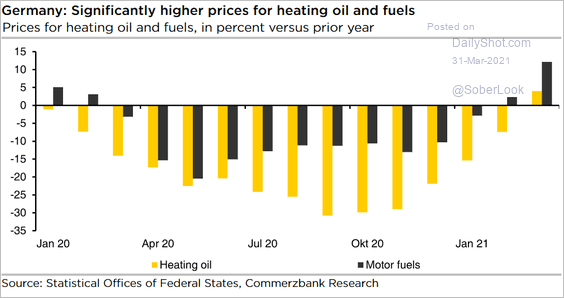 Source: Commerzbank Research
Market-based inflation expectations continue to rise.
——————–
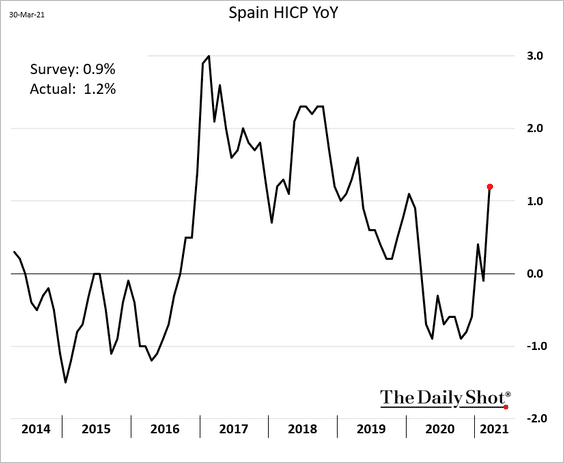
2. Spain’s CPI jumped as well.
The combination of German and Spanish CPI reports points to inflation gains at the Eurozone level.
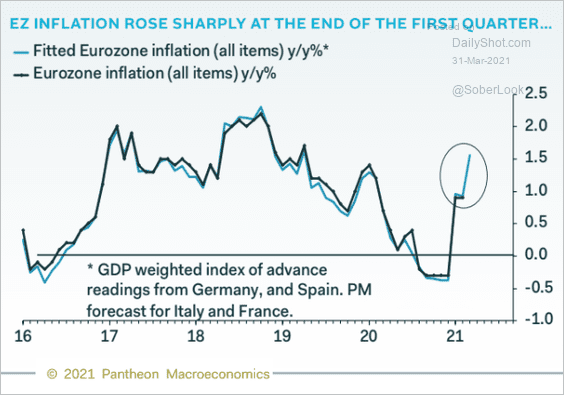 Source: Pantheon Macroeconomics
——————–
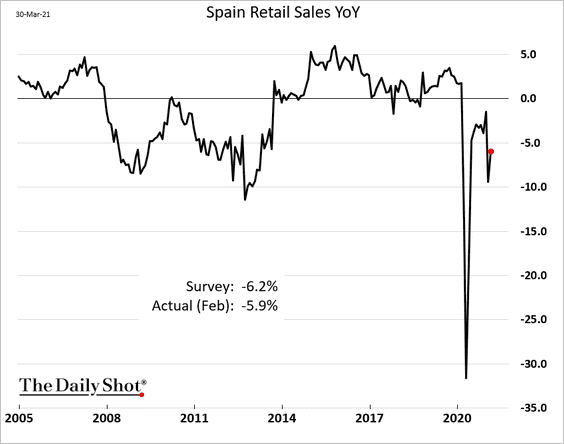
3. Spain’s retail sales rose in February.
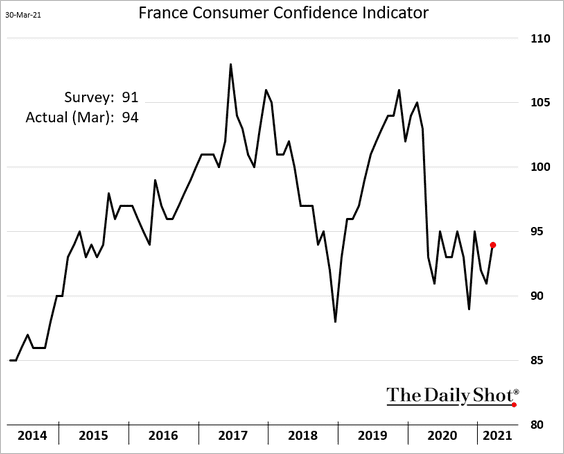
4. French consumer confidence ticked higher.
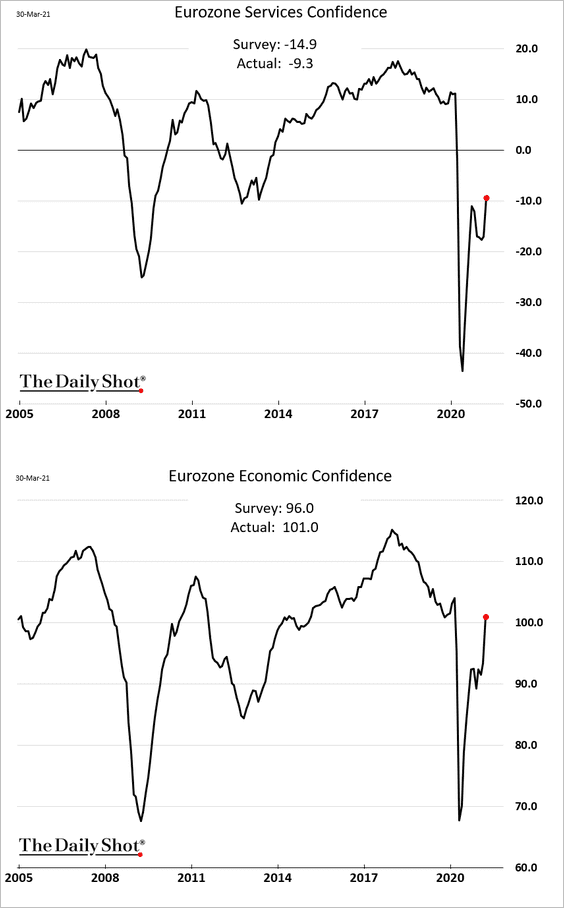
5. Confidence indicators at the Eurozone level surprised to the upside.
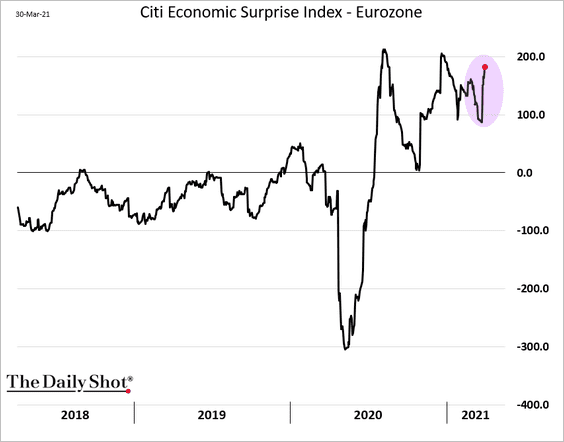
The combination of strong PMI reports and sentiment measures boosted the Citi Economic Surprise Index.
——————–
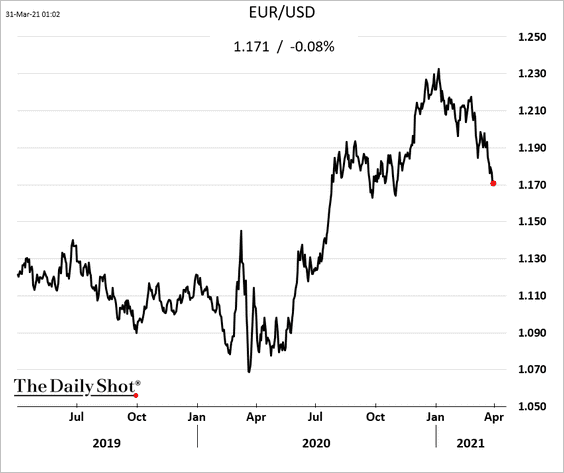
6. The euro has been weakening.
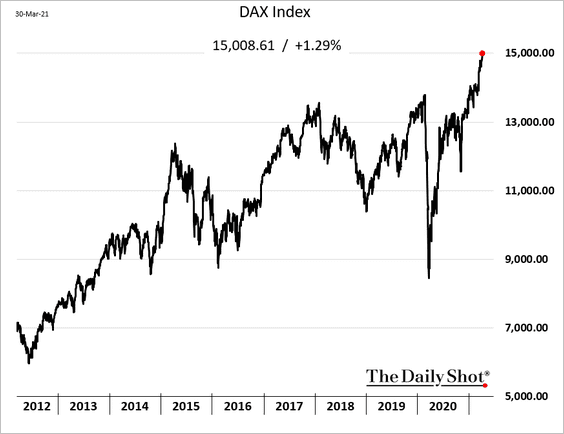
7. Germany’s DAX index hit a record high.
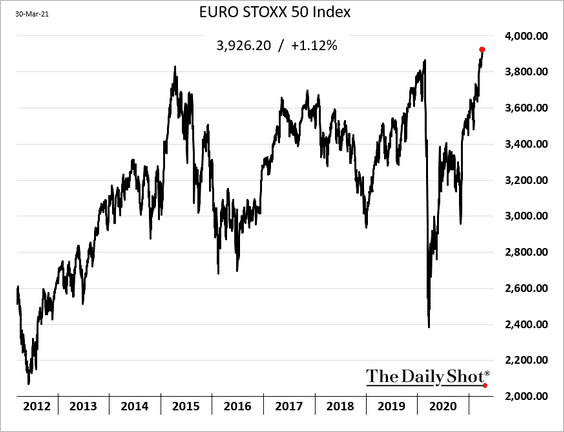
Here is the Stoxx 50 Index.
This chart shows the percentage of STOXX 600 companies reporting revenues that are above or below estimates.
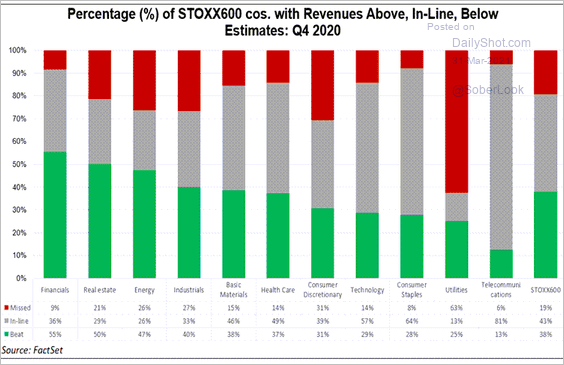 Source: @FactSet Read full article
Back to Index
Europe
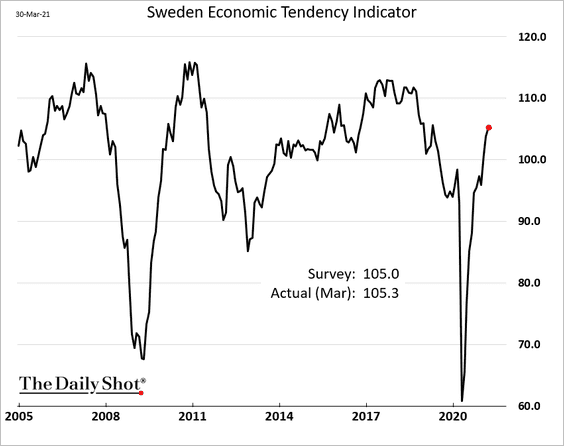
1. Sweden’s economic confidence (business + consumer) continues to rebound.
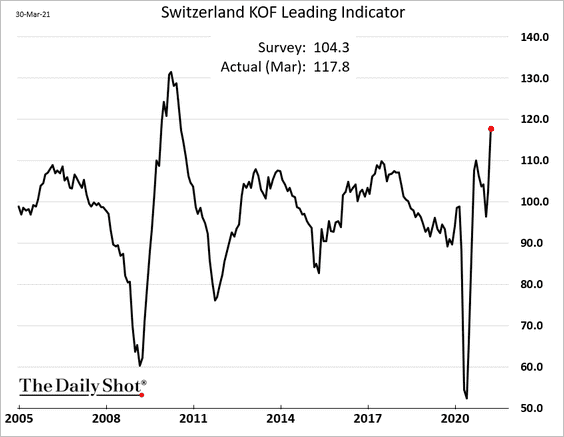
2. Switzerland’s KOF leading indicator hit the highest level in a decade.
Back to Index
Asia – Pacific
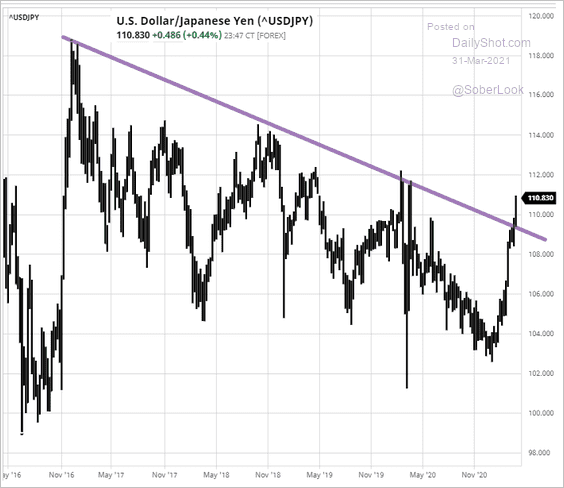
1. The yen continues to weaken vs. the dollar.
 Source: barchart.com
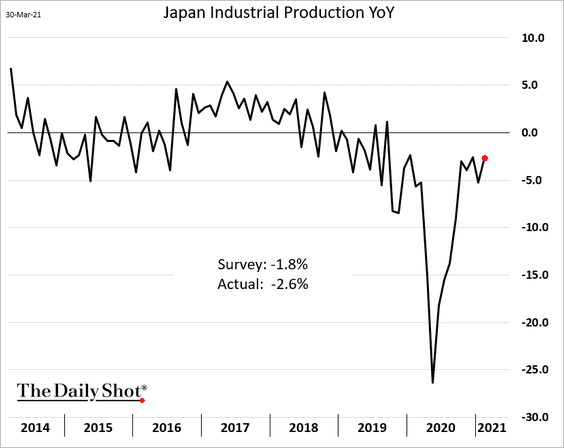
2. Japan’s industrial production report was disappointing.
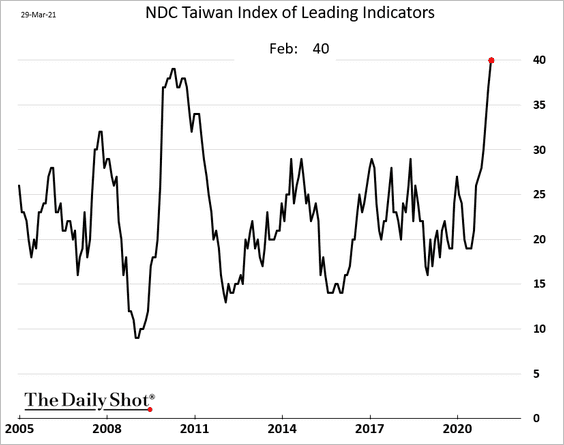
3. Taiwan’s index of leading indicators hit a multi-year high.
4. South Korea’s business surveys showed further improvements this month.
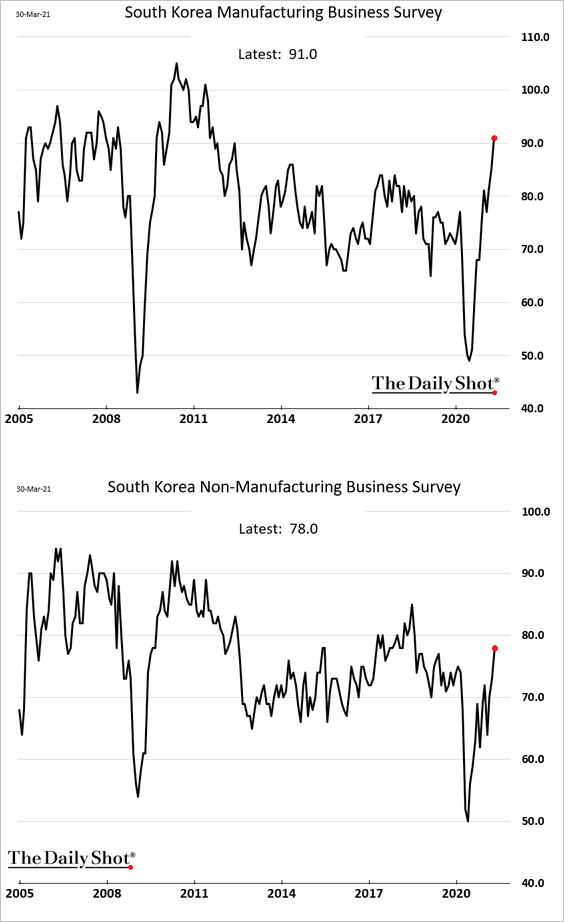
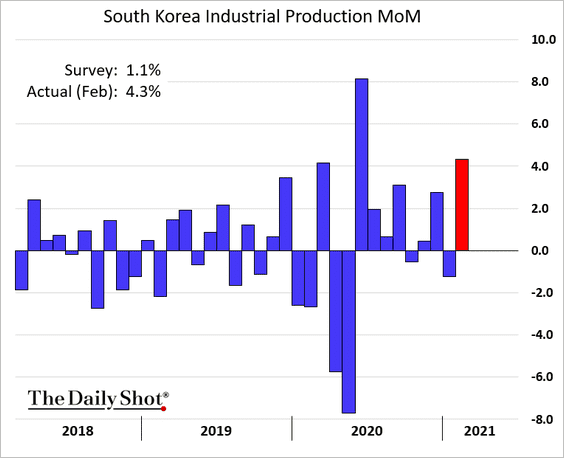
Industrial production surprised to the upside.
——————–
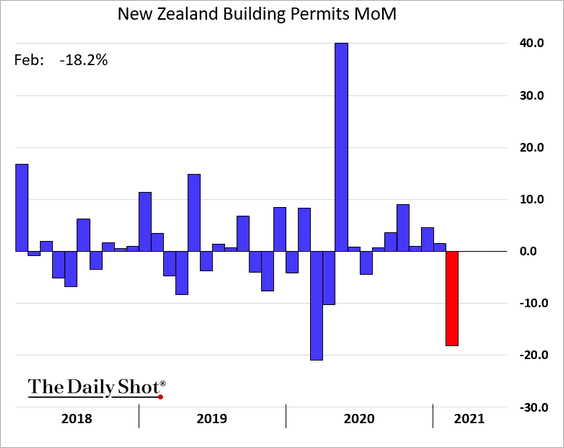
5. New Zealand’s building permits tumbled in February.
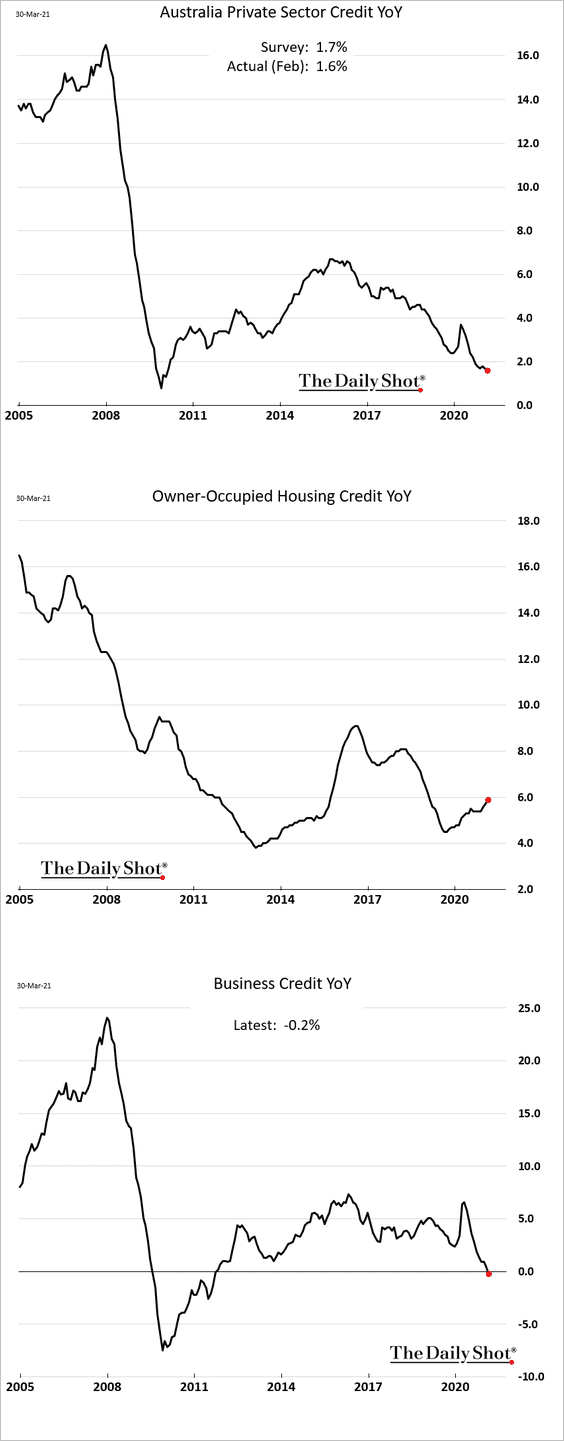
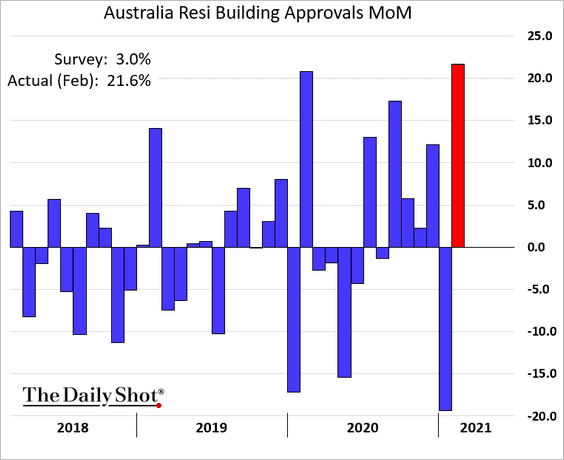
6. Next, we have some updates on Australia.
• Private credit growth continues to moderate, driven by business lending. Housing credit has been strengthening.
• Building approvals rebounded last month.
• The nation’s budget deficit has been less severe than expected.
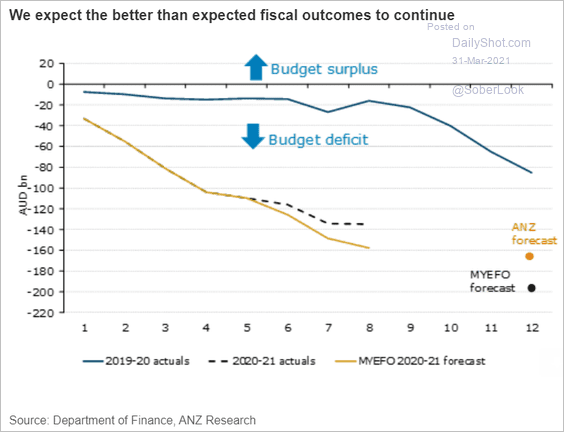 Source: ANZ Research
Back to Index
China
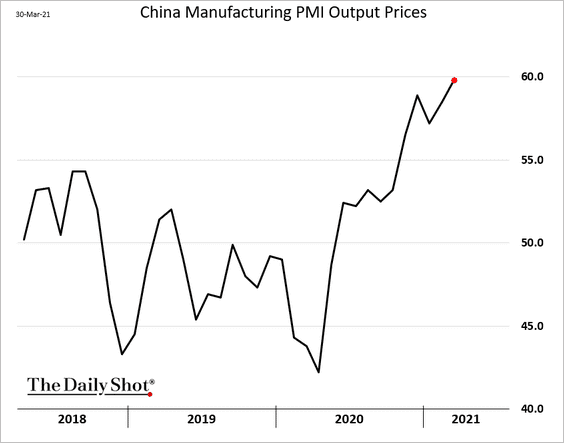
1. The official PMI report showed a rebound in business activity in March.
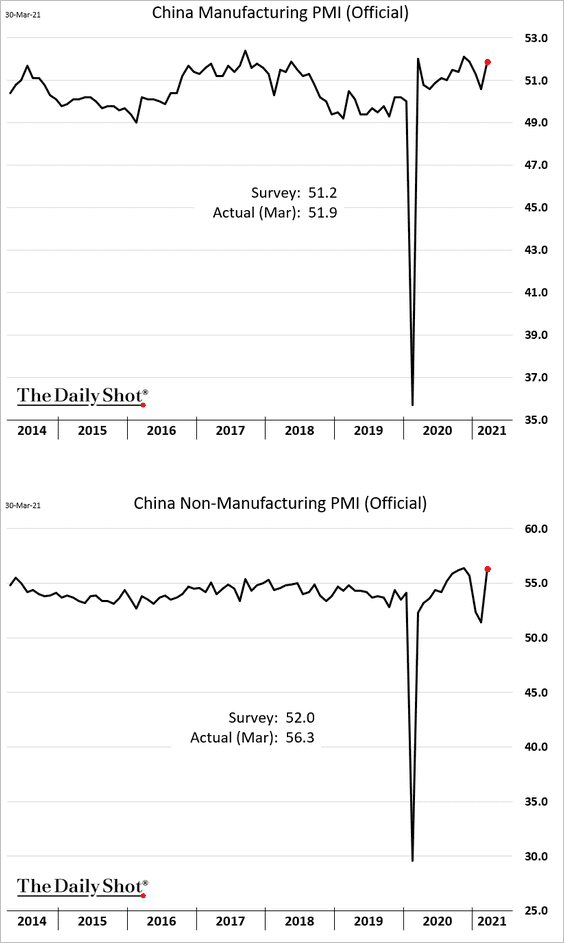
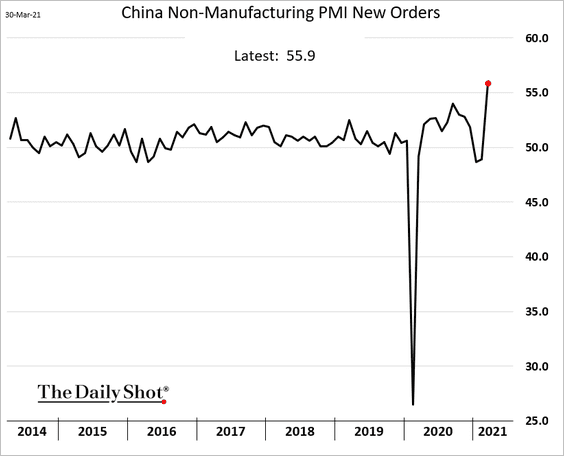
Non-manufacturing growth improved sharply.
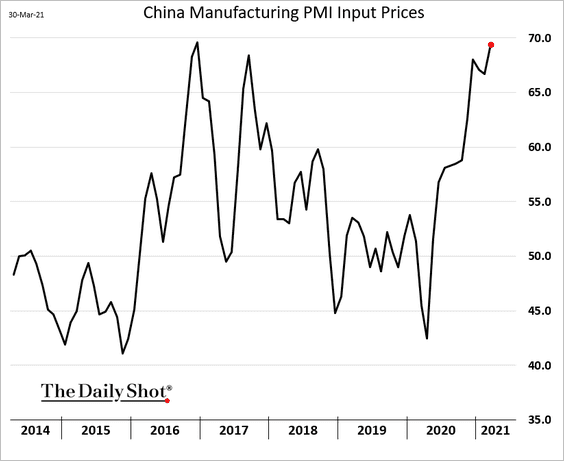
Input and output prices are surging.
——————–
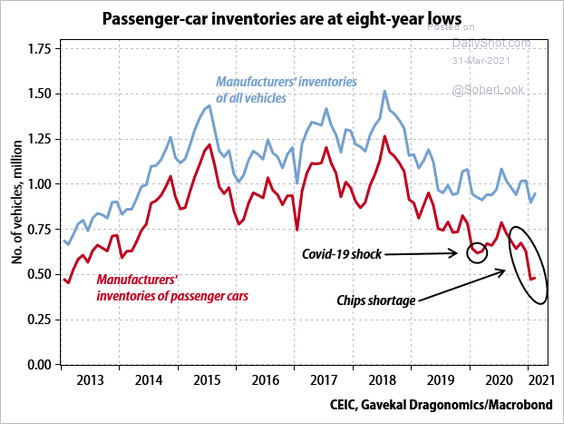
2. Passenger-car inventories have been declining.
 Source: Gavekal Research
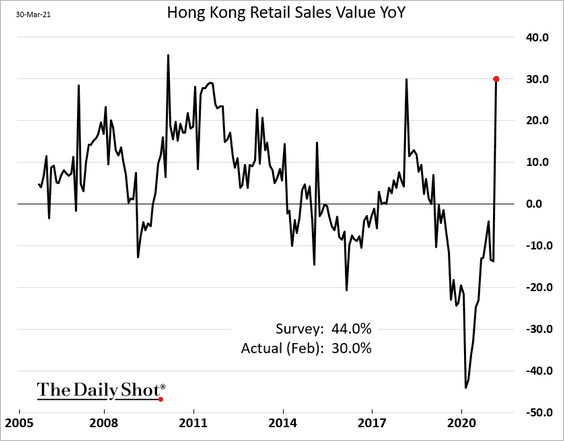
3. Hong Kong’s retail sales were up 30% vs. last year due to base effects (there wasn’t much shopping in February of 2020). Otherwise, the report was disappointing.
4. This chart shows the changes in US exports to China relative to other economies over the past couple of decades.
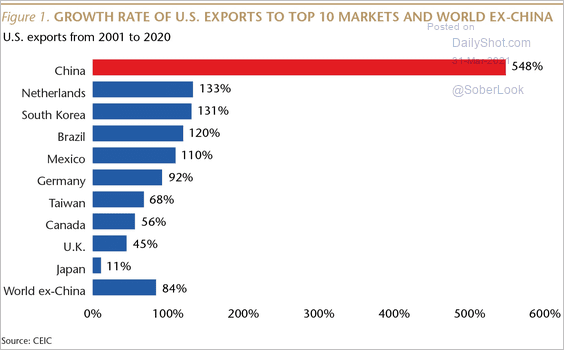 Source: Matthews Asia Read full article
Back to Index
Emerging Markets
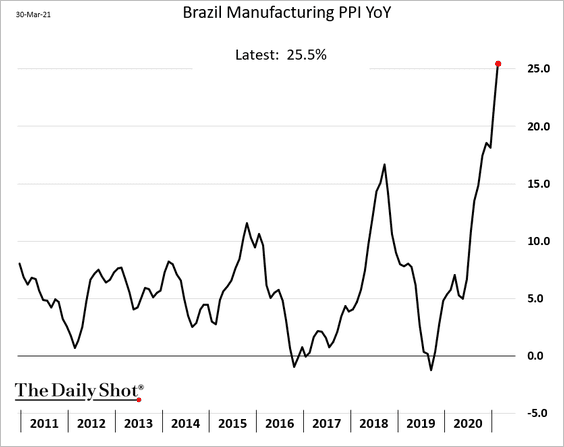
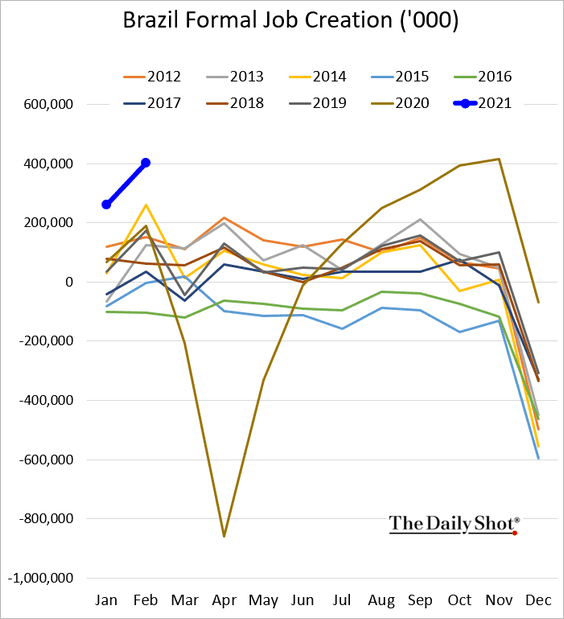
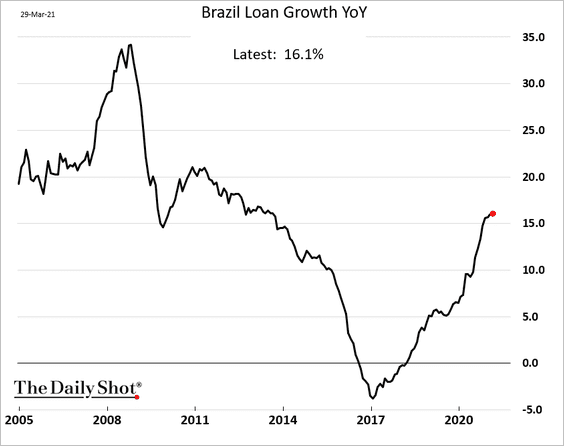
1. Let’s begin with Brazil.
• Manufacturing producer price inflation is surging.
• Formal job creation remains strong.
• Loan growth is at multi-year highs.
——————–
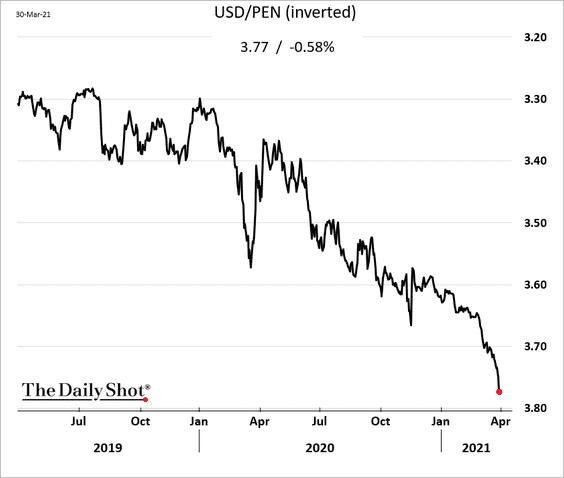
2. The Peruvian sol hit a record low. Traders have been using it as the short leg of EM relative value currency trades.
3. Deutsche Bank expects a slow recovery for Mexico.
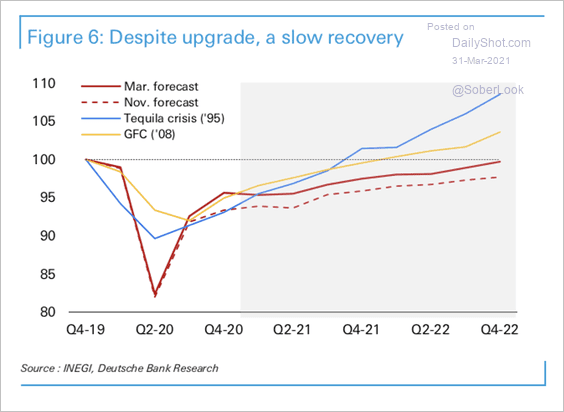 Source: Deutsche Bank Research
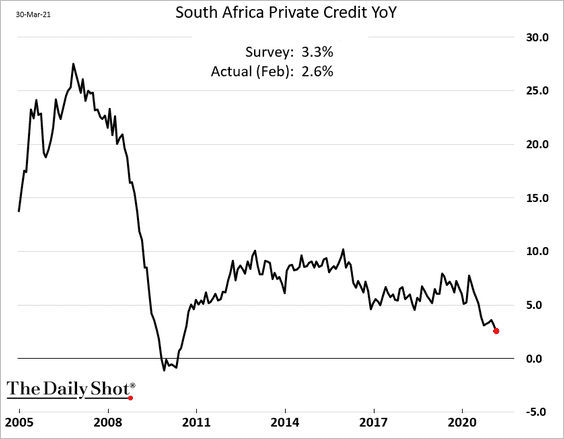
4. South Africa’s credit growth keeps slowing.
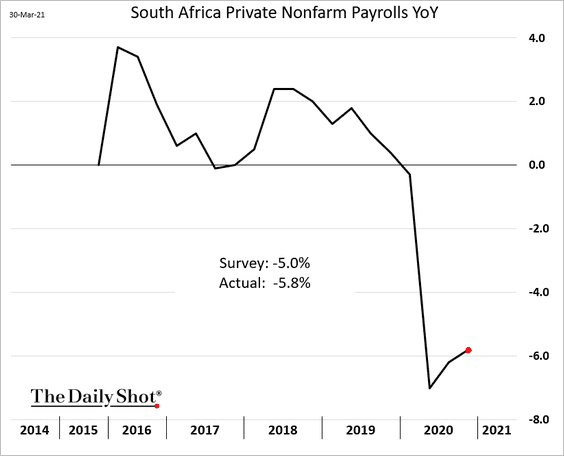
The nation’s labor force declined by almost 6% last year.
——————–
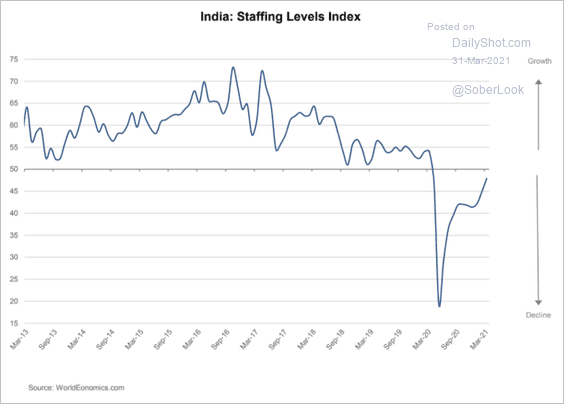
5. India’s staffing levels have stabilized, according to the latest World Economics SMI report.
 Source: World Economics
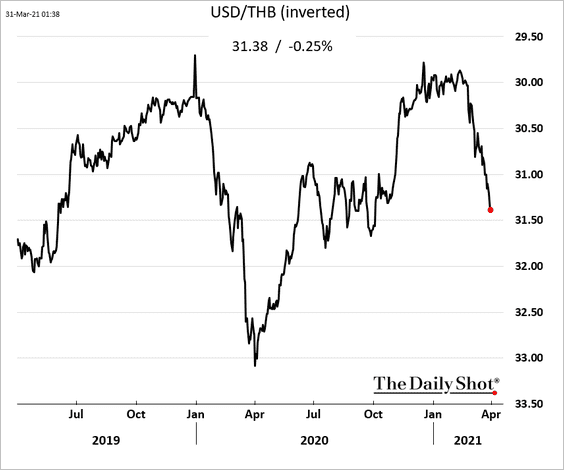
6. The Thai baht is rolling over.
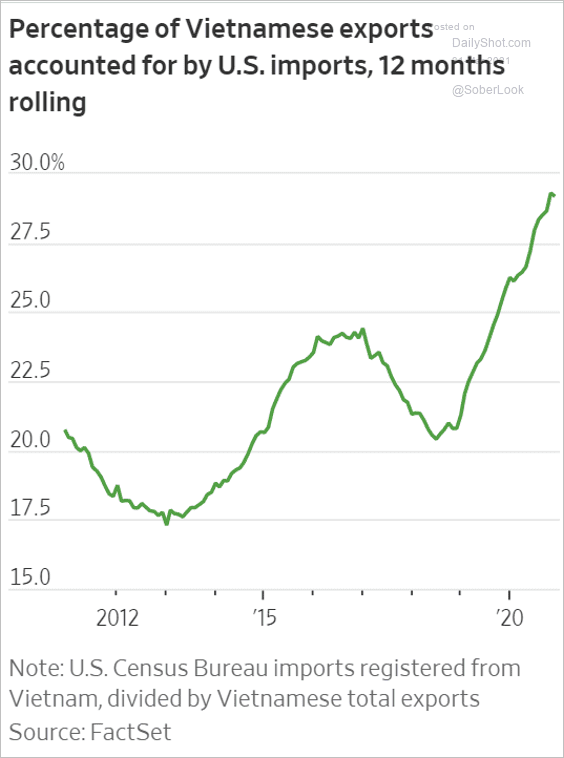
7. Vietnam’s exports are increasingly focused on the US.
 Source: @WSJ Read full article
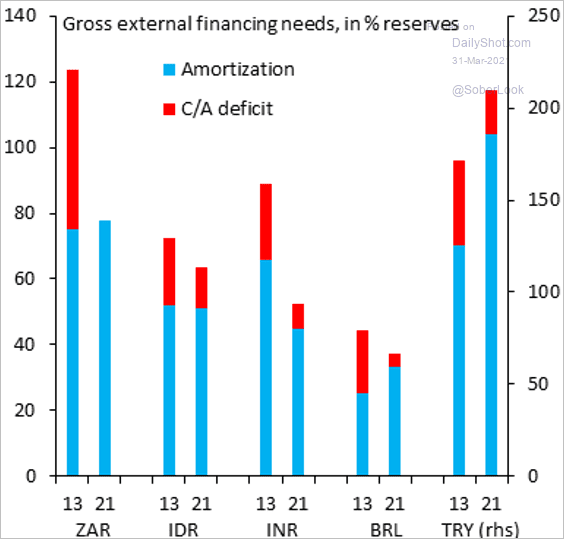
8. This chart shows external financing needs as a percentage of FX reserves for select economies.
 Source: @SergiLanauIIF
Back to Index
Cryptocurrency
1. Ether (ETH) has been outperforming other major cryptocurrencies over the past week.
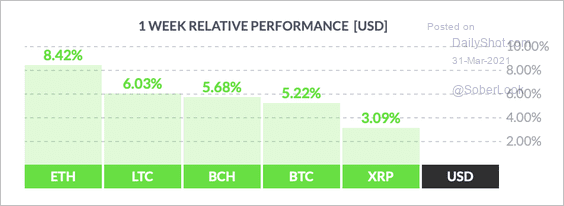 Source: FinViz
2. The cost to fund long positions in the market for bitcoin perpetual swaps has broken above neutral levels for the first time since mid-March. This suggests renewed appetite for risk-taking.
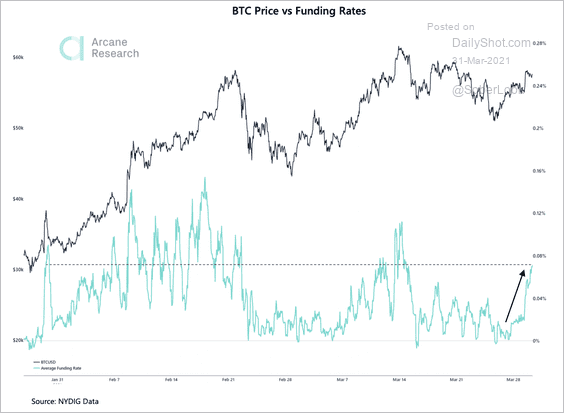 Source: Arcane Crypto Read full article
3. The next chart shows bitcoin’s correlation with different asset classes.
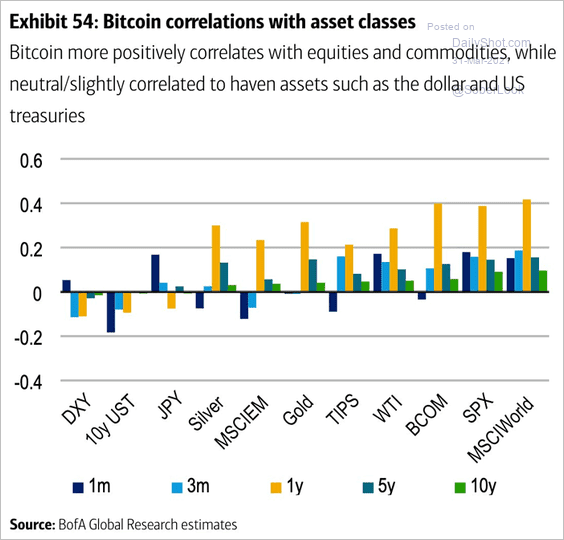 Source: @ISABELNET_SA, @BofAML
Back to Index
Commodities
1. Gold is at support.
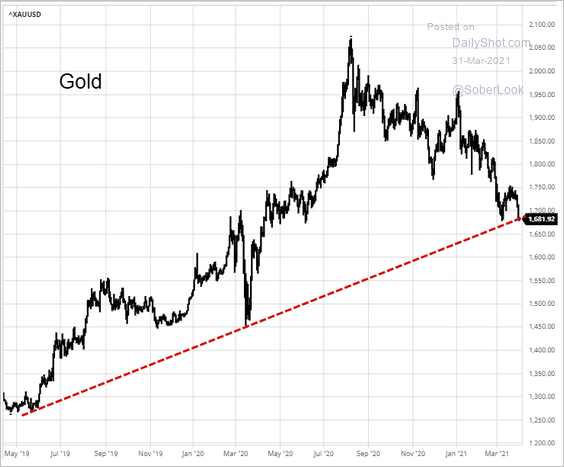 Source: barchart.com
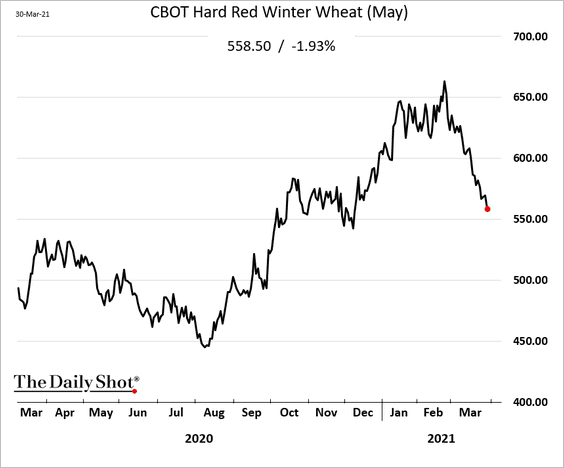
2. US wheat futures continue to retreat.
Back to Index
Equities
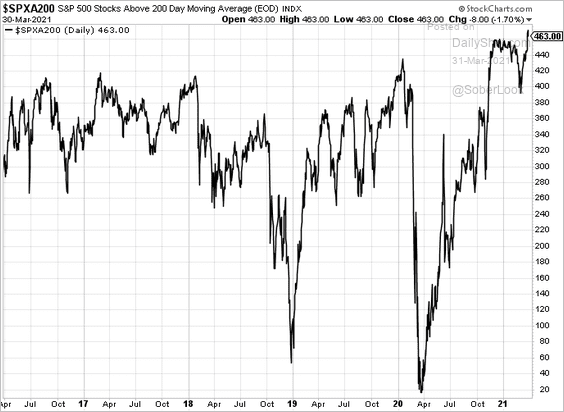
1. The percentage of S&P 500 stocks above their 200-day moving average is near multi-year highs.
2. Stock-bond correlations remain elevated.
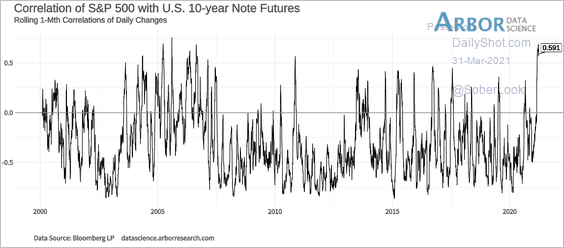 Source: Arbor Research & Trading
This chart shows stock-bond 10-year correlations going back to 1900.
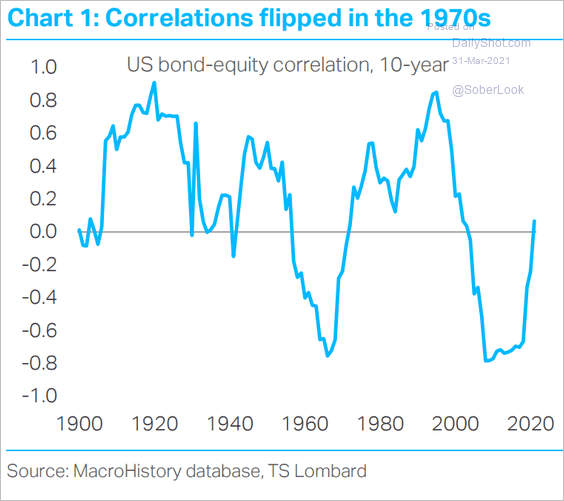 Source: TS Lombard
——————–
3. How sensitive are different sectors to real rates?
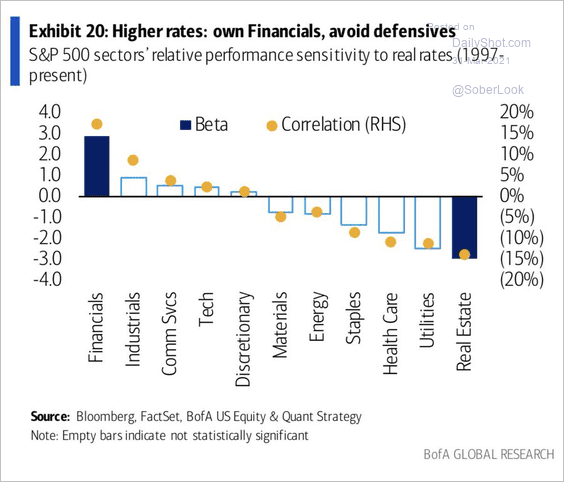 Source: BofA Global Research, @WallStJesus
How about inflation?
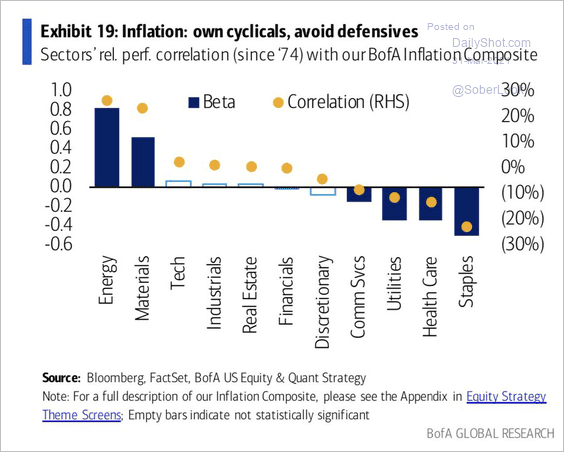 Source: BofA Global Research, @WallStJesus
——————–
4. When does inflation become a problem for stocks? This chart shows the core PCE inflation vs. the CAPE ratio (valuation).
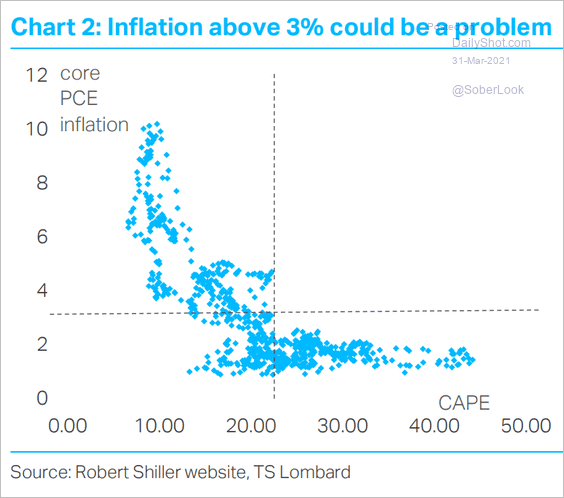 Source: TS Lombard
5. Here are the month-to-date returns by sector.
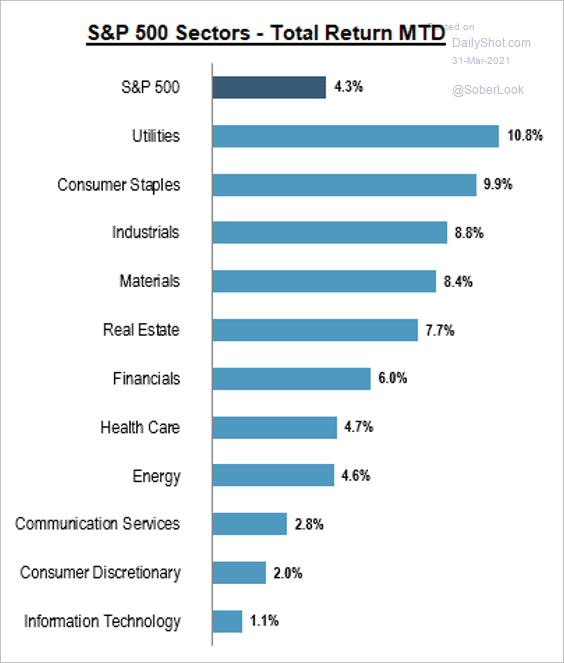 Source: S&P Global Market Intelligence
6. Current valuations suggest that we should expect a 2% annualized return for the S&P 500 over the next decade.
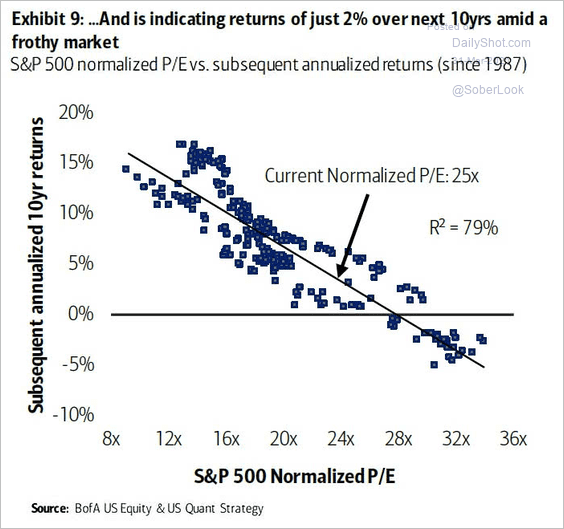 Source: @ISABELNET_SA, @BofAML
7. Goldman remains bullish on the equity market.
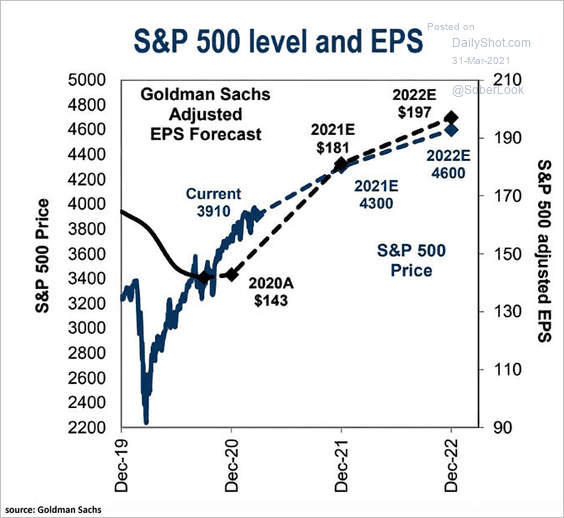 Source: @ISABELNET_SA, @GoldmanSachs
8. The number of companies issuing EPS guidance is rebounding.
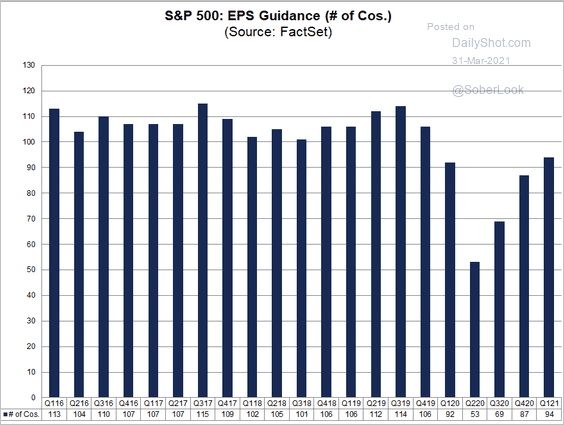 Source: @FactSet
Here is the percentage of S&P 500 companies issuing positive guidance.
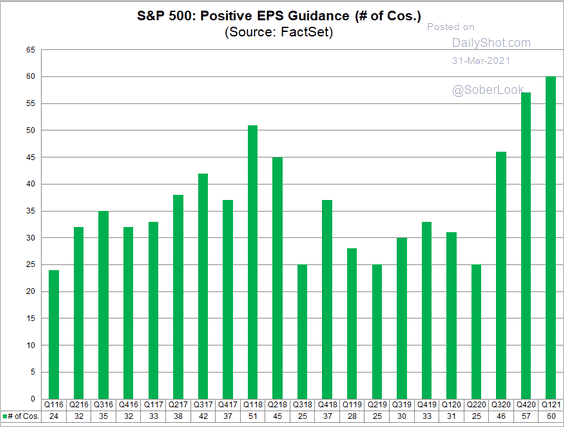 Source: @FactSet
——————–
9. Higher Treasury yields point to further outperformance for small-cap stocks.
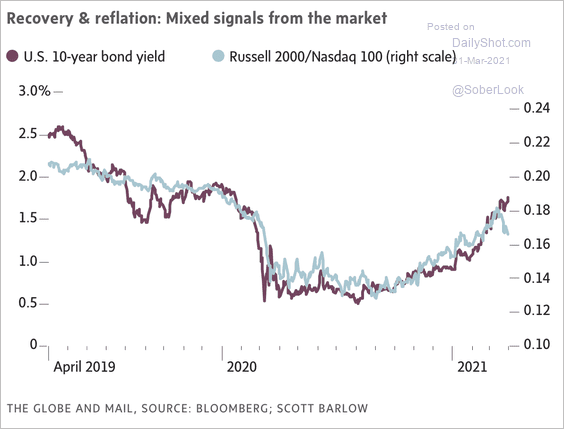 Source: @SBarlow_ROB Read full article
10. Stocks haven’t performed well in the last hour of trading this year.
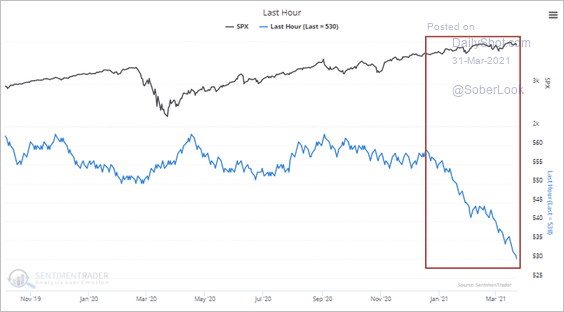 Source: @sentimentrader, @DeanChristians
11. Margin debt continues to climb.
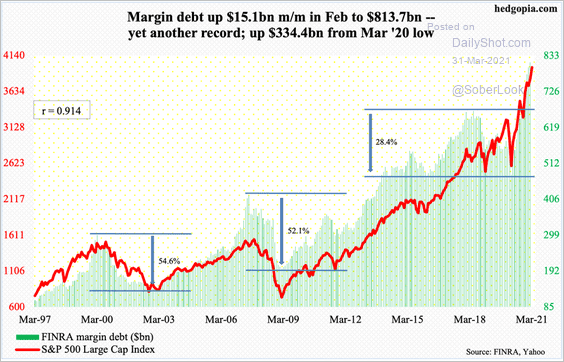 Source: @hedgopia
But the level is not extreme relative to the overall market capitalization.
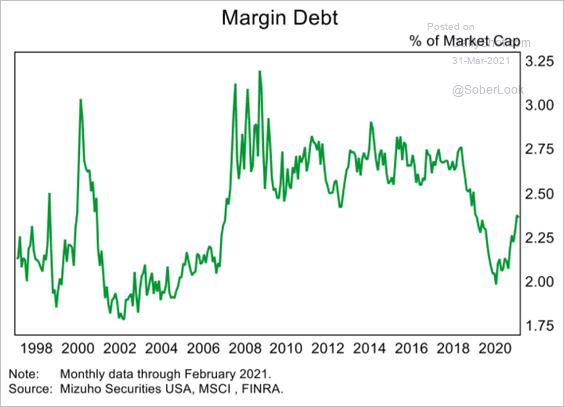 Source: Mizuho Securities USA
Back to Index
Alternatives
1. Some real asset classes have (relatively) attractive yields.
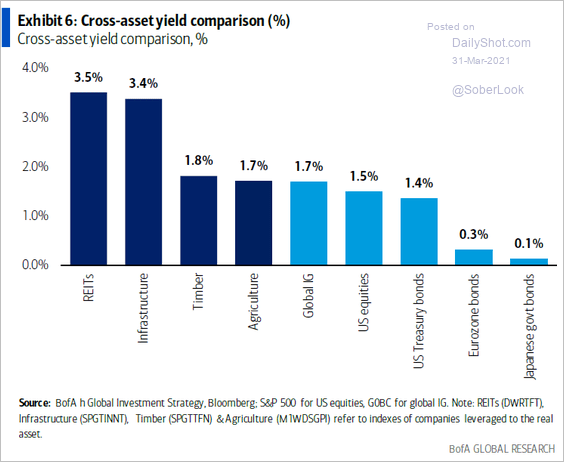 Source: BofA Global Research
2. Real assets are more correlated with inflation.
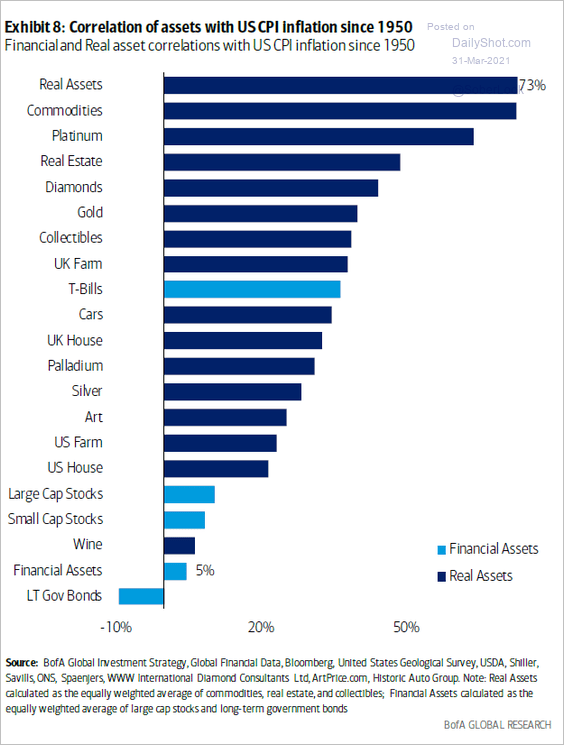 Source: BofA Global Research
3. This chart shows real assets relative to financial assets over the past century.
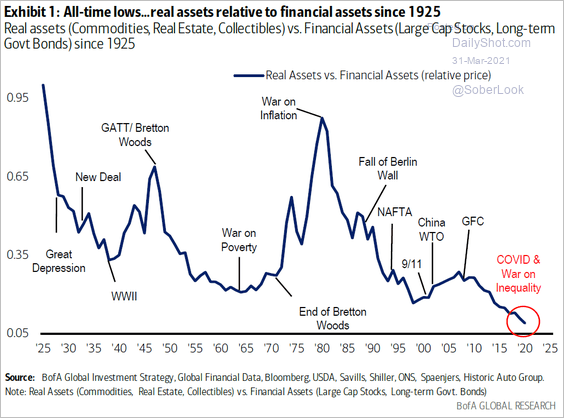 Source: BofA Global Research
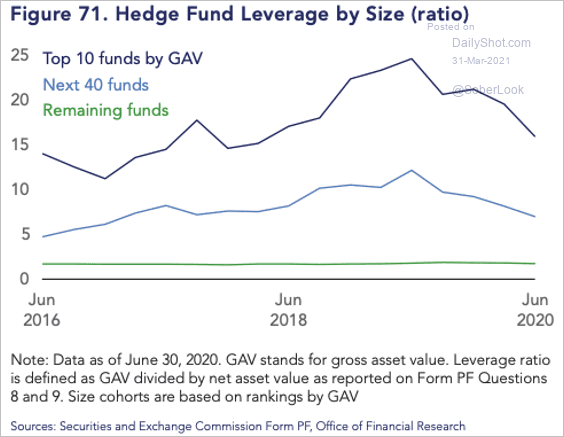
4. Hedge fund leverage increased over the past year but is not extreme.
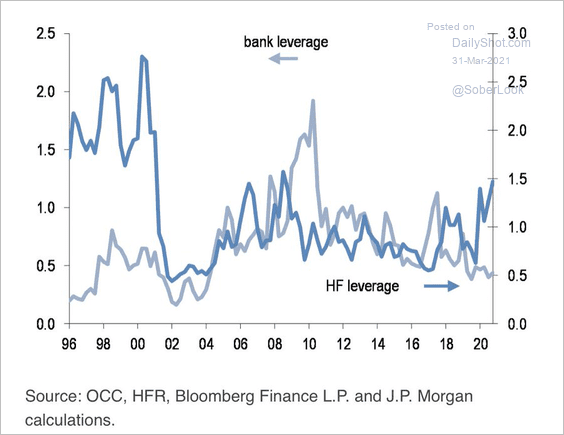 Source: JP Morgan, @carlquintanilla
The largest funds tend to be more leveraged.
 Source: @apark_
——————–
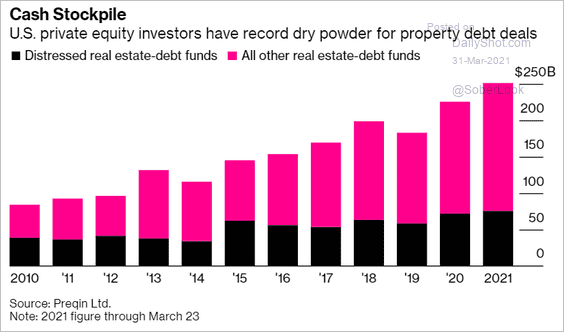
5. A great deal of capital is chasing distressed real estate assets.
 Source: Bloomberg Read full article
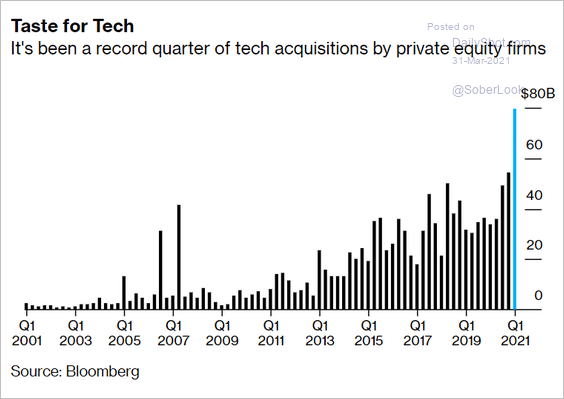
6. Private equity tech acquisitions hit a record high.
 Source: @business Read full article
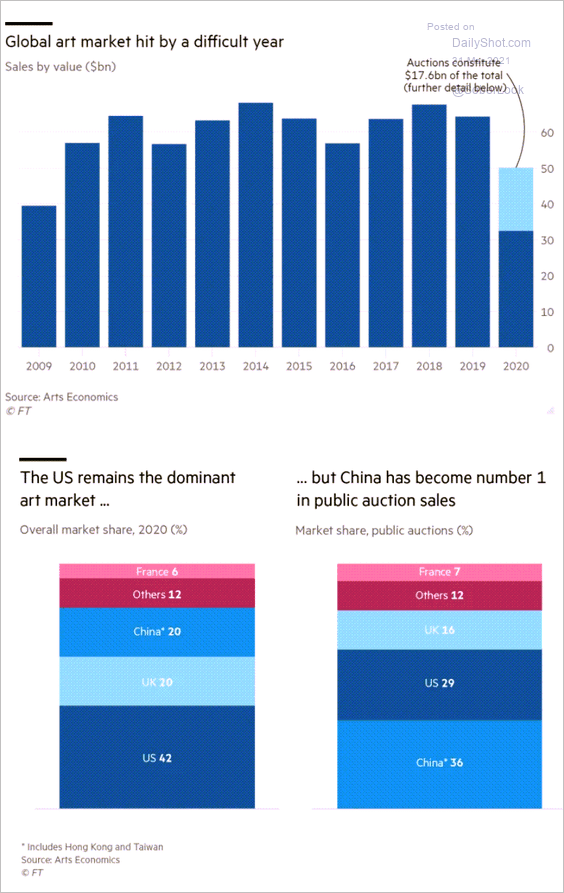
7. 2020 was a challenging year for the art market.
 Source: @financialtimes Read full article
Back to Index
Credit
1. How much exposure did US banks have to Archegos’ largest stock holdings?
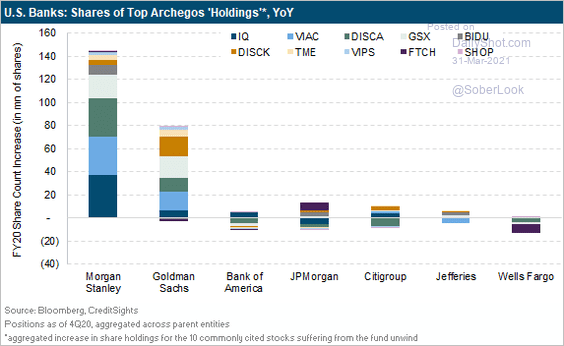 Source: CreditSights
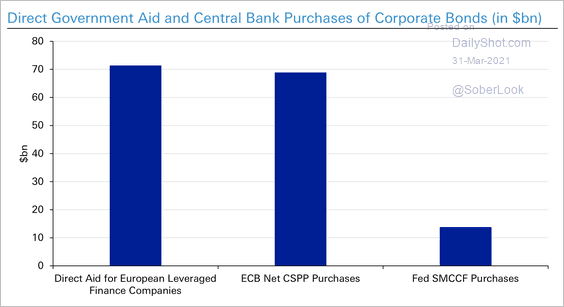
2. Default rates in the US and Europe remain below 2008 levels, partly due to government support (2 charts).
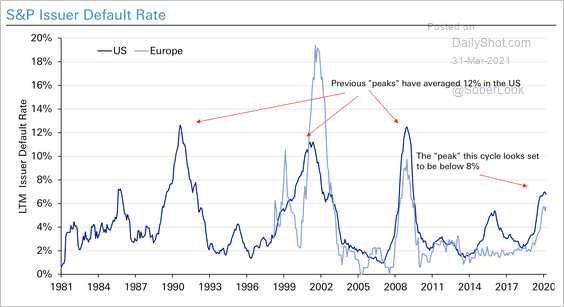 Source: Deutsche Bank Research
 Source: Deutsche Bank Research
——————–
3. The iShares US corporate high-yield bond ETF (HYG) has been outperforming the iShares 7-10-year Treasury bond ETF (IEF) since the pandemic low.
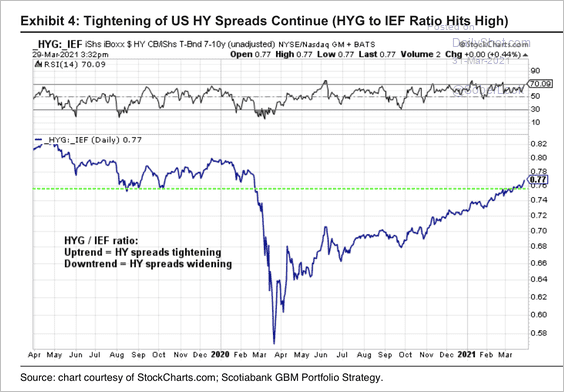 Source: Hugo Ste-Marie, Portfolio & Quantitative Strategy Global Equity Research, Scotia Capital
4. Here is the monthly distribution of US investment-grade bond issuance by sector.
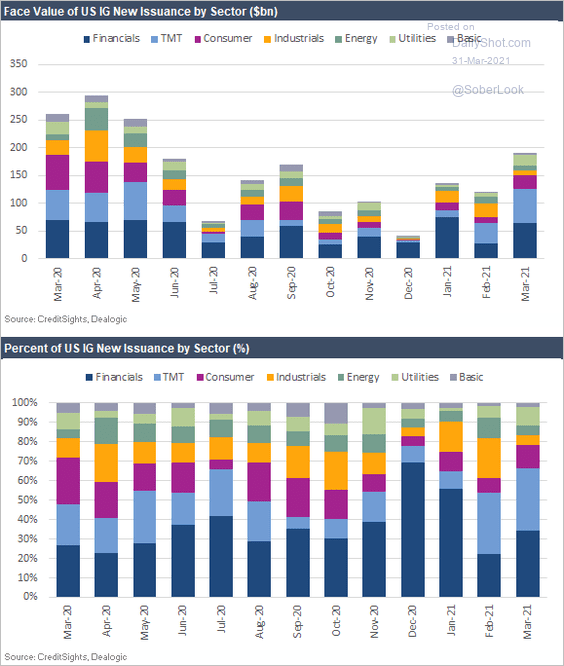 Source: CreditSights
Back to Index
Rates
1. The amount of Treasuries held in custody (at the Fed) by foreign accounts has been rising over the past few months.
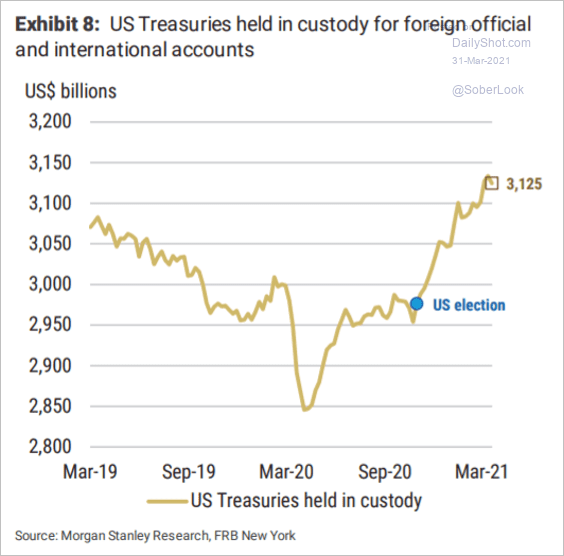 Source: Morgan Stanley Research
2. This chart shows US real yields vs. the federal debt (as % of GDP) going back to 1805.
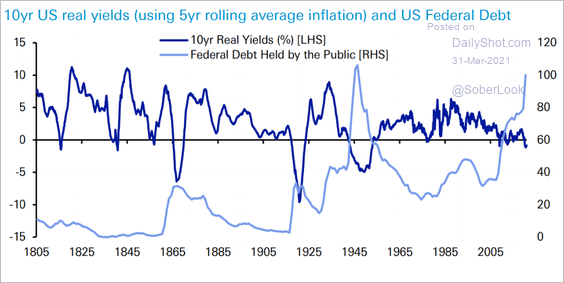 Source: Deutsche Bank Research
Back to Index
Global Developments
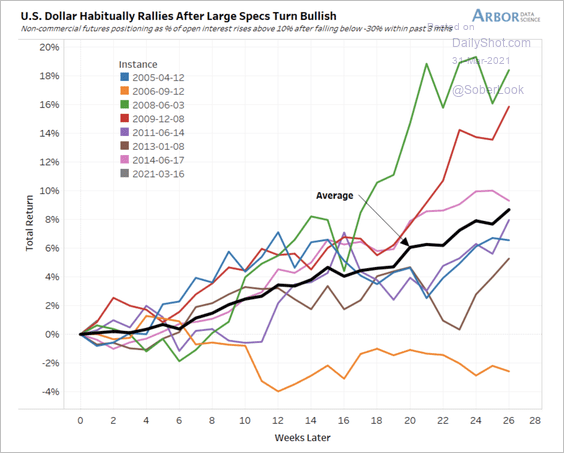
1. Speculators reversed their US dollar short positions last week, which typically precedes further upside for the greenback (2 charts).
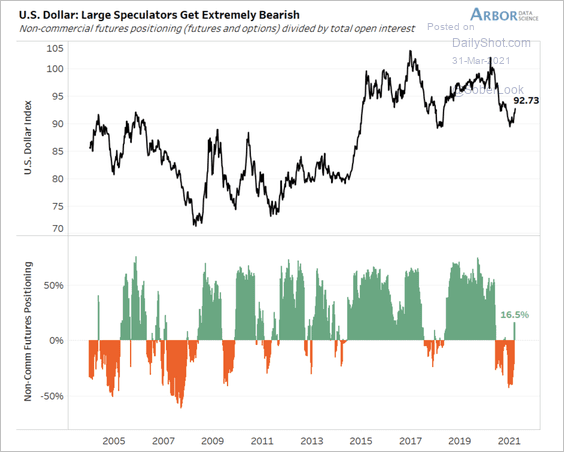 Source: Arbor Research & Trading
 Source: Arbor Research & Trading
——————–
2. Global growth is expected to rebound sharply.
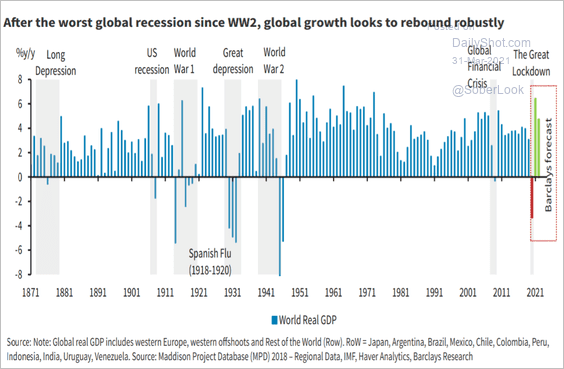 Source: Barclays Research
3. Investors remain optimistic and anticipate a full-on global reflation over the coming 12-months, according to an Absolute Strategy survey (2 charts).
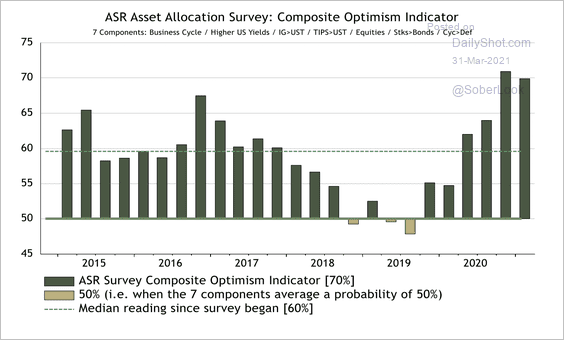 Source: Absolute Strategy Research
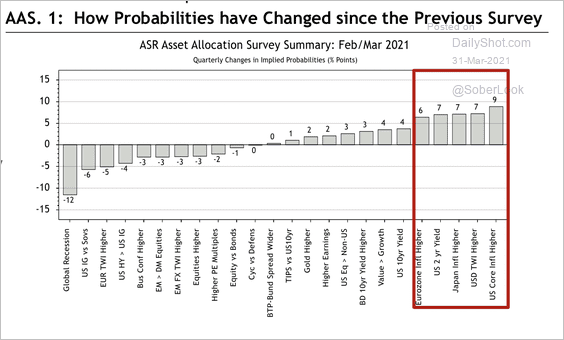 Source: Absolute Strategy Research
——————–
4. Supply-chain bottlenecks have worsened.
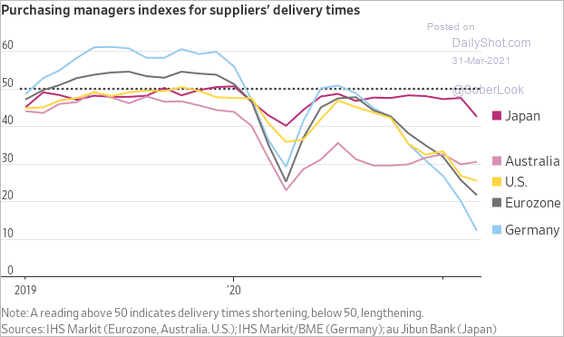 Source: @jeffsparshott
5. This chart shows inflation-adjusted home price appreciation in Western Europe, the US, and Canada.
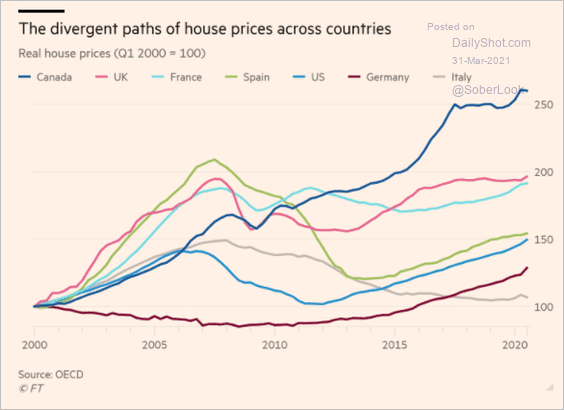 Source: @financialtimes Read full article
And here is real home price appreciation across OECD economies.
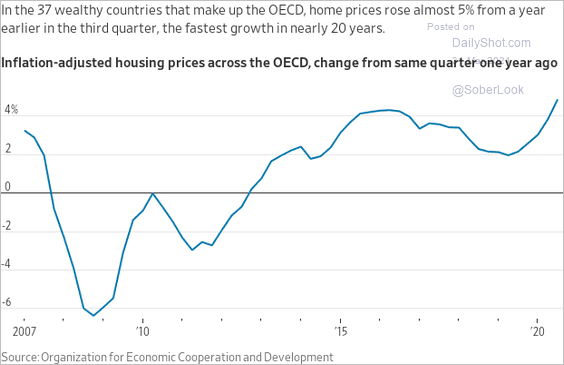 Source: @WSJ Read full article
——————–
Food for Thought
1. Self-driving car companies’ test miles:
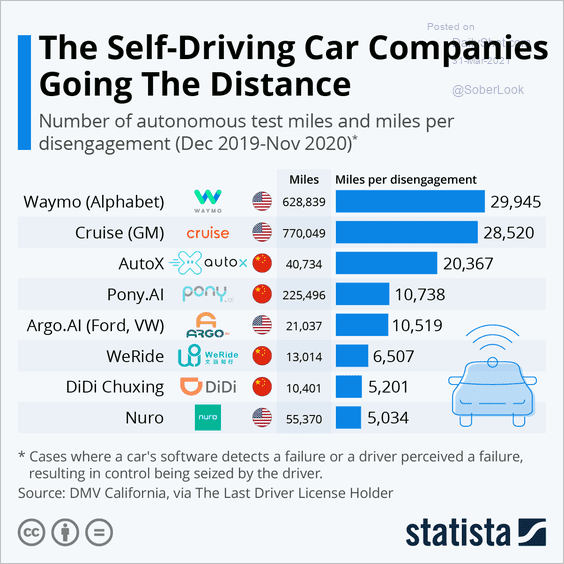 Source: Statista
2. Online subscription cancellation by method and age:
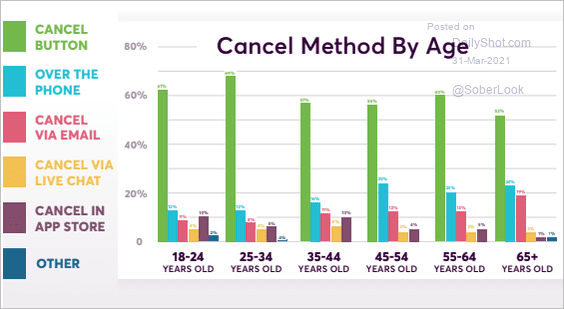 Source: Brightback
3. Music industry revenues:
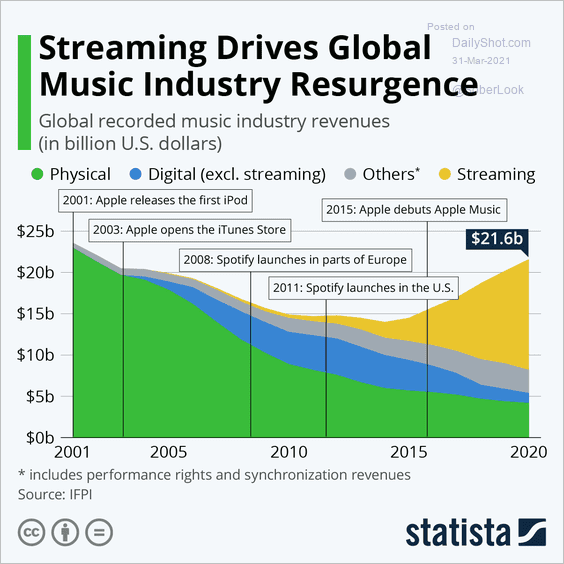 Source: Statista
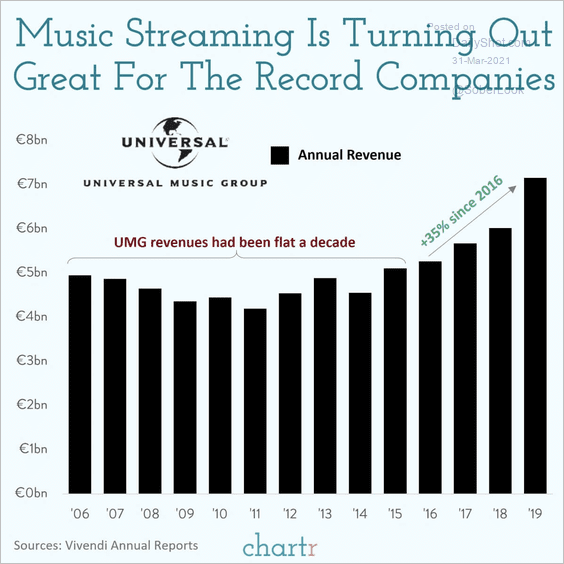 Source: @chartrdaily
——————–
4. Misinformation from deepfakes:
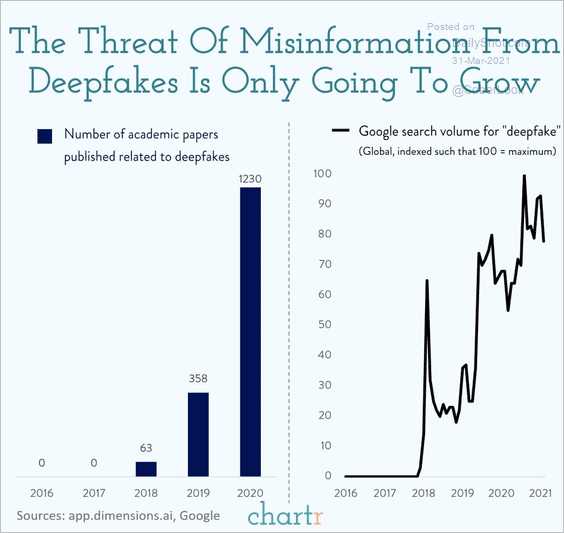 Source: @chartrdaily
5. People locked up in the US:
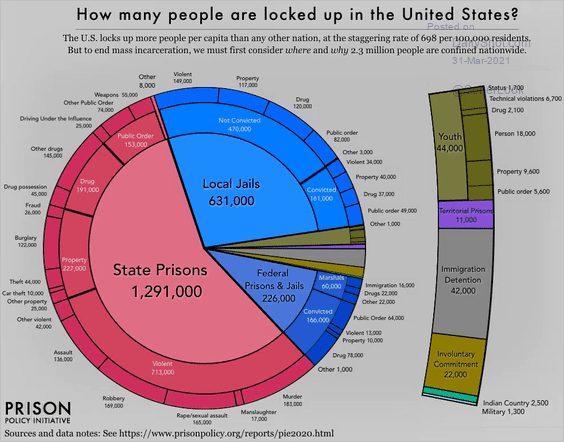 Source: Prison Policy Initiative Read full article
6. Americans identifying as LGBT (3 charts):
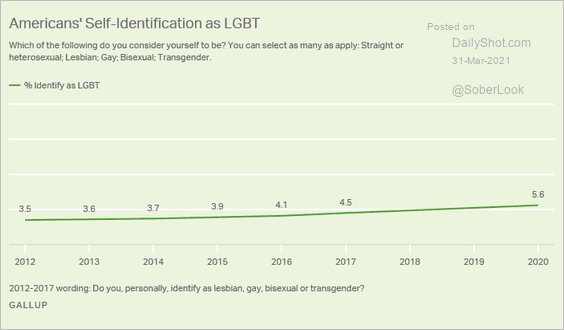 Source: Gallup Read full article
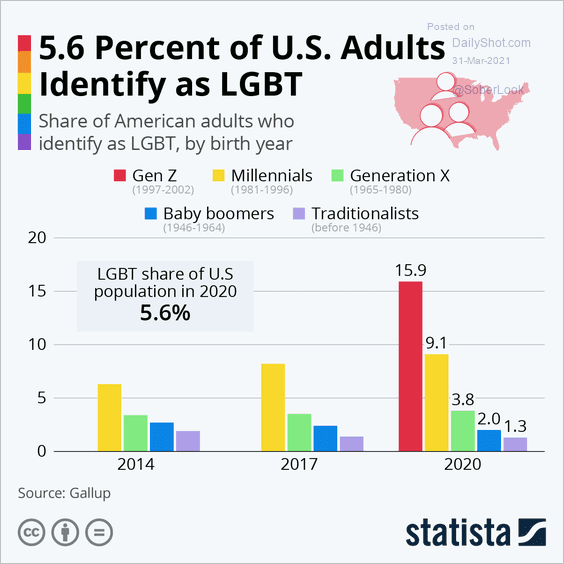 Source: Statista
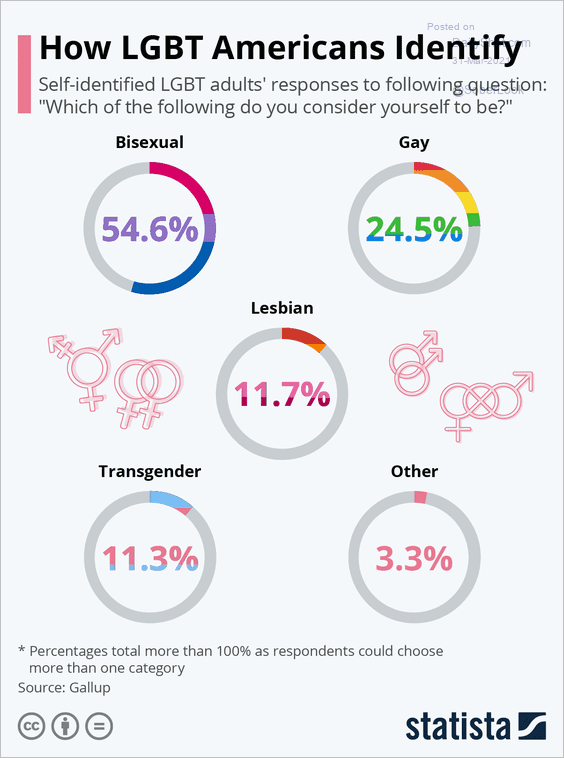 Source: Statista
——————–
7. Vaccine refusal:
 Source: Echelon Insights
8. COVID cases in select states:
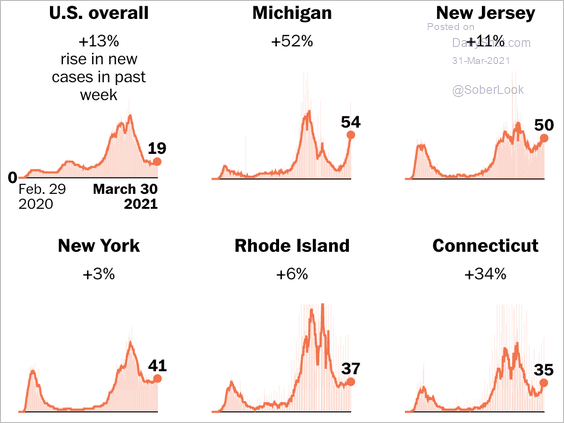 Source: The Washington Post Read full article
9. The greenest countries in the world:
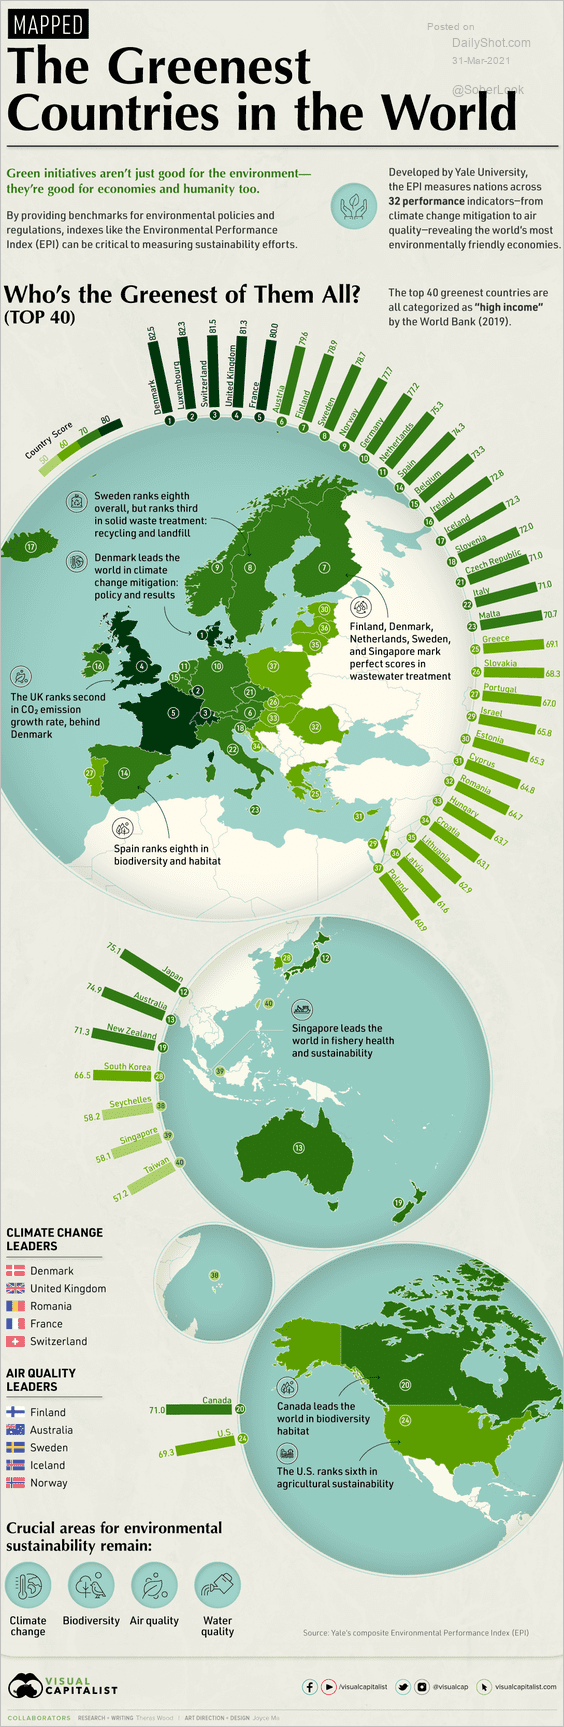 Source: Visual Capitalist Read full article
10. Who controls Antarctica?
 Source: Visual Capitalist Read full article
——————–
Back to Index