
The Daily Shot: 01-Apr-21
• Administrative Update
• The United States
• Canada
• The United Kingdom
• The Eurozone
• Japan
• Asia – Pacific
• China
• Emerging Markets
• Commodities
• Energy
• Equities
• Credit
• Rates
• Global Developments
• Food for Thought
Administrative Update
The next Daily Shot will be out on Monday, April 5th.
If you are unsure whether The Daily Shot was published on a particular date, you can check online at TheDailyShot.com or on the administrative updates page.
Back to Index
The United States
1. The ADP private payrolls report was roughly in line with expectations.
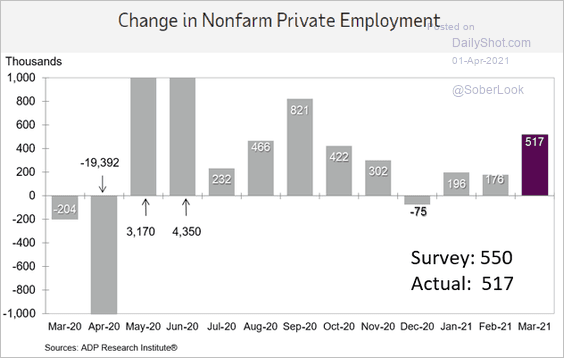 Source: ADP Research
• It was another good month for Leisure & Hospitality hiring.
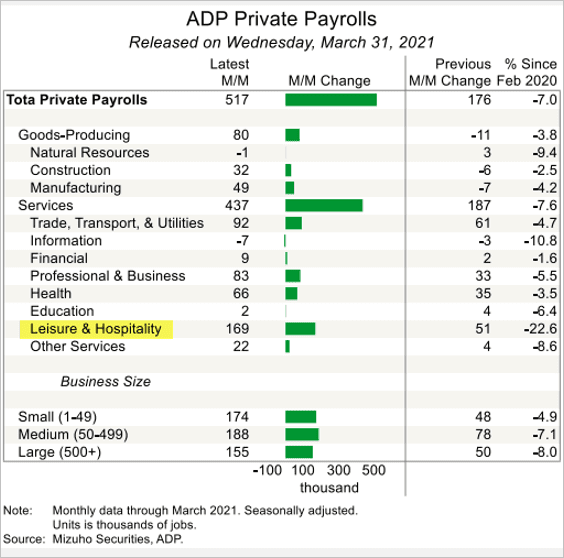 Source: Mizuho Securities USA
• The ADP reports have been understating the official private payrolls figures.
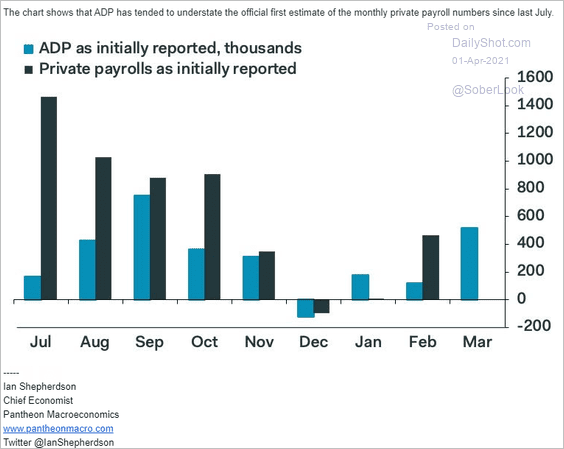 Source: Pantheon Macroeconomics
——————–
2. The Chicago PMI index surprised to the upside, suggesting that manufacturing activity at the national level (ISM) will show further gains.
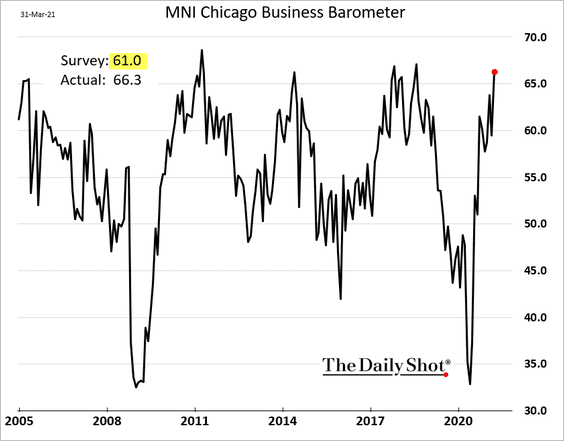
Here is the ISM index versus the regional Fed surveys.
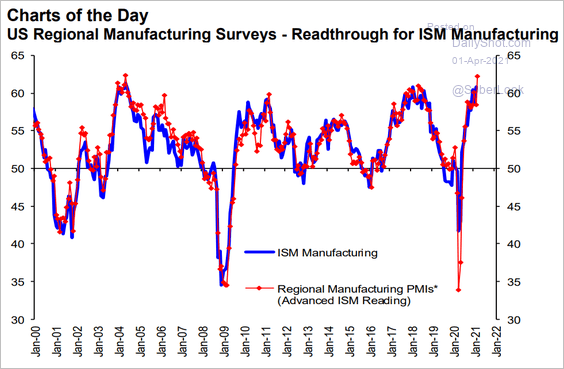 Source: Scotiabank Economics
——————–
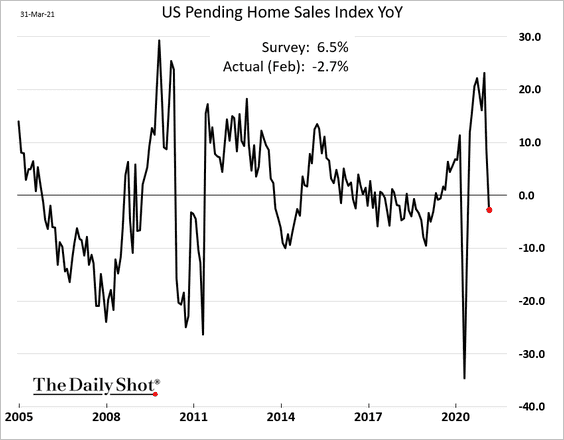
3. February’s pending home sales were disappointing.
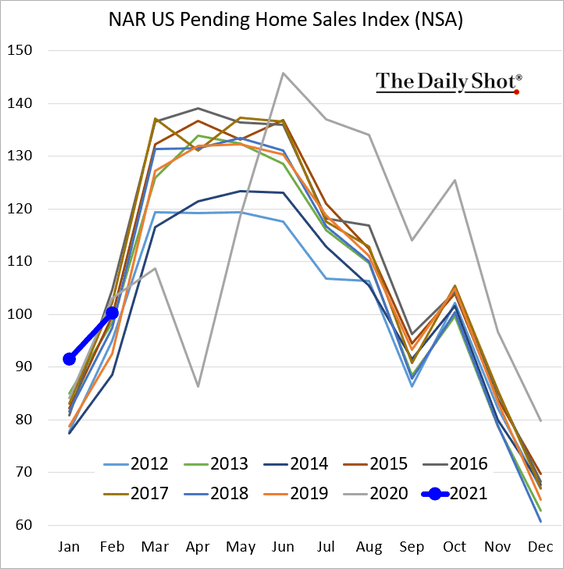
Here is the year-over-year chart.
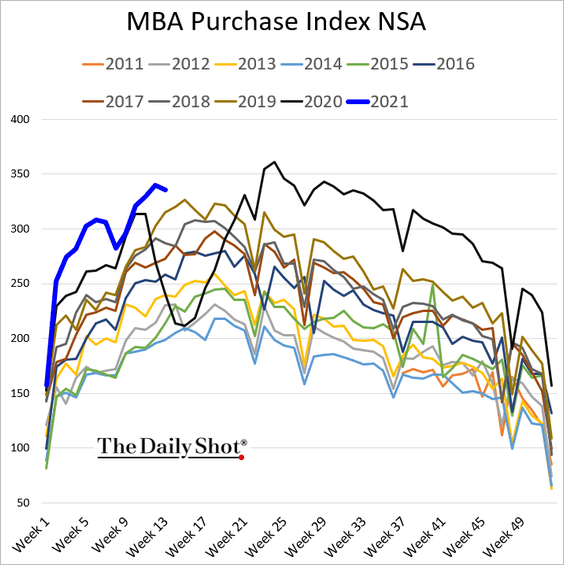
Will we see a pullback in mortgage applications due to higher rates?
——————–
4. Reopenings (and better weather) encouraged greater mobility in midwest and southern states.
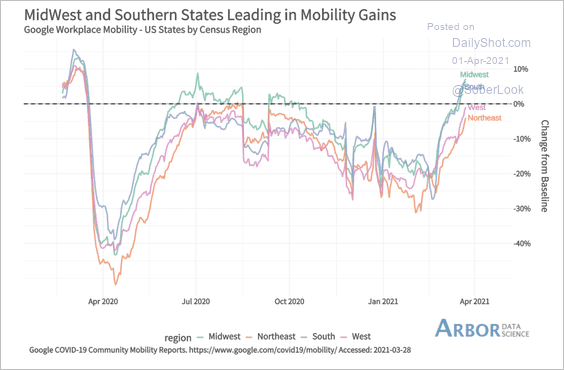 Source: Arbor Research & Trading
Searches for clubs and nightlife have picked up recently.
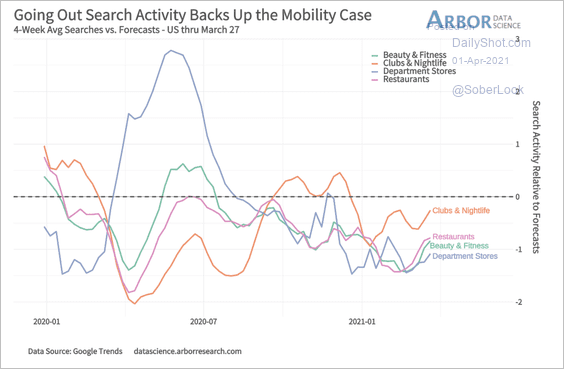 Source: Arbor Research & Trading
——————–
5. Next, we have some updates on inflation.
• The rebound in commodity prices suggests further upside in core PCE inflation.
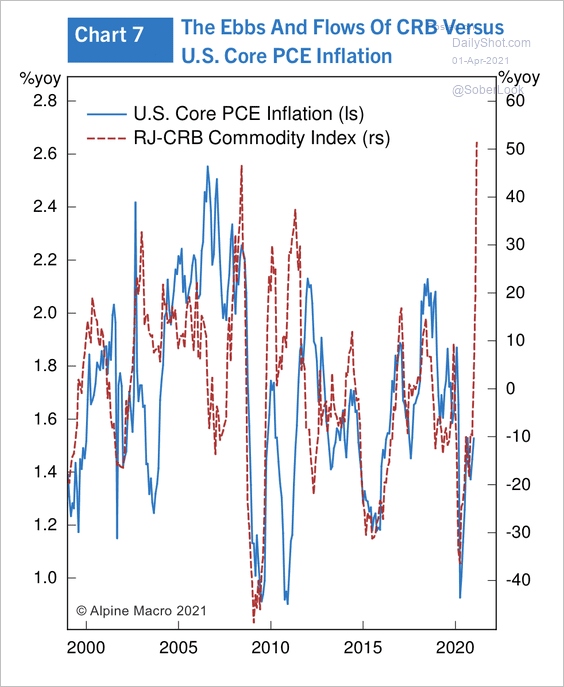 Source: Alpine Macro
• Price increases on imports from China have been climbing.
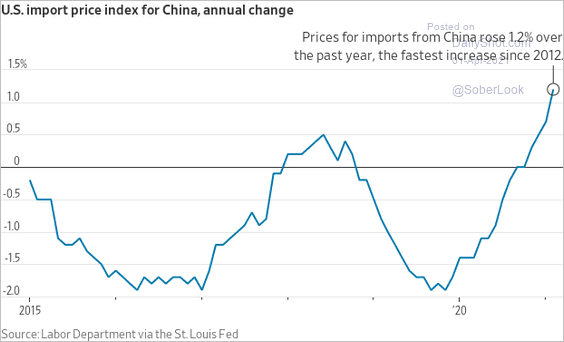 Source: @WSJ Read full article
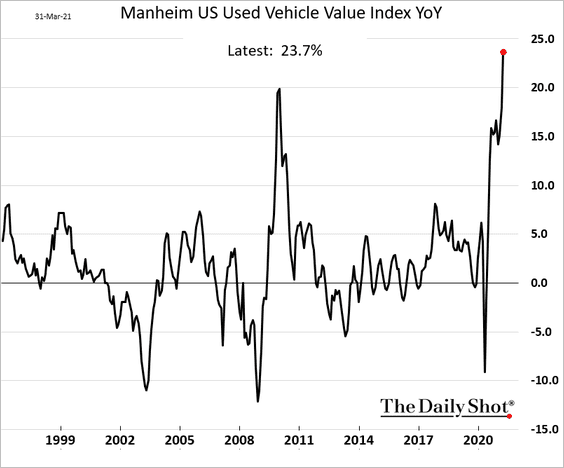
• The year-over-year price gains on auctioned used vehicles hit the highest level in decades.
——————–
6. Next, we have a couple of charts on vaccination progress.
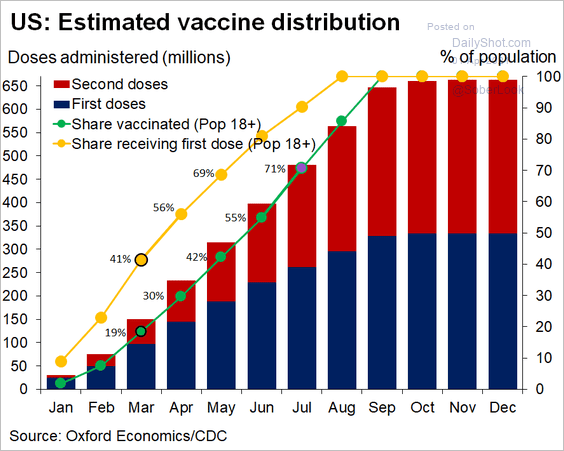 Source: @GregDaco
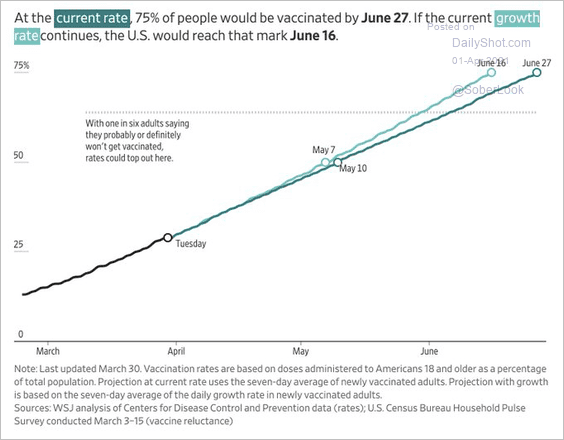 Source: @WSJGraphics Read full article
Back to Index
Canada
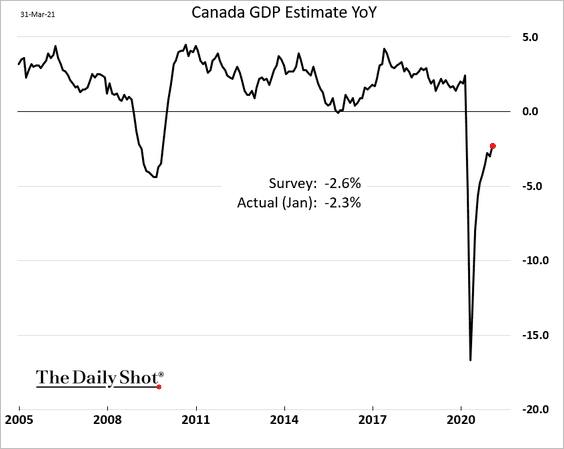
1. The monthly GDP estimate showed ongoing recovery in January (exceeding forecasts).
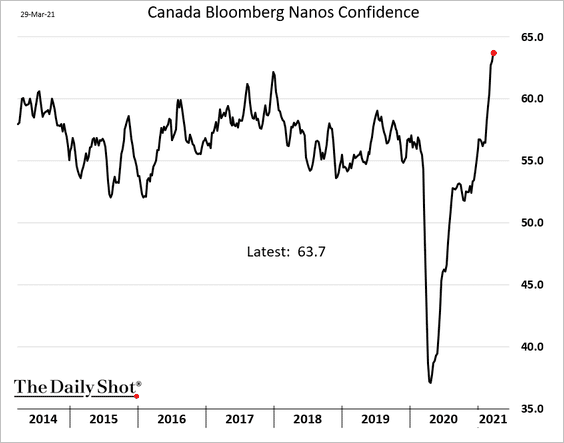
2. Consumer confidence is surging.
3. Spending on dwellings has been dominating fixed asset investment.
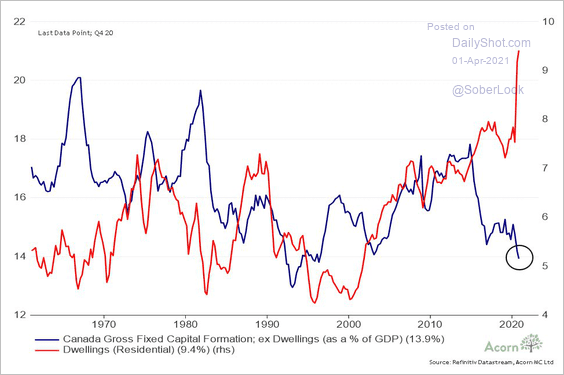 Source: @RichardDias_CFA
4. The number of households is expected to grow over the next few decades.
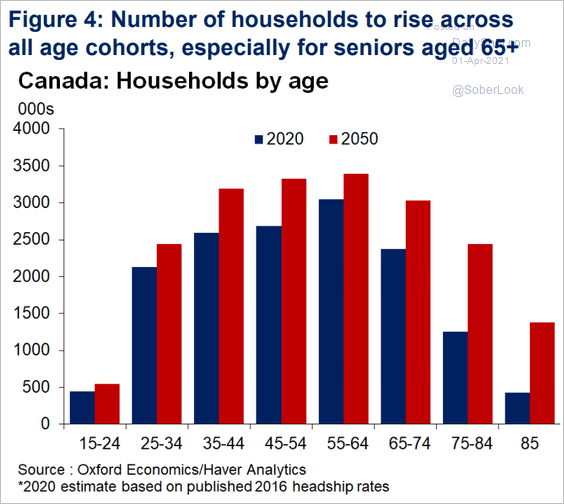 Source: Oxford Economics
5. Canada will boost its GDP by increasing immigration. As a result, the nation’s growth could outperform other advanced economies.
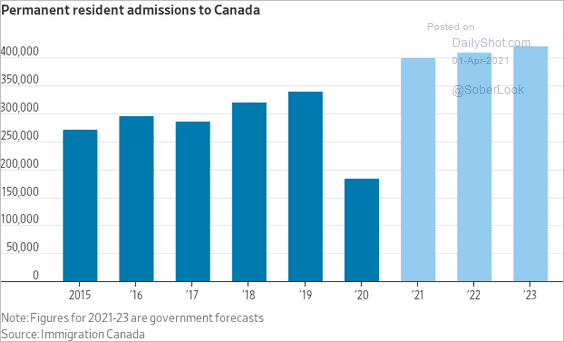 Source: @WSJ Read full article
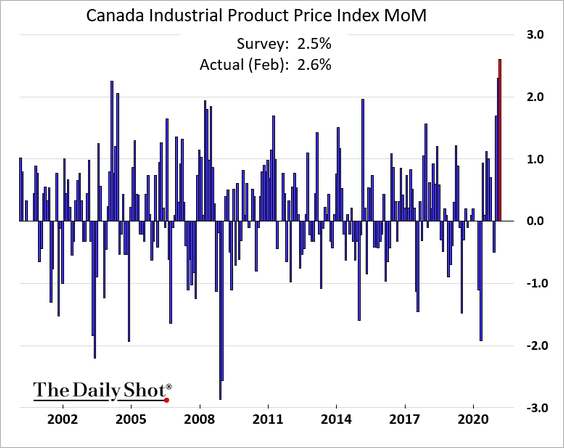
6. Industrial product prices rose sharply in February.
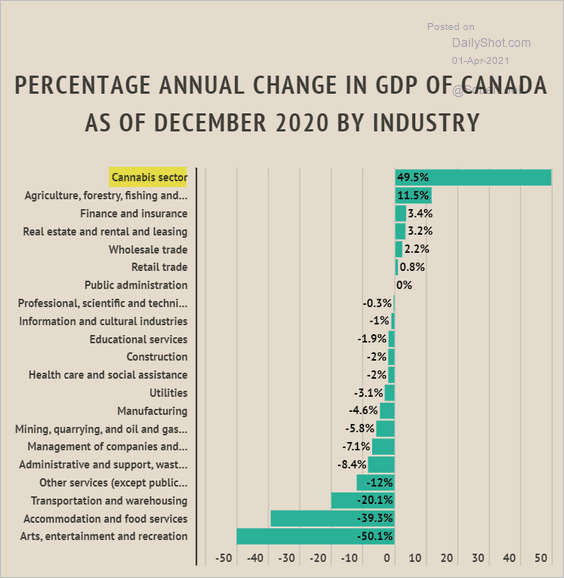
7. The cannabis sector outperformed other industries last year.
 Source: Rex Pascual
Back to Index
The United Kingdom
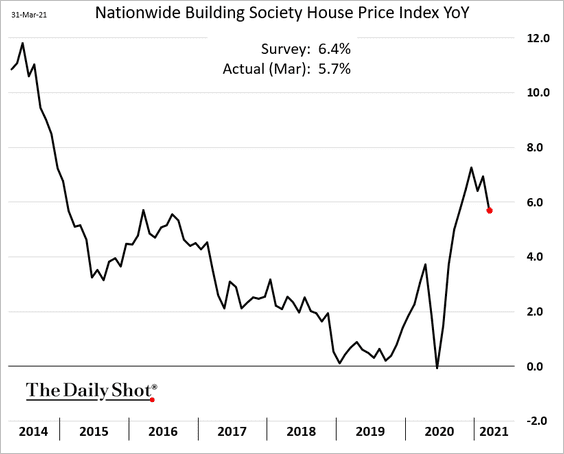
1. March home price appreciation was disappointing. The pullback, however, is likely to be short-lived.
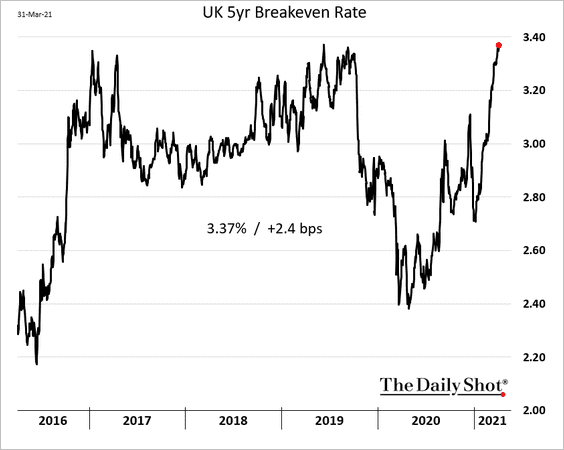
2. Market-based inflation expectations are climbing.
 Source: @TheTerminal, Bloomberg Finance L.P.
3. Gilts had a tough month.
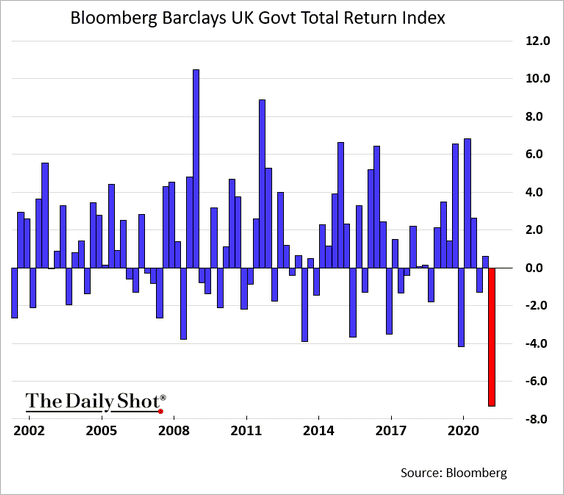 h/t @greg_ritchie
4. This chart shows UK aggregate tax revenues as a percent of GDP.
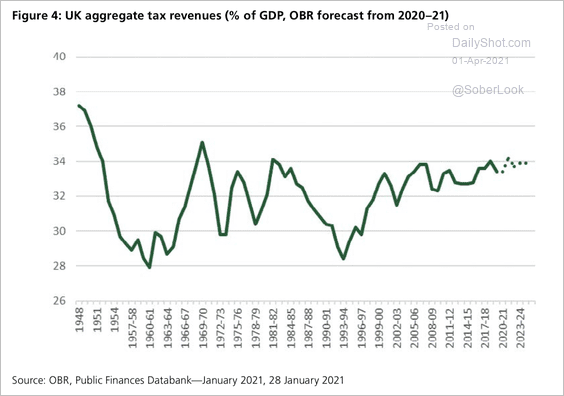 Source: House of Commons Treasury Committee Read full article
5. How is the government doing?
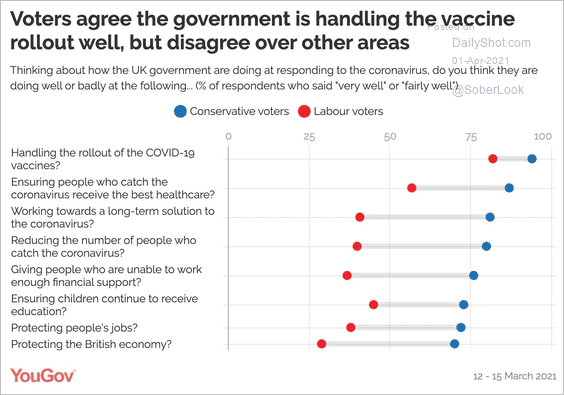 Source: YouGov Read full article
Back to Index
The Eurozone
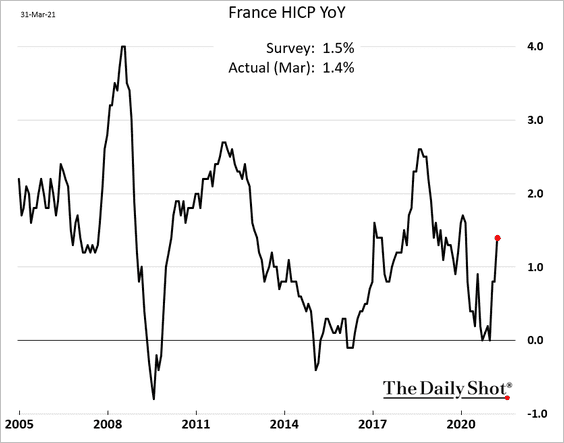
1. The second batch of inflation releases wasn’t as strong as the first.
• France:
• Italy:
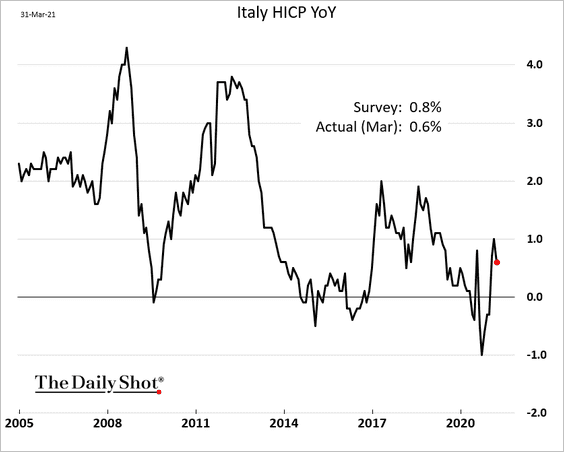
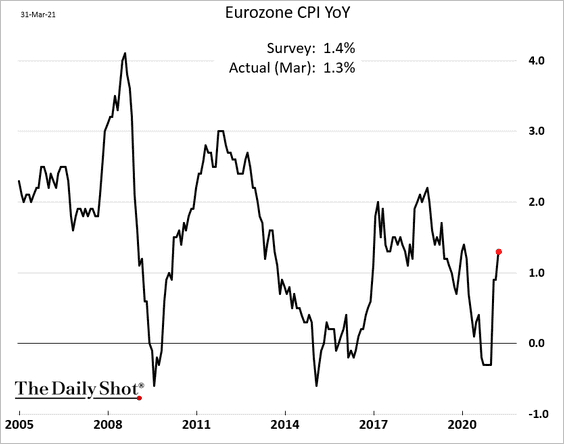
At the Eurozone level, the March CPI came in below forecasts.
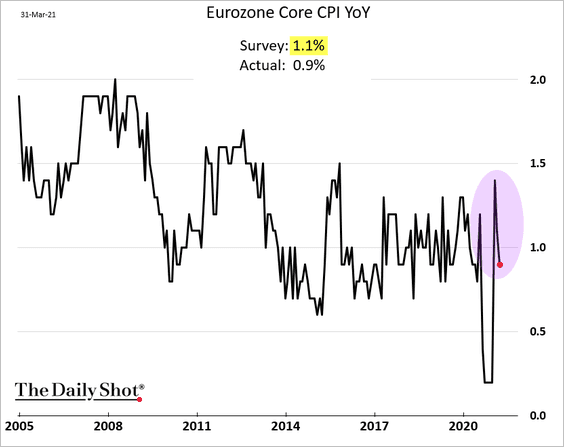
Here is the core CPI.
Energy was the key driver of CPI gains.
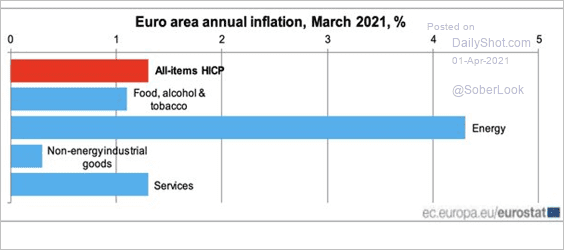 Source: @acemaxx, @EU_Eurostat Read full article
——————–
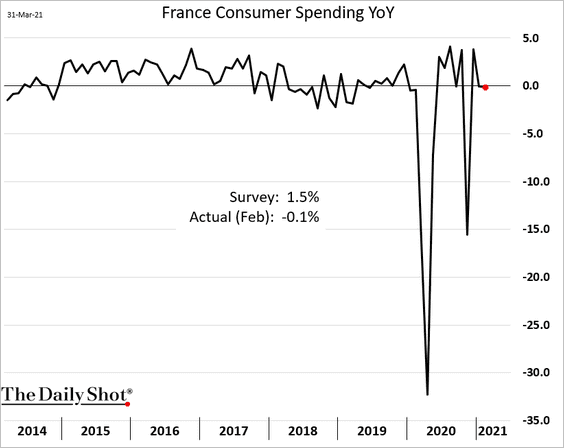
2. French consumer spending stalled in February (below consensus).
France’s manufacturing PMI has diverged from retail trade confidence over the past few months.
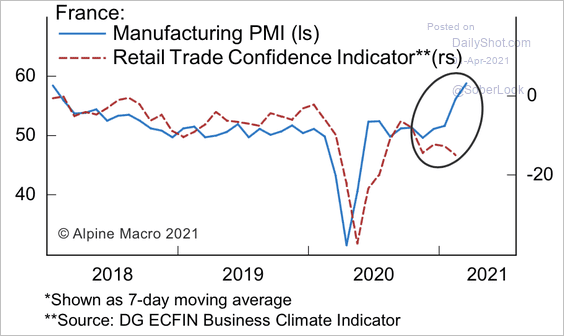 Source: Alpine Macro
——————–
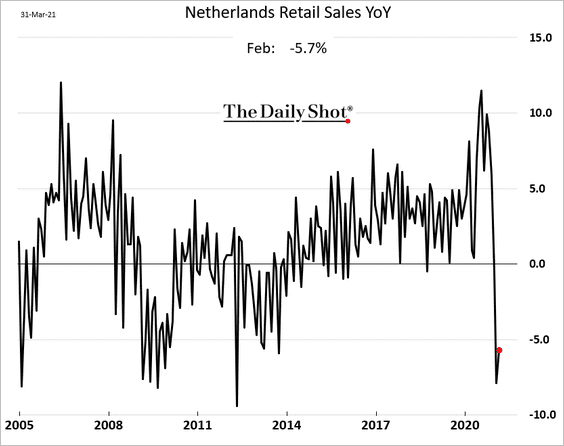
3. Dutch retail sales remained depressed in February.
4. Euro-area bank stocks have lagged US lenders over the past year.
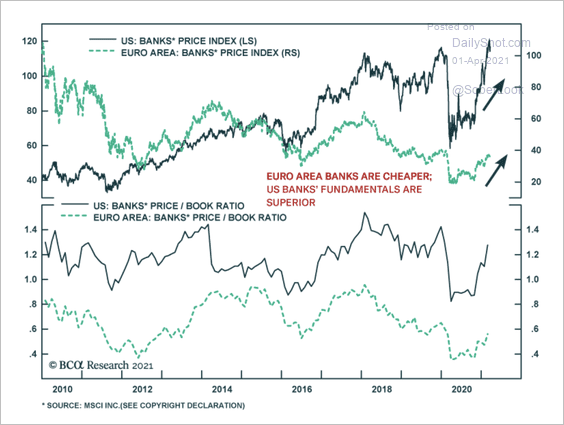 Source: BCA Research
5. Is the euro fundamentally cheap?
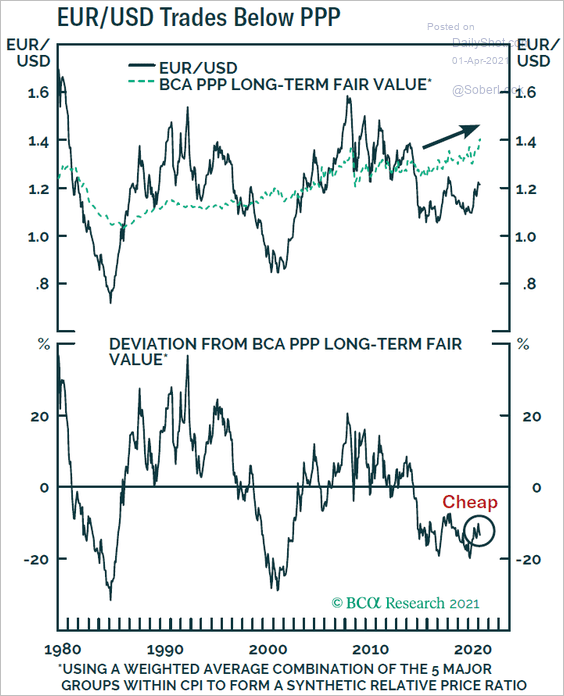 Source: BCA Research
Back to Index
Japan
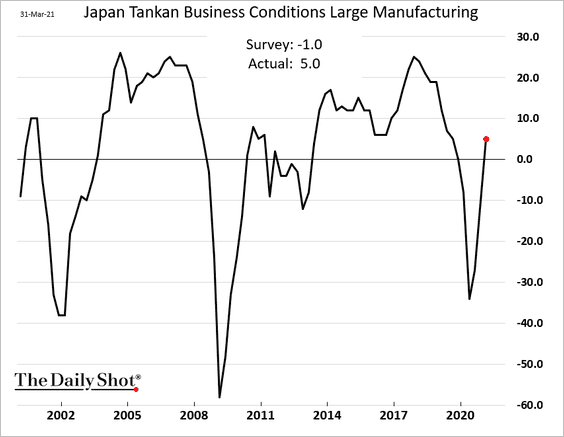
1. The Tankan report showed substantial improvements in the manufacturing sector during the first quarter.
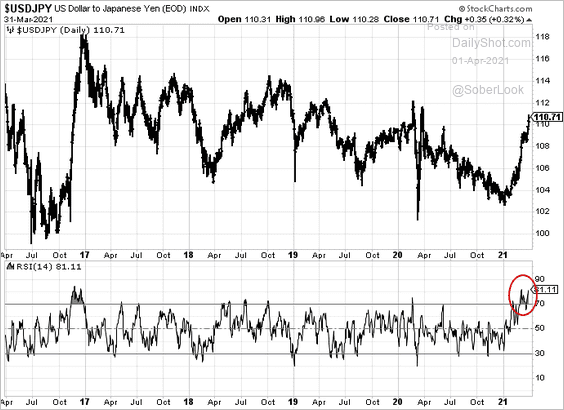
2. Technicals suggest that the dollar-yen rally is overextended.
Back to Index
Asia – Pacific
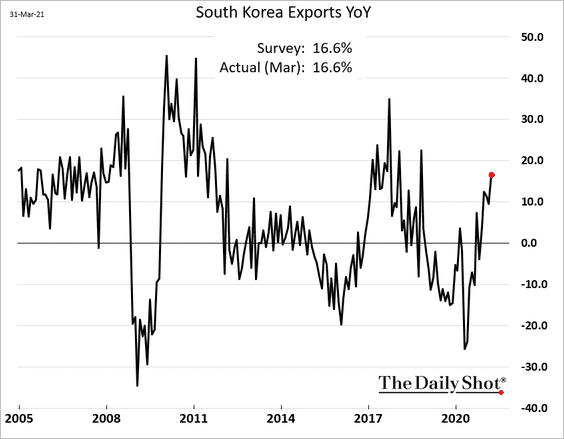
1. South Korea’s manufacturing activity remained robust in March.
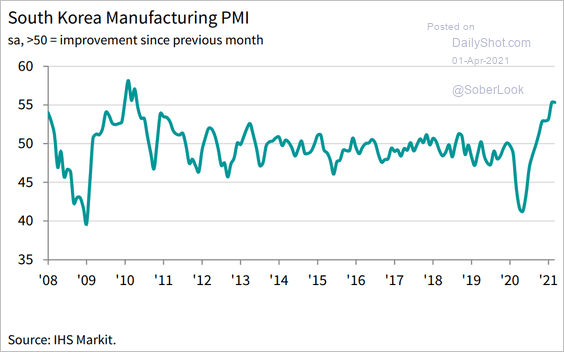 Source: IHS Markit
Exports climbed further.
——————–
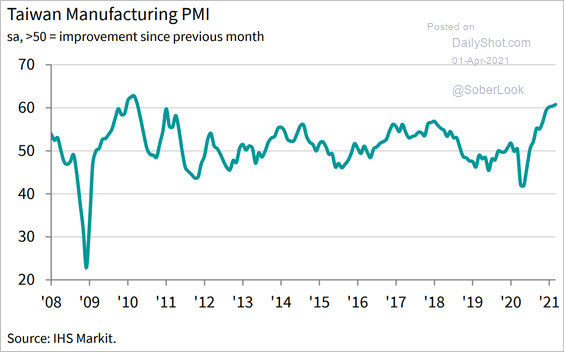
2. Taiwan’s manufacturing PMI is approaching record levels.
 Source: IHS Markit
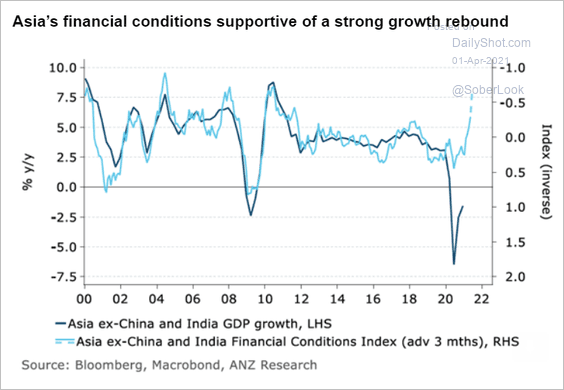
3. Financial conditions in Asia point to stronger growth ahead.
 Source: ANZ Research
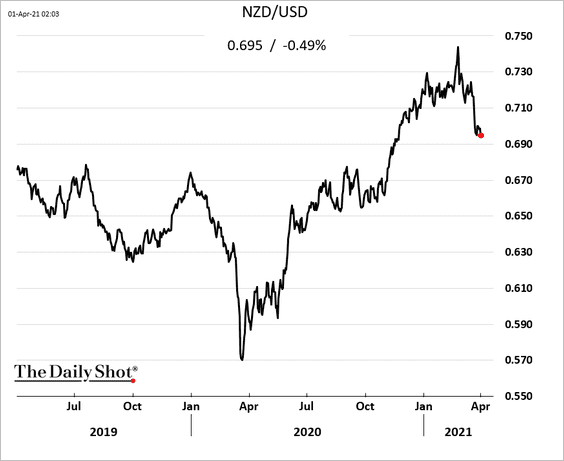
4. New Zealand’s consumer confidence pulled back in March.
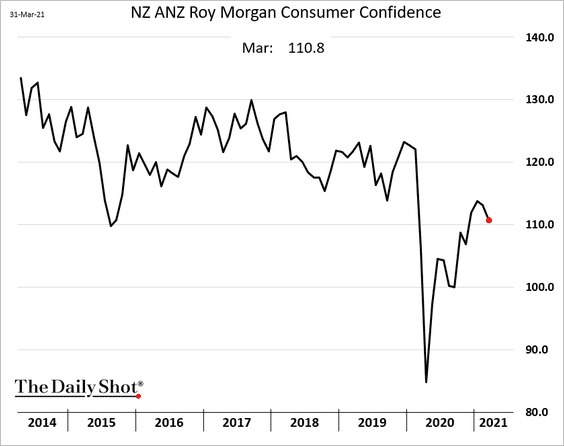
The Kiwi dollar is rolling over vs. USD.
Separately, where do visitors to New Zealand come from?
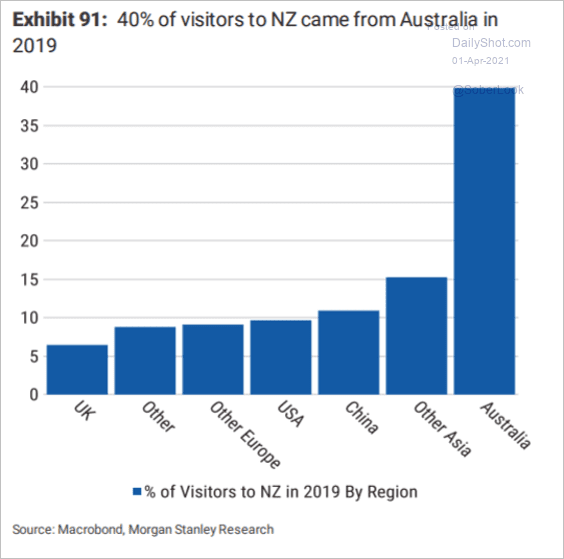 Source: Morgan Stanley Research
——————–
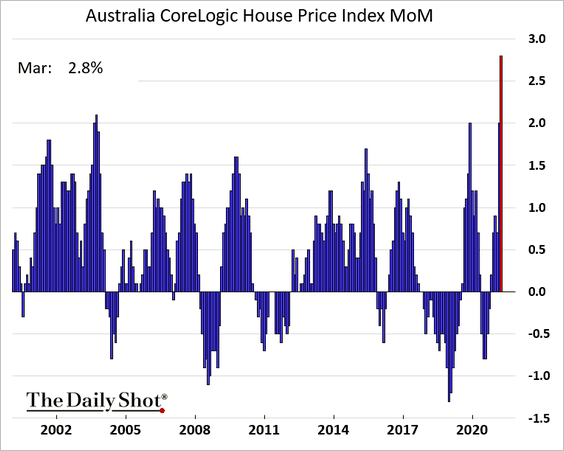
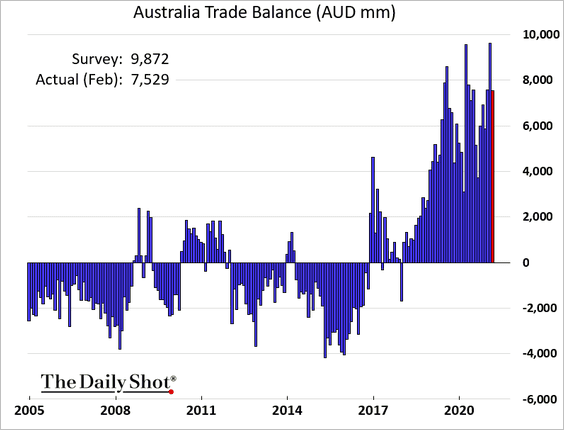
5. Next, we have some updates on Australia.
• Home prices surged in March.
• Construction lending is soaring.
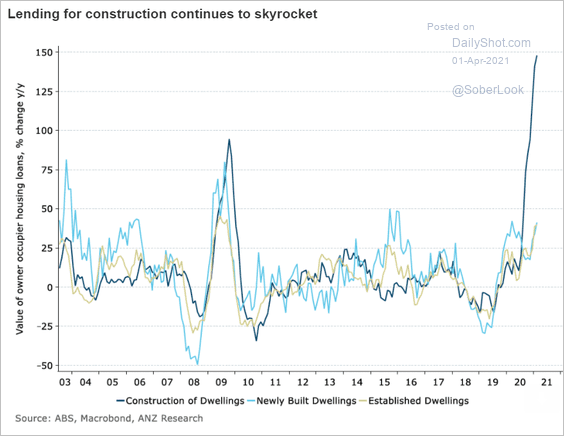 Source: ANZ Research
• The trade surplus was lower than expected in February due to softer iron ore sales.
Back to Index
China
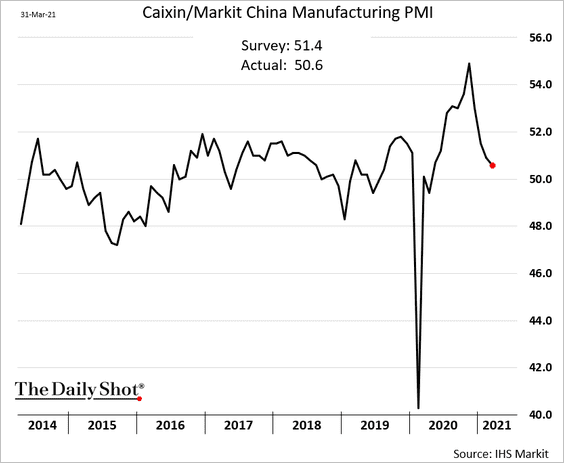
1. The Markit manufacturing PMI report was disappointing. It suggests that the rebound in activity last month may have been weaker than expected.
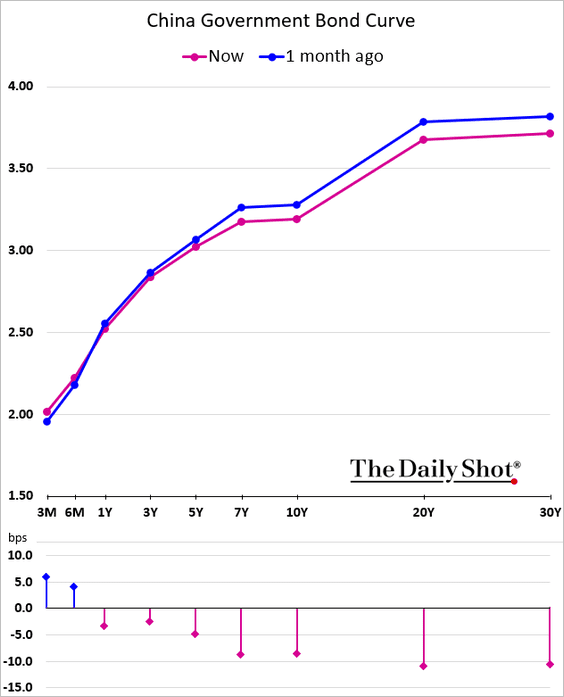
• The yield curve is flattening amid demand for longer-dated bonds.
• This chart shows China’s royalty payments to the US.
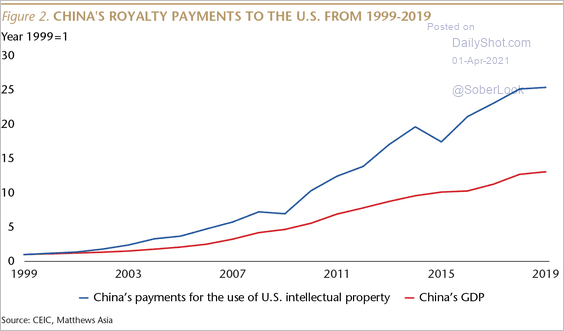 Source: Matthews Asia Read full article
Back to Index
Emerging Markets
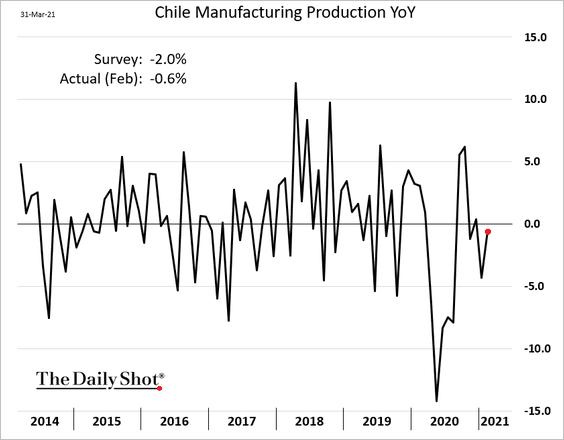
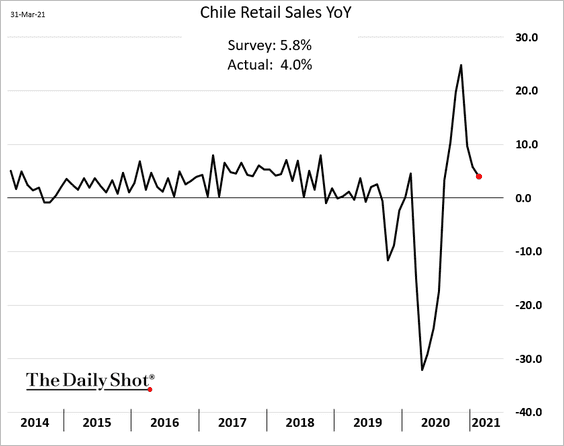
1. Let’s begin with Chile.
• Industrial production (better than expected):
• Retail sales (disappointing):
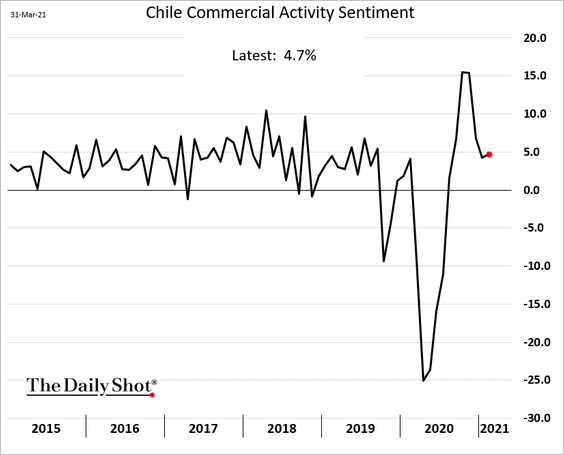
• Business sentiment (strong):
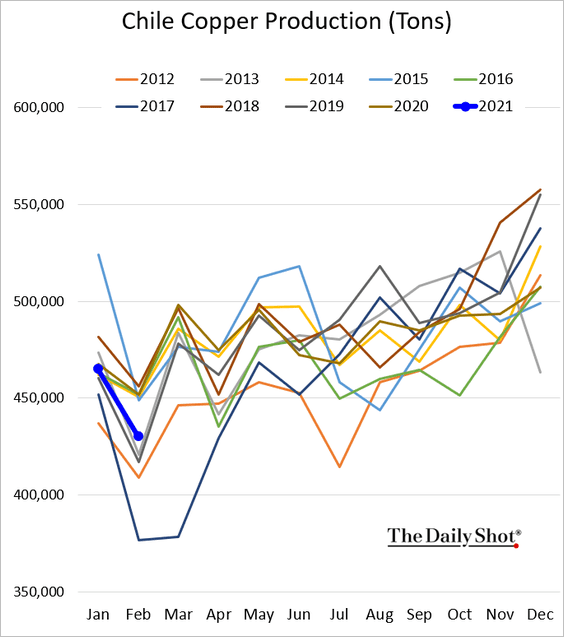
• Copper production:
——————–
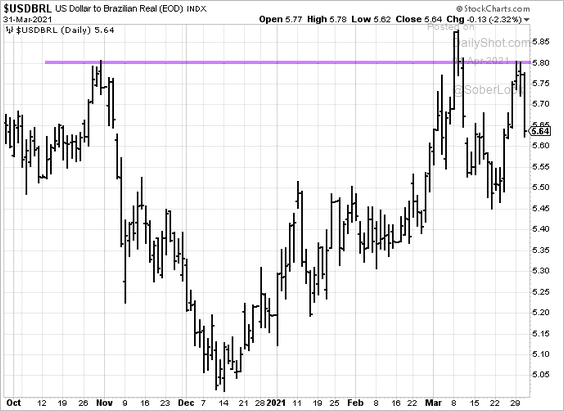
2. USD/BRL held resistance at 5.80.
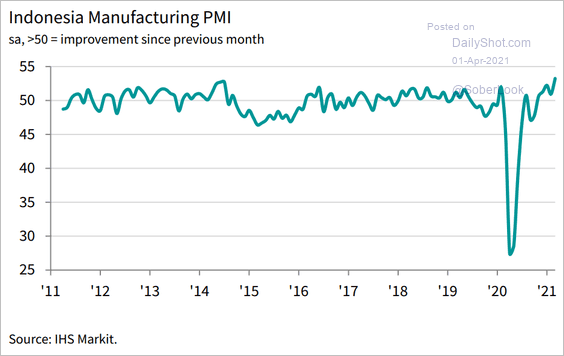
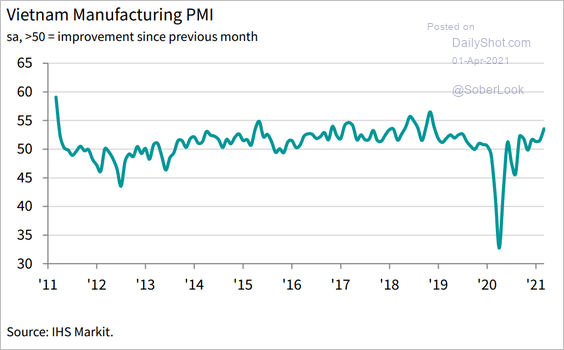
3. Next, let’s run through Asian manufacturing PMI trends.
• Indonesia and Vietnam (strong performers):
 Source: IHS Markit
 Source: IHS Markit
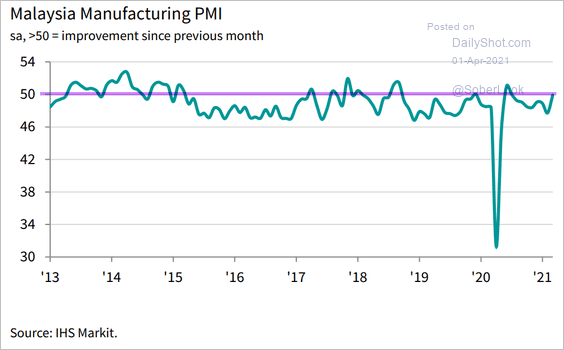
• Malaysia (stabilizing):
 Source: IHS Markit
• Thailand (still struggling):
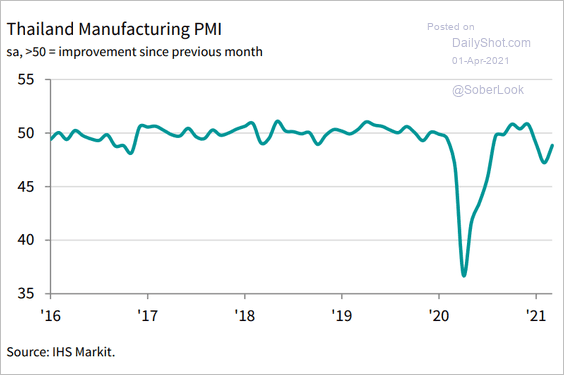 Source: IHS Markit
• Myanmar (activity halted):
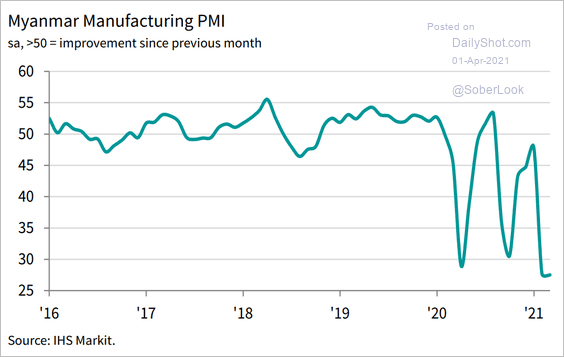 Source: IHS Markit
——————–
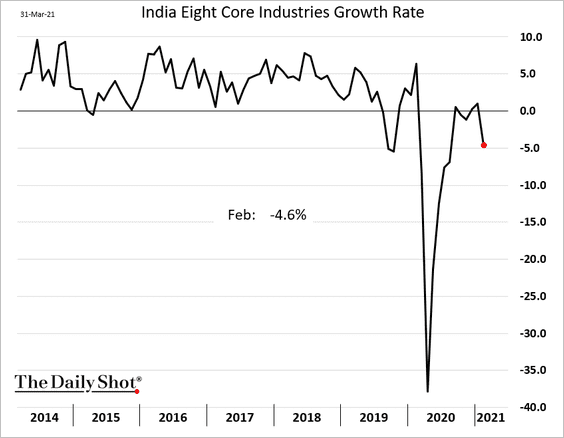
4. India’s core industries slowed in February.
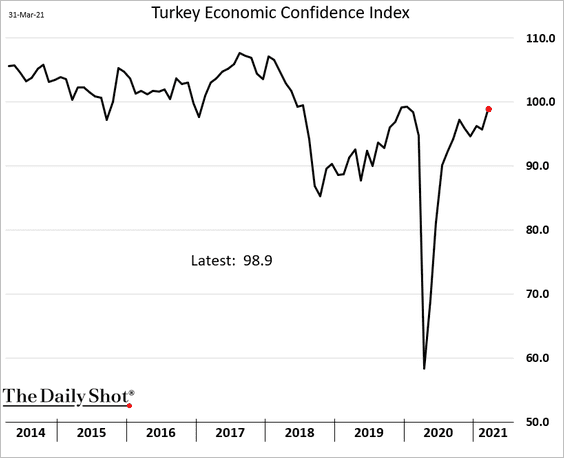
5. Turkey’s economic confidence continues to strengthen.
Back to Index
Commodities
1. Gold held support.
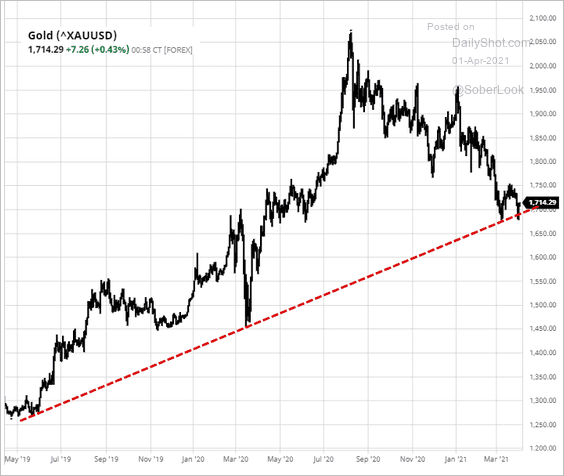 Source: barchart.com
2. Speculative long positioning in copper futures is at an extreme.
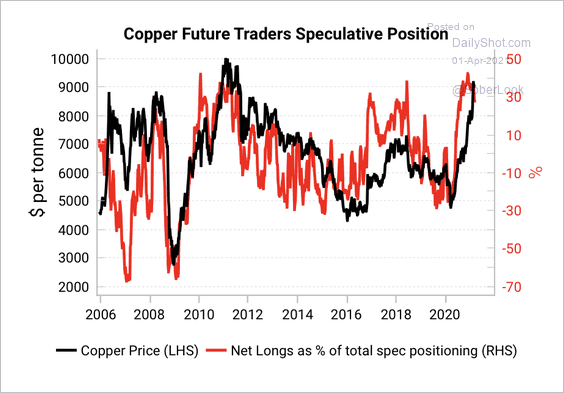 Source: Variant Perception
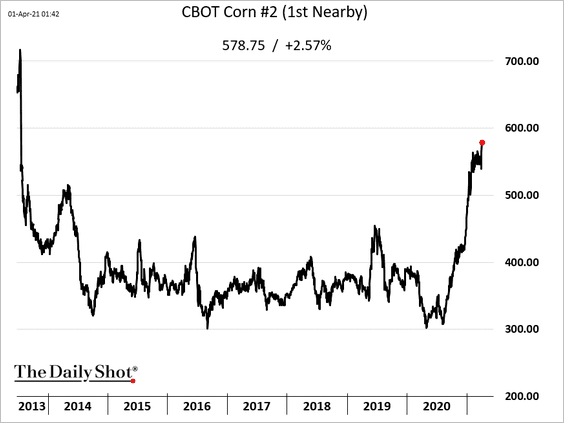
3. US corn futures hit a multi-year high in response to a smaller than expected US planting forecast. Soybean futures jumped as well.
Back to Index
Energy
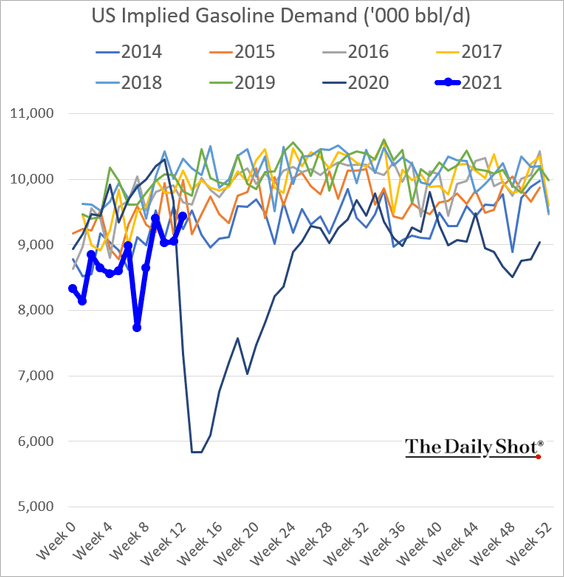
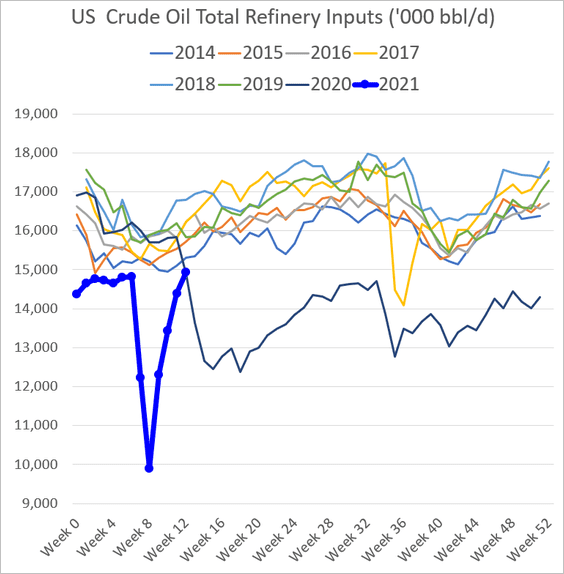
1. US gasoline demand continues to recover.
Refinery inputs are strengthening.
——————–
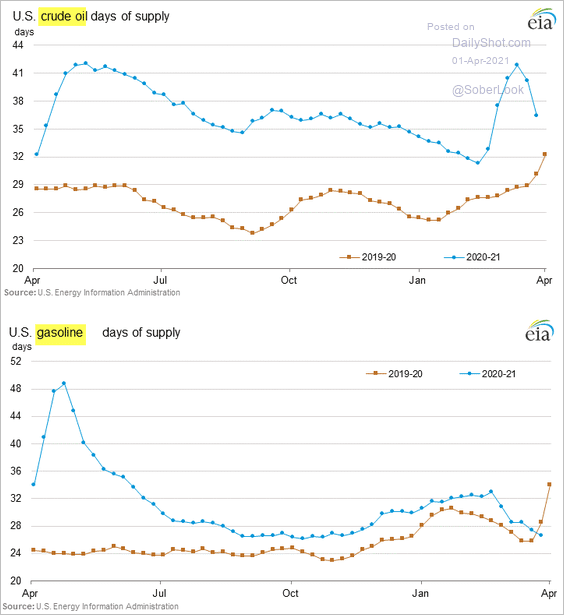
2. Measured in days of supply, US crude oil and gasoline inventories are trending lower.
3. US energy CapEx is expected to strengthen.
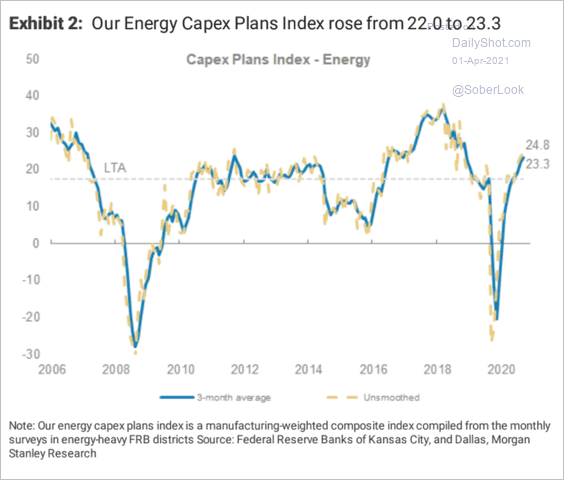 Source: Morgan Stanley Research
4. This chart shows the changes in global sources of electricity production.
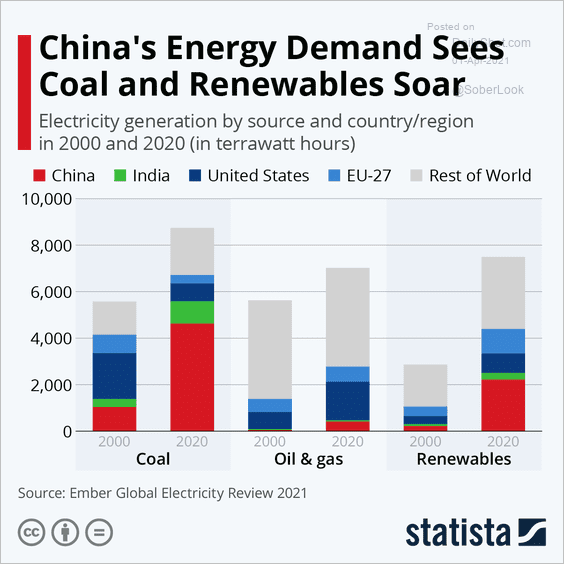 Source: Statista
Back to Index
Equities
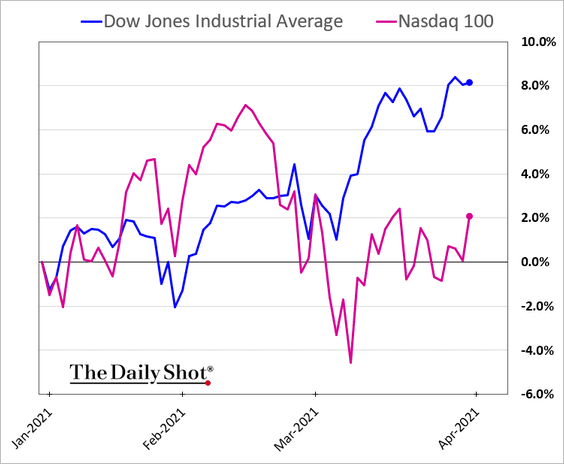
1. The Nasdaq 100 sharply underperformed the Dow in the first quarter.
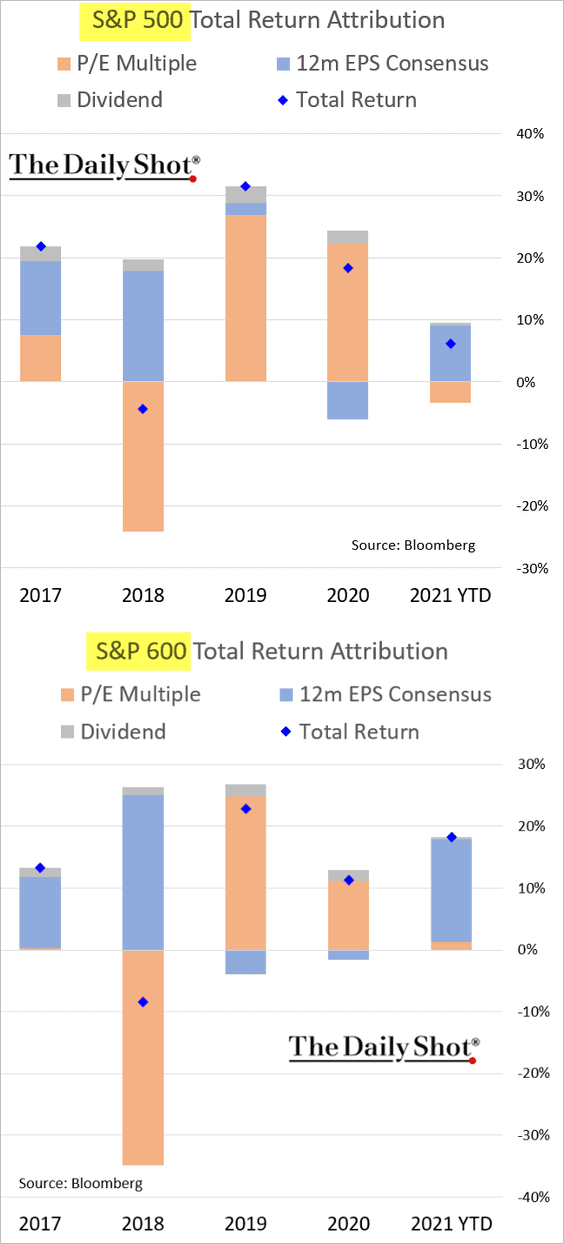
2. The charts below show year-to-date return attributions for the S&P 500 and the S&P 600 (small caps).
3. April tends to be a good month for stocks.
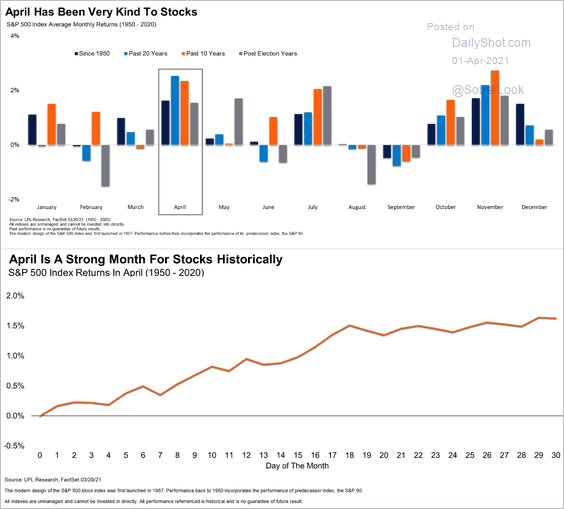 Source: Ryan Detrick, LPL Research
4. The second quarter of the presidential cycle also tends to be positive for equity performance.
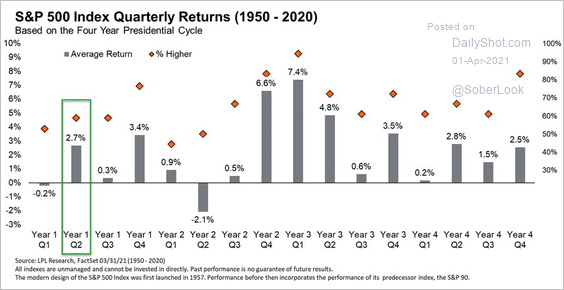 Source: @RyanDetrick
5. This chart shows cumulative flows into factor ETFs.
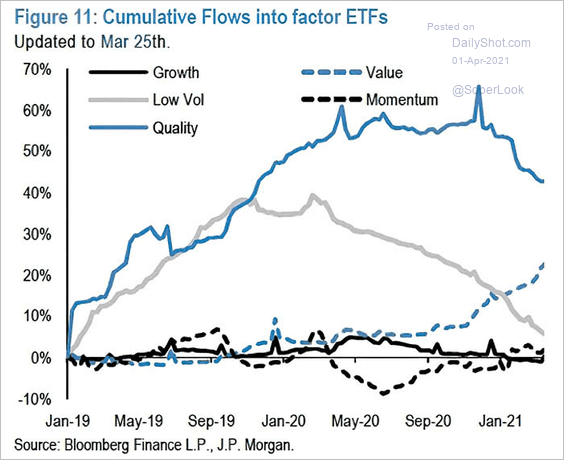 Source: @ISABELNET_SA, @jpmorgan
6. Who owns US stocks?
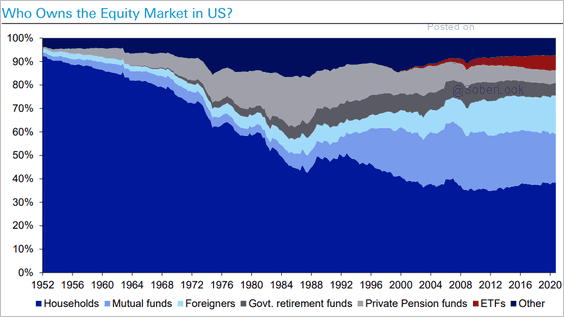 Source: Deutsche Bank Research
Back to Index
Credit
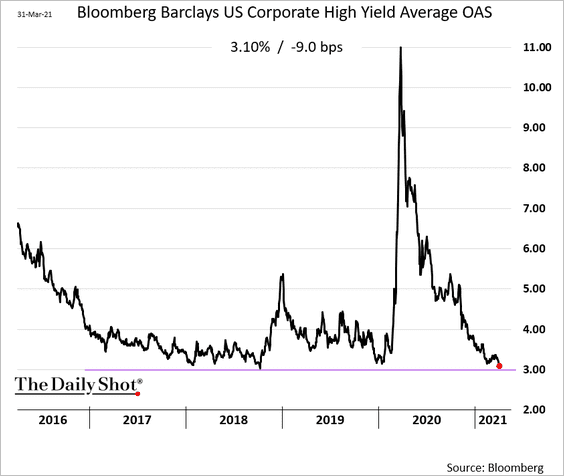
1. US high-yield spreads continue to drift lower.
2. Here is the history of rising stars and fallen angels (see overview).
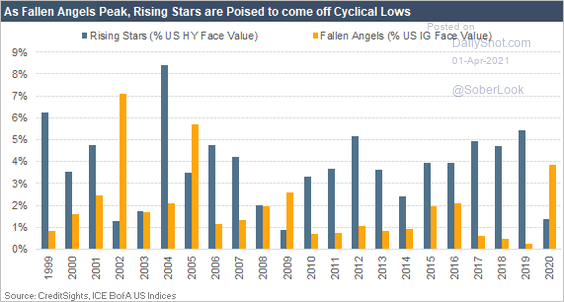 Source: CreditSights
Back to Index
Rates
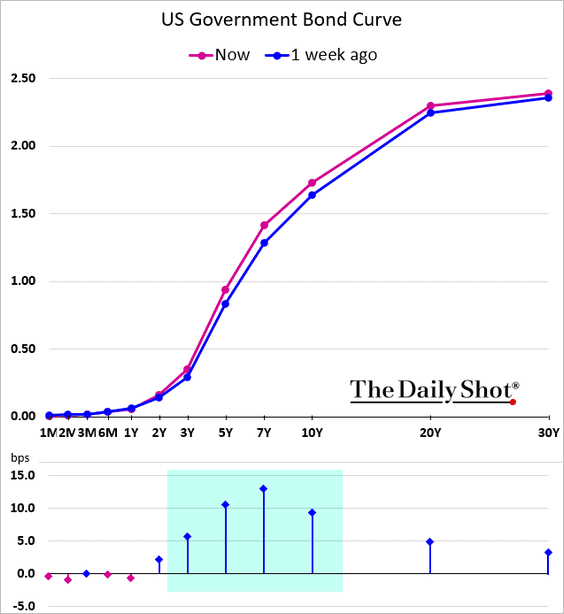
1. The Treasury curve’s “belly” saw the largest yield increases over the past week.
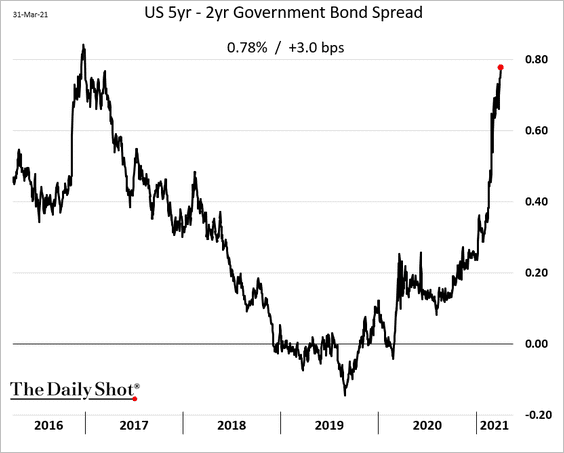
Here is the 5yr – 2yr yield spread.
——————–
2. It was a tough quarter for Treasuries.
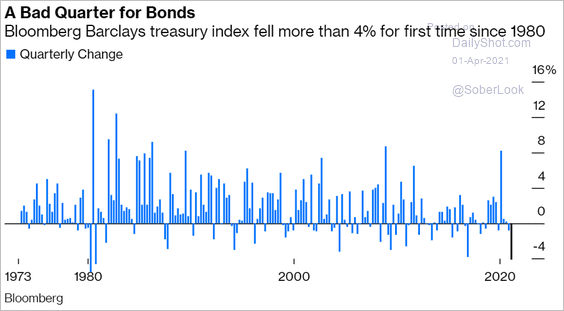 Source: @johnauthers, @bopinion Read full article
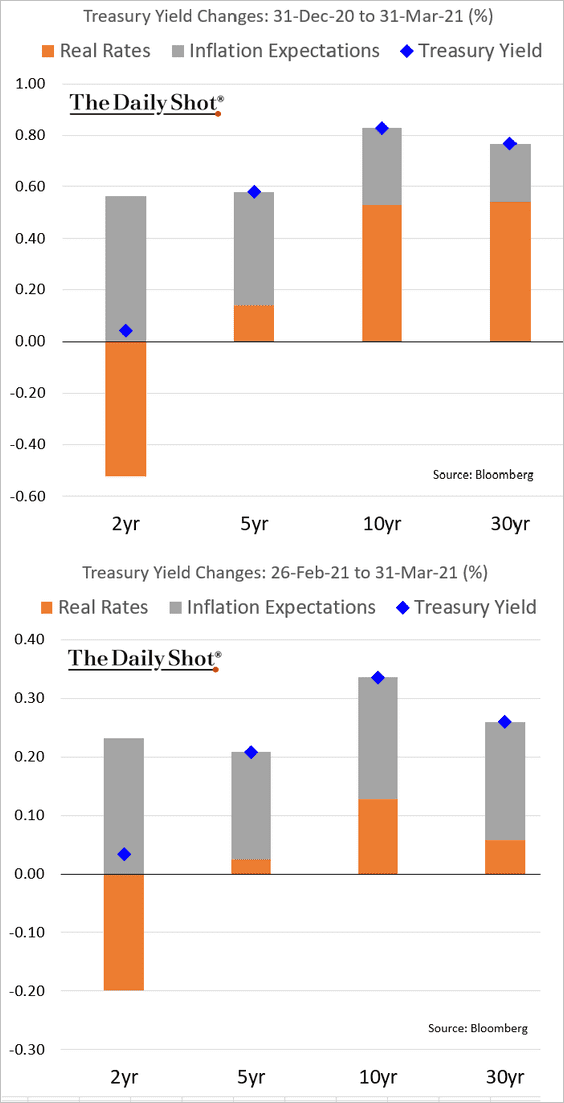
Below is the attribution for the month-to-date and year-to-date Treasury yield changes.
——————–
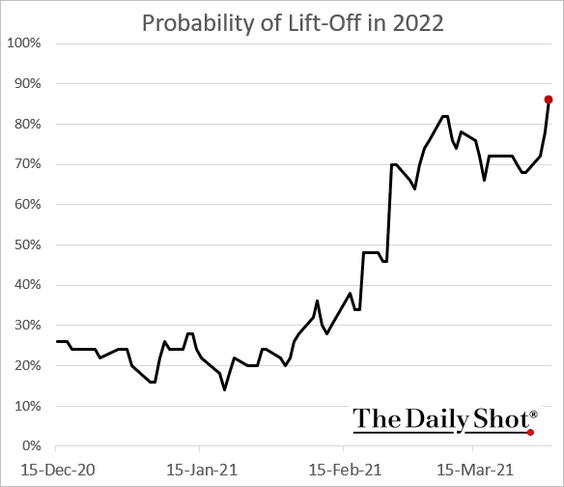
3. The market-based probability of a rate hike next year is approaching 90%.
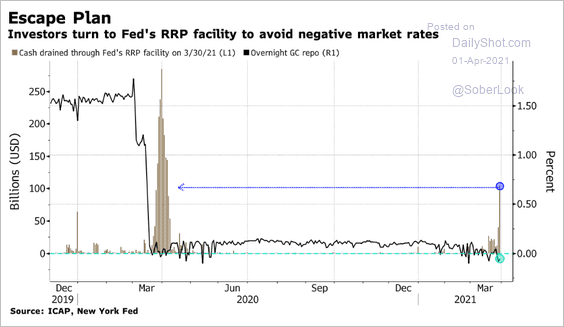
4. The Fed opened the RRP (reverse repo) program to more players. The chart below shows increased uptake for the program. The idea is to create a floor under repo rates as the market gets flooded with liquidity.
 Source: @StephenSpratt, @TheTerminal Further reading
Back to Index
Global Developments
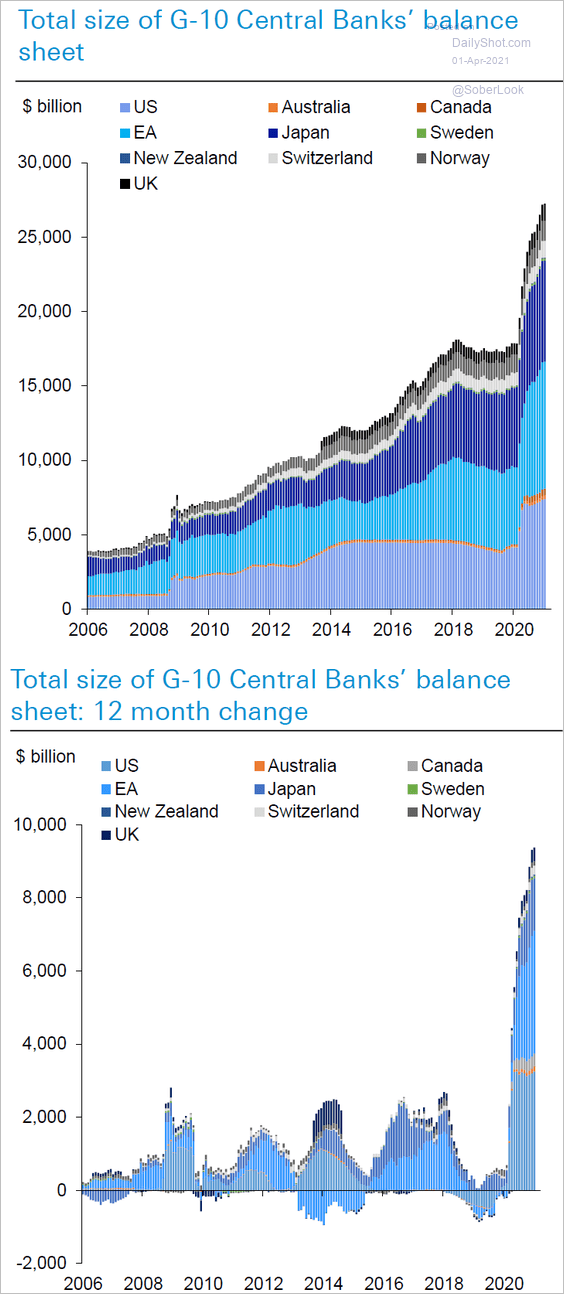
1. Here is the G-10 central banks’ combined balance sheet and the 12-month changes.
 Source: Deutsche Bank Research
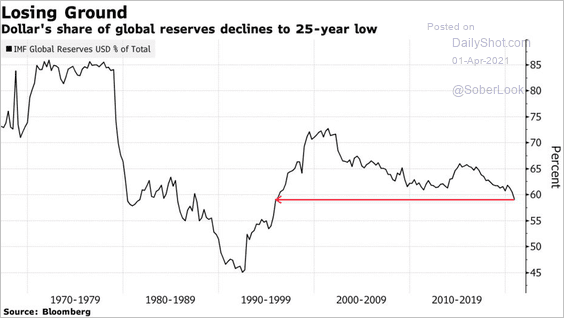
2. The US dollar’s share of global reserves is drifting lower.
 Source: @markets Read full article
3. Global trade is surging.
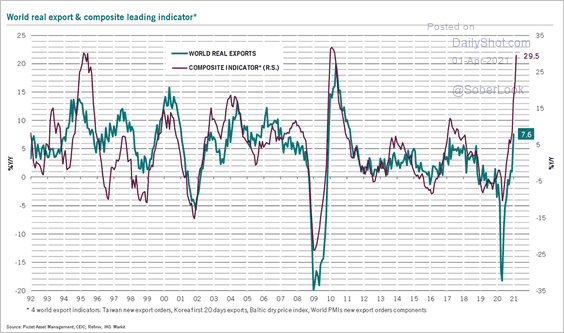 Source: @PkZweifel
4. Investment banks’ margins spiked last year.
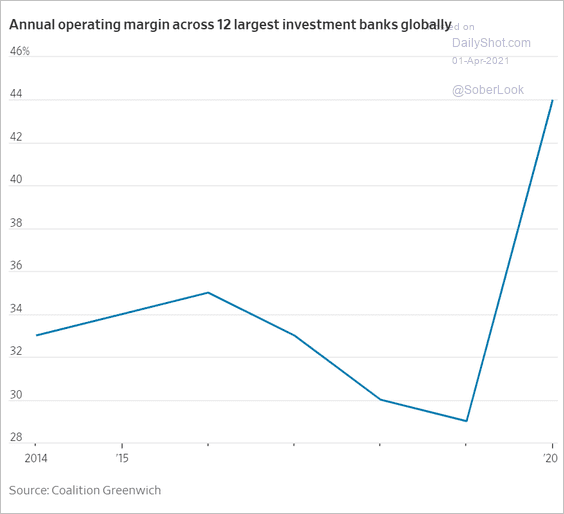 Source: @WSJ Read full article
5. According to the World Economics SMI report, global business confidence and staffing levels are recovering.
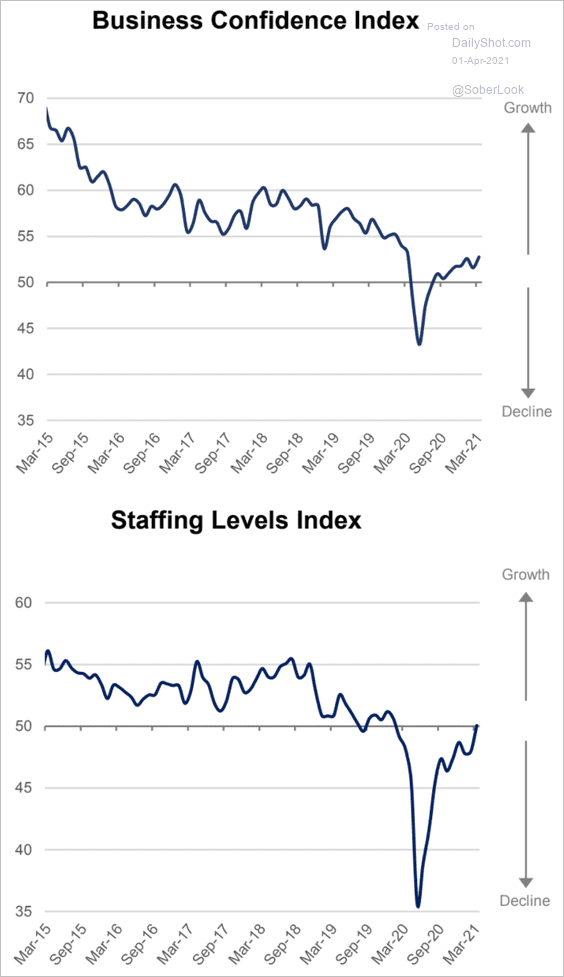 Source: World Economics
——————–
Food for Thought
1. Global 5G adoption:
 Source: Statista
2. NASA’s share of the federal budget:
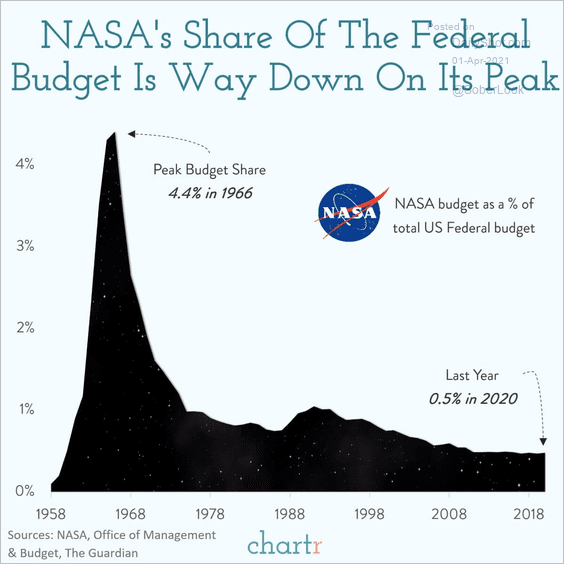 Source: @chartrdaily
3. Federal prison population:
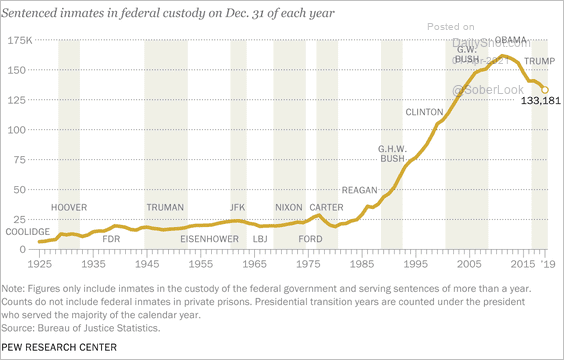 Source: Pew Research Center Read full article
4. Americans wearing masks:
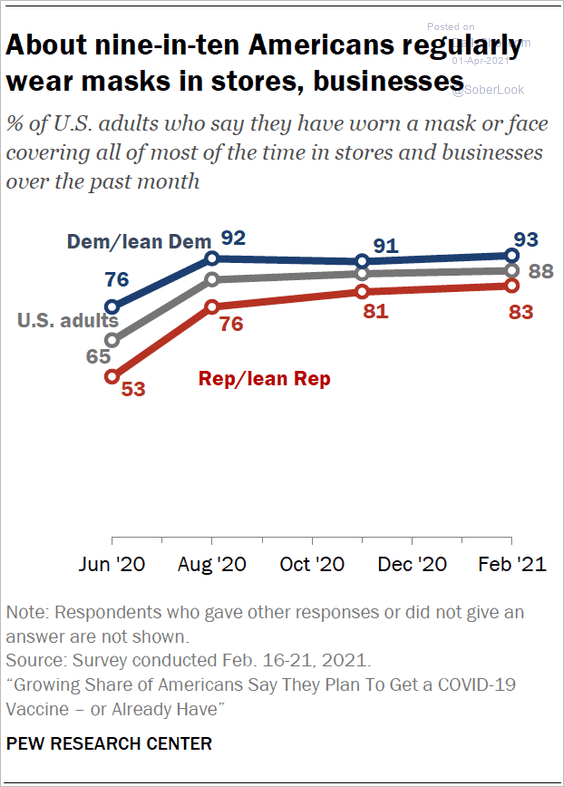 Source: Pew Research Center Read full article
5. Estimated deaths from air pollution:
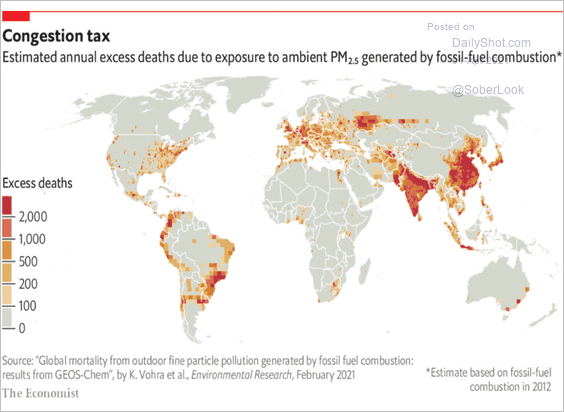 Source: The Economist Read full article
6. Share of children in poverty in advanced economies:
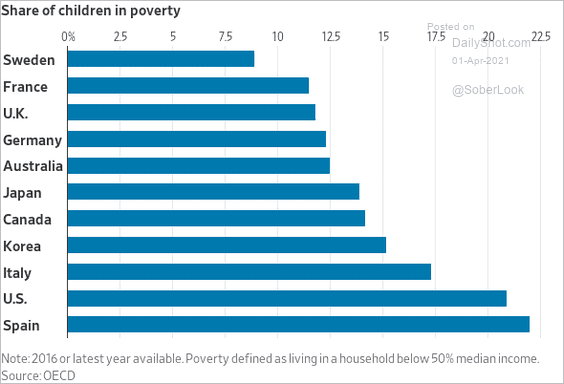 Source: @WSJ Read full article
7. Projected US Border Patrol apprehensions:
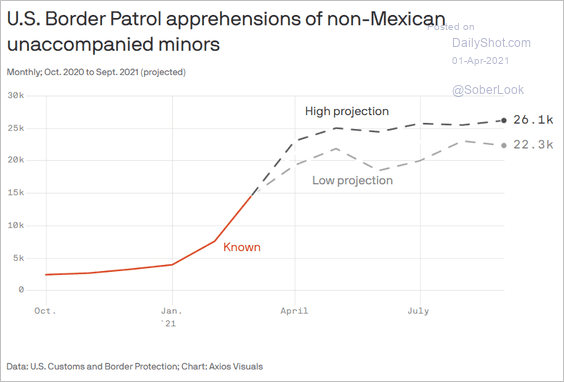 Source: @axios Read full article
8. US life expectancy:
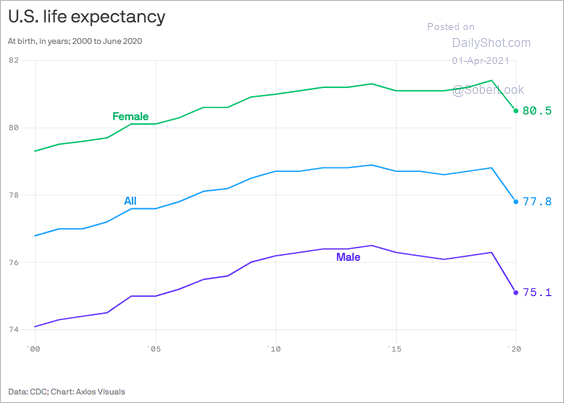 Source: @axios Read full article
9. Vaccination numbers vs. COVID cases:
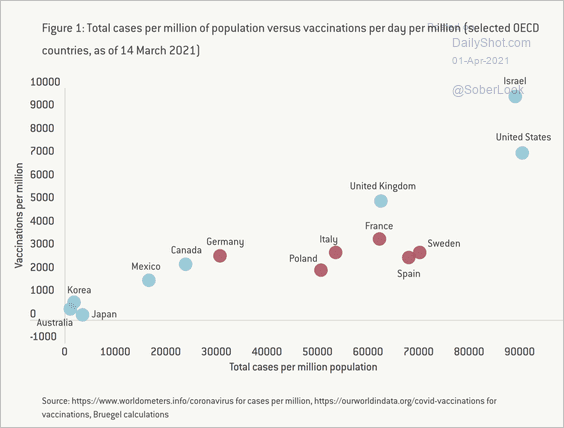 Source: Bruegel Read full article
10. Oldest universities in Europe:
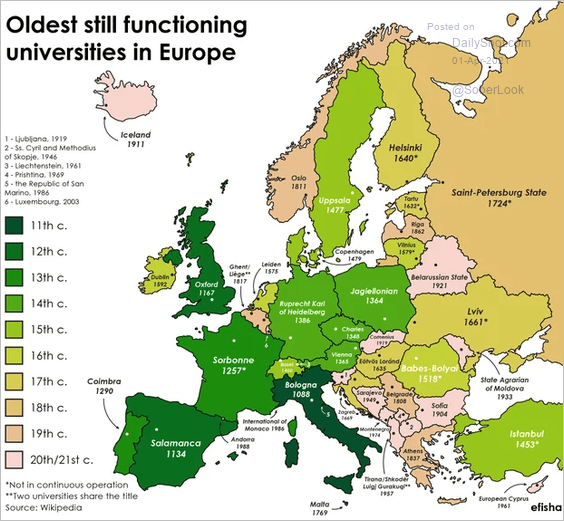 Source: r/europe
——————–
The next Daily Shot will be out on Monday, April 5th.
Have a great weekend!
Back to Index