
The Daily Shot: 07-Apr-21
• The United States
• Europe
• Asia – Pacific
• Emerging Markets
• Cryptocurrency
• Commodities
• Equities
• Credit
• Rates
• Global Developments
• Food for Thought
The United States
1. Job openings spiked in February, rising well above consensus.

Leisure & Hospitality saw substantial gains, …

… and healthcare vacancies hit a new high.

This chart shows voluntary resignations (quits rate) vs. layoffs.

2. Evidence of tightening labor markets continues to build.
 Source: Bloomberg Read full article
Will the US be back to “full employment” by year-end?
 Source: BCA Research
The job openings rate is now the highest on record.

The Beveridge curve’s current dislocation (below) suggests that there is a skills gap and/or some unemployed Americans are unable or unwilling to return to work.
 Source: Bureau of Labor Statistics
Childcare challenges have contributed to the lack of available workers. But that issue has been receding as schools reopen.
 Source: Deutsche Bank Research
As the pandemic eases, businesses will need to boost wages to attract and retain staff.
 Source: @axios Read full article
A third of young workers plan to look for a new job.
 Source: Prudential Financial
Tight labor markets may drive wage inflation.
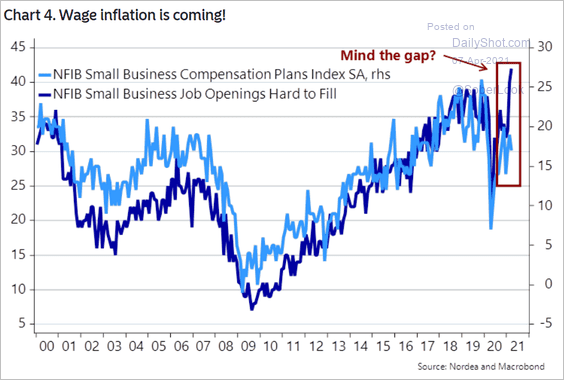 Source: Martin Enlund and Andreas Steno Larsen, Nordea Markets
Higher commodity prices are unlikely to create a sustained increase in inflation. But persistent wage gains could.
——————–
3. Americans are spending more. While they are still cautious about credit card debt, debit card spending has increased sharply, according to BofA data. Because of the base effects, we should be looking at the 2-year changes (light blue).
 Source: BofA Global Research
Here is the direct impact of stimulus checks.
 Source: BofA Global Research
Morgan Stanley’s index suggests that we should see a sharp increase in retail sales.
 Source: Morgan Stanley Research
——————–
4. Money supply growth is now similar to other periods of high inflation.
 Source: BofA Global Research
5. Small businesses in some sectors continue to struggle.
 Source: Alignable Read full article
Rising costs are a growing concern.
 Source: Alignable Read full article
——————–
6. Hotel occupancy continues to recover.
 Source: Hoya Capital Real Estate
7. US financial conditions keep easing.

Back to Index
Europe
1. The Eurozone unemployment rate was higher than expected in February.

Italy’s unemployment rate was well above consensus.

——————–
2. The Sentix investor confidence index hit the highest level since 2018. The expectations index (2nd chart) is at an all-time high.

3. Norway’s manufacturing activity accelerated further last month.

Back to Index
Asia – Pacific
1. The Hong Kong dollar is drifting lower.

2. Next, we have some updates on Australia.
• The AIG construction index hit a record high.

• Consumer confidence eased.

• Australian bank shares are outperforming peers across Asia.
 h/t Thuy Ong
Back to Index
Emerging Markets
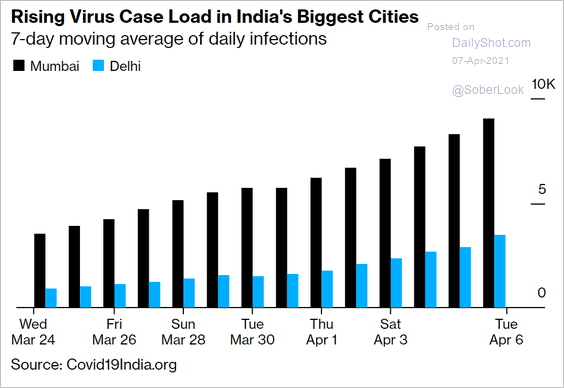
1. India’s central bank left rates unchanged as the COVID situation worsens.
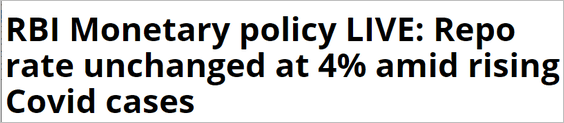 Source: Business Standard Read full article
 Source: @markets Read full article
Bond yields and the rupee are lower.


——————–
2. Next, we have some updates on Russia.
• Last month’s car sales surprised to the downside.

• Recovery in consumer confidence will take time.

• Inflation topped economists’ forecasts.

——————–
3. South Africa’s electricity production and consumption declined further in February.

4. Mexico’s consumer confidence is improving.

Vehicle sales are picking up.

——————–
5. Brazil’s service-sector activity deteriorated further last month as the pandemic worsened.

6. Will Argentina default on its IMF debt?
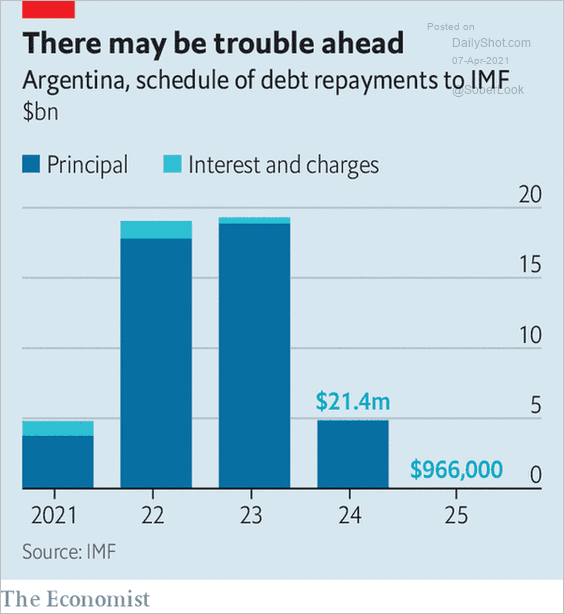 Source: The Economist Read full article
Argentina’s vehicle production is recovering.

——————–
7. EM core inflation is rising above trend.
 Source: TS Lombard
Back to Index
Cryptocurrency
1. An activist family office wants Grayscale to fix the widening discount to NAV.
 Source: Cision Read full article
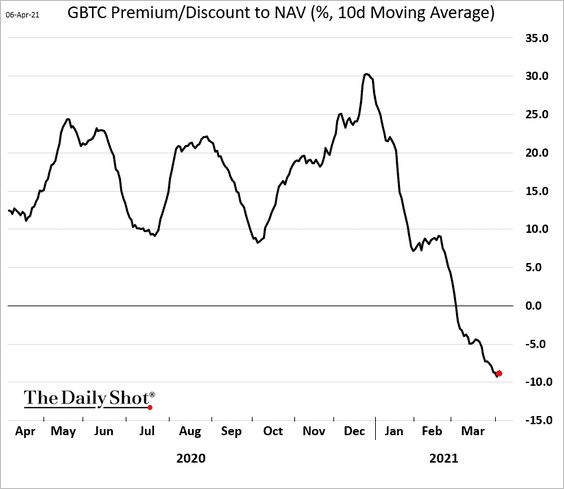 Source: Bloomberg
——————–
2. China has launched its digital currency, giving Beijing additional control over consumers and commerce. Will the digital yuan become popular in countries outside of China?
 Source: @WSJ Read full article
3. There are more long-term holders of bitcoin.
 Source: Visual Capitalist Read full article
4. This chart shows the open interest in CME’s bitcoin futures.
 Source: DBS Economics & Strategy
Back to Index
Commodities
1. US farmers’ sentiment is back near the highs amid rising commodity prices.
 Source: Purdue University/CME Group Ag Economy Barometer Read full article
Farmland prices are expected to keep rising.
 Source: Purdue University/CME Group Ag Economy Barometer Read full article
——————–
2. Chicago lean hog futures are trading near multi-year highs, …

… amid tightening supplies. This chart shows price gains.
 Source: Bloomberg Read full article
Pork belly and retail bacon prices have been rising.

 h/t @PattonLes
Back to Index
Equities
1. Market breadth has been impressive.
 h/t @TheOneDave
2. Here is BCA’s risk appetite index vs. the S&P 500.
 Source: Anastasios Avgeriou, BCA Research
3. How much did companies boost their dividends this year (by sector)?
 Source: J.P. Morgan Asset Management
4. Lower correlated sector performance and greater valuation dispersion over the past three months could benefit individual stock selection strategies.
 Source: MarketDesk Research
Lower equity correlations could improve the diversification benefits of non-US equities.
 Source: Gavekal Research
However, the MSCI AC World ex-US Index overweights countries that are net commodity importers (rising commodity prices could weigh on growth and earnings).
 Source: Gavekal Research
——————–
5. Hedge funds have not jumped on the cyclical-sector bandwagon.
 Source: BofA Global Research, Bloomberg Read full article
6. This chart shows yearly returns and intra-year drawdowns.
 Source: J.P. Morgan Asset Management
7. Spending on buybacks has soared since the financial crisis.
 Source: BofA Global Research
8. How much could corporate taxes rise (2 charts)?
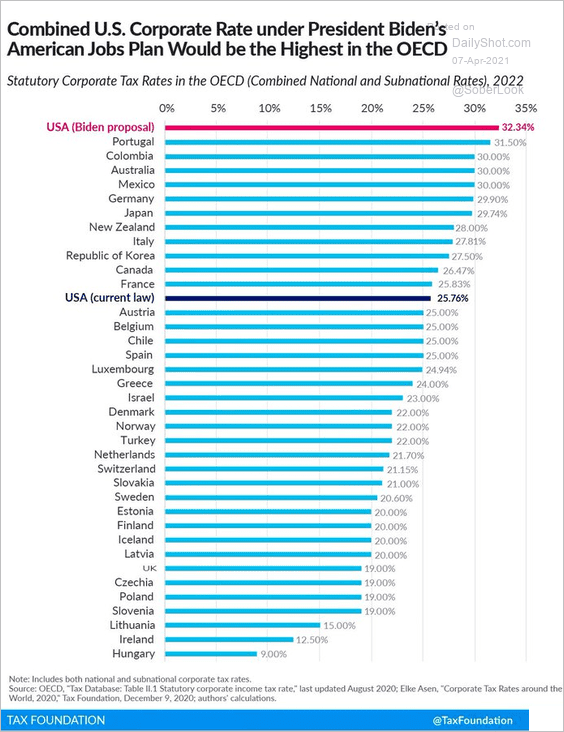 Source: @LizAnnSonders, @TaxFoundation
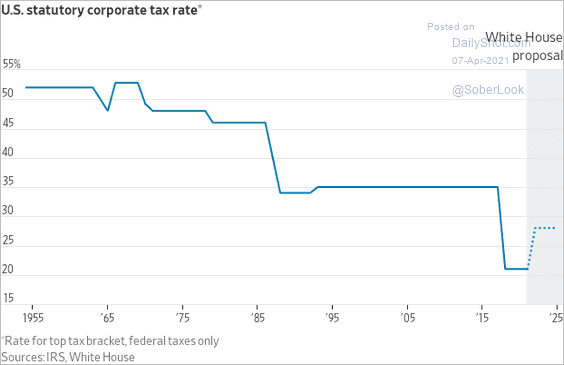 Source: @jeffsparshott
How much did different sectors benefit from the 2017 tax cut?
 Source: @WSJ Read full article
What would be the impact of tax hikes on earnings?
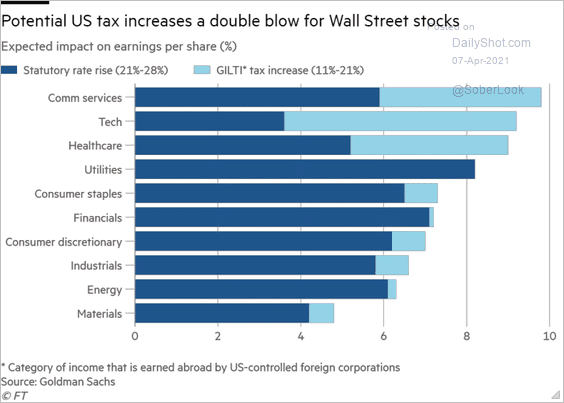 Source: @financialtimes Read full article
Back to Index
Credit
1. The divergence in US chapter 11 and chapter 7 bankruptcy filings last year suggests a backlog of failures for smaller firms.
 Source: Fitch Ratings
This chart shows the number of large-company filings over time.
 Source: Bloomberg Read full article
——————–
2. Bankruptcies in advanced economies fell last year, in sharp contrast to past recessions.
 Source: Fitch Ratings
Here is a look at corporate insolvencies across select countries.
 Source: Fitch Ratings
——————–
3. The number of US corporate bonds trading at distressed levels has been drifting lower.
 Source: Bloomberg Read full article
4. The share of US delinquent subprime auto borrowers keeps climbing.
 Source: @WSJ Read full article
5. The US delinquency rate on first-lien mortgages remains elevated.
 Source: Black Knight
The increase in first-lien mortgage delinquencies in February was primarily driven by early-stage borrowers (one missed payment).
 Source: Black Knight
Back to Index
Rates
Short interest in the iShares 20+ year Treasury ETF is at multi-year highs. It suggests that the Treasury selloff may pause for some time.
 Source: Bloomberg Read full article
Back to Index
Global Developments
1. The dollar has recovered along with the rise in yields over the past few months.
 Source: Alpine Macro
Will the dollar experience another leg lower? (3 charts)
 Source: BCA Research
 Source: BCA Research
 Source: Alpine Macro
——————–
2. Global international debt is mostly in US dollars.
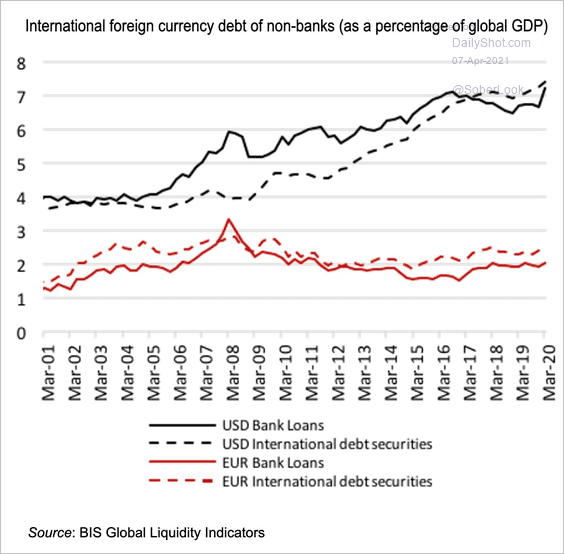 Source: @adam_tooze, VOX EU Read full article
3. Fed rate hikes tend to hit multi-asset portfolios.
 Source: @ISABELNET_SA, @jpmorgan
4. This chart shows inflation expectations for the US and the Eurozone.
 Source: Deutsche Bank Research
5. The IMF boosted its forecasts for global growth.
 Source: Mizuho Securities USA
Here is the IMF forecast for 2024 relative to the pre-COVID trend.
 Source: Mizuho Securities USA
——————–
Food for Thought
1. US box office revenue surged over the holiday weekend.
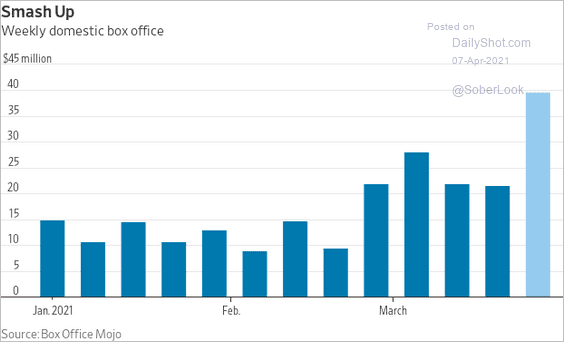 Source: @WSJ Read full article
2. Data on non-dairy alternatives:
• Preferences:
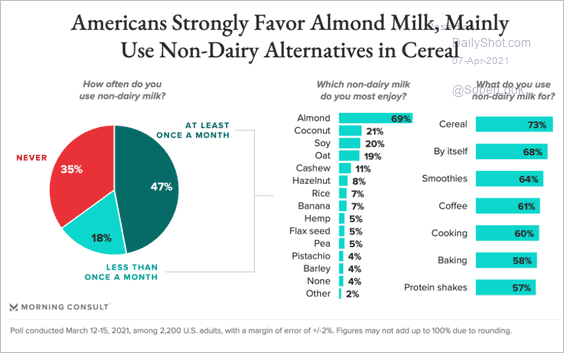 Source: Morning Consult Read full article
• Search trends:
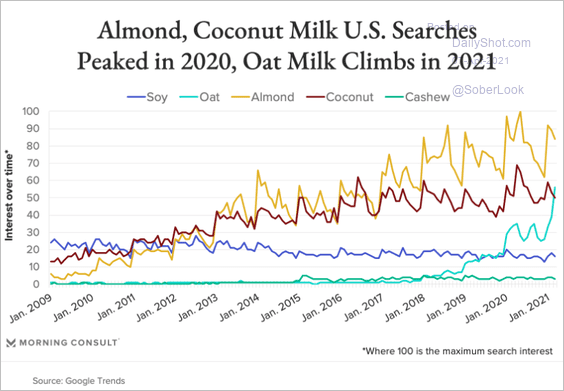 Source: Morning Consult Read full article
• Reasons for choosing alternative milk:
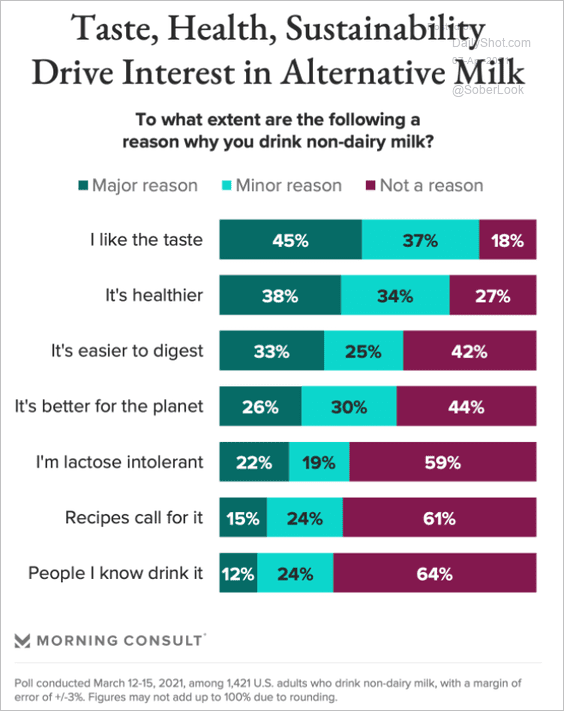 Source: Morning Consult Read full article
——————–
3. Square meters of property $1 million can buy:
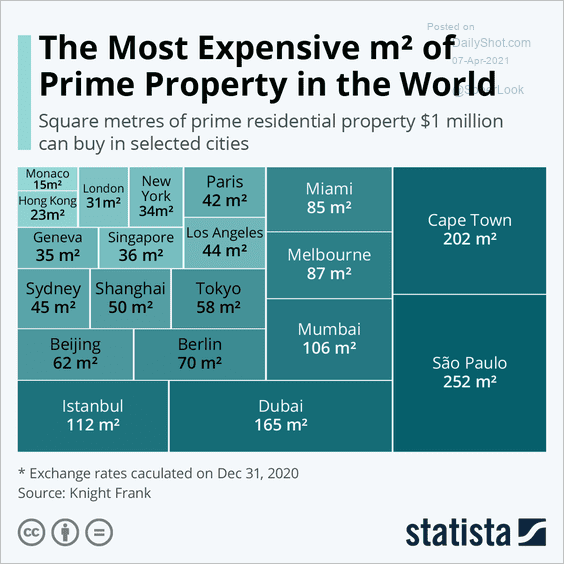 Source: Statista
4. Online wine sales:
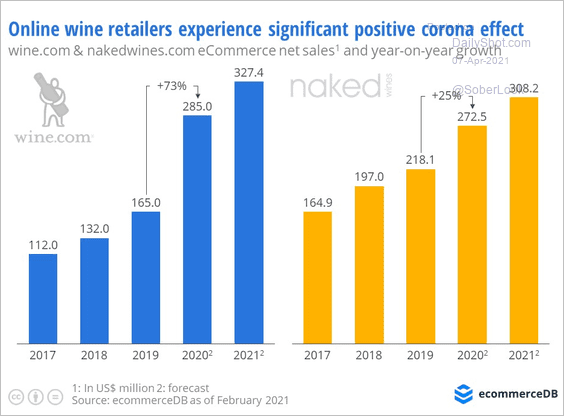 Source: ecommerceDB Read full article
5. Complaints to FPB:
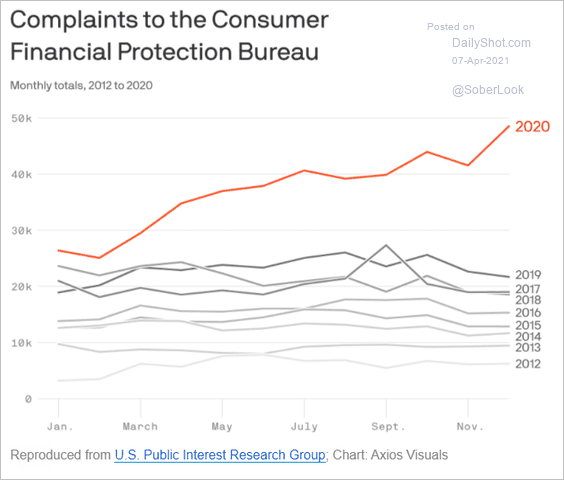 Source: @axios
6. GDP per capita for emerging vs. developed economies:
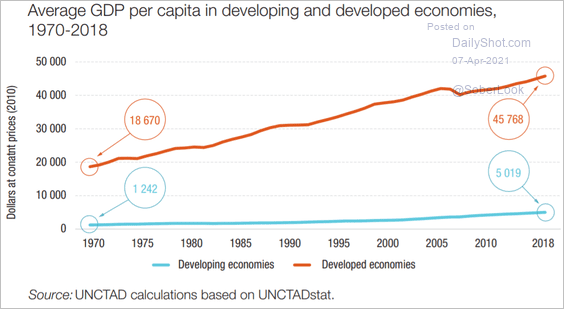 Source: UNCTAD Read full article
7. Number of US households by age:
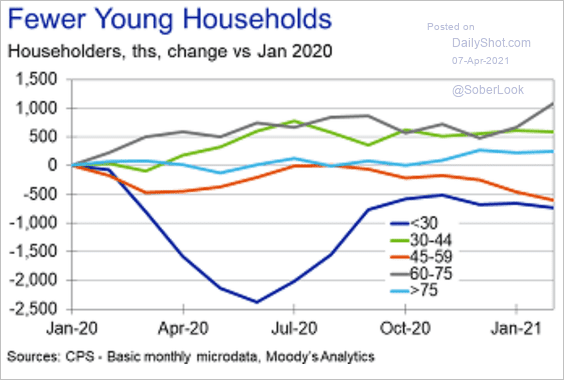 Source: Moody’s Analytics
8. High-speed rail plan:
 Source: @mattyglesias, @alon_levy
9. Is the United States heading in the right direction?
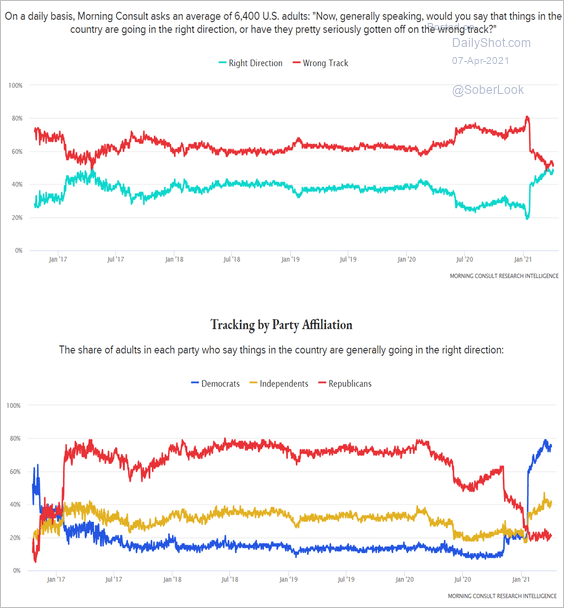 Source: Morning Consult Read full article
10. Americans’ concerns about the coronavirus situation:
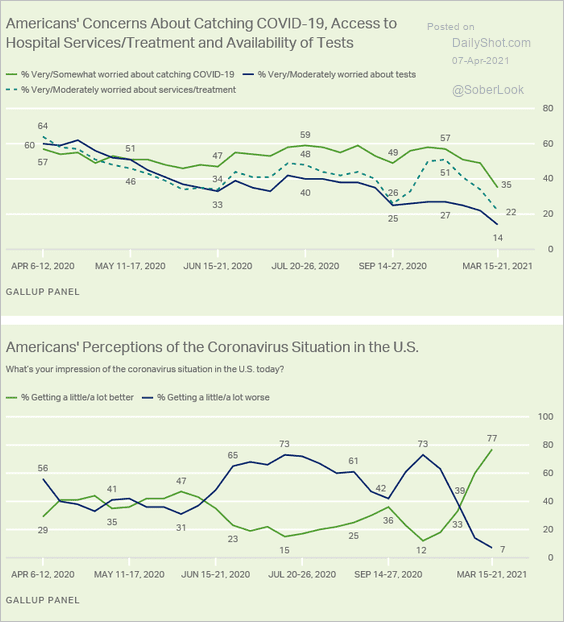 Source: Gallup Read full article
11. Vaccine impact on hospitalizations:
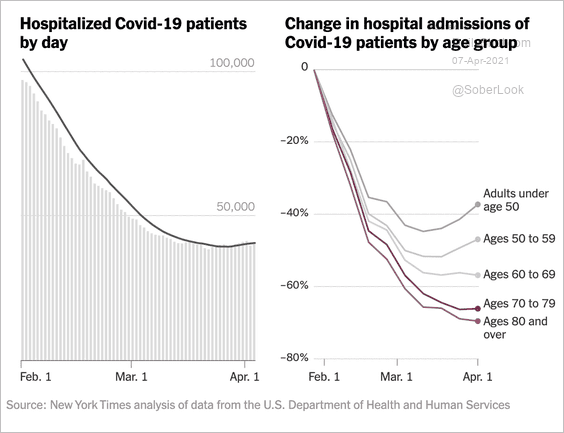 Source: The New York Times Read full article
12. Vaccination rates vs. GDP per capita:
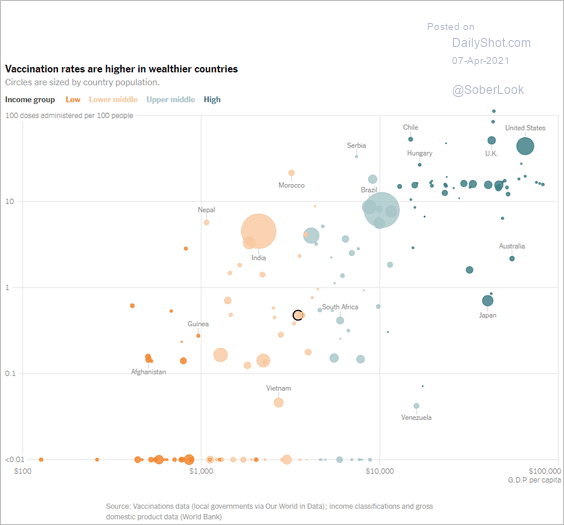 Source: The New York Times Read full article
13. Social distancing in the US:
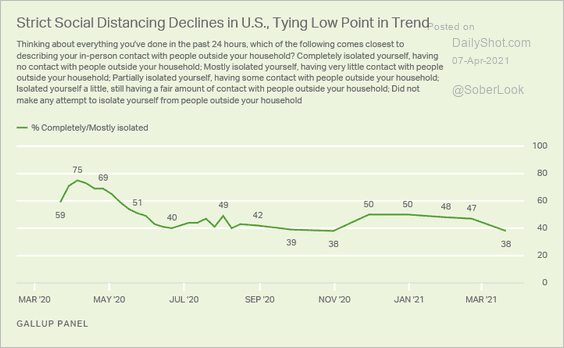 Source: Gallup Read full article
14. The history of the English language:
 Source: GIZMODO Read full article
——————–
Back to Index