
The Daily Shot: 08-Apr-21
• The United States
• Canada
• The United Kingdom
• The Eurozone
• Asia – Pacific
• China
• Emerging Markets
• Commodities
• Energy
• Equities
• Credit
• Rates
• Global Developments
• Food for Thought
The United States
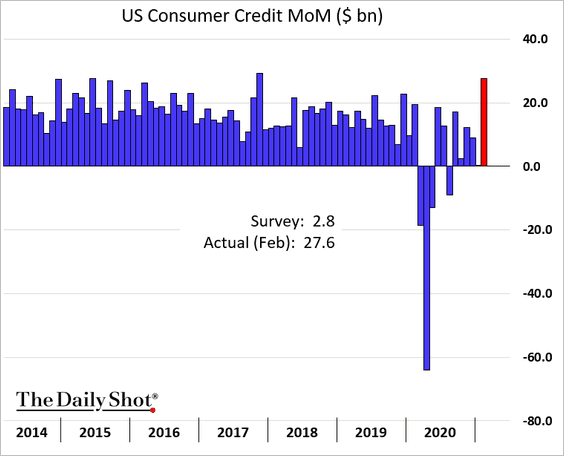
1. Consumer credit expanded more than expected in February.
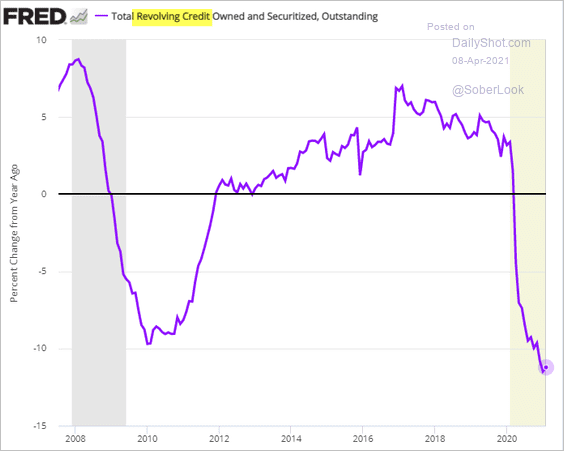
Credit card debt ticked higher but is still down 11% on a year-over-year basis.
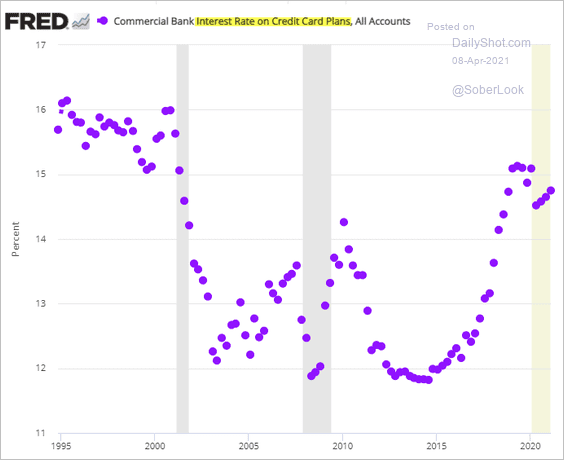
Credit card rates remain near 15%, and consumers want (and many are now able) to keep balances low.
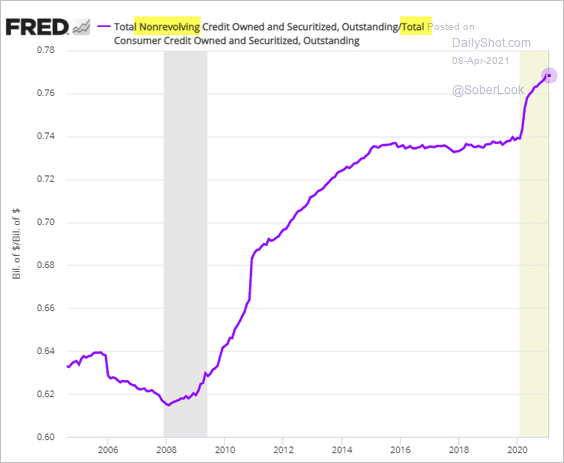
Nonrevolving credit (mostly auto loans and student debt) is now almost 77% of total consumer debt.
——————–
2. Next, we have some updates on the housing market.
• 2020 saw the strongest home price growth of any year since 2005, driven by low mortgage rates and inventory shortages.
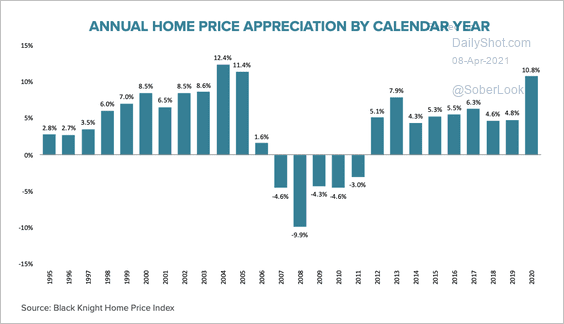 Source: Black Knight
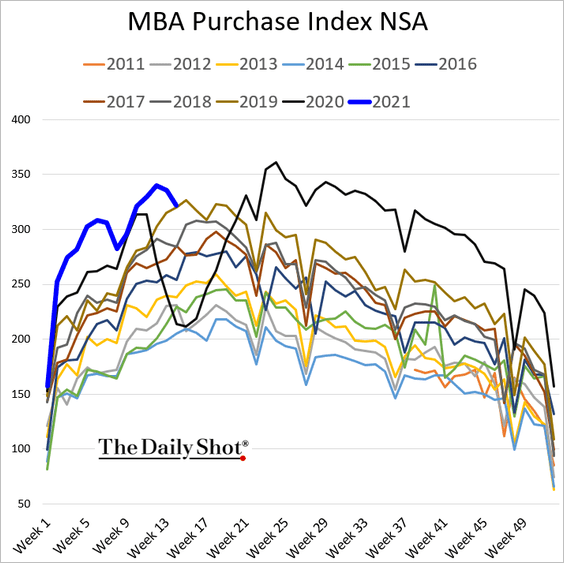
• But higher mortgage rates appear to be taking a toll on house purchase mortgage applications, which are now at 2019 levels.
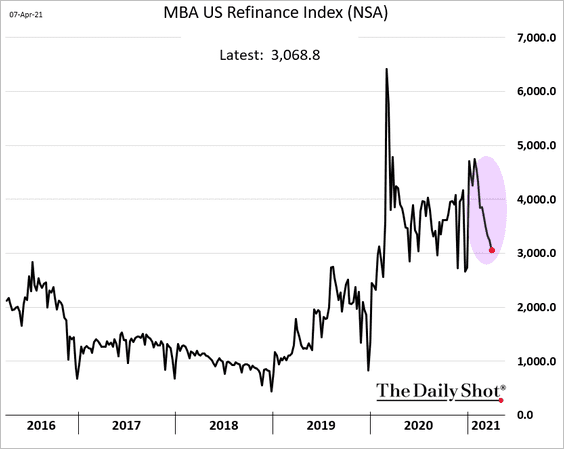
Refi applications continue to slide.
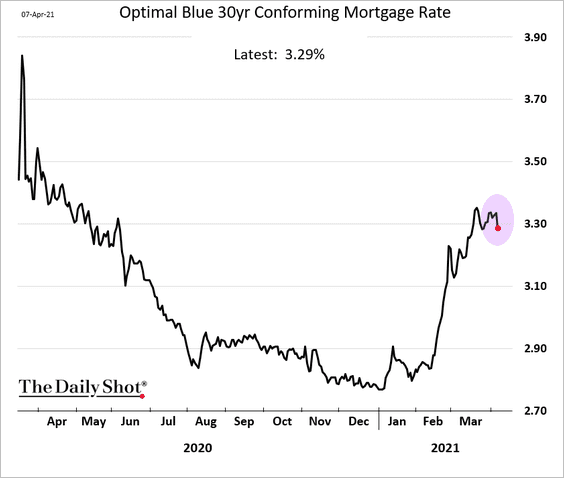
But mortgage rates seem to have stabilized.
• This map shows the share of exiting homes selling above the list price last month.
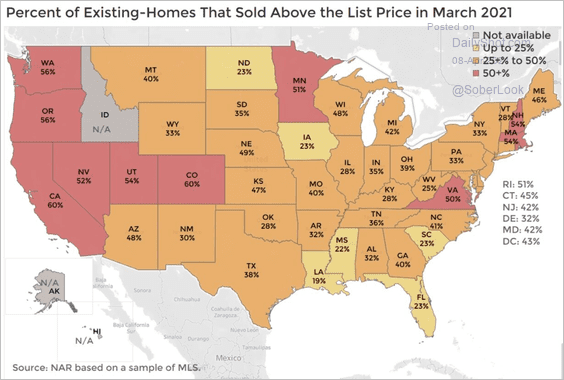 Source: Lawrence Yun, NAR
——————–
3. Vehicle inventories are running low.
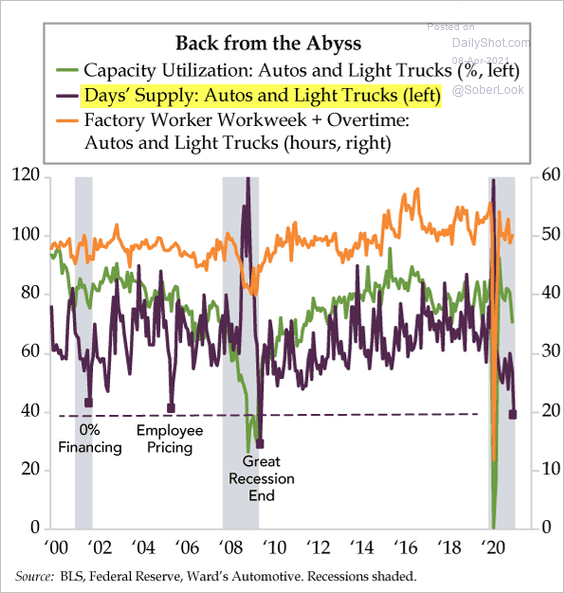 Source: The Daily Feather
And used-car dealers are ecstatic as sales soar.
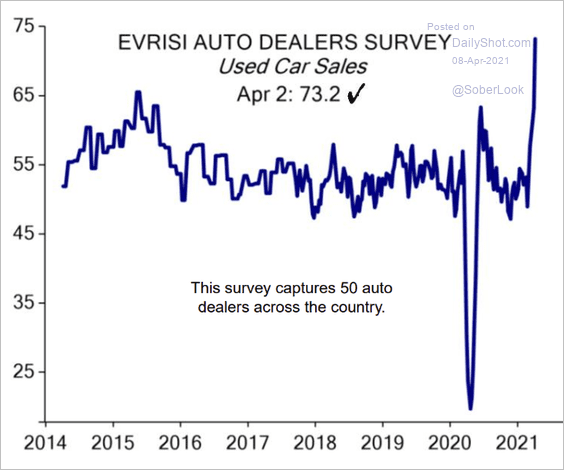 Source: Ed Hyman ([email protected]), Evercore ISI
——————–
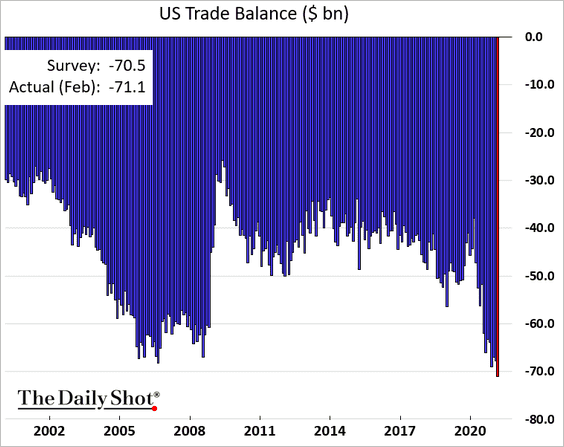
4. US trade deficit hit a new record in February as the economy heats up.
• Here is the geographic breakdown of the nation’s goods trade deficit.
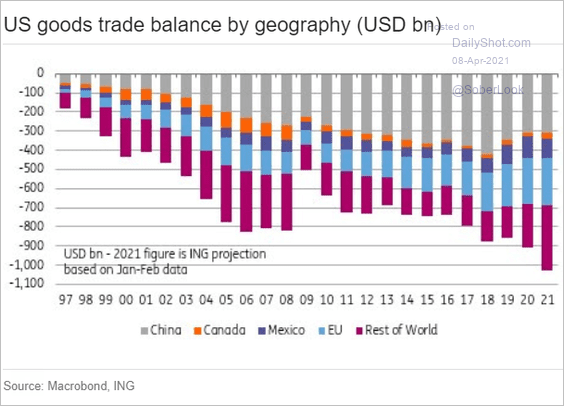 Source: ING
• The services trade surplus has been shrinking.
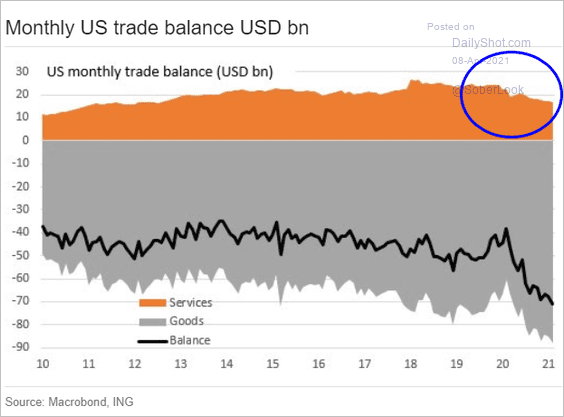 Source: ING
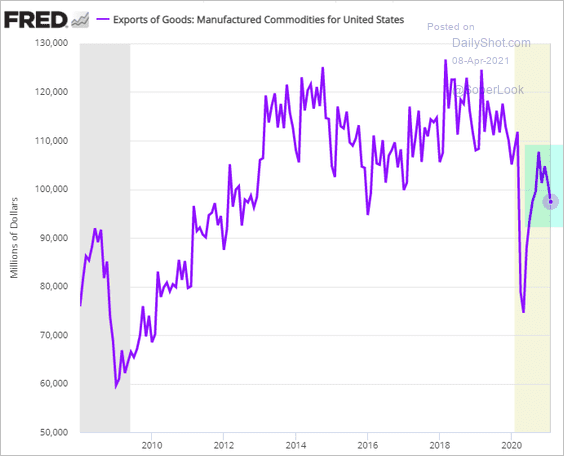
• US manufacturing exports are falling again.
——————–
5. This chart shows how much consumers earn on their savings accounts and what they need to earn to keep up with inflation.
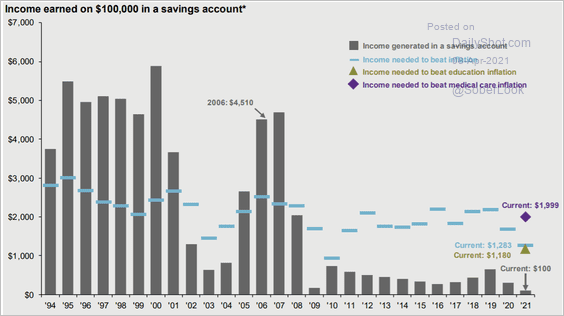 Source: J.P. Morgan Asset Management
6. Vaccine supply constraints are easing.
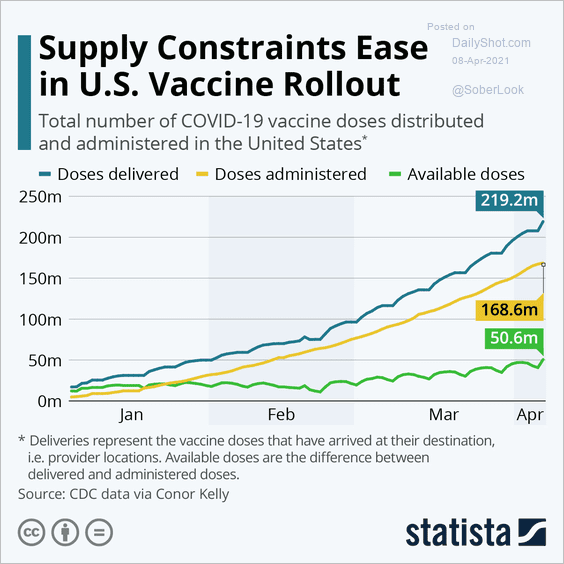 Source: Statista
Back to Index
Canada
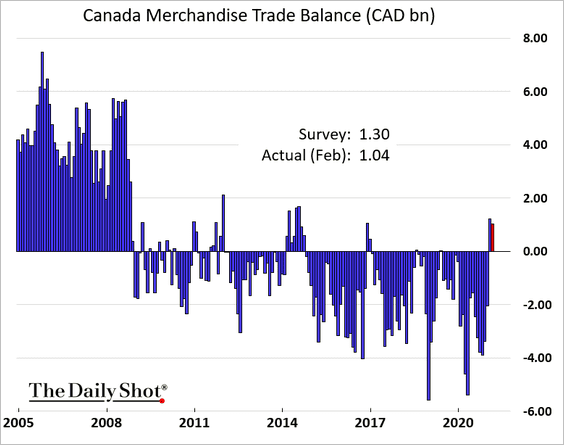
1. The nation’s trade surplus was somewhat lower than expected in February.
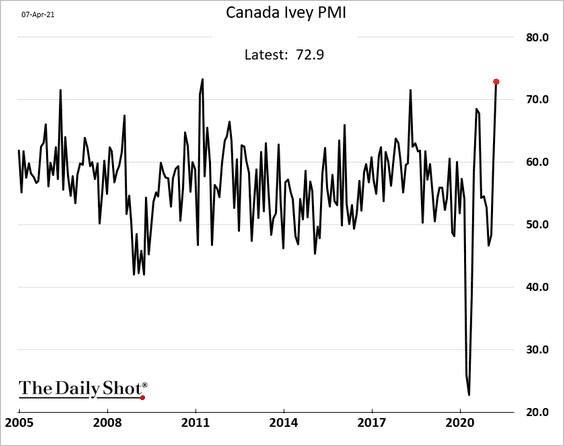
2. The Ivey PMI report suggests that Canada’s business activity is now the highest in a decade.
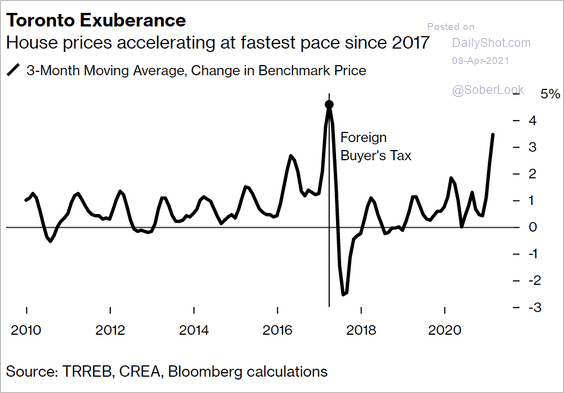
3. Toronto-area home price gains are accelerating.
 Source: Bloomberg Read full article
4. The Oxford Economics recovery tracker is almost back at pre-COVID levels.
![]() Source: Oxford Economics
Source: Oxford Economics
Back to Index
The United Kingdom
1. According to the latest data from RICS, home prices jumped last month.
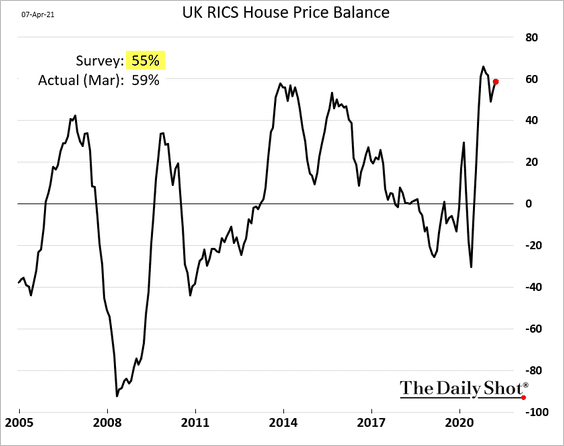
 Source: Reuters Read full article
——————–
2. Electric vehicle demand has been strong.
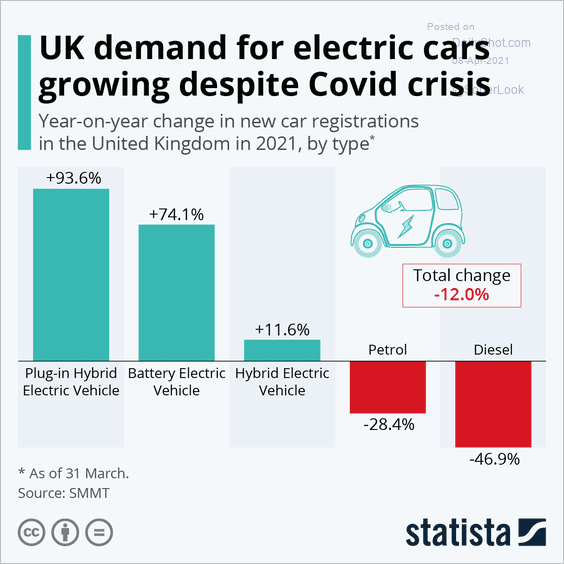 Source: Statista
Back to Index
The Eurozone
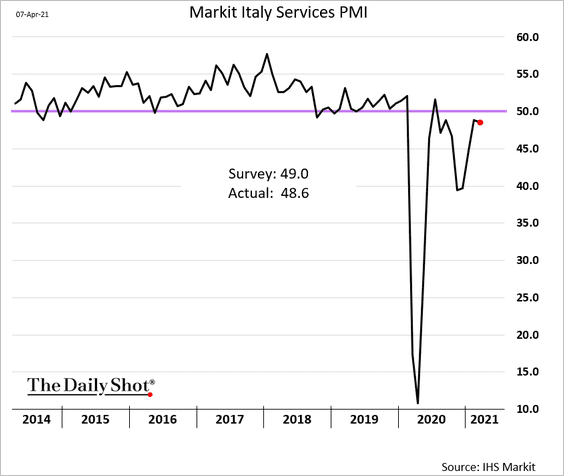
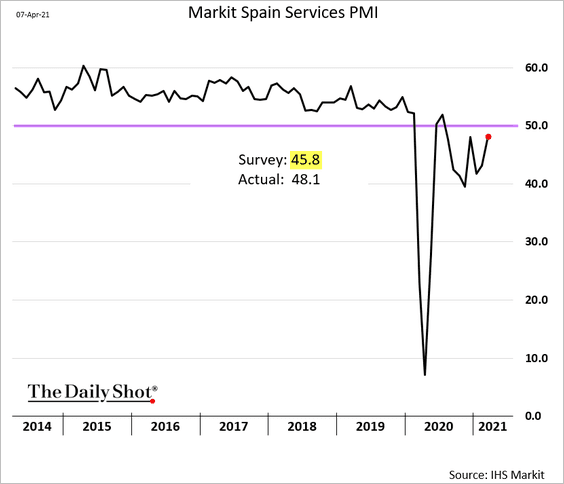
1. Service-sector activity is rebounding.
• Italy (almost stabilized):
• Spain (well above consensus):
• Germany (the updated figure was even stronger than the earlier report):
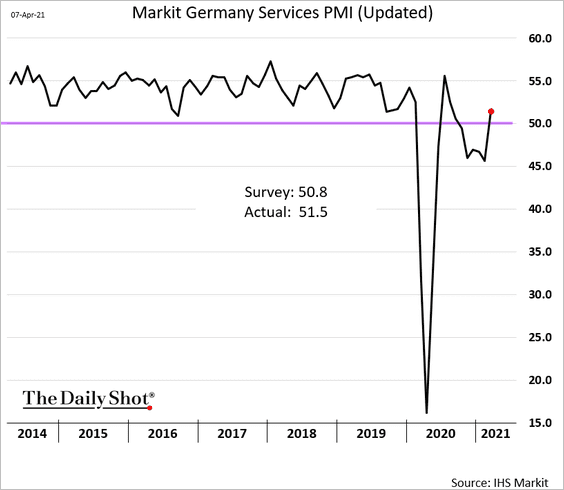
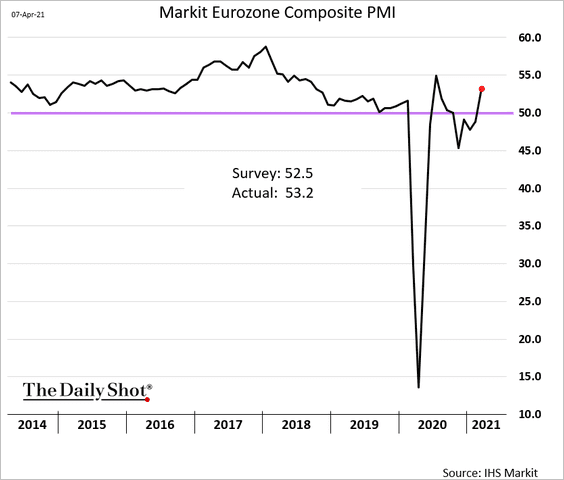
At the Eurozone level, the composite PMI is now firmly in growth territory (PMI > 50).
——————–
2. Residential building permits remain below pre-COVID levels.
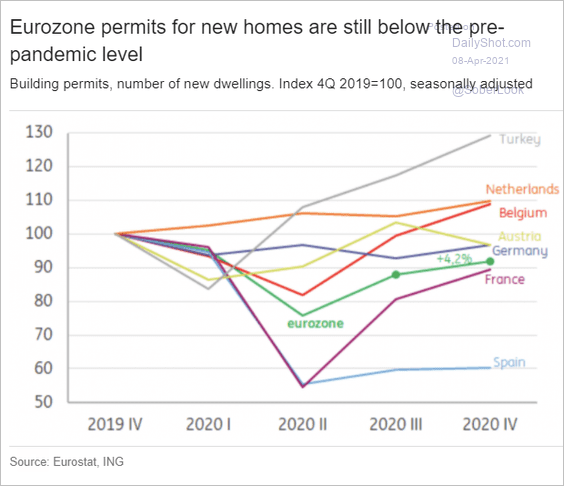 Source: ING
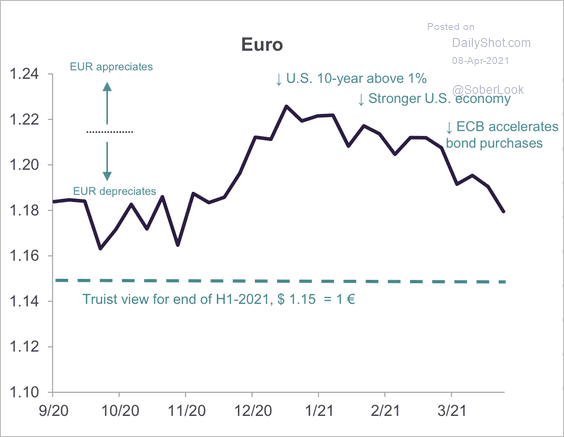
3. Truist expects further downside in EUR/USD towards 1.15.
 Source: Truist Advisory Services
Back to Index
Asia – Pacific
1. Tokyo COVID cases are on the rise.
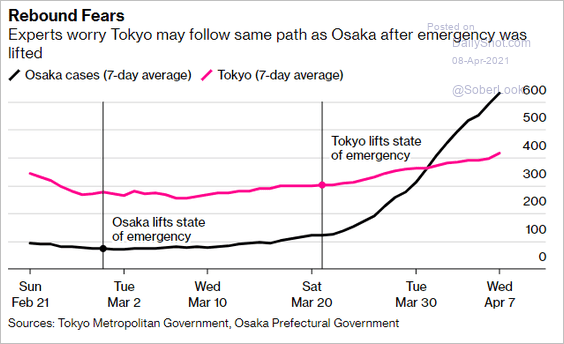 Source: Bloomberg Read full article
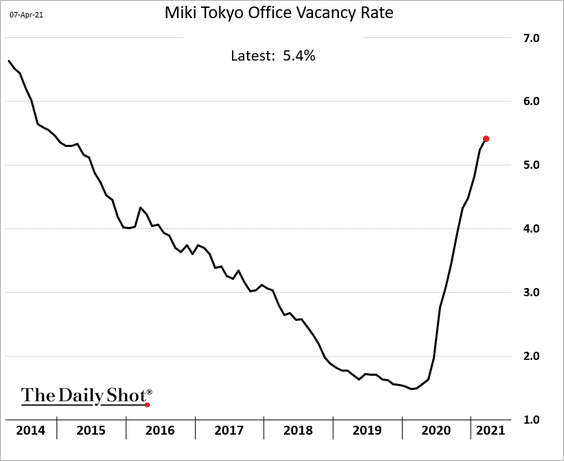
Office vacancies continue to climb.
——————–
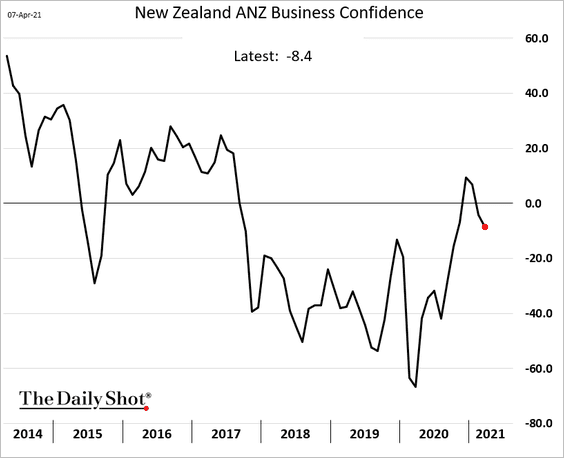
2. New Zealand’s business confidence has pulled back over the past couple of months.
3. Australia’s retail spending strengthened in March.
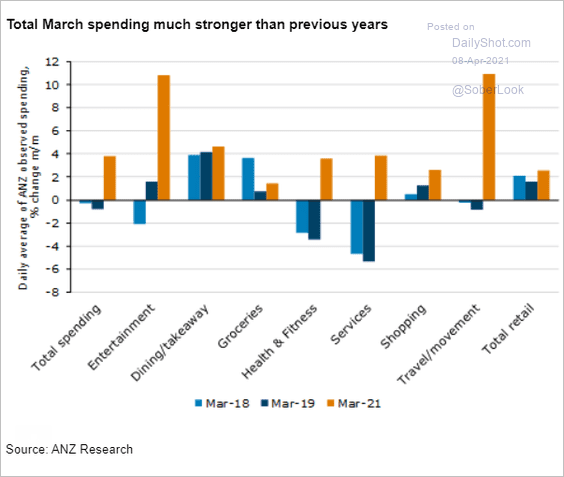 Source: ANZ Research
Back to Index
China
1. Services inflation is expected to rebound.
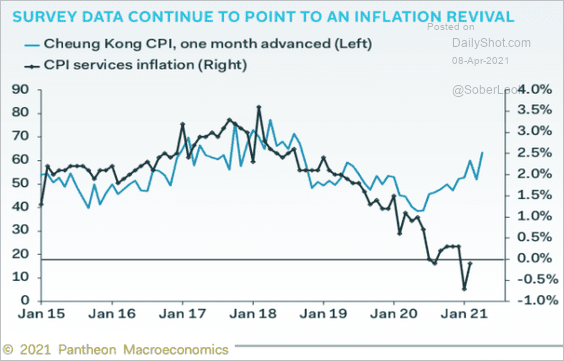 Source: Pantheon Macroeconomics
2. Credit impulse is likely to slow further this year.
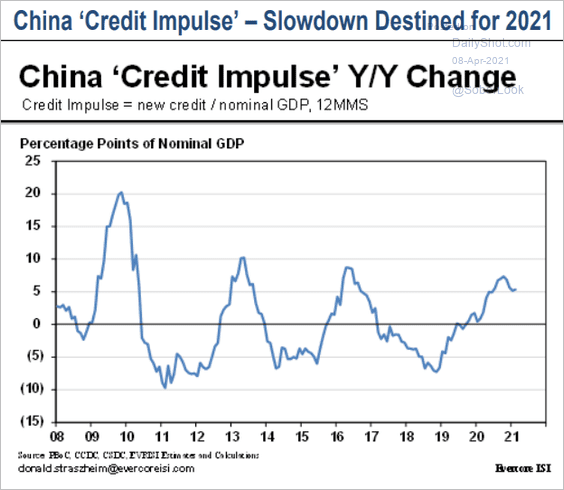 Source: Evercore ISI
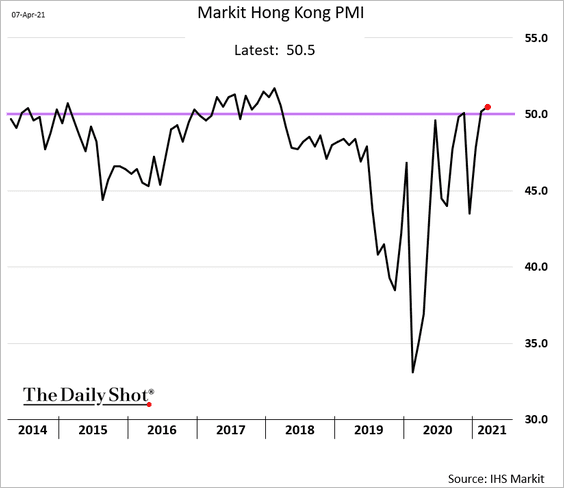
3. Hong Kong’s business activity is in growth mode for the first time since early 2018.
Back to Index
Emerging Markets
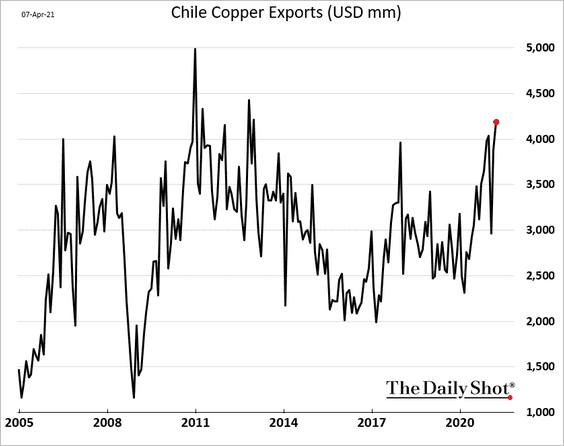
1. Chile’s trade surplus dwindled as imports jumped last month.
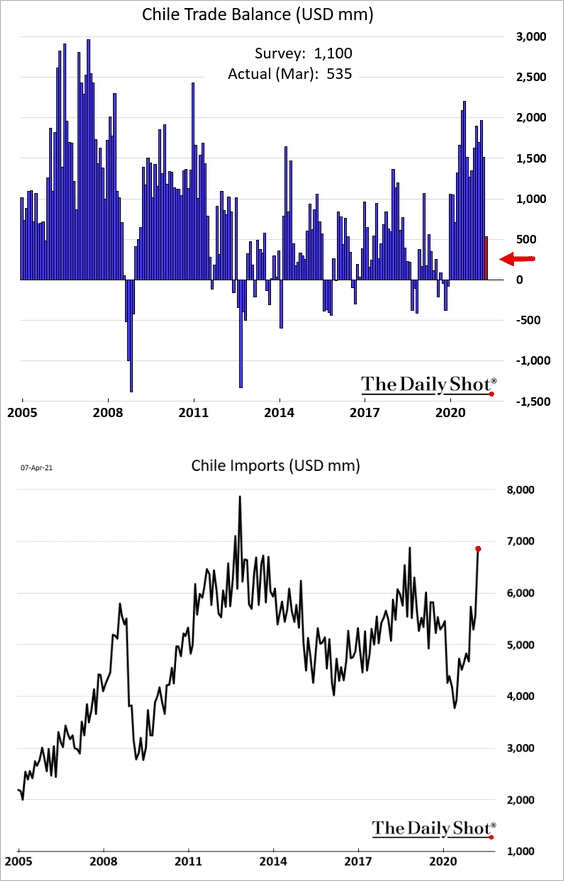
Copper exports are climbing.
——————–
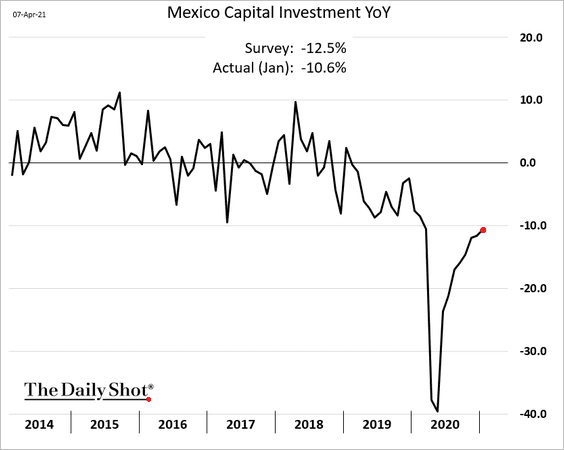
2. Mexican capital investment continued to recover in January.
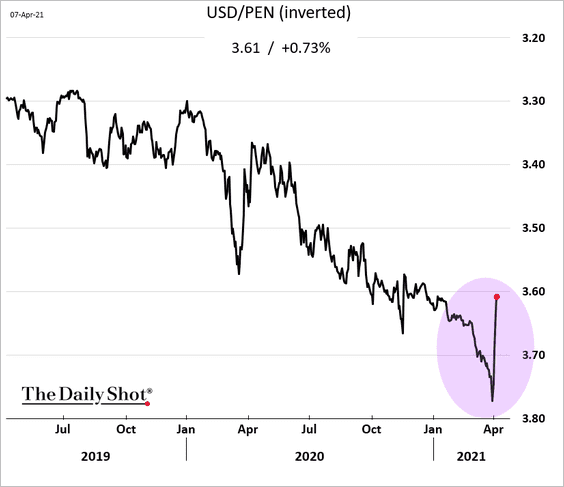
3. The Peruvian sol is rebounding. Polls show increased chances for a market-friendly candidate (Hernando de Soto) to advance into the second round after the upcoming presidential election.
4. India’s service sector growth held up well last month despite the worsening COVID situation.
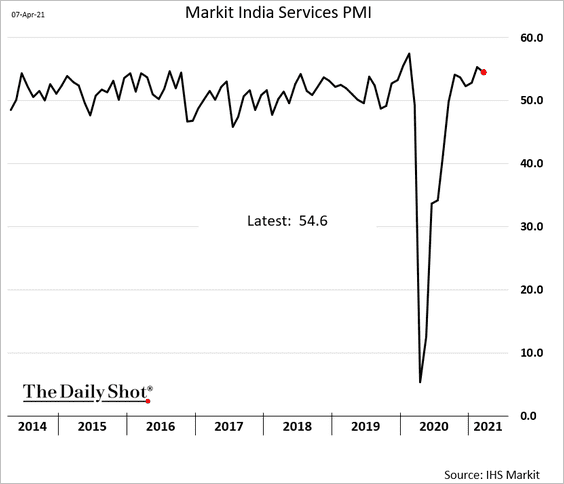
The central bank has started QE.
 Source: ING Read full article
——————–
5. The Turkish lira has weakened beyond fair value, according to IIF.
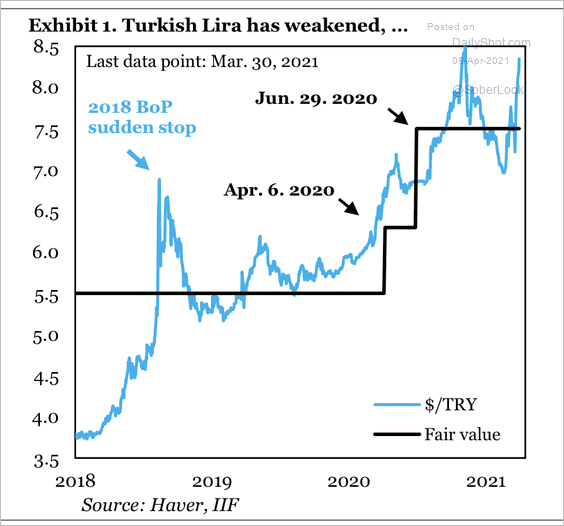 Source: IIF
The market expects further depreciation in the lira by about 30% over the next 12 months.
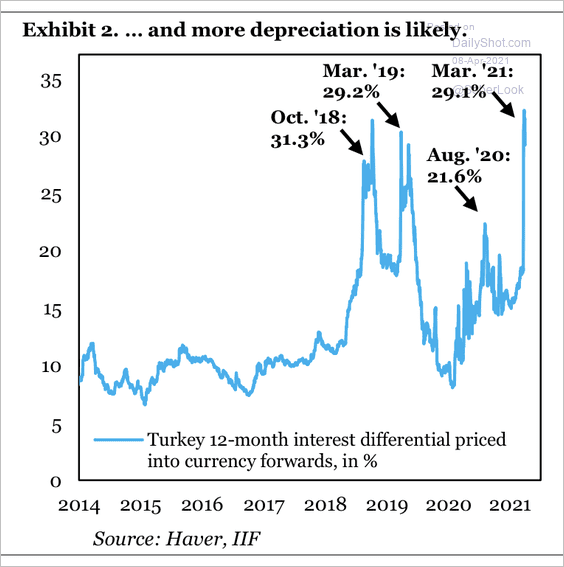 Source: IIF
——————–
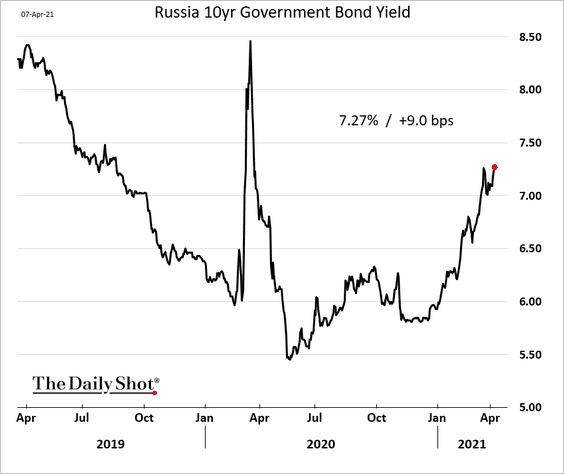
6. Russia’s bond yields continue to climb even as other EM bonds stabilize.
7. Below is the year-to-date performance of select EM currencies.
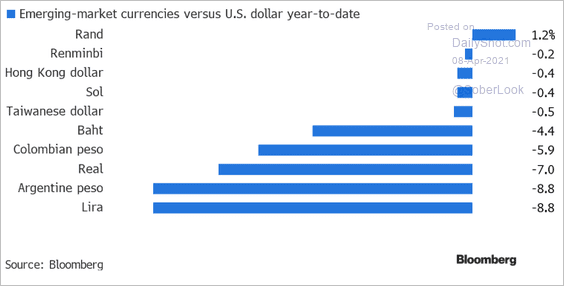 Source: Colleen Goko, @TheTerminal, Bloomberg Finance L.P.
Back to Index
Commodities
1. Here is a look at the beta and correlation of the S&P Goldman Sachs Commodity Index (GSCI) to inflation.
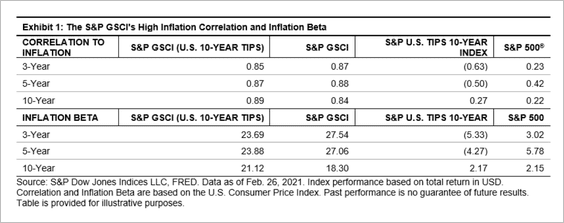 Source: S&P Global Market Intelligence
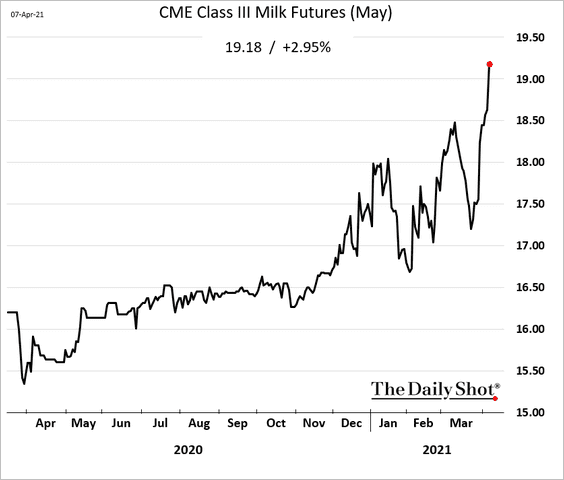
2. CME milk futures are soaring.
Back to Index
Energy
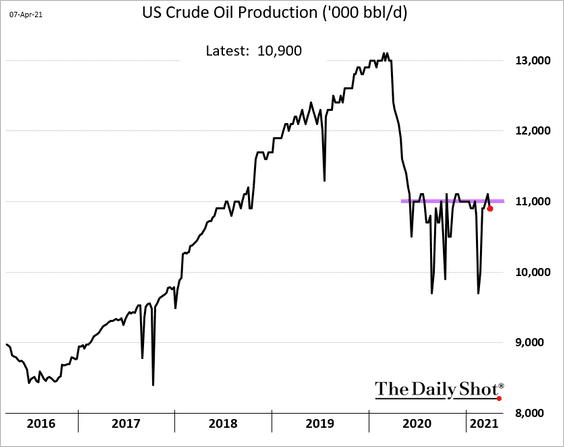
1. US crude oil production is stuck at around 11 million barrels per day.
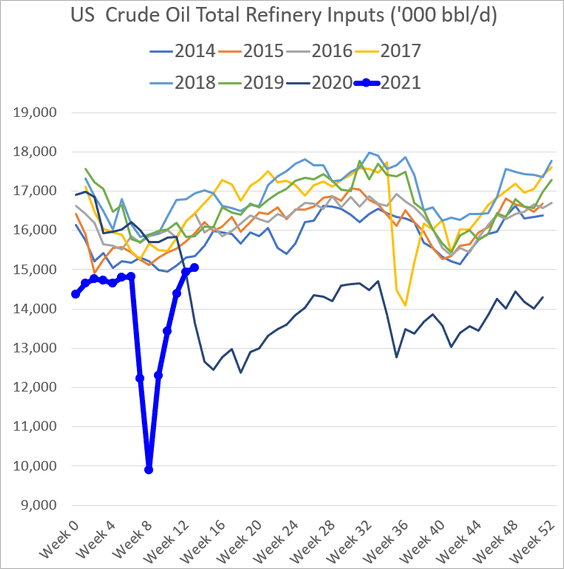
2. Refinery inputs continue to recover.
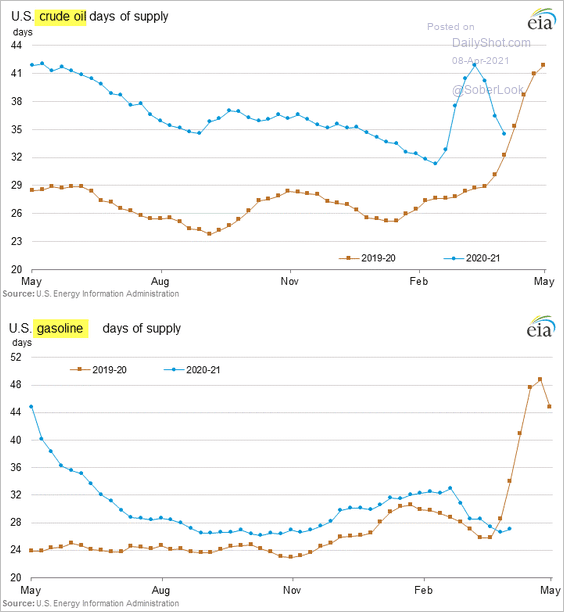
3. US crude oil inventories keep shrinking (measured in days of supply).
4. Open interest in energy futures has declined sharply.
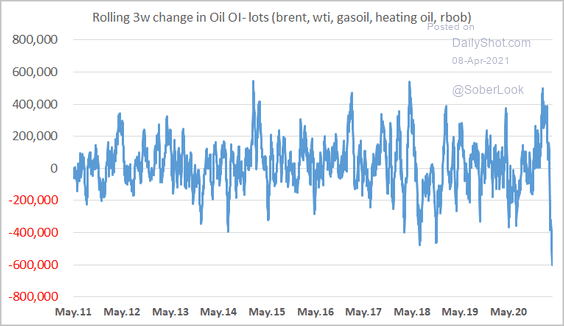 Source: @clementlefert
5. Arbor Data Science says that the WTI crude oil fair value is above $80/bbl.
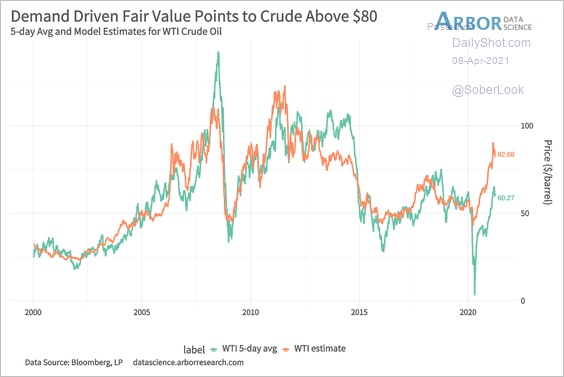 Source: Arbor Research & Trading
Back to Index
Equities
1. US equity trading volume has been moderating.
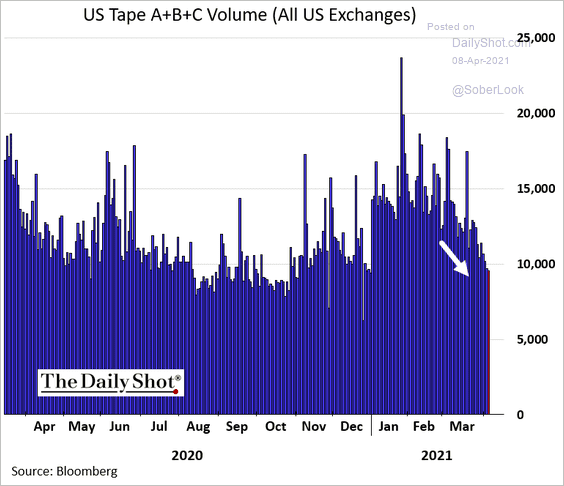 h/t @luwangnyc
2. US households’ equity allocation is the highest on record.
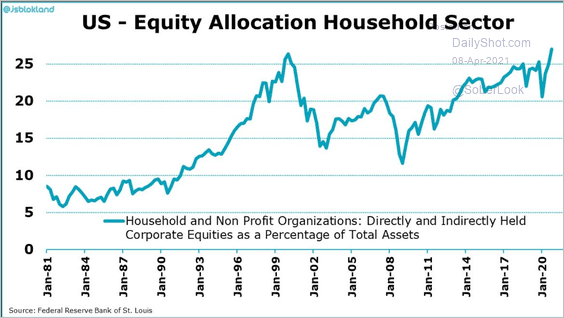 Source: @jsblokland
3. Some models show US stocks deep in overbought territory.
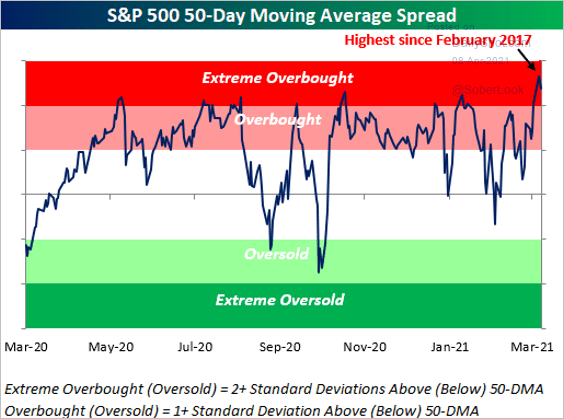 Source: @bespokeinvest Read full article
4. Share buybacks have accelerated again.
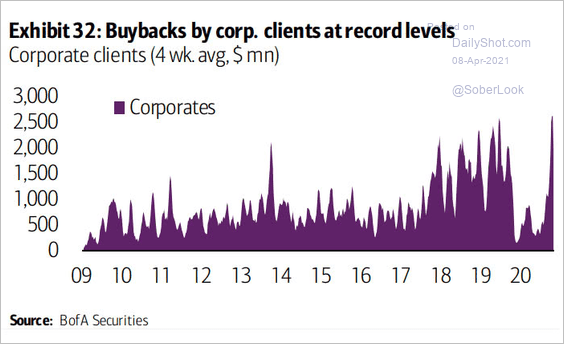 Source: @ISABELNET_SA, @BofAML
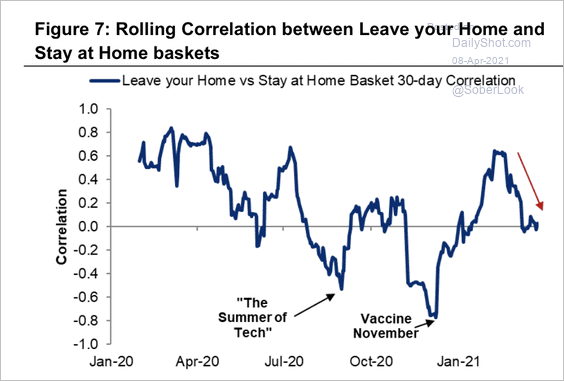
5. “Stay at home” stocks have declined over the past few months, while “leave your home” stocks continue to recover (but still underperforming). …
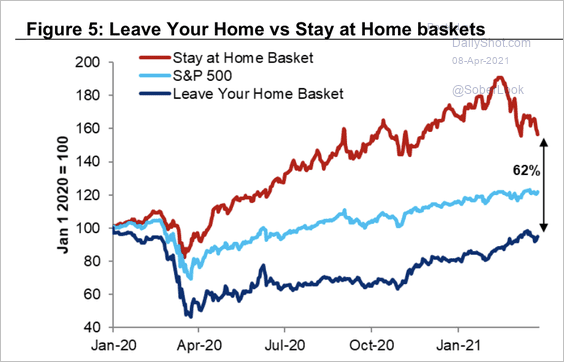 Source: Citi Private Bank
… And the two groups are now negatively correlated.
 Source: Citi Private Bank
——————–
6. The Russell 2,000 Index is still well above its 200-day moving average.
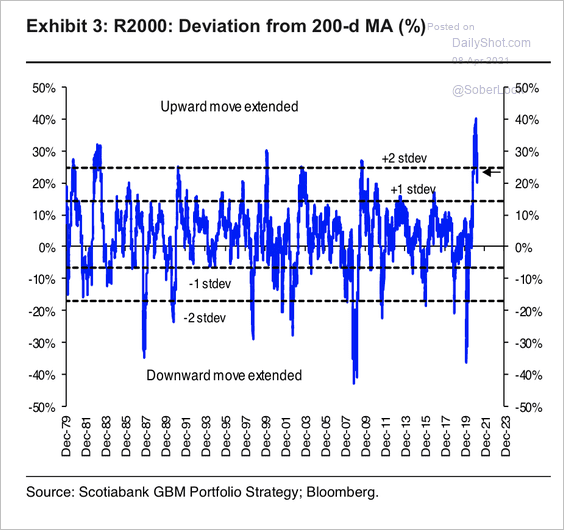 Source: Hugo Ste-Marie, Portfolio & Quantitative Strategy Global Equity Research, Scotia Capital
7. Here is a look at the 5-year rolling correlation of S&P 500 sectors to the 10-year Treasury yield.
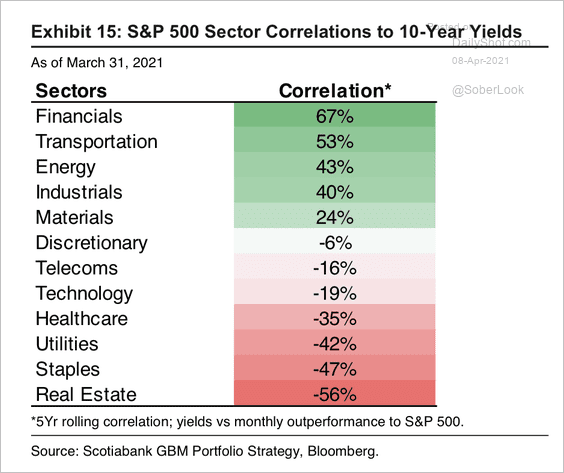 Source: Hugo Ste-Marie, Portfolio & Quantitative Strategy Global Equity Research, Scotia Capital
8. S&P 500 earnings growth tends to follow the ISM manufacturing index.
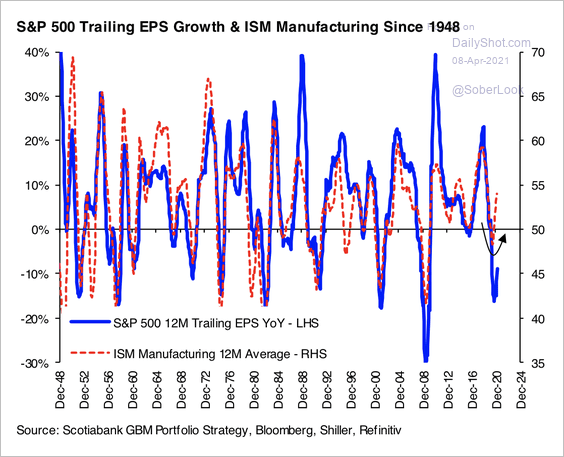 Source: Hugo Ste-Marie, Portfolio & Quantitative Strategy Global Equity Research, Scotia Capital
9. Investors are becoming concerned about higher corporate taxes.
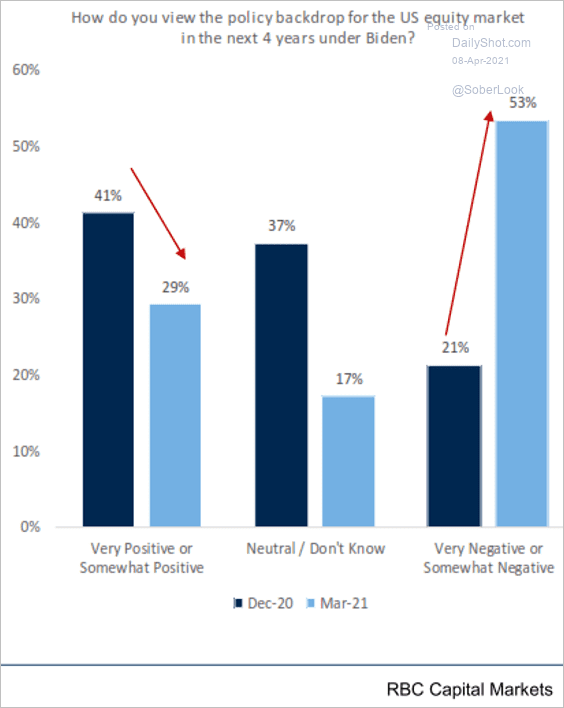 Source: Bloomberg Read full article
10. Most large-cap funds underperformed the broader market in 2020, although slightly less compared to 2019.
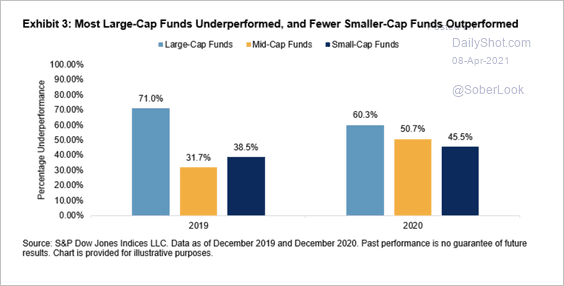 Source: S&P Global Market Intelligence
Back to Index
Credit
1. CCC corporate debt appears to be overbought.
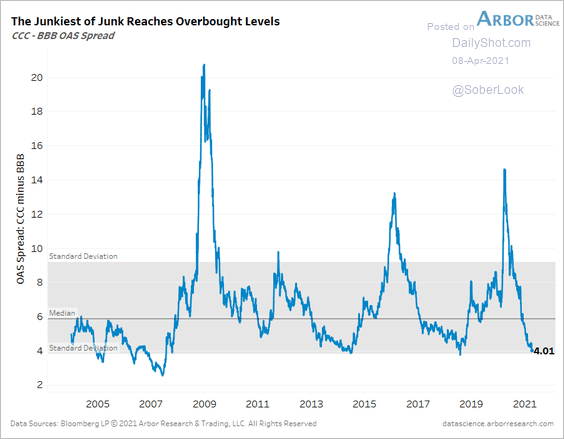 Source: Arbor Research & Trading
2. High-yield implied volatility is too low, according to Arbor Data Science.
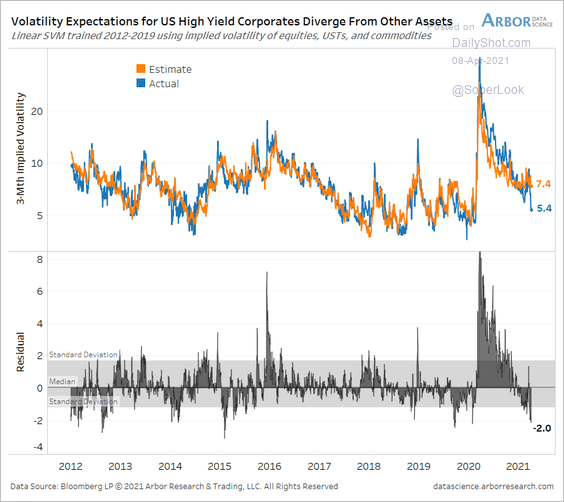 Source: Arbor Research & Trading
3. How do US small businesses collateralize their loans?
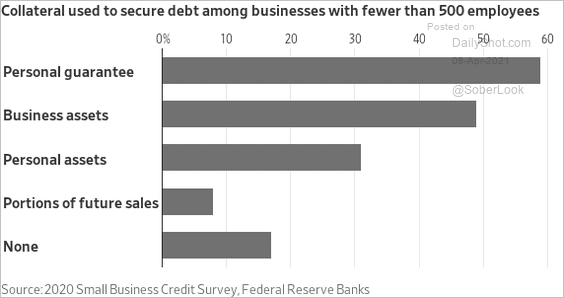 Source: @WSJ Read full article
4. Finally, we have some data on announced US bankruptcies (from S&P Global).
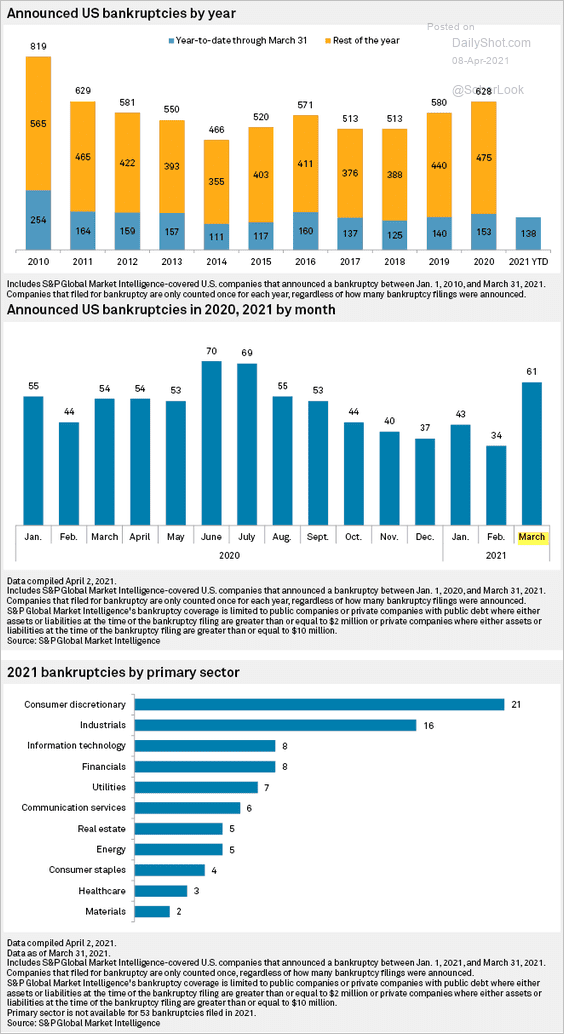 Source: S&P Global Market Intelligence
Back to Index
Rates
1. Coupon Treasury issuance (notes and bonds) hit a record high (2 charts).
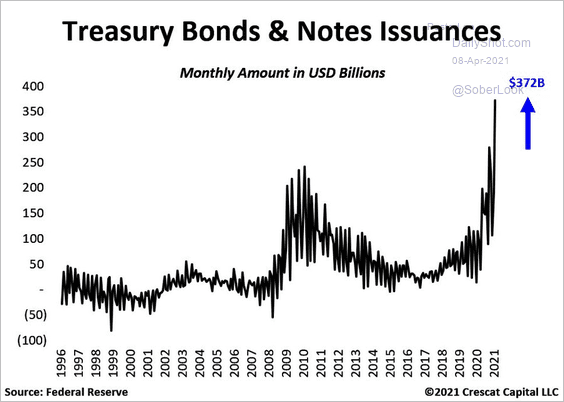 Source: @TaviCosta
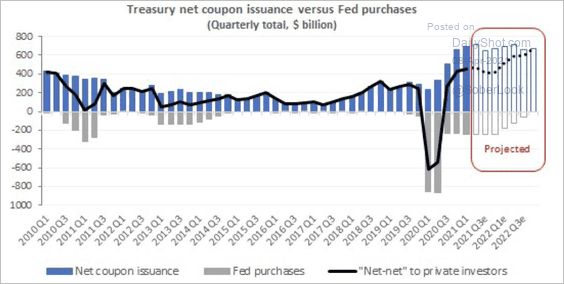 Source: Deutsche Bank Research
——————–
2. Market expectations for the fed funds rate trajectory remain disconnected from the Fed’s dot plot.
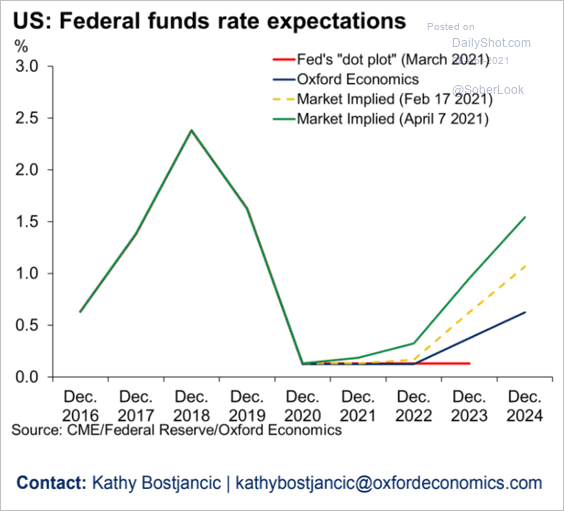 Source: Oxford Economics
Back to Index
Global Developments
1. EM corporate earnings growth has outpaced DM over the past two years.
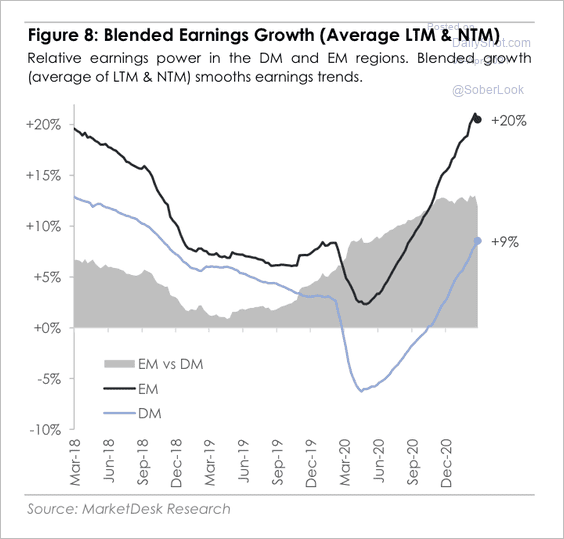 Source: MarketDesk Research
2. Developed market PMIs (business activity) have diverged from emerging market PMIs over the past few months.
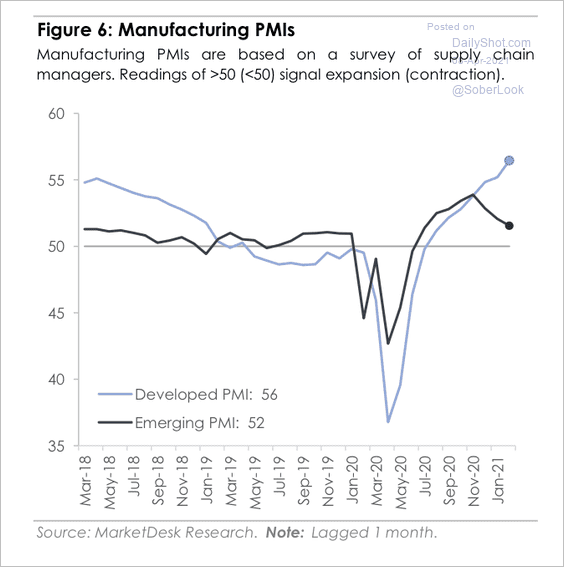 Source: MarketDesk Research
3. A massive fiscal cliff looms once stimulus ebbs.
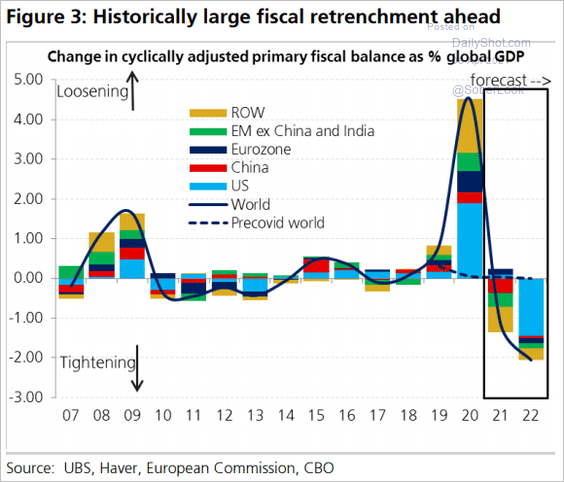 Source: UBS; @jsblokland
4. More companies are mentioning supply constraints during earnings calls.
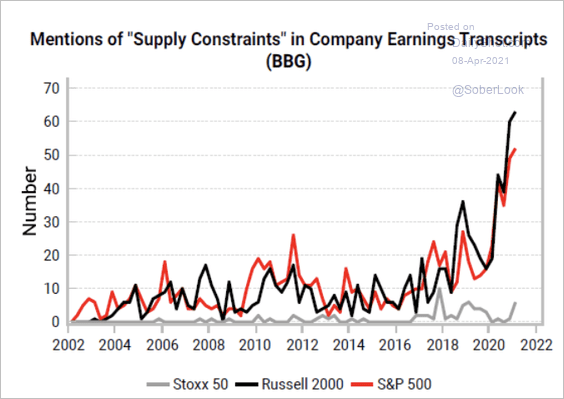 Source: Variant Perception
The Suez Canal situation exacerbated the supply-chain bottlenecks.
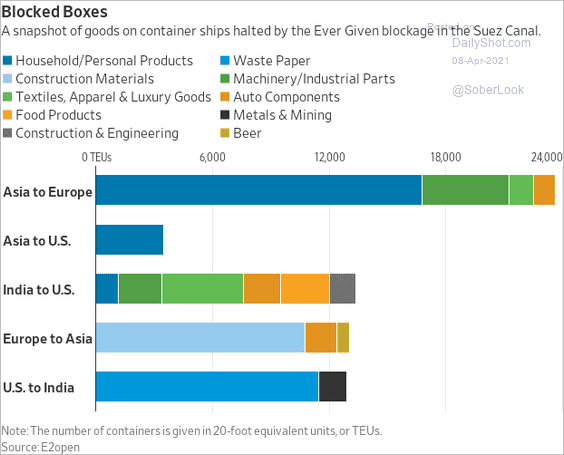 Source: @WSJ Read full article
——————–
Food for Thought
1. US electric disturbances:
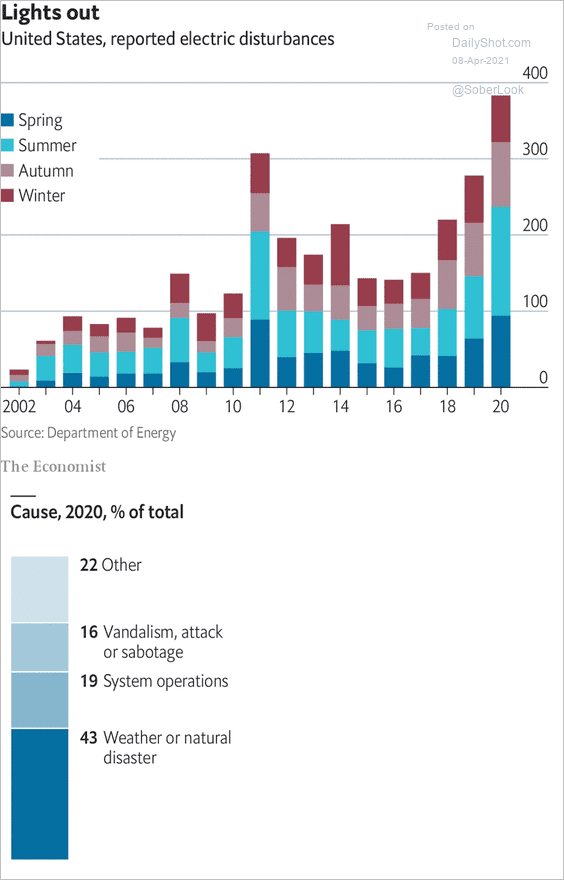 Source: The Economist Read full article
2. Secondary sneaker market:
 Source: Statista
3. US pleasure boat purchases as a share of total consumption:
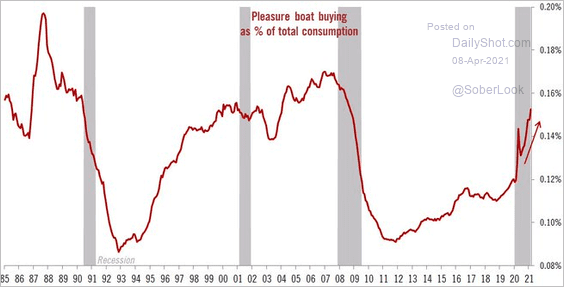 Source: @TCosterg
4. Spending on food vs. GDP per capita:
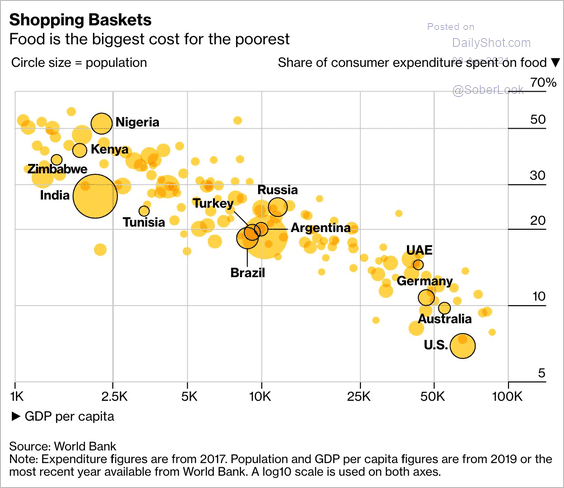 Source: @BBGVisualData Read full article
5. US Latino share of vaccinated population:
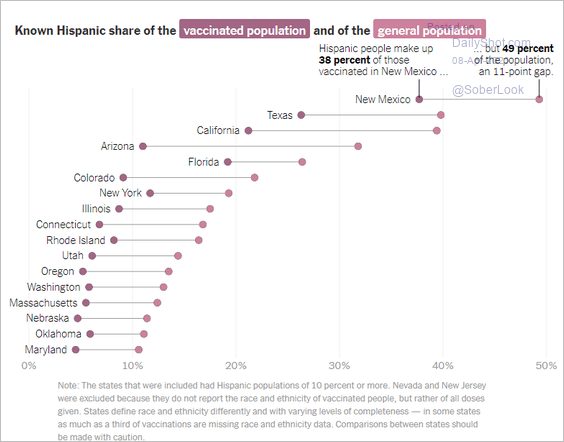 Source: The New York Times Read full article
6. Weekly excess mortality from pneumonia in Wuhan:
 Source: WHO
7. Avalanche fatalities:
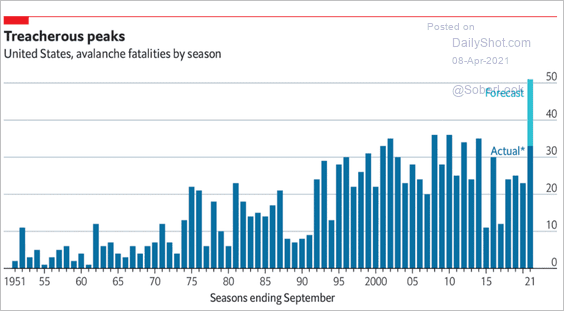 Source: The Economist Read full article
8. The share of western US in drought:
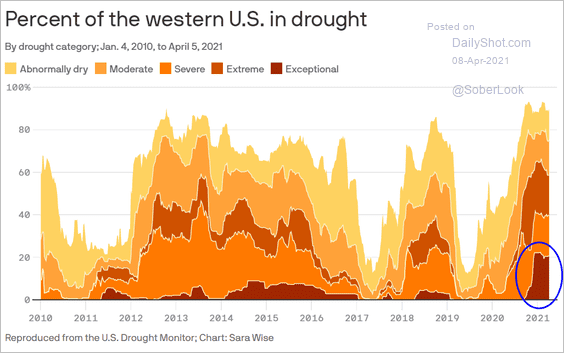 Source: @axios Read full article
9. Equal rights for women:
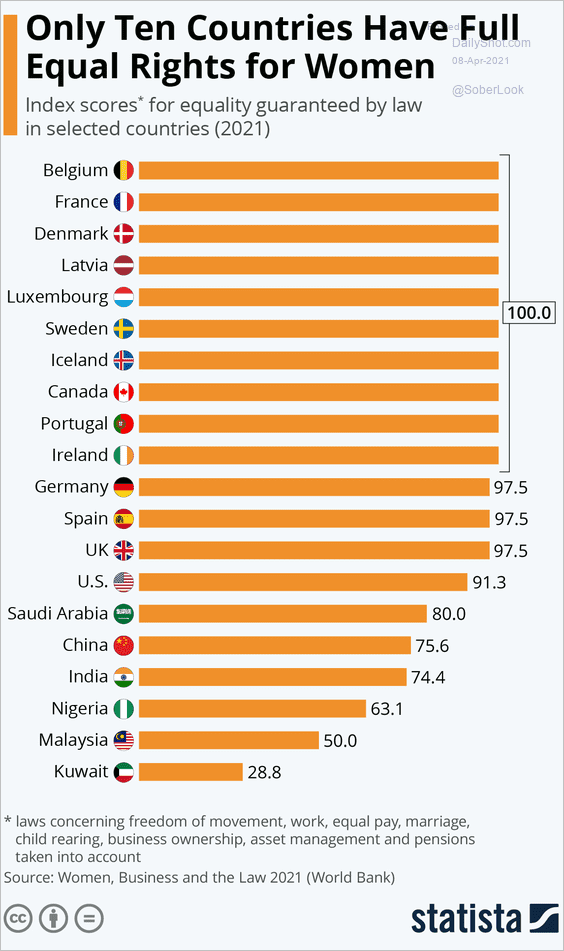 Source: Statista
10. Roads built by the Roman empire:
 Source: @PythonMaps
——————–
Back to Index