
The Daily Shot: 26-Apr-21
• The United States
• The United Kingdom
• The Eurozone
• Asia – Pacific
• China
• Emerging Markets
• Cryptocurrency
• Commodities
• Energy
• Equities
• Credit
• Global Developments
• Food for Thought
The United States
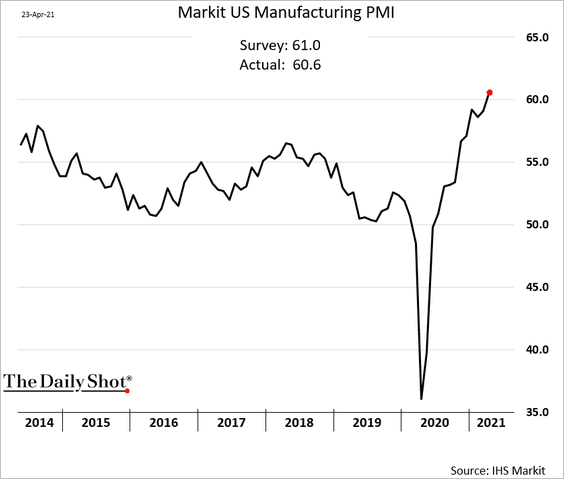
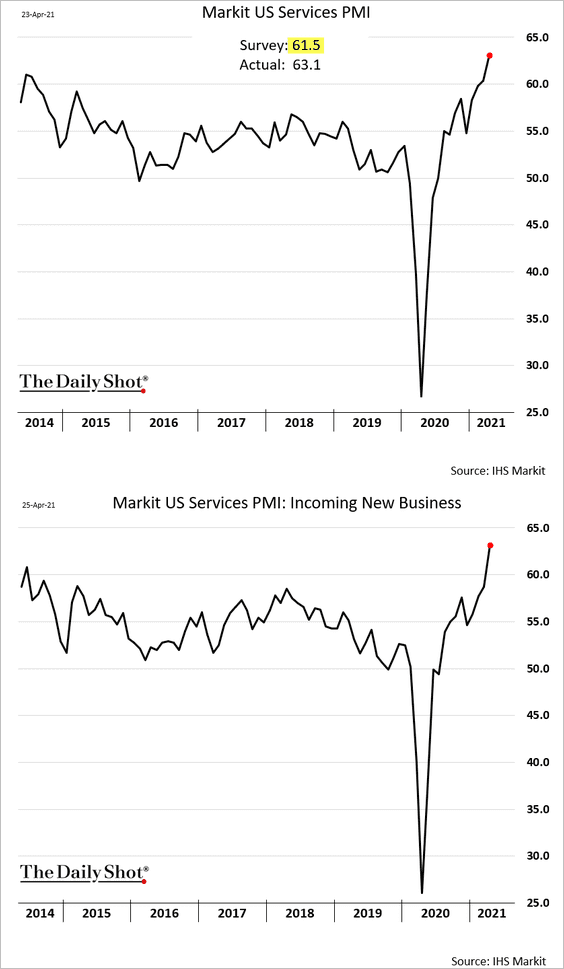
1. The Markit PMI report showed US business activity gaining momentum in April.
• Manufacturing PMI:
• Services PMI:
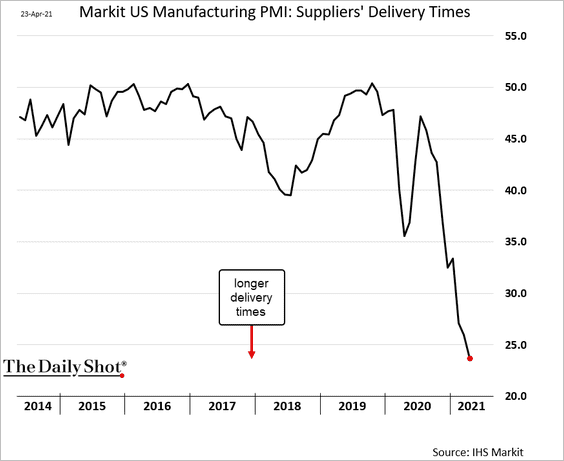
As we saw in the regional Fed surveys (here), manufacturing supply-chain delays worsened further this month.
And price pressures have become more acute.
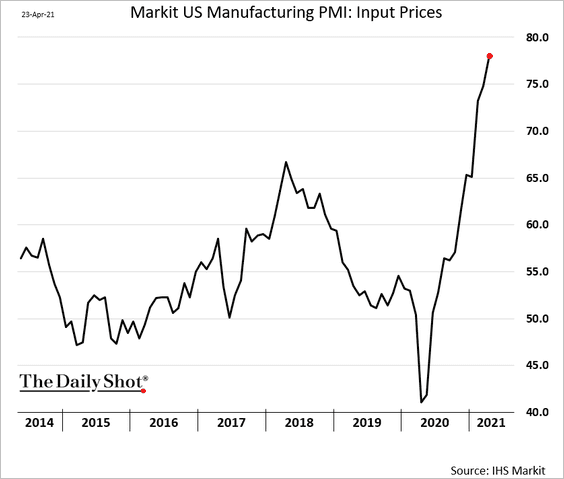
By the way, news articles mentioning inventory shortages hit a record high.
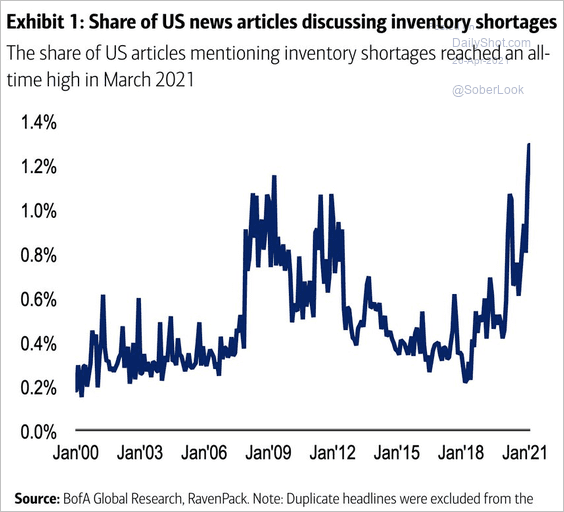 Source: BofA Global Research
——————–
2. Next, we have some updates on the housing market.
• New home sales surged in March, topping economists’ forecasts.
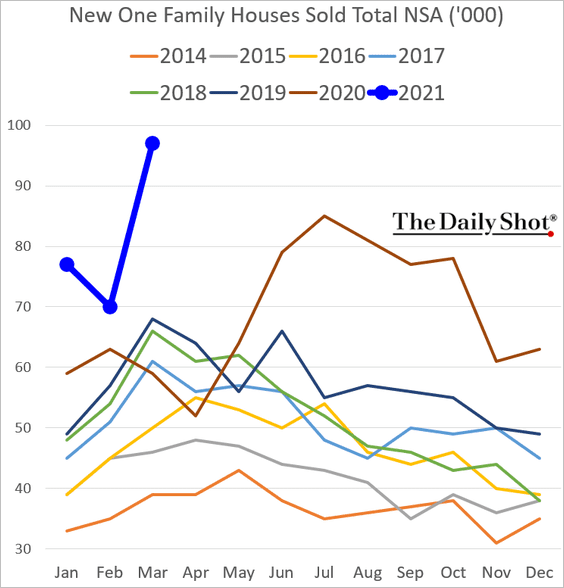
– The southern US drove the spike in sales, while activity declined in the West.
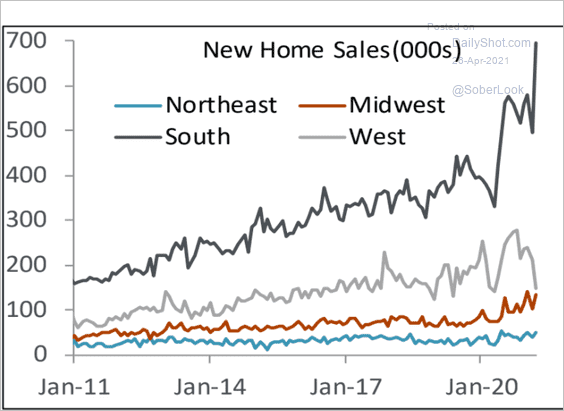 Source: Piper Sandler
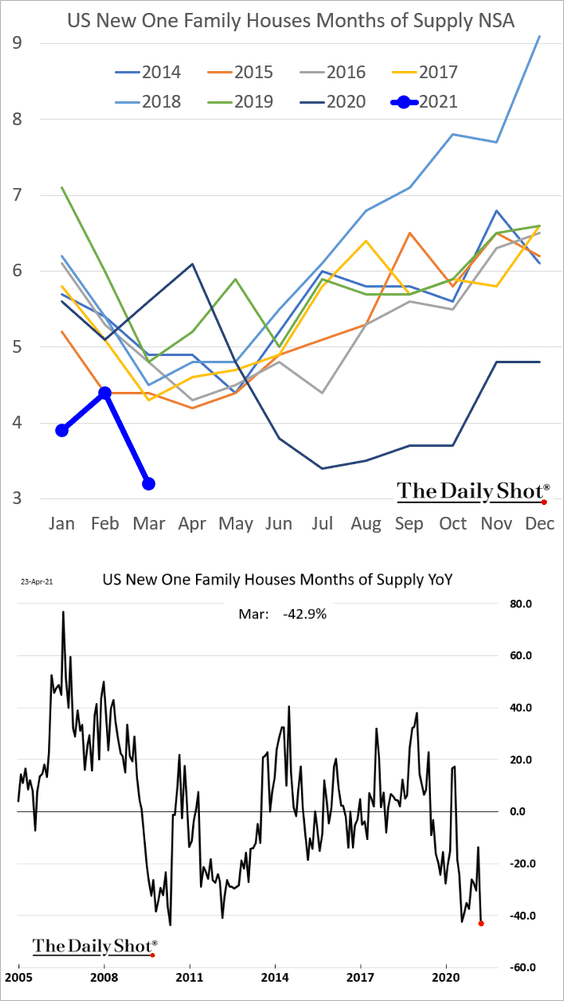
– Inventories of new homes contracted.
• This chart shows the year-over-year changes in mortgage applications (to purchase a home) by loan size.
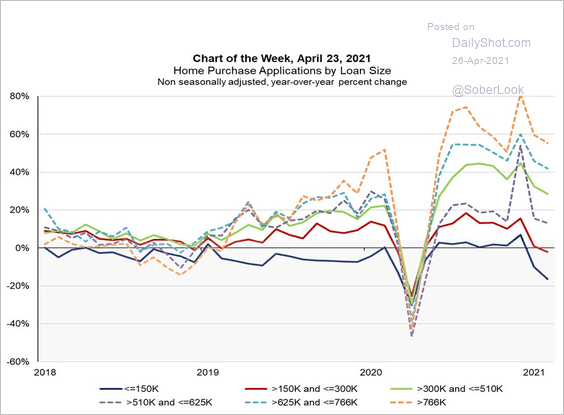 Source: Mortgage Bankers Association
• Distressed home sales have nearly disappeared. Rising home prices and forbearance programs have been the key reasons behind this trend.
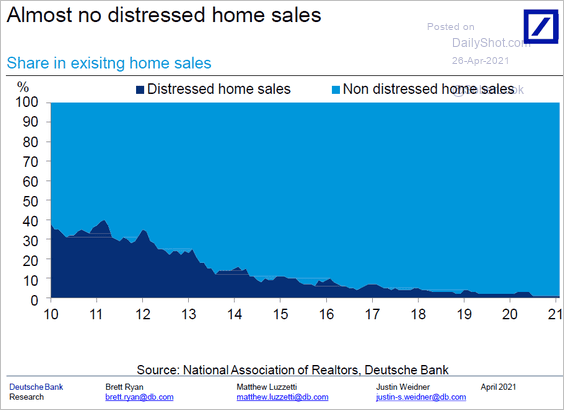 Source: Deutsche Bank Research
• Construction cost inflation will continue to rise this year.
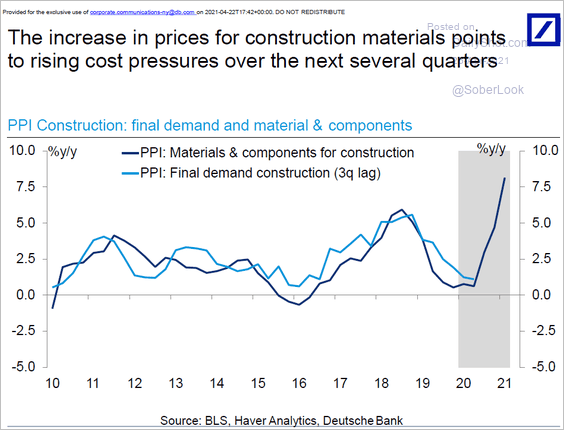 Source: Deutsche Bank Research
• Sharp increases in housing prices are making some Americans nervous. Online search activity for “housing market crash” has been surging. But given the tightening housing supply, we are unlikely to see a meaningful drop in prices for quite some time.
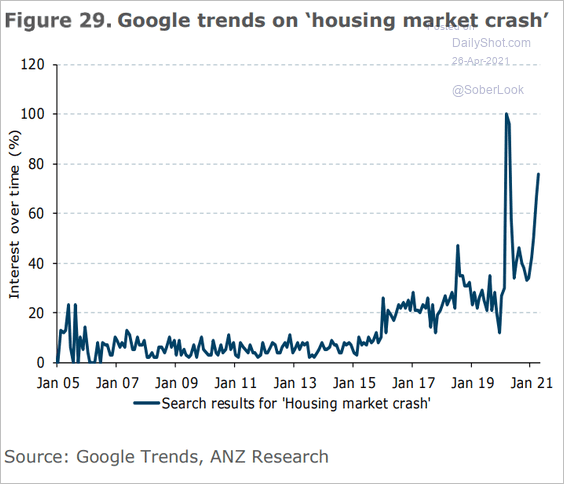 Source: ANZ Research
——————–
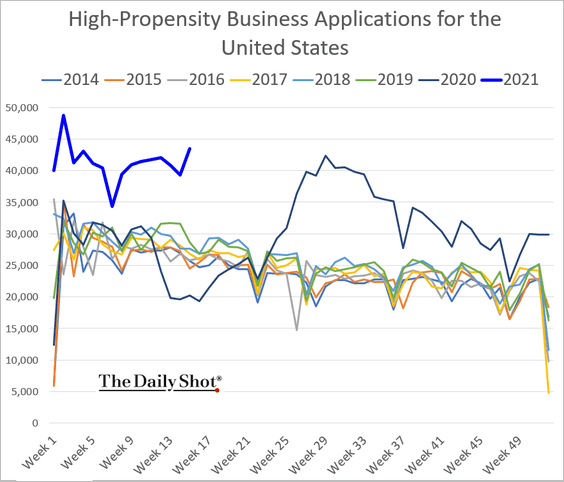
3. US business applications remain at multi-year highs.
4. The rapid recovery in restaurant dining points to a pickup in hiring.
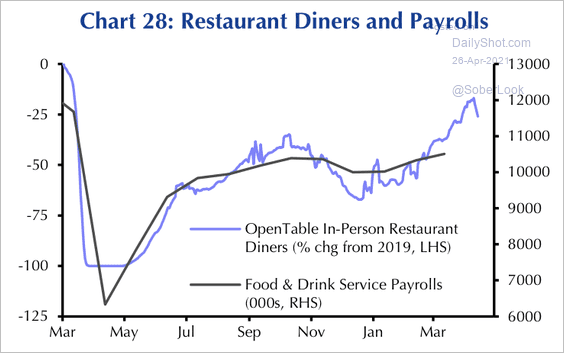 Source: Capital Economics
Back to Index
The United Kingdom
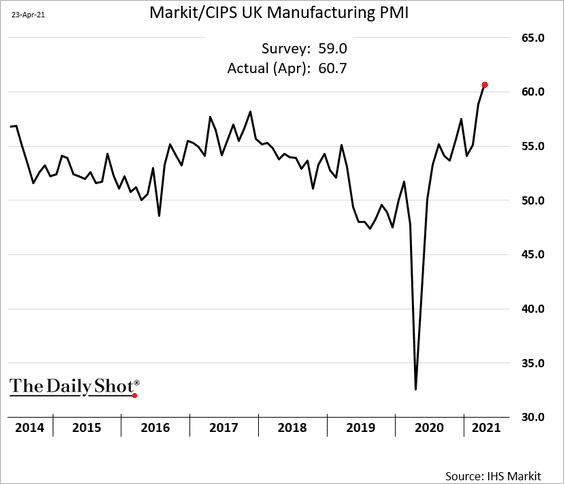
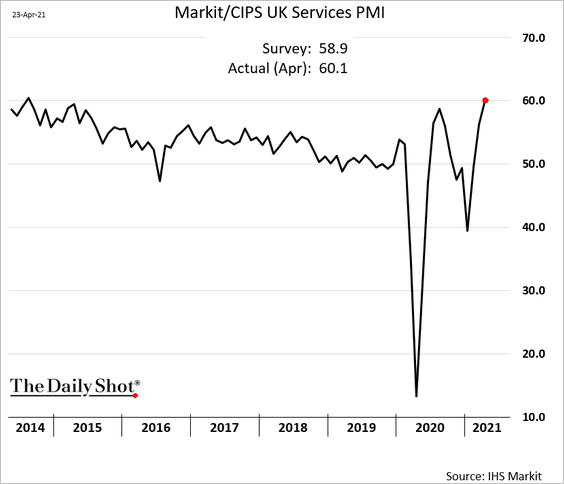
1. The April PMI report topped forecasts as the nation’s business activity strengthened further.
• Manufacturing:
• Services:
• The report bodes well for economic growth since February.
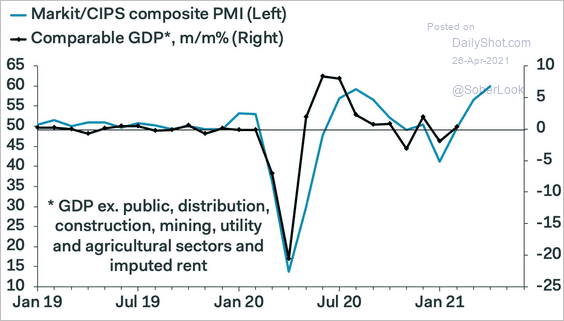 Source: Pantheon Macroeconomics
• PMI data point to a rebound in employment.
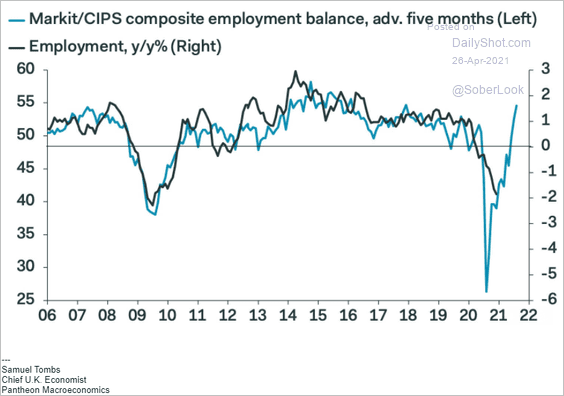 Source: Pantheon Macroeconomics
——————–
2. Retail sales came roaring back in March.
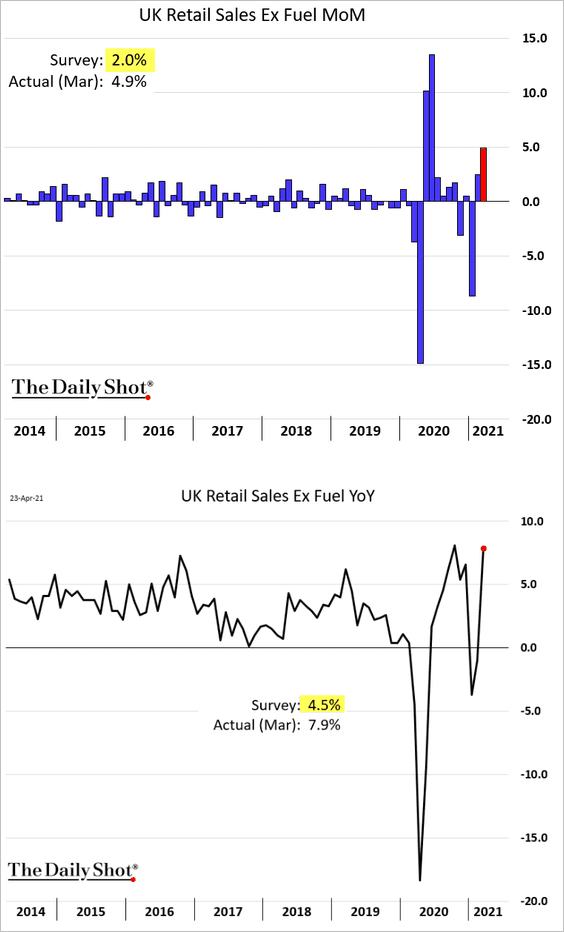
But some sectors remain soft.
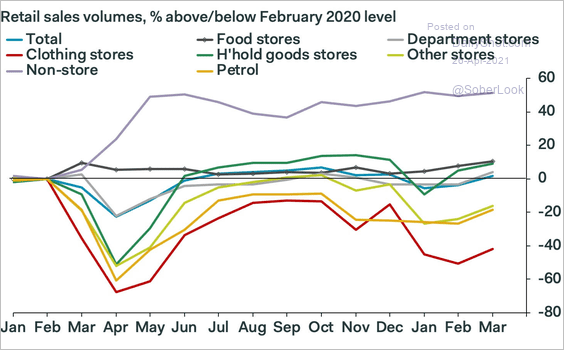 Source: Pantheon Macroeconomics
——————–
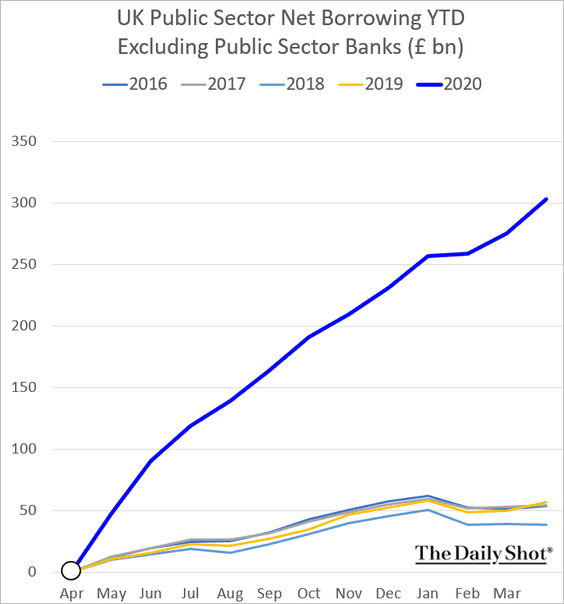
3. UK public borrowing has been unprecedented in the post-WW2 era.
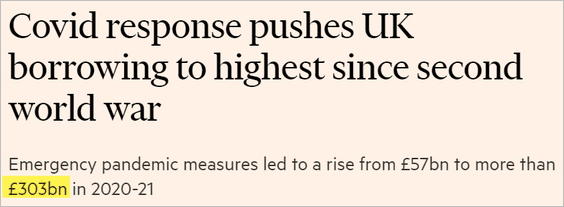 Source: @financialtimes Read full article
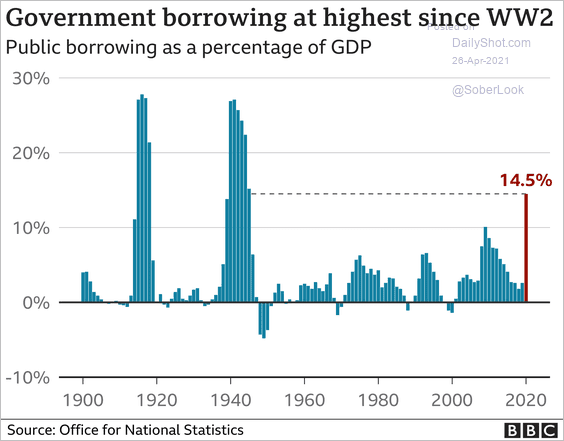 Source: BBC Read full article
——————–
4. This chart shows the divergence between US and UK real rates.
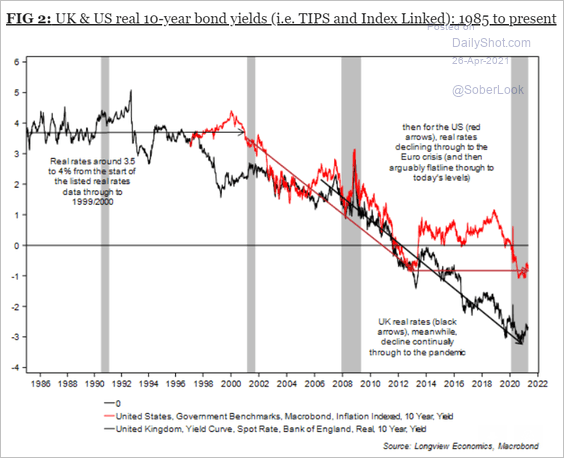 Source: Longview Economics
Back to Index
The Eurozone
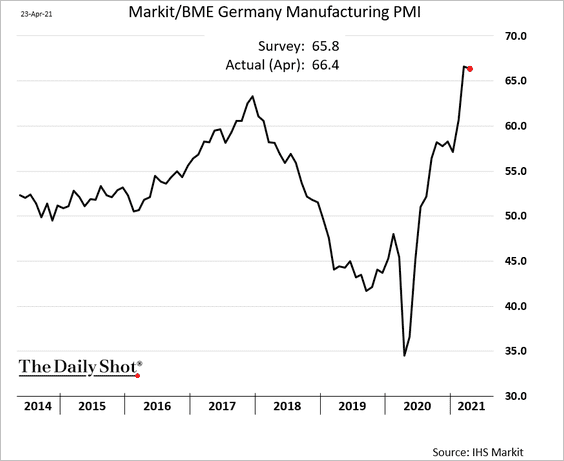
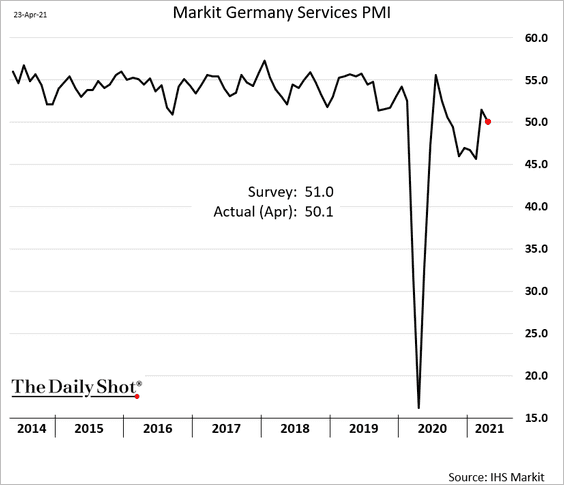
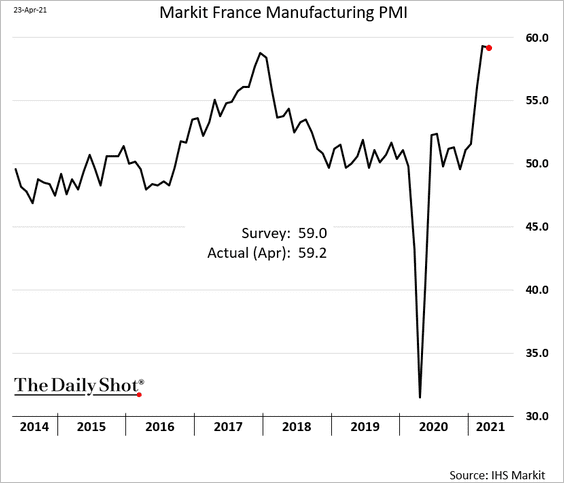
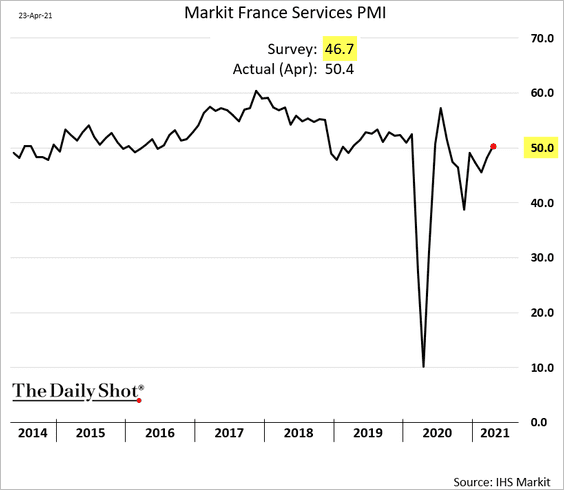
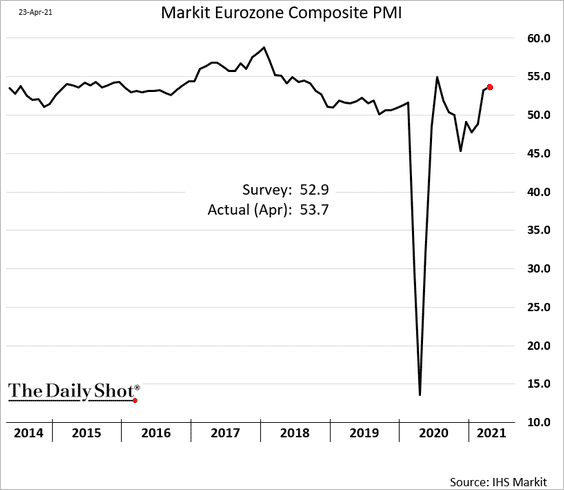
1. The April PMI report showed continuing growth in the euro-area business activity.
– Germany manufacturing PMI:
– Germany service PMI (a pause in the recovery):
– France manufacturing PMI:
– France service PMI (back in growth mode):
– Eurozone composite PMI (above consensus):
• Just like in the US, the supply-chain delays have been distorting the PMI measures to the upside.
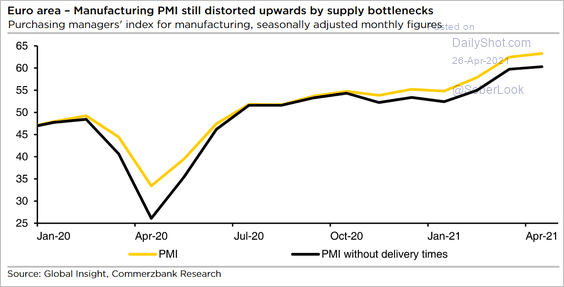 Source: Commerzbank Research
• The PMI report points to a strong rebound in Germany’s manufacturing employment.
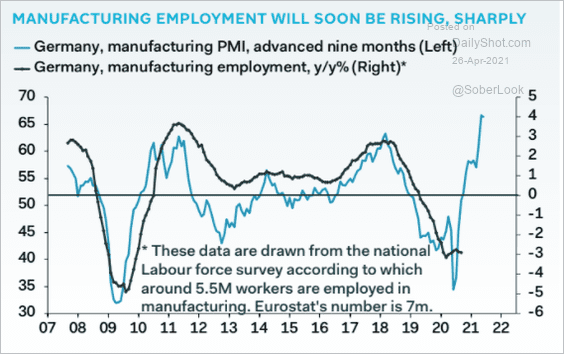 Source: Pantheon Macroeconomics
——————–
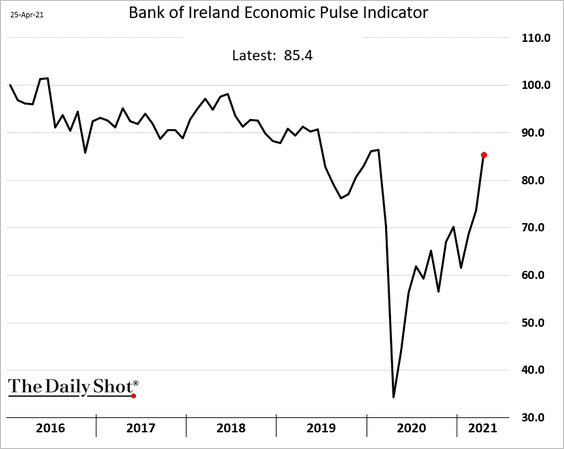
2. Ireland’s economic activity has nearly fully recovered.
3. Germany’s Greens continue to gain in the polls.
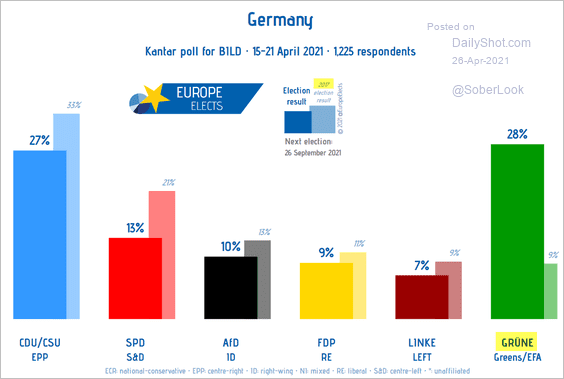 Source: @adam_tooze, @EuropeElects
Back to Index
Asia – Pacific
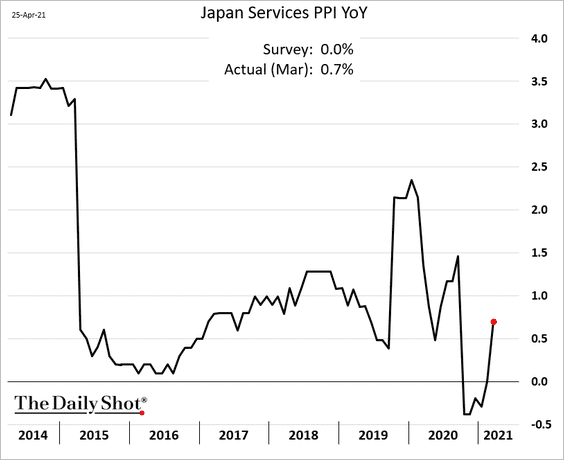
1. Japan’s service-sector PPI surprised to the upside.
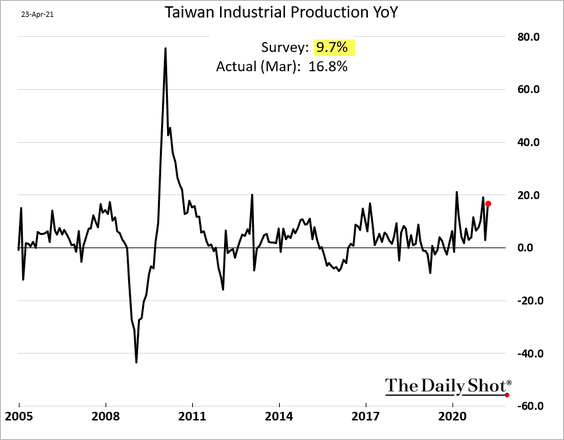
2. Taiwan’s industrial production continues to grow rapidly.
3. Next, we have some updates on Australia.
• The stock market volatility has been moderating.
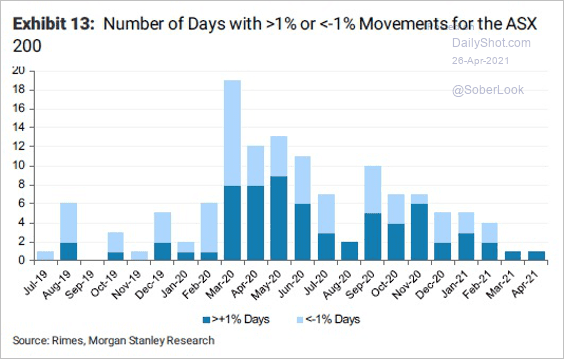 Source: Morgan Stanley Research; @Scutty
• Markets expect the first 15 basis point rate hike in November 2022.
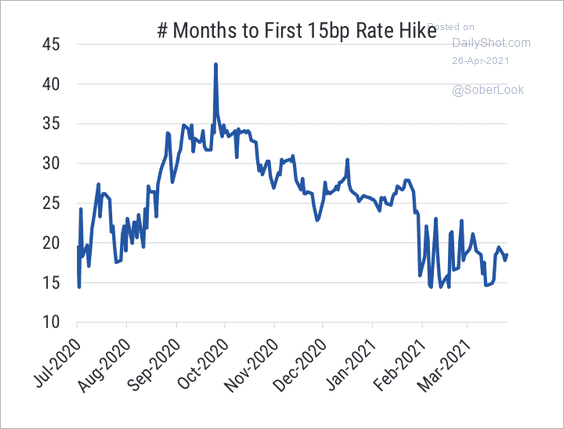 Source: Morgan Stanley Research
• Broad money growth has sharply diverged from credit growth over the past year.
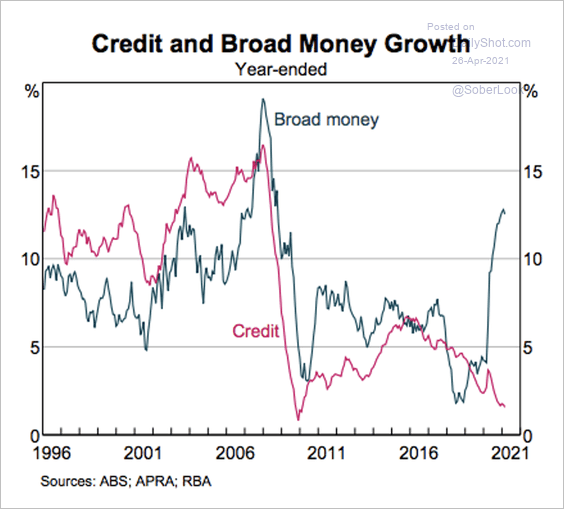 Source: RBA Read full article
Back to Index
China
1. Fiscal spending is expected to moderate this year.
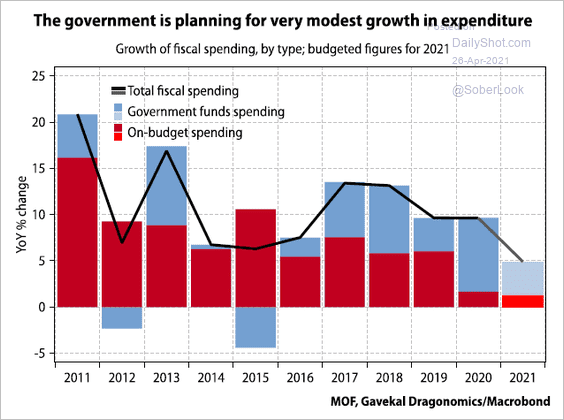 Source: Gavekal Research
2. Beijing’s deleveraging efforts have been putting some pressure on the shadow-banking sector.
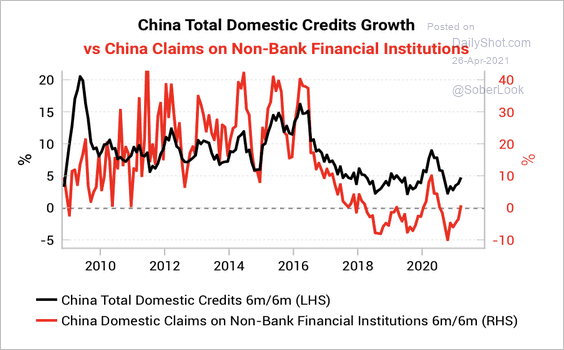 Source: Variant Perception
3. US listings by Chinese companies increased sharply this year.
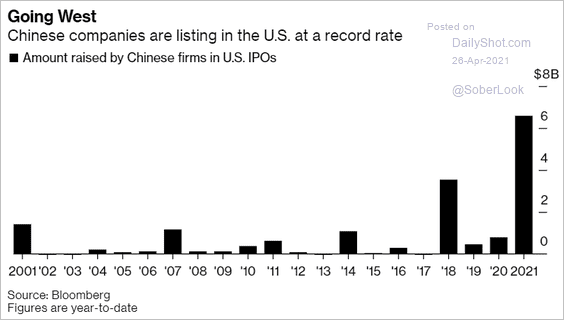 Source: Bloomberg Read full article
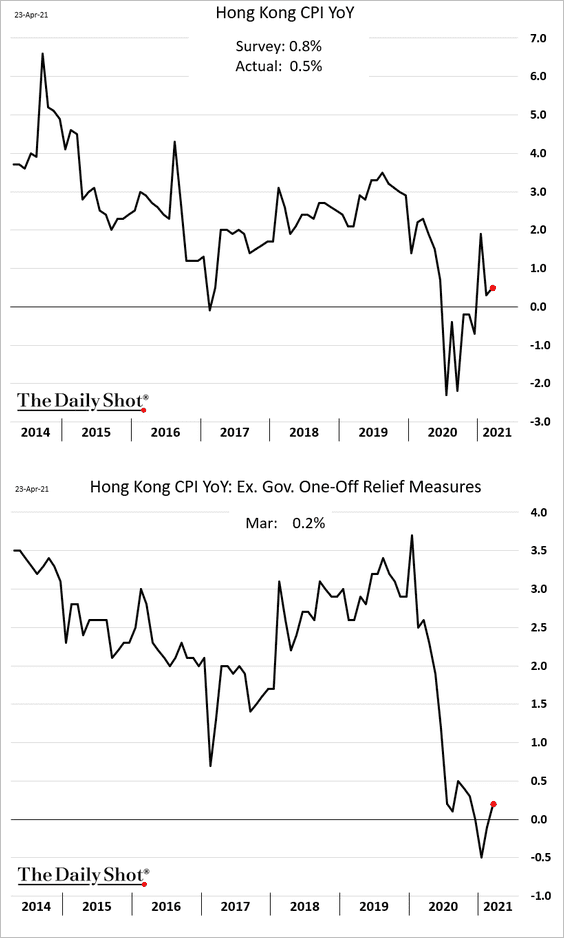
4. Hong Kong’s inflation remains subdued.
Back to Index
Emerging Markets
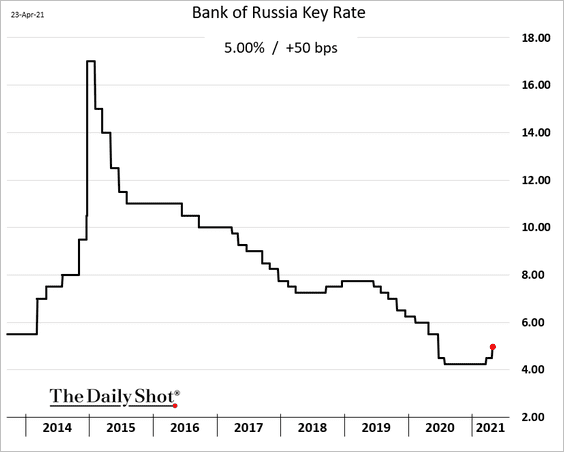
1. Let’s begin with Russia.
• The central bank hiked rates by 50 bps in response to rising inflation (the market expected 25 bps).
 Source: Bloomberg Read full article
By the way, the average EM policy rate has bottomed.
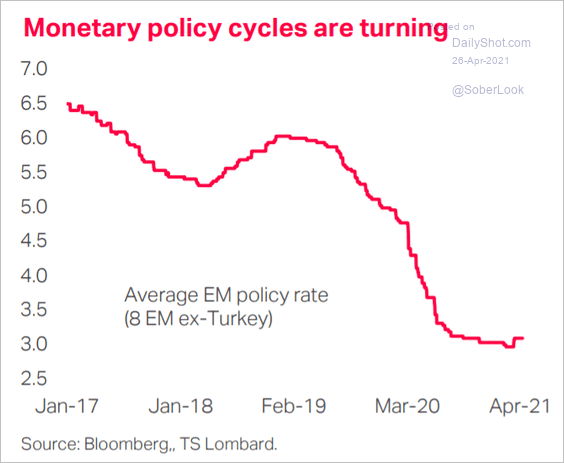 Source: TS Lombard
• This chart shows the composition of Russia’s FX reserves over time.
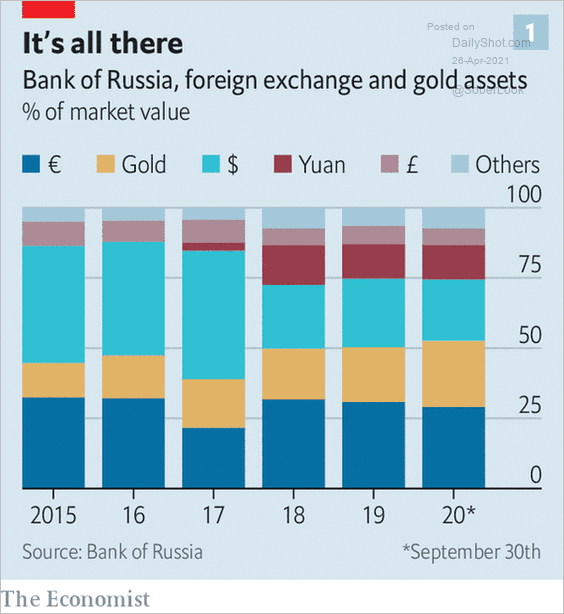 Source: @adam_tooze; The Economist Read full article
——————–
2. The Turkish lira keeps weakening.
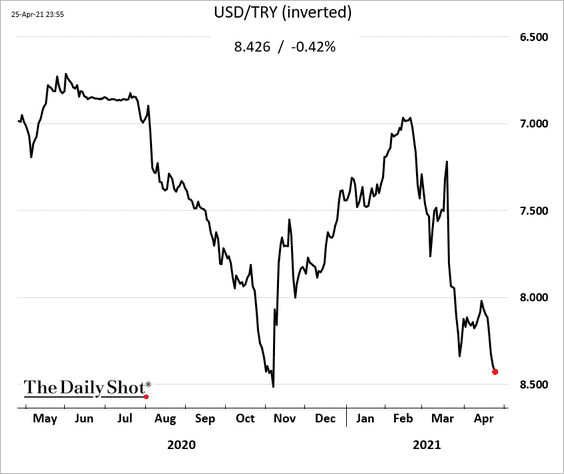
 Source: Reuters Read full article
——————–
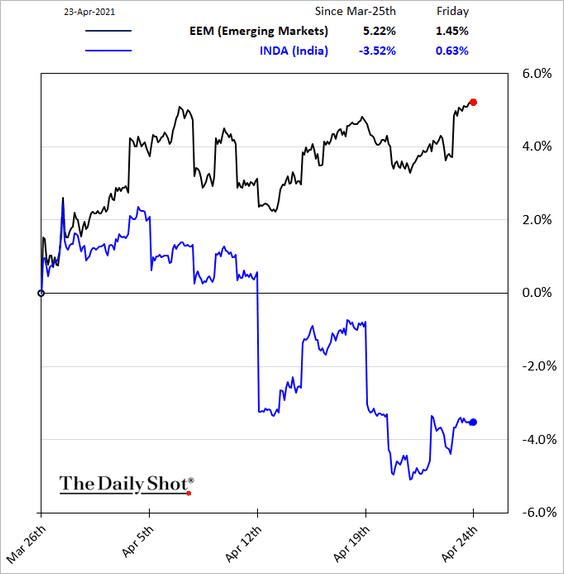
3. India’s COVID situation continues to deteriorate.
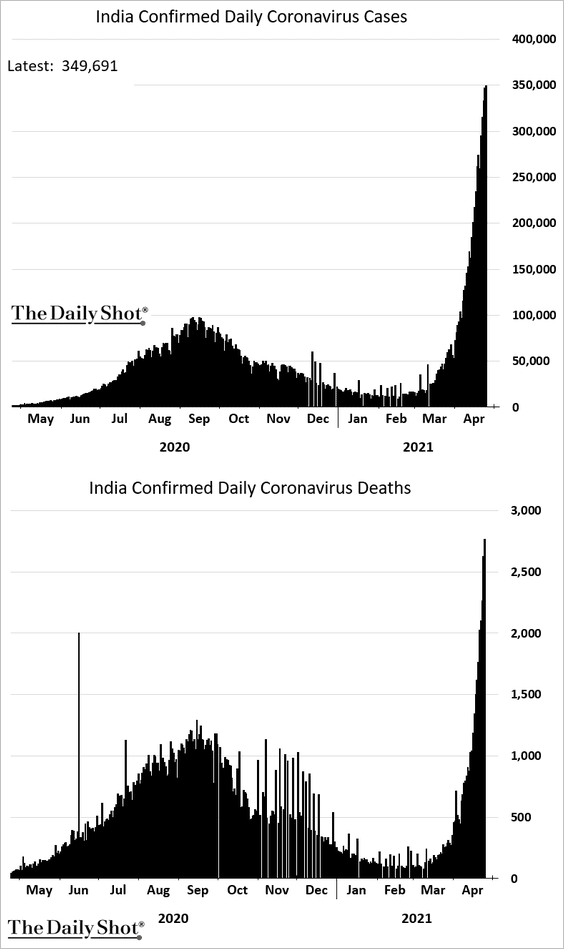
The stock market has been underperforming.
——————–
4. Iran’s currency has been under pressure.
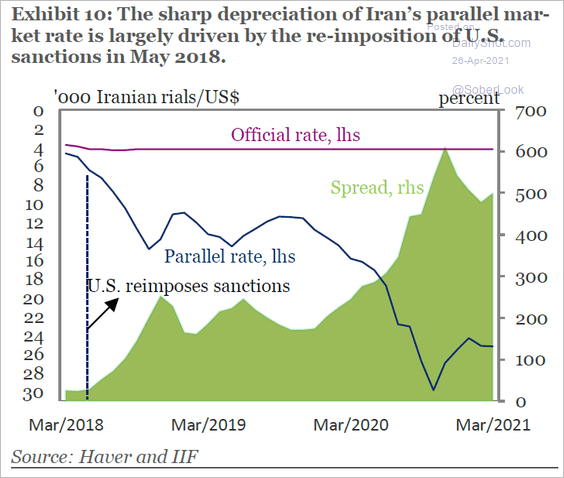 Source: IIF
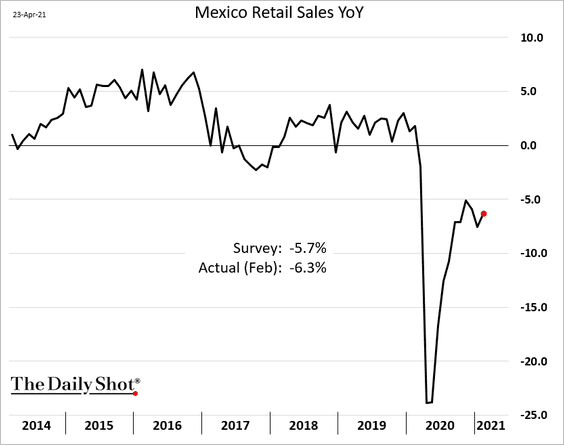
5. Mexico’s retail sales remained depressed in February.
6. Brazil’s carry over the US rates is at historically low levels at around 260 basis points.
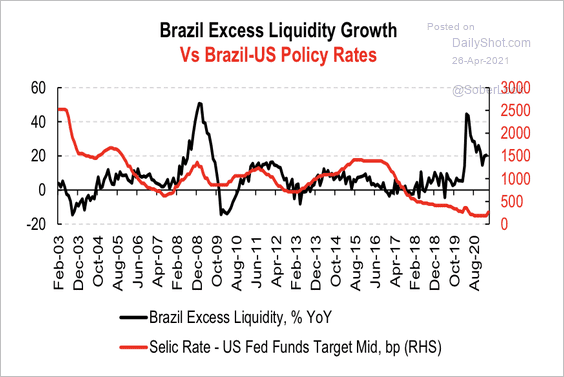 Source: Variant Perception
• The SELIC rate will need to rise further to stabilize the Brazilian real and rein in inflation, according to Variant Perception.
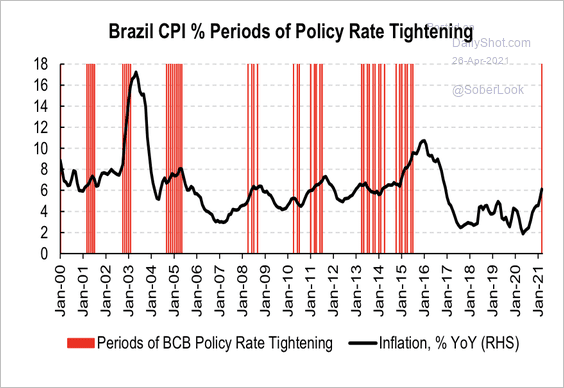 Source: Variant Perception
Back to Index
Cryptocurrency
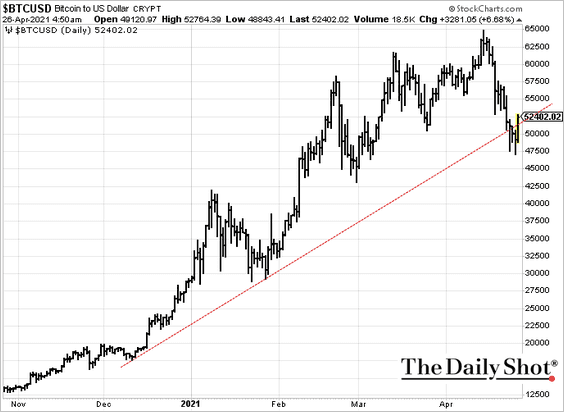
1. Bitcoin rebounded and is trading above $52k.
2. Dogecoin is back above 25c, …
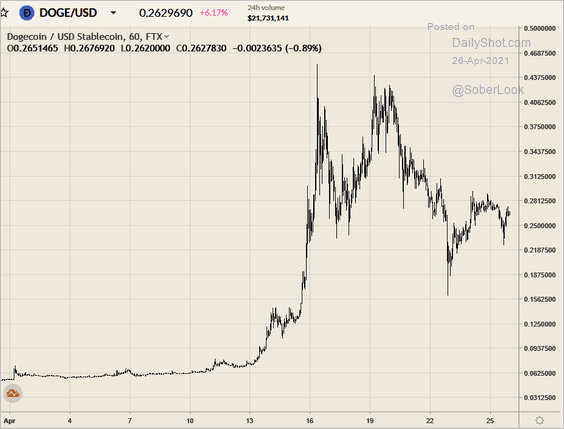 Source: FTX
… but the volatility has been spectacular.
 Source: Reddit, @notgrubles
——————–
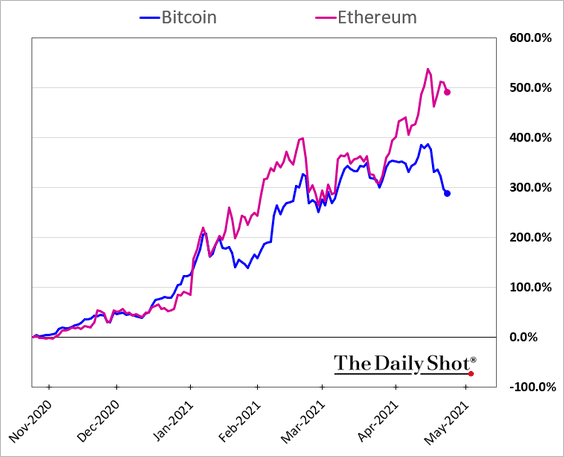
3. Ether has massively outperformed this month.
4. The Grayscale fund discount to NAV keeps widening.
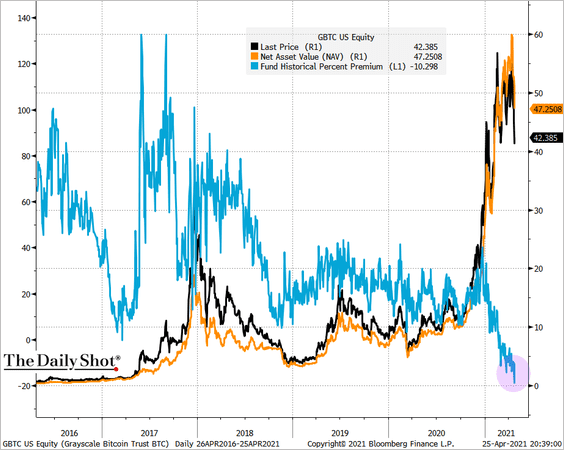 Source: @TheTerminal, Bloomberg Finance L.P. Read full article
Back to Index
Commodities
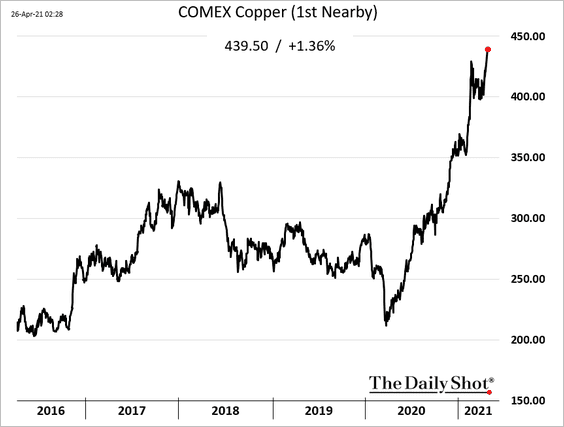
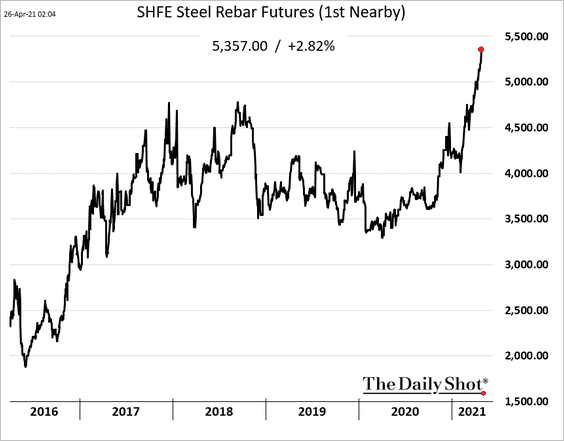
1. The rally in industrial commodities continues.
• US copper futures:
• Steel futures in China:
——————–
2. US lumber futures hit another record high, …
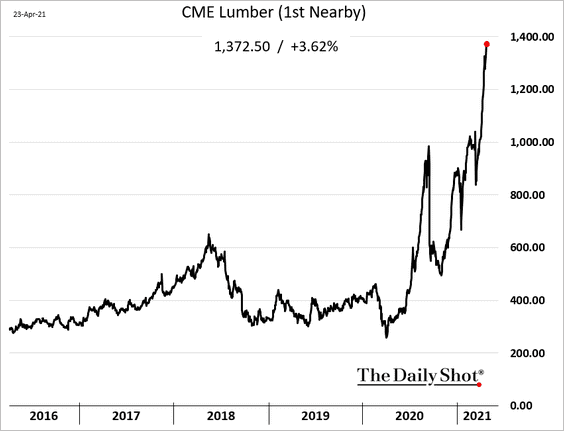
… as inventories tighten.
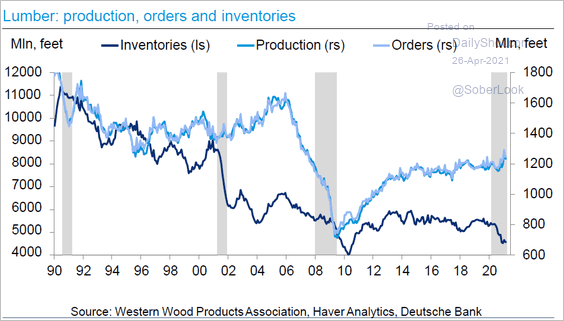 Source: Deutsche Bank Research
——————–
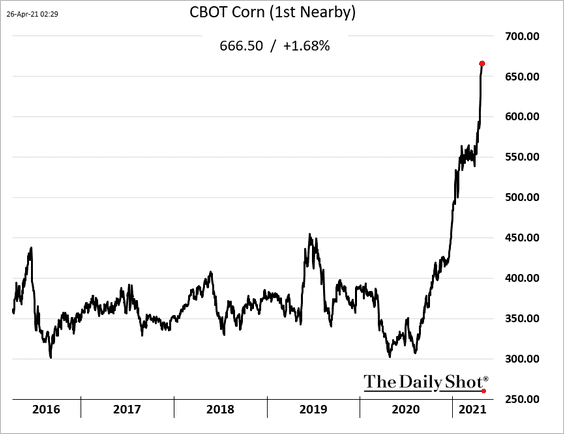
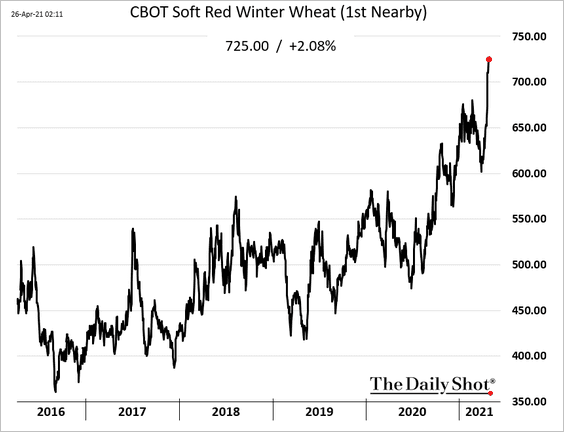
3. US grains keep hitting multi-year highs.
• Corn:
• Wheat:
——————–
4. Global consumption for commodities is expected to remain strong over the next few years.
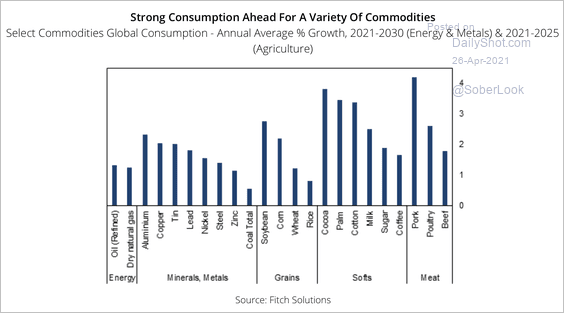 Source: Fitch Solutions Macro Research
Back to Index
Energy
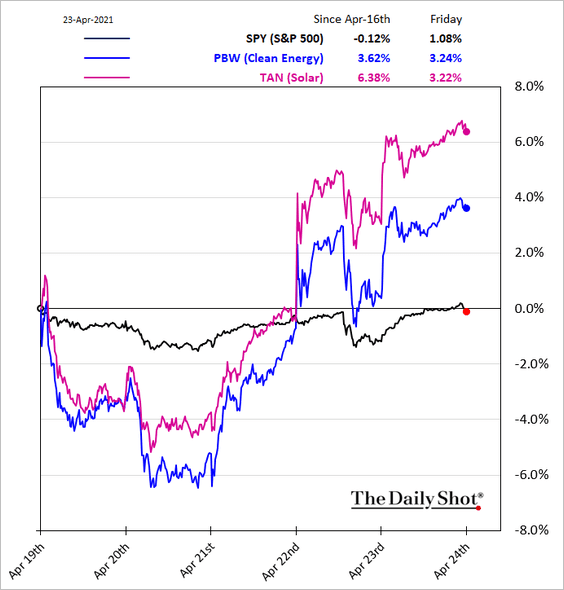
1. Clean energy shares rebounded last week.
 Source: CNBC Read full article
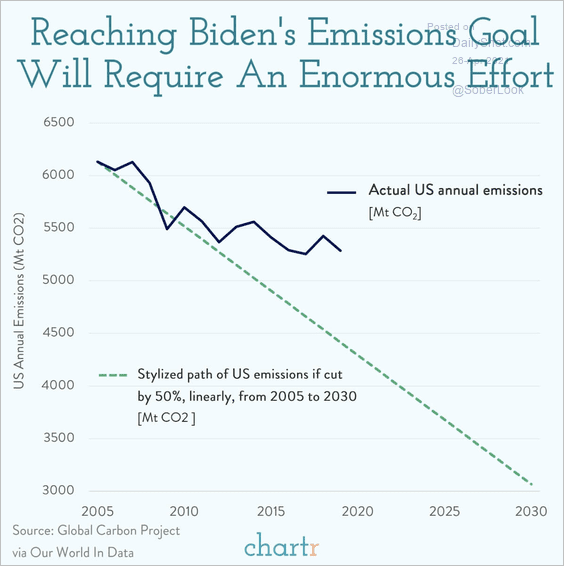 Source: @chartrdaily
——————–
2. This chart shows Texas generating capacity by source:
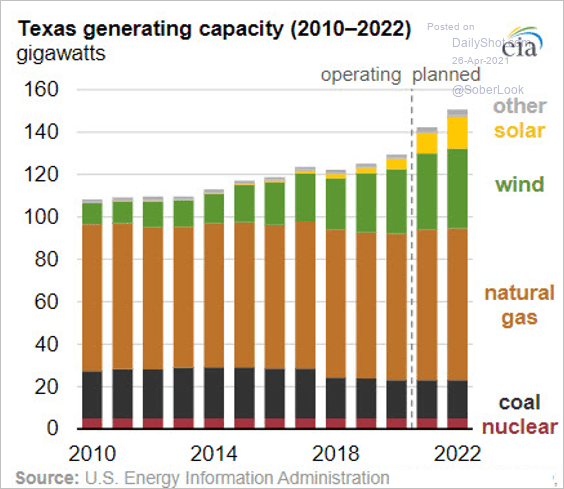 Source: @EIAgov Read full article
Back to Index
Equities
1. The market performance has been highly unusual relative to previous post-bear-market recoveries.
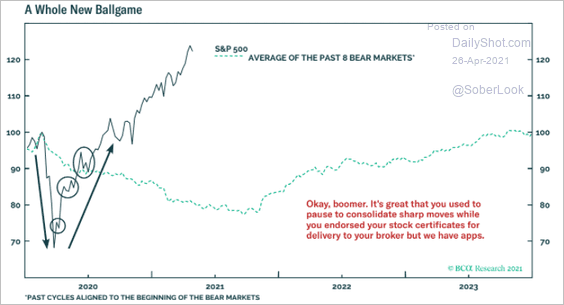 Source: BCA Research
2. Transportation stocks have been up for 12 weeks in a row.
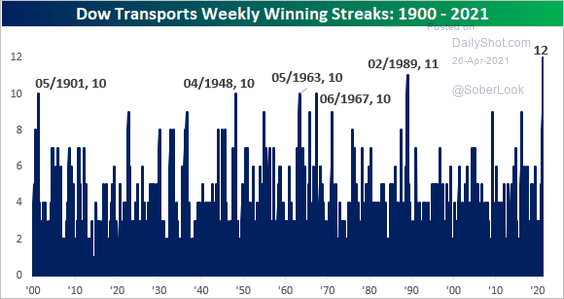 Source: @bespokeinvest
3. Equity fund flows remain positive.
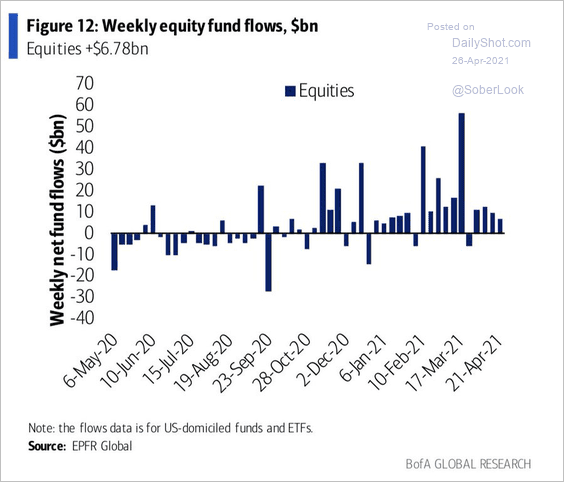 Source: BofA Global Research, @WallStJesus
4. US economic strength relative to the rest of the world has boosted domestic-focused cyclical companies vs. those that sell internationally.
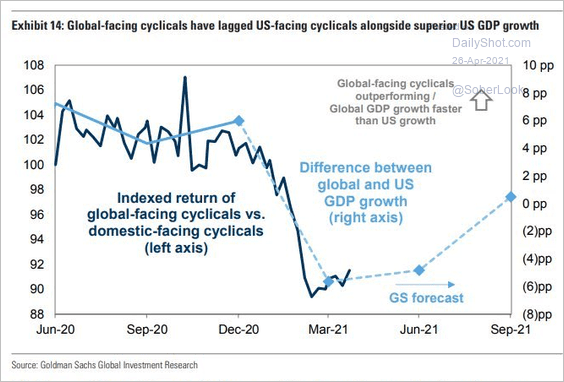 Source: Goldman Sachs, @WallStJesus
5. The recent US dollar weakness had a positive impact on reported sales.
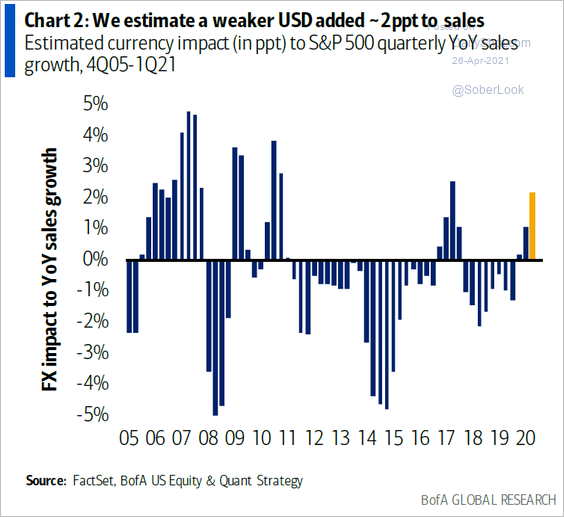 Source: BofA Global Research
6. The market cap of all global equities is over $111 trillion, up 28% from the pre-pandemic high.
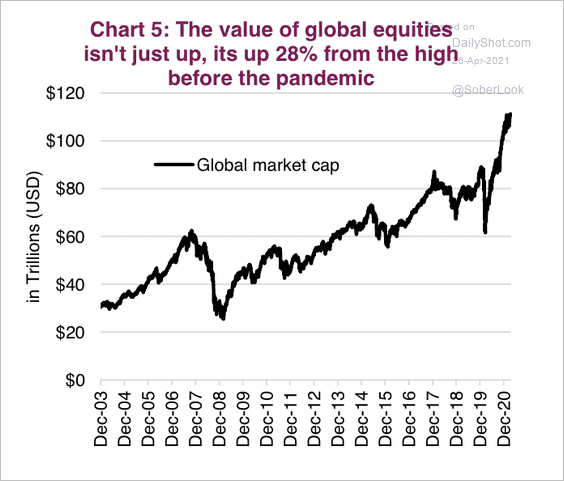 Source: Market Ethos, Richardson GMP
7. Technical indicators have not worked over the past year.
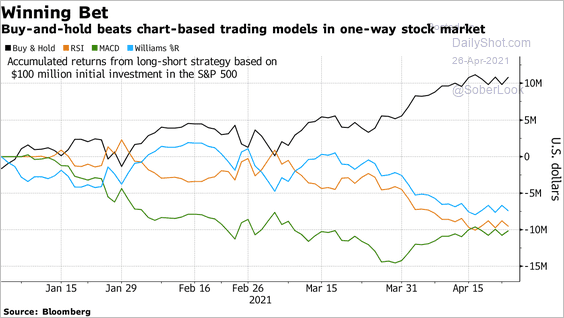 Source: @markets Read full article
8. The S&P 500 real risk premium is the lowest in over two decades.
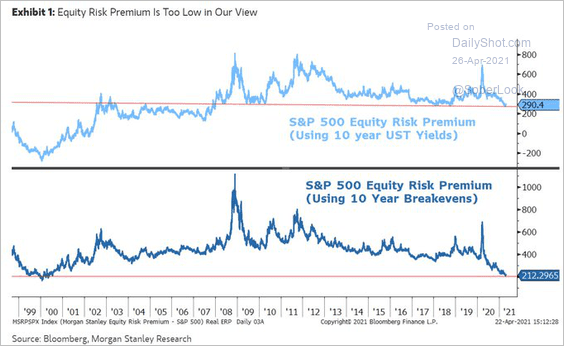 Source: Morgan Stanley Research; @jsblokland
Back to Index
Credit
1. CCC spreads are the lowest since 2007.
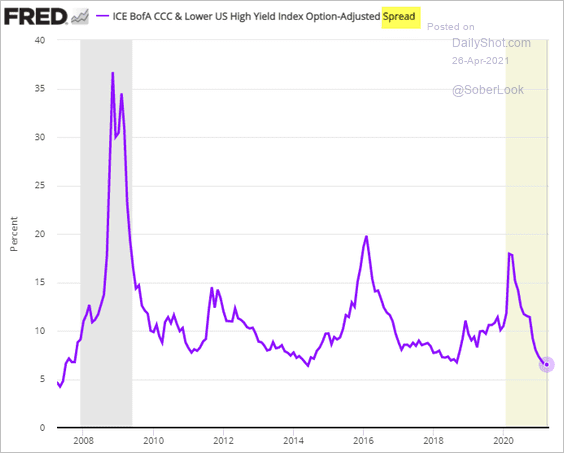
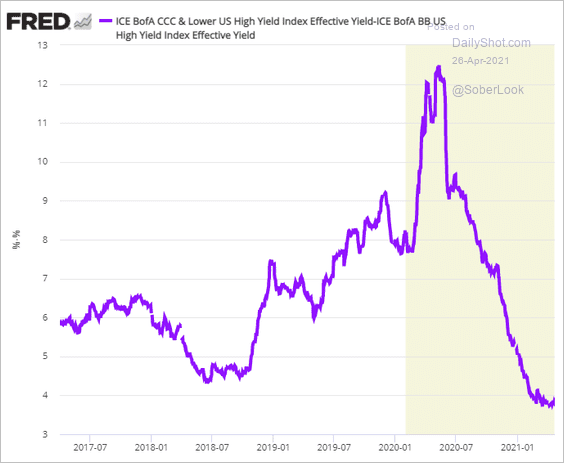
But have they bottomed? Here is the spread between BB and CCC bonds.
 Read full article
——————–
2. This chart shows ESG bond issuance (MM = mature markets).
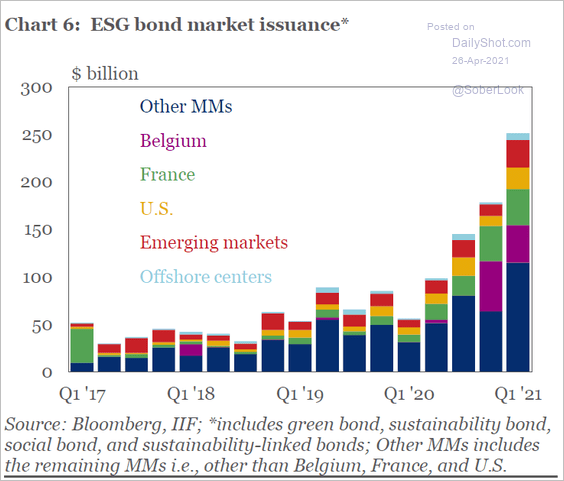 Source: IIF
Back to Index
Global Developments
1. Bloomberg’s US dollar index is at support.
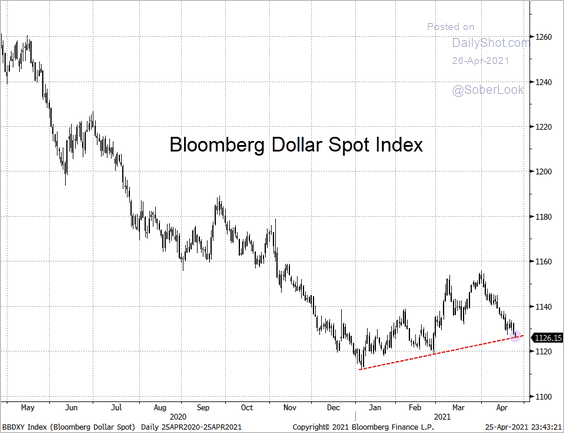 h/t Cormac Mullen
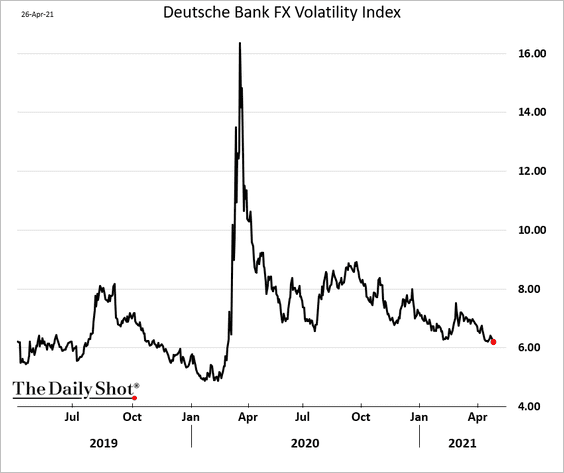
2. F/X implied volatility is near the lowest levels since the start of the pandemic.
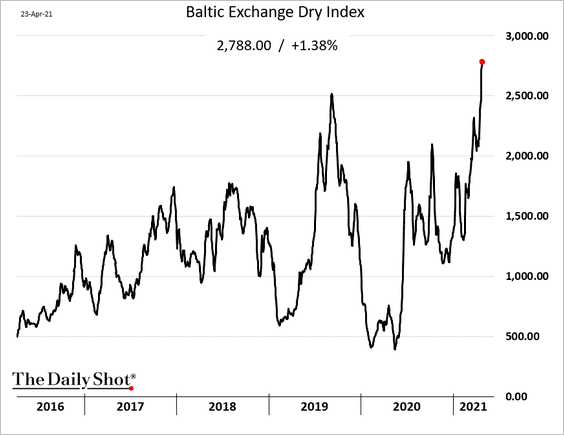
3. Dry bulk shipping costs keep climbing.
4. Here is the percentage of government debt held by foreigners.
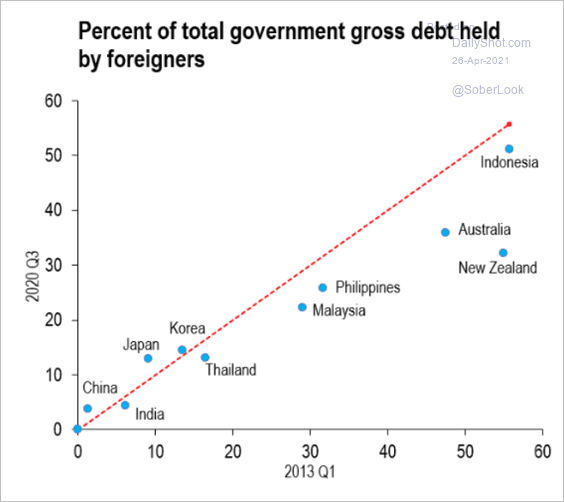 Source: IMF Read full article
5. How much vehicle production has been lost due to chip shortages?
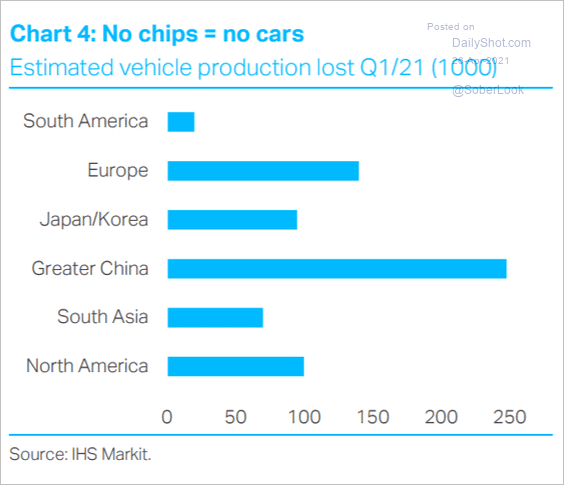 Source: TS Lombard
——————–
Food for Thought
1. US daily vaccinations:
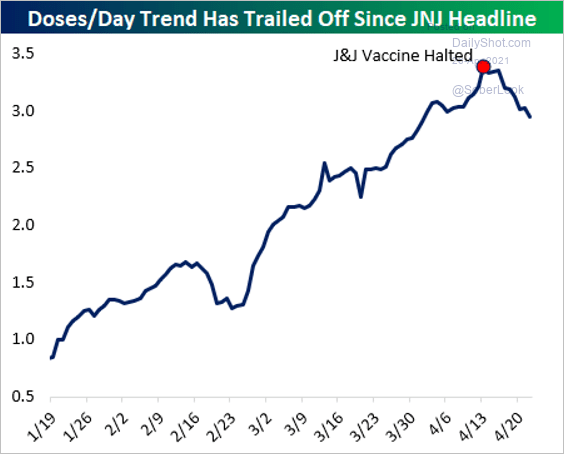 Source: @bespokeinvest
2. Unused vaccine doses:
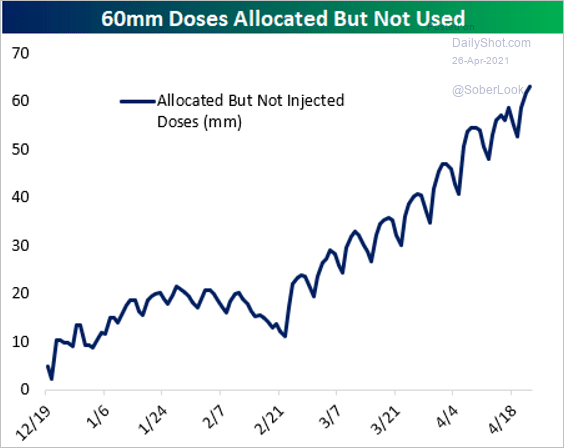 Source: @bespokeinvest
3. Vaccine intentions, by religious affiliation:
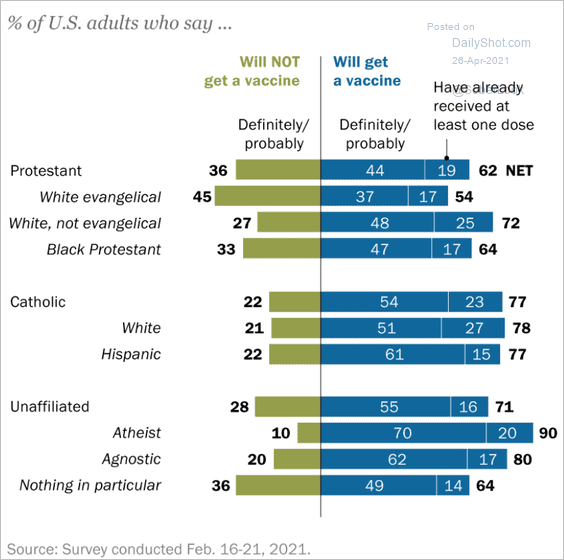 Source: Pew Research Center Read full article
4. Who Americans spend time with, by age:
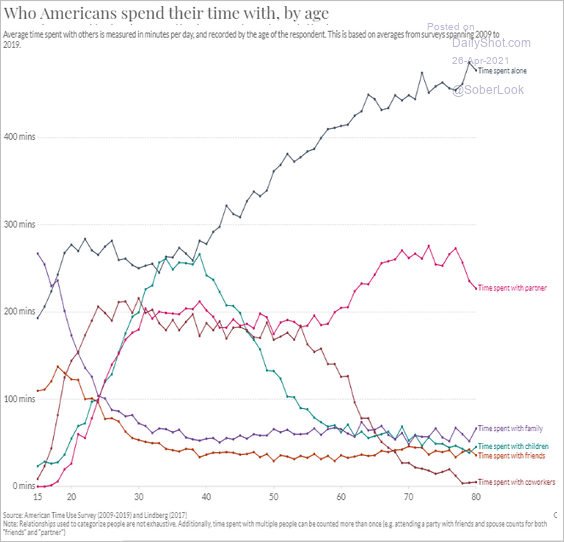 Source: Visual Capitalist Read full article
5. Mental health online search activity:
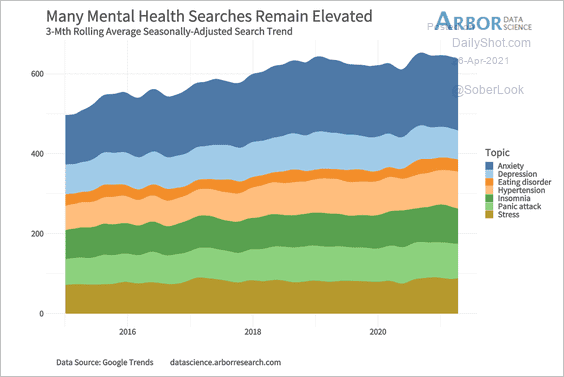 Source: Arbor Research & Trading
6. Foreign-born and native-born youth with migrant parents:
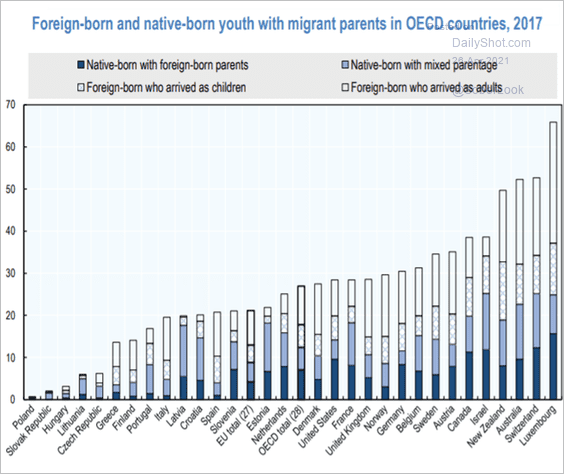 Source: OECD Read full article
7. US support for an independent Palestinian state:
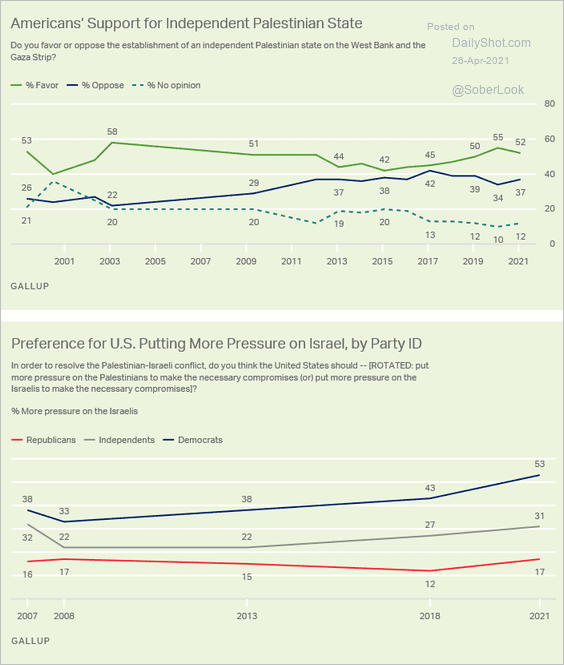 Source: Gallup Read full article
8. Christianity in Iraq:
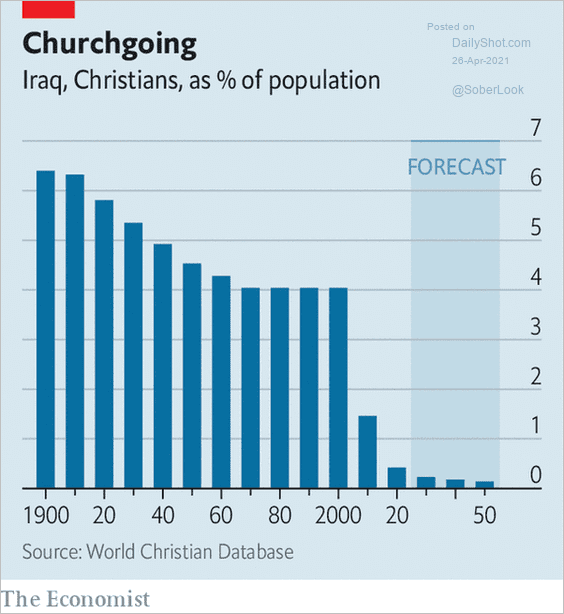 Source: The Economist Read full article
9. Turtles of North America:
 Source: Roger Hall
——————–
Back to Index