
The Daily Shot: 27-Apr-21
• The United States
• Canada
• Europe
• Asia – Pacific
• China
• Emerging Markets
• Cryptocurrency
• Commodities
• Energy
• Equities
• Alternatives.
• Rates
• Global Developments
• Food for Thought
The United States
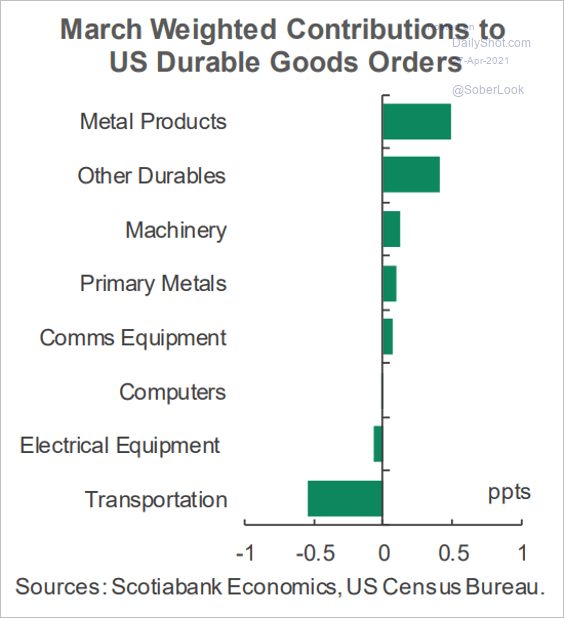
1. The March durable goods orders report was weaker than expected.
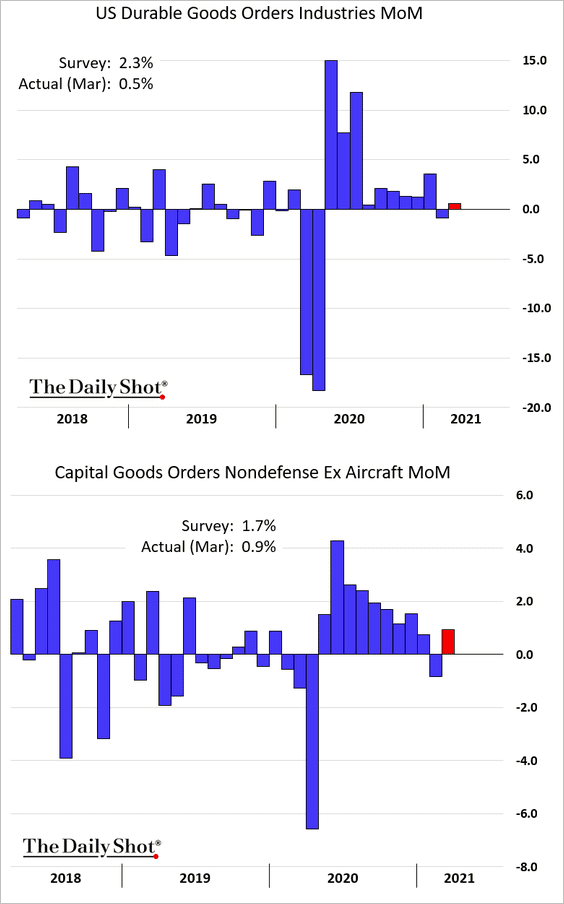
The transportation sector was a drag on orders. An early Easter holiday also had a negative impact.
 Source: Scotiabank Economics
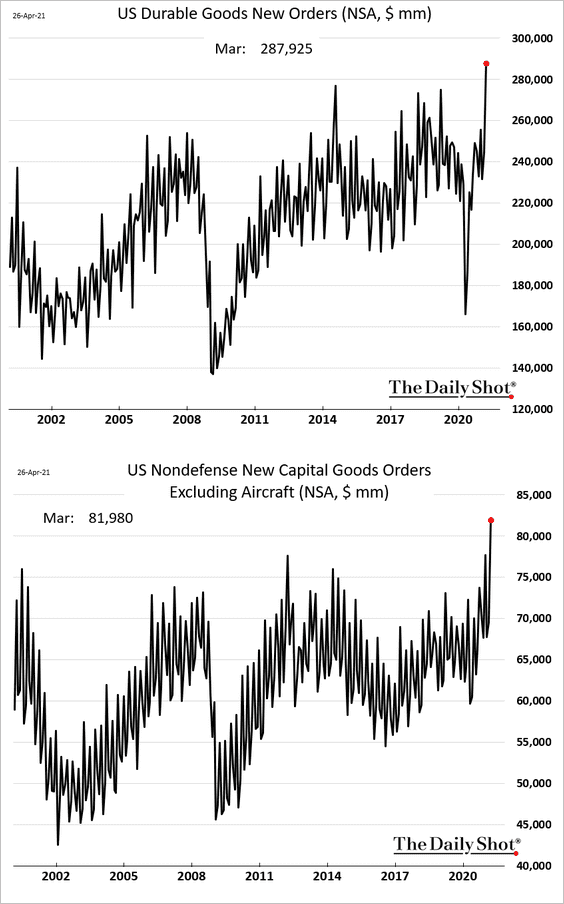
But to put this report into perspective, let’s look at the absolute dollar amount of orders without seasonal adjustments. The trend remains strong.
——————–
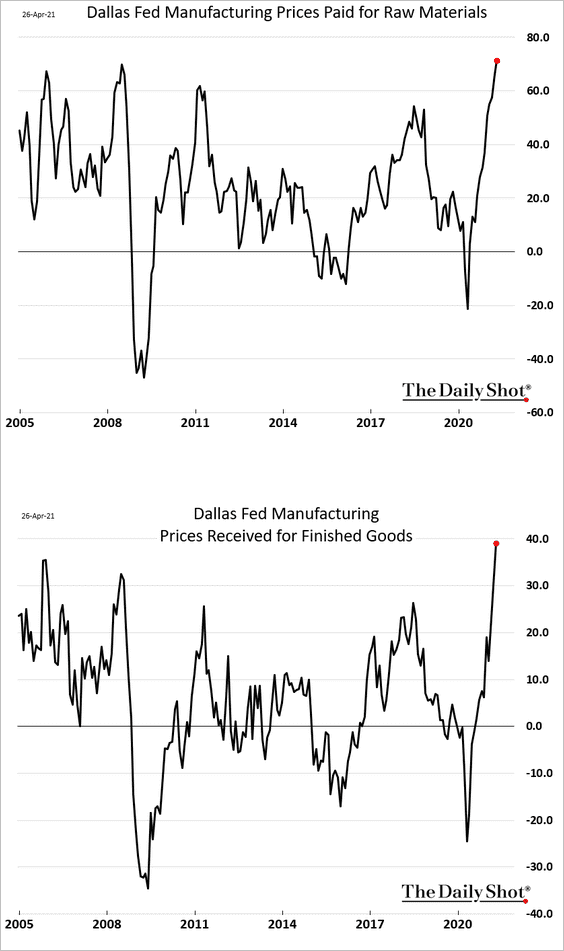
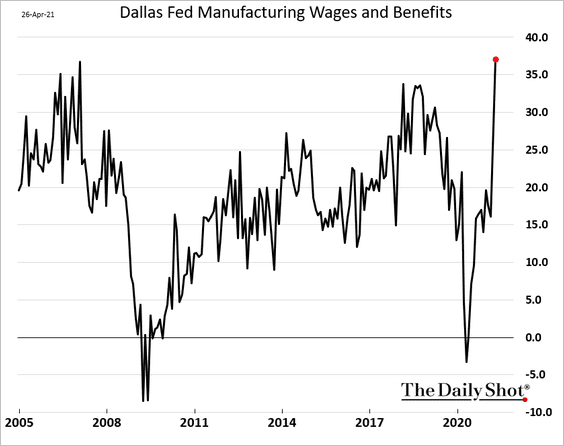
2. The Dallas Fed’s manufacturing report confirmed the exceptionally robust manufacturing activity we see across the country.
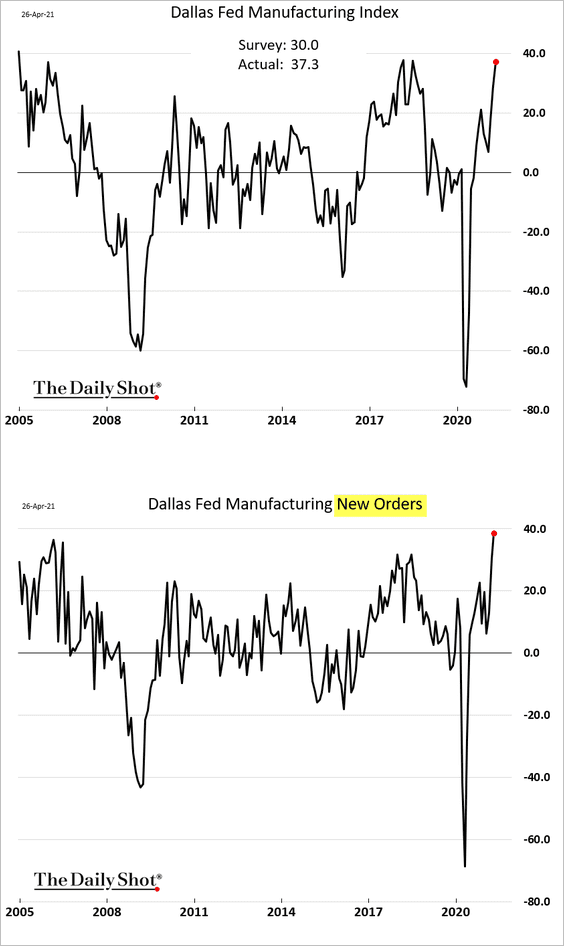
And we continue to see increasing price pressures.
• Input and output prices:
• Wages:
——————–
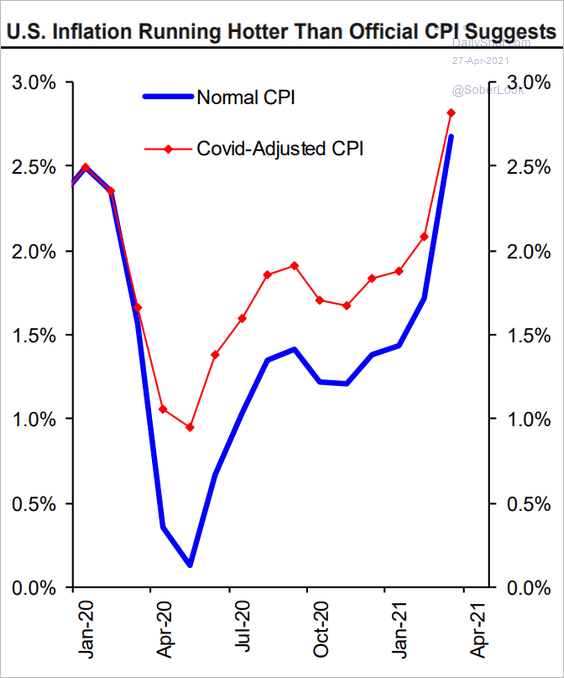
3. Next, we have some additional updates on inflation.
• What happens to the CPI when the pandemic-related changes in spending patterns are taken into account?
 Source: Hugo Ste-Marie, Portfolio & Quantitative Strategy Global Equity Research, Scotia Capital
• Companies increasingly mention inflation on earnings calls.
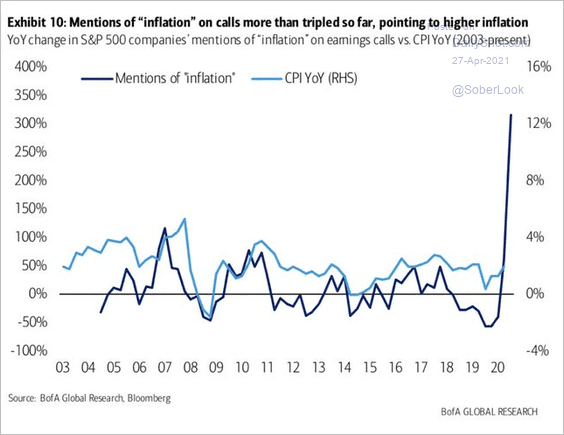 Source: BofA Global Research; @carlquintanilla
• Consumers are concerned about inflation. Will it impact spending?
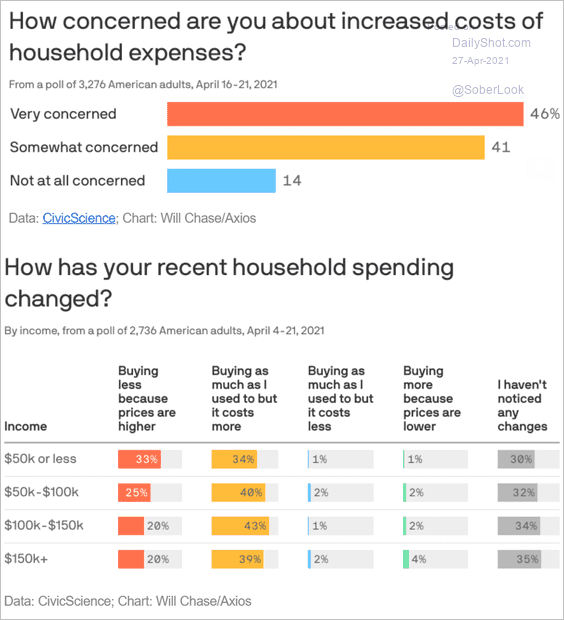 Source: @axios Read full article
• Hotel rates are rising, …
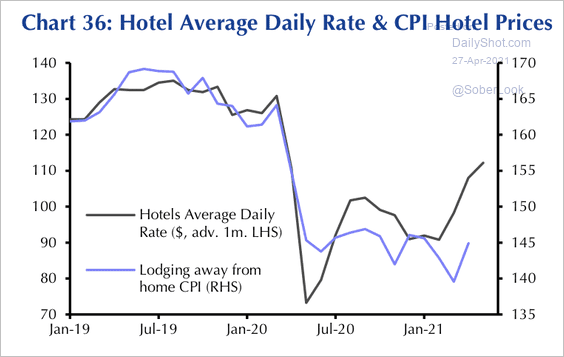 Source: Capital Economics
… and rent inflation has bottomed. These trends could boost service inflation.
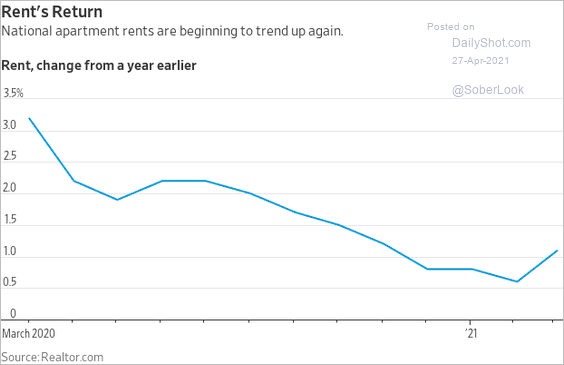 Source: @WSJ Read full article
——————–
4. How much growth room does the economy have without accelerating inflation or creating bubbles in capital markets? Changing the trend slope tells different stories.
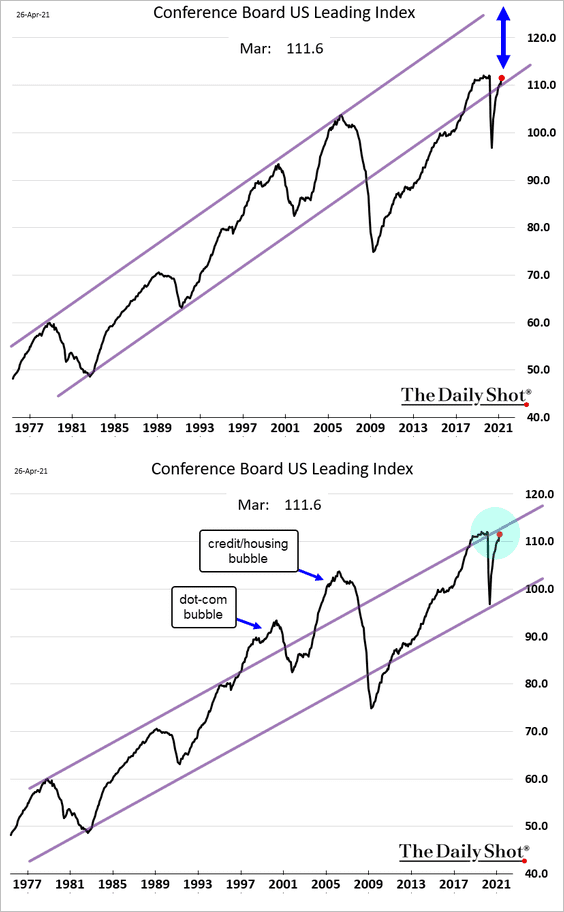 h/t Evercore ISI
5. According to Goldman, the GDP growth will peak this quarter.
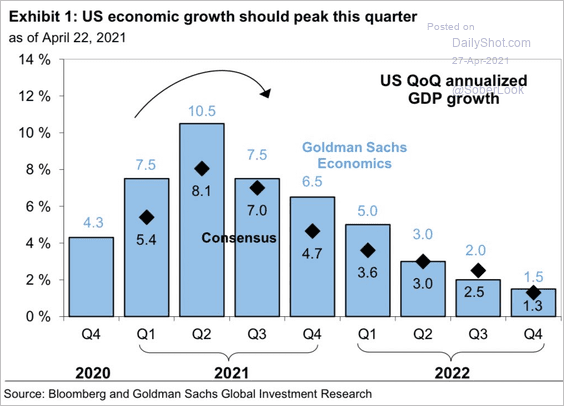 Source: Goldman Sachs, @carlquintanilla
• Over the next few quarters, US growth will outpace that of China.
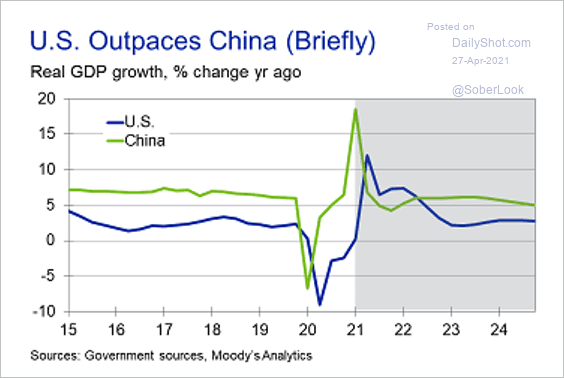 Source: Moody’s Analytics
• Last quarter’s growth in private demand was massive.
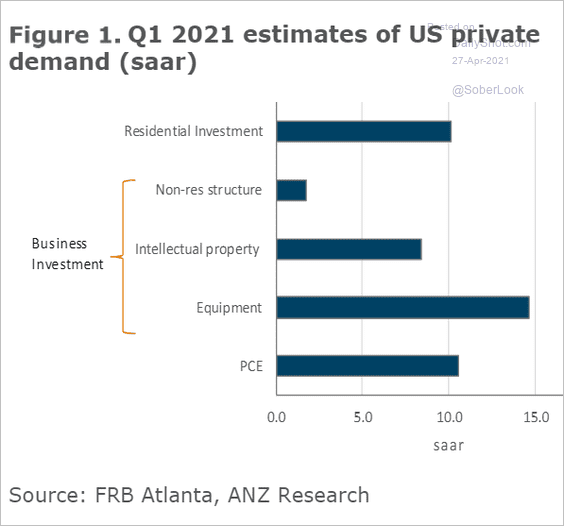 Source: ANZ Research
——————–
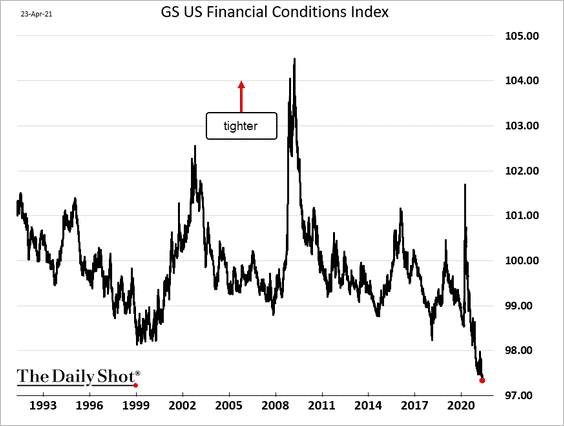
6. US financial conditions are extraordinarily accommodative.
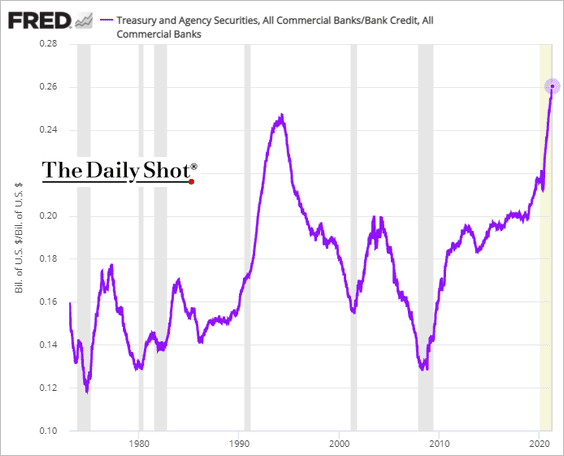
7. Over 26% of US bank credit is to the federal government and GSEs.
Back to Index
Canada
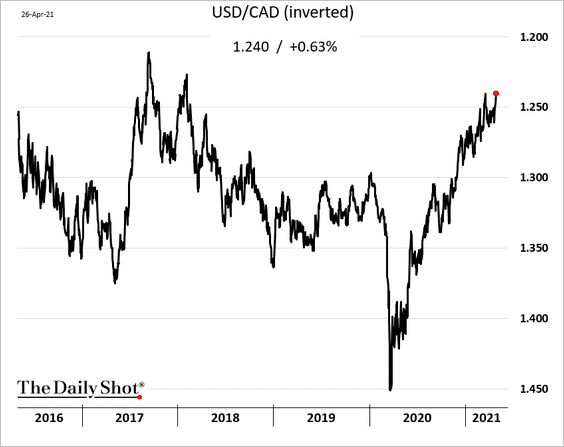
1. The loonie is near the highest level (vs. USD) since 2018.
2. Government bonds are once again more sensitive to global interest rate moves.
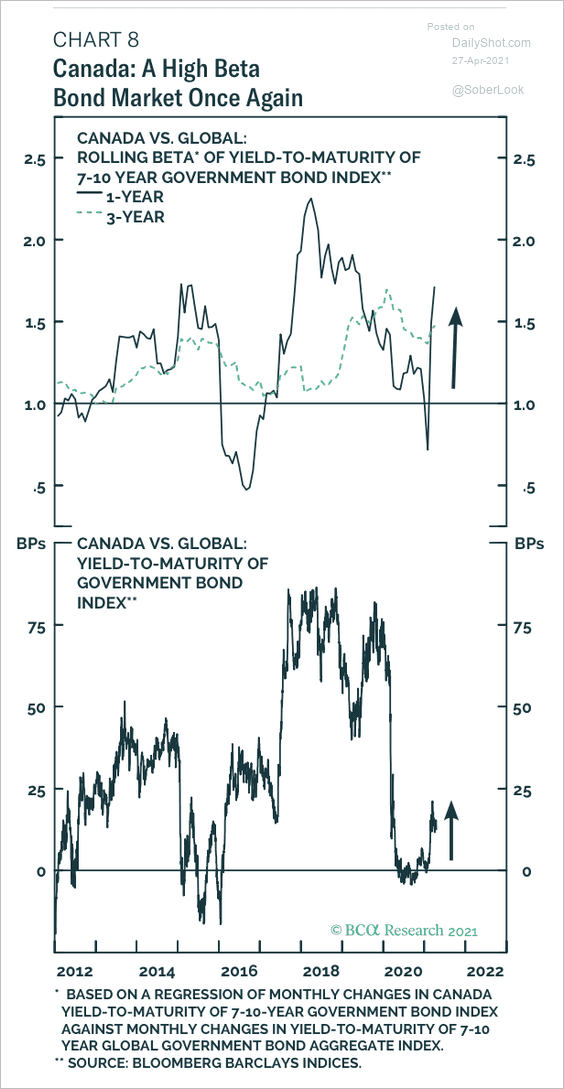 Source: BCA Research
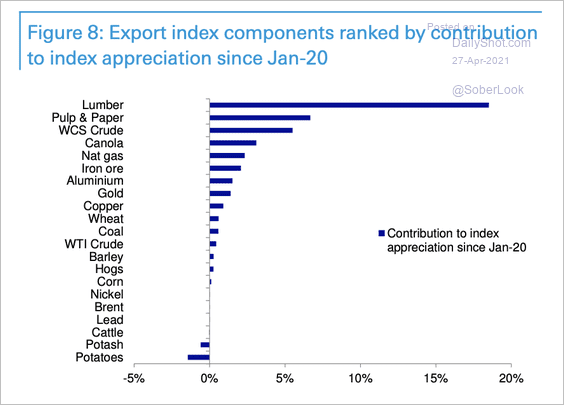
3. Export prices have rebounded strongly over the past year, mainly due to the rally in lumber prices (2 charts).
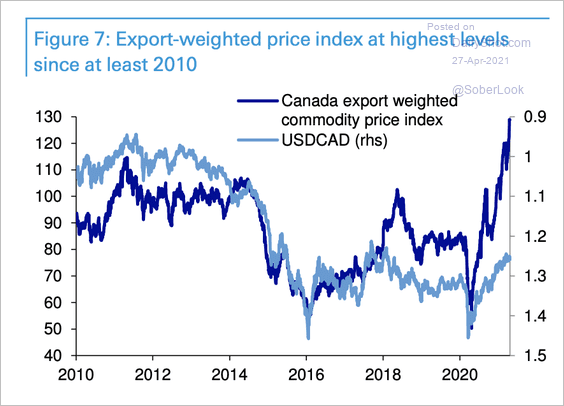 Source: Deutsche Bank Research
 Source: Deutsche Bank Research
——————–
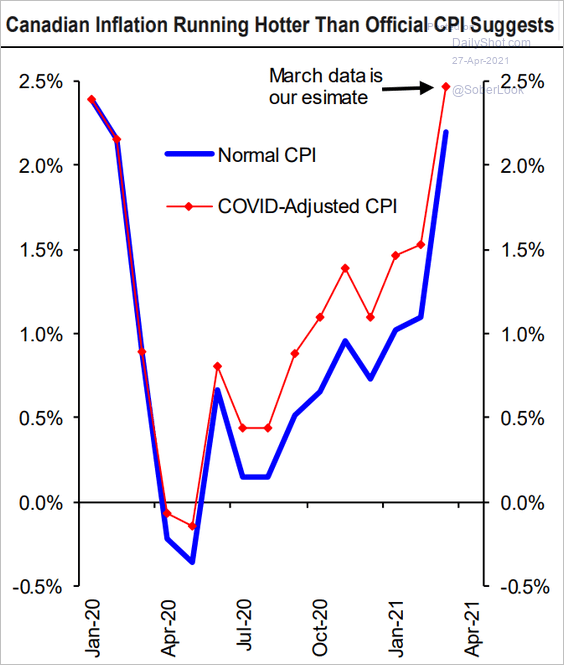
4. What happens to the CPI when the pandemic-related changes in spending patterns are taken into account?
 Source: Hugo Ste-Marie, Portfolio & Quantitative Strategy Global Equity Research, Scotia Capital
5. More firms expect higher inflation over the next two years, according to a Bank of Canada survey.
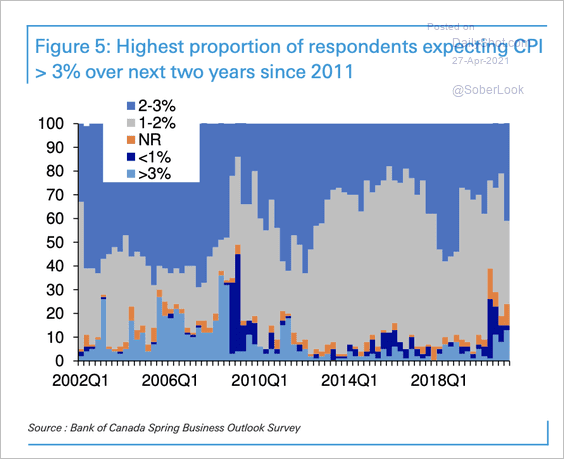 Source: Deutsche Bank Research
6. Stocks look overbought relative to bonds.
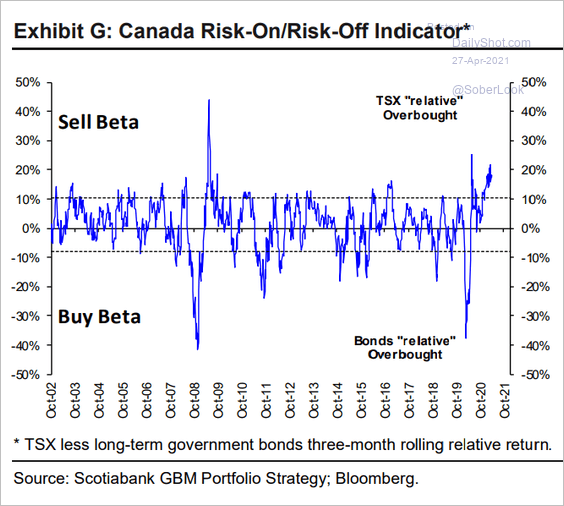 Source: Hugo Ste-Marie, Portfolio & Quantitative Strategy Global Equity Research, Scotia Capital
Back to Index
Europe
1. Germany’s Ifo expectations index pulled back from the highs.
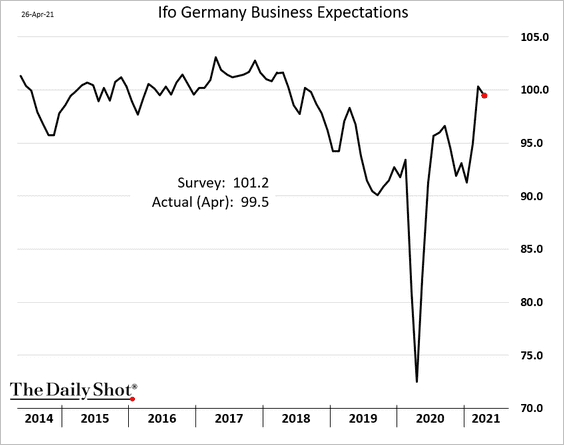
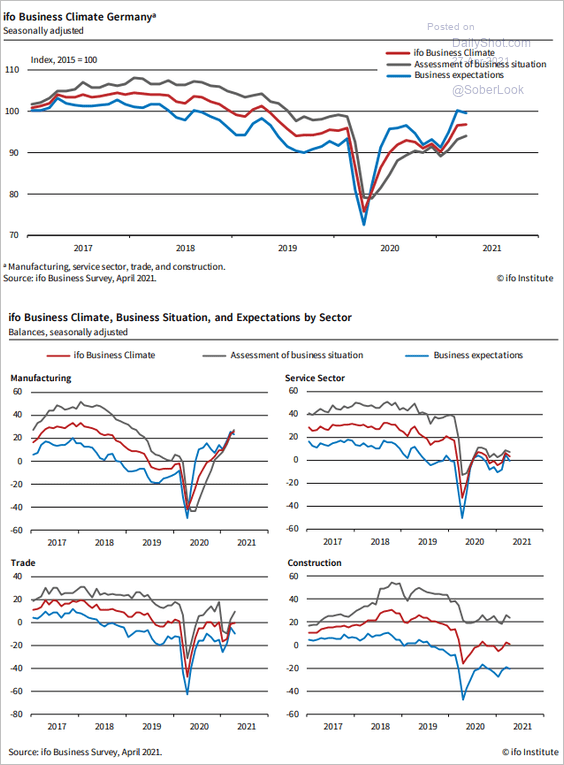 Source: ifo Institute
——————–
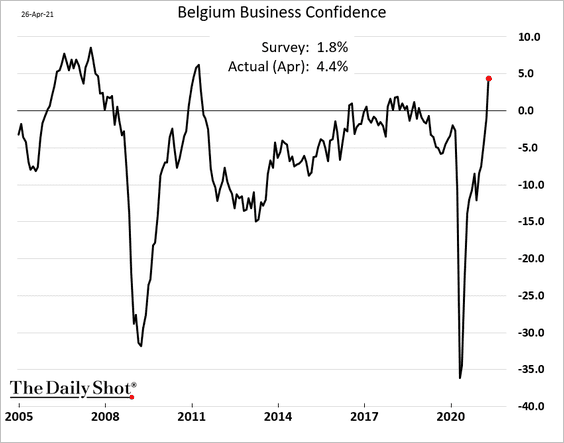
2. Belgian consumer confidence is soaring.
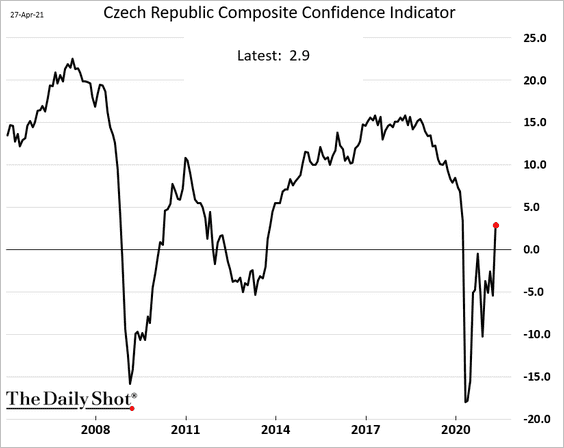
3. Czech business and consumer confidence is rebounding.
4. Sweden’s redundancy notices have been relatively subdued since last summer.
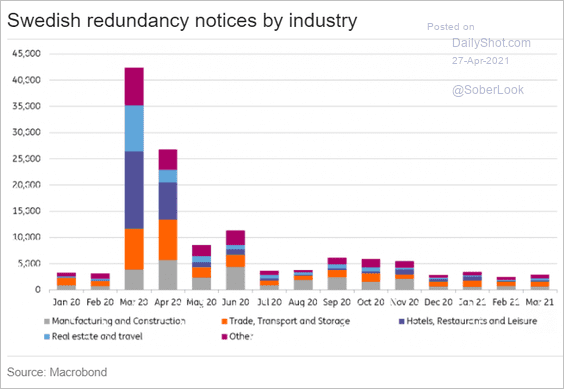 Source: ING
5. Here is the COVID cases map.
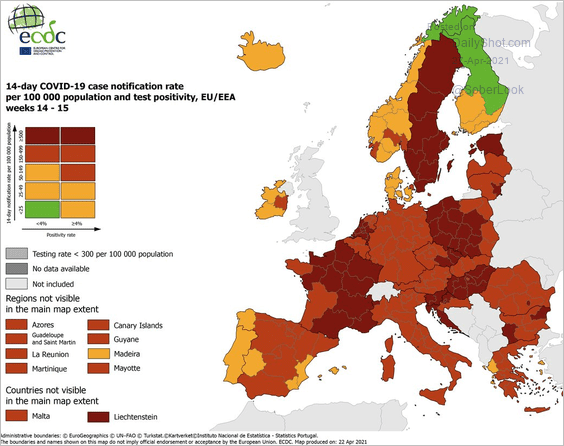 Source: @EU_Commission, @ECDC_EU Read full article
6. This chart shows the total hours worked in the EU.
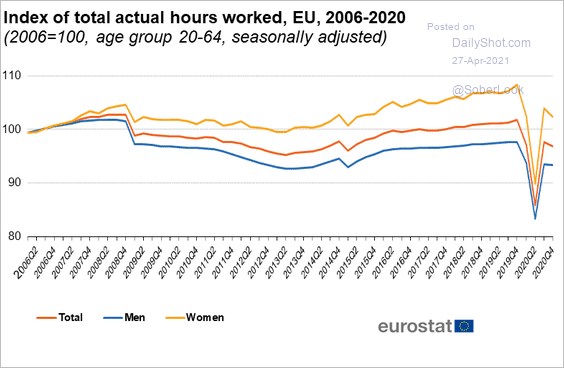 Source: Eurostat
Back to Index
Asia – Pacific
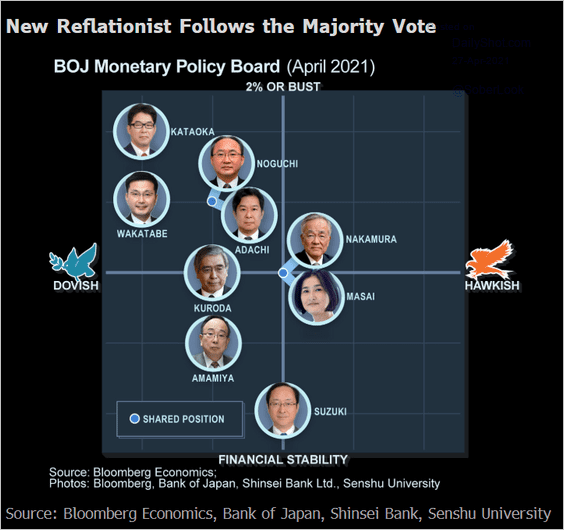
1. The BoJ downgraded its inflation forecasts, suggesting that the accommodation will stay in place for some time to come.
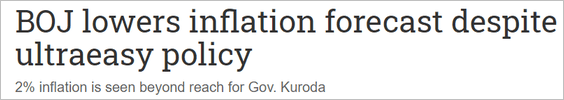 Source: Nikkei Asia Read full article
Here is Bloomberg’s take on the BoJ Monetary Policy Board.
 Source: Yuki Masujima Read full article
——————–
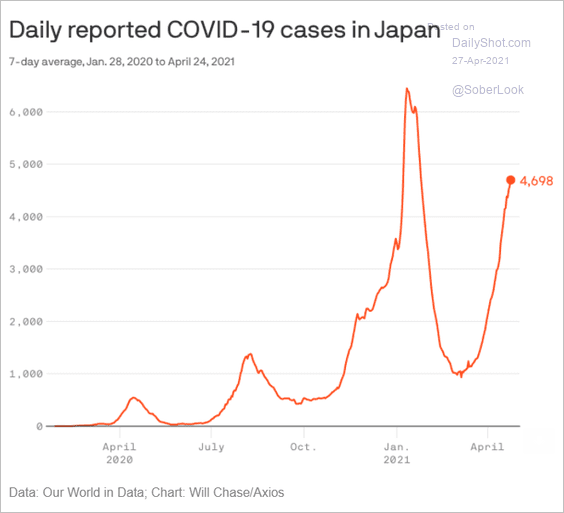
2. COVID cases in Japan are accelerating again.
 Source: @axios Read full article
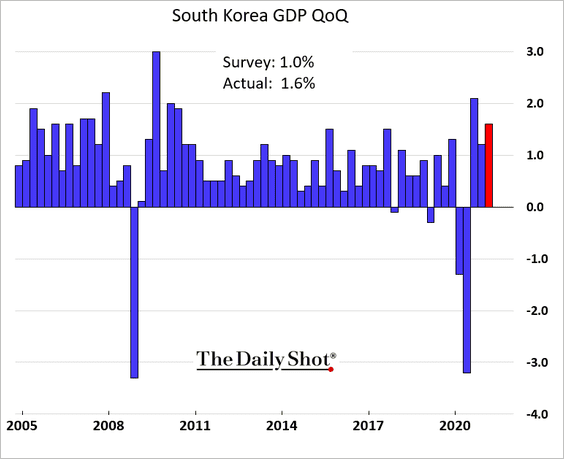
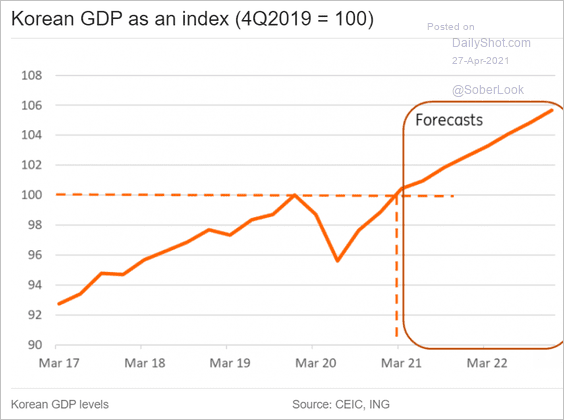
3. South Korea’s Q1 GDP topped forecasts.
Here is a projection from ING.
 Source: ING
——————–
4. This chart shows the composition of Australia’s exports to China.
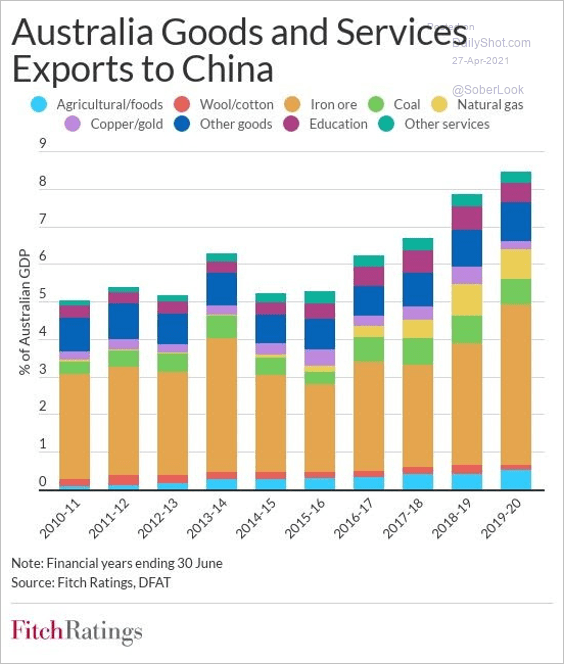 Source: Fitch Ratings
Back to Index
China
1. Real estate investment is starting to slow.
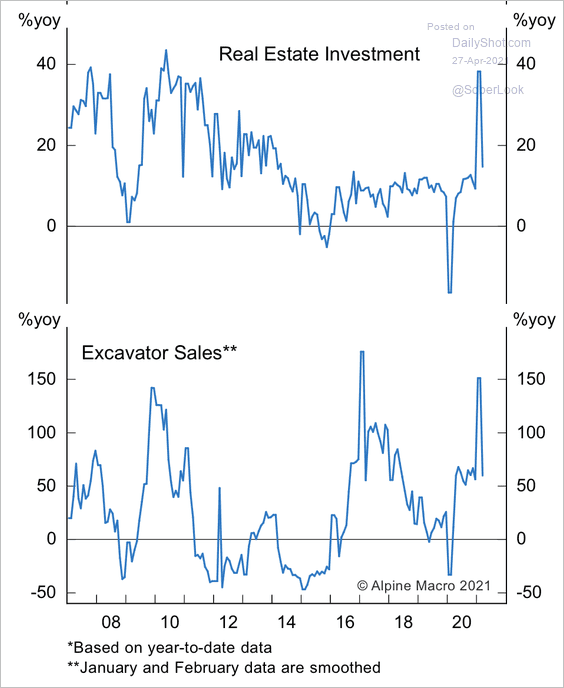 Source: Alpine Macro
2. China’s steel production hit a record high.
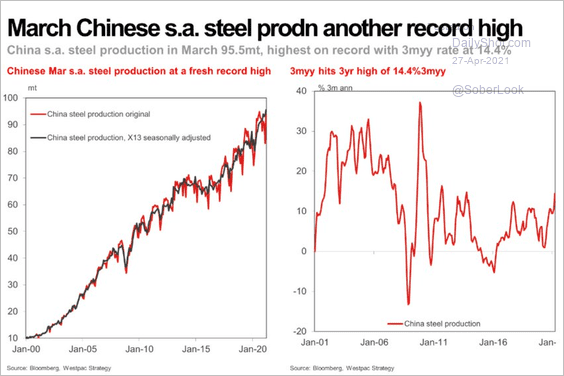 Source: Westpac; @AvidCommentator
4. Total aluminum finished product exports grew 3% year-over-year in 2020 despite the collapse in economic activity during lockdowns, according to ING.
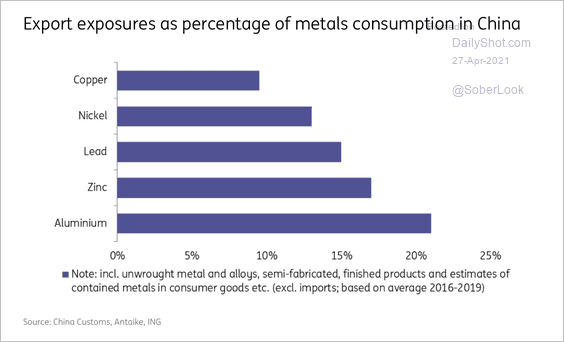 Source: ING
5. This is the Evercore ISI China Growth Index.
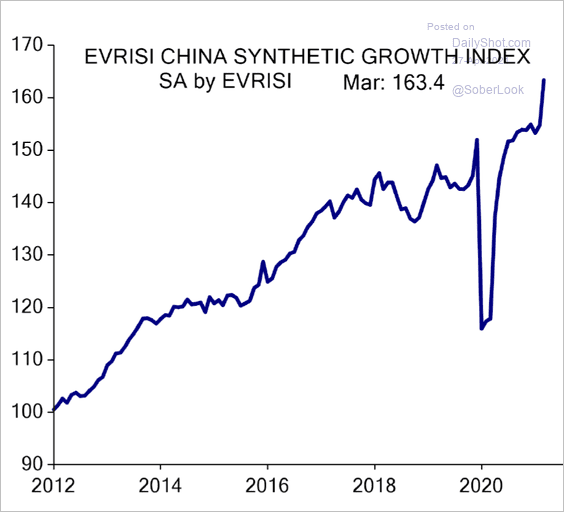 Source: Evercore ISI
Electricity generation has been running above trend.
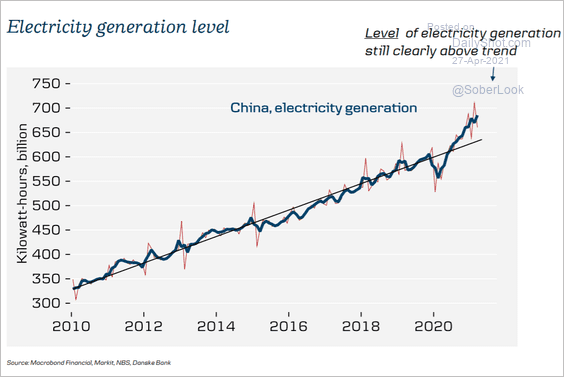 Source: Danske Bank
——————–
6. The credit impulse indicator has turned negative, which suggests slower economic growth ahead.
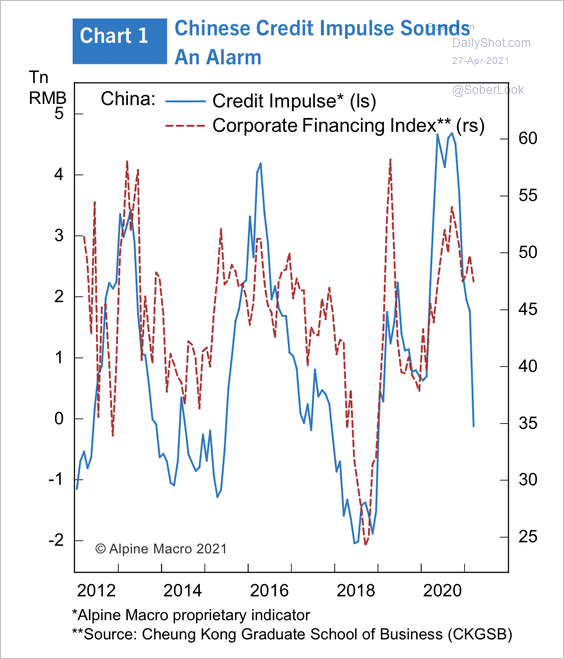 Source: Alpine Macro
Back to Index
Emerging Markets
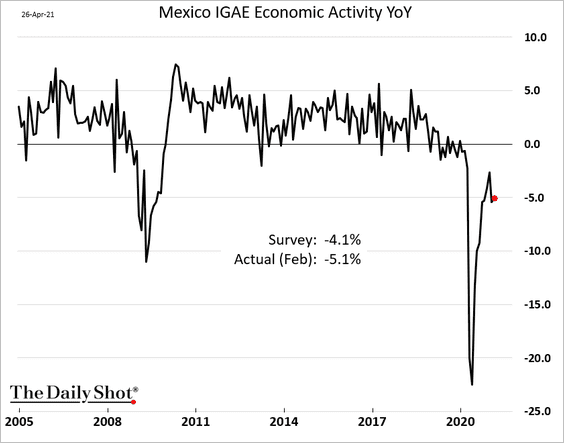
1. Mexico’s economic activity remained stagnant in February.
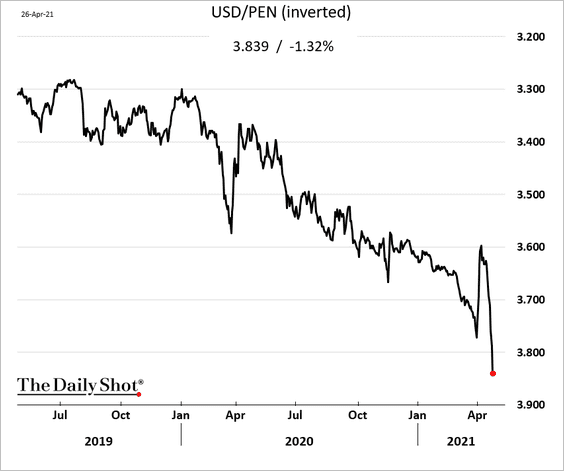
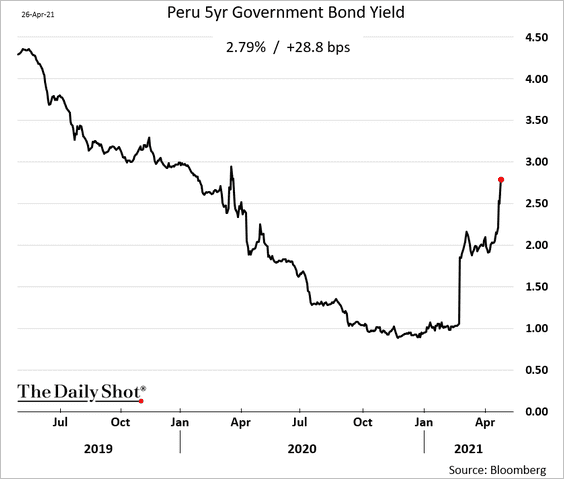
2. Peru’s assets are under pressure.
 Source: @bpolitics Read full article
• The Peruvian sol:
• The 5yr bond yield:
——————–
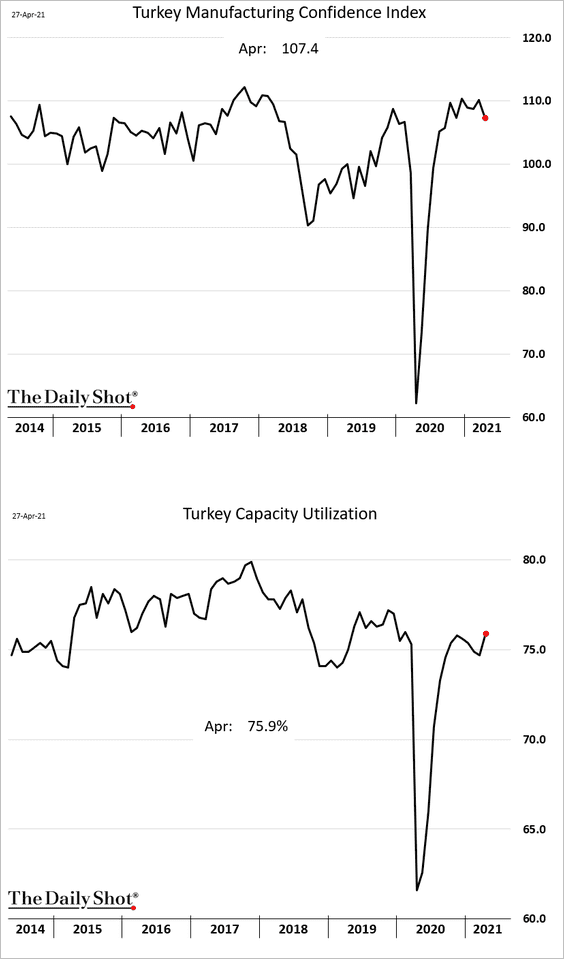
3. Turkey’s manufacturing confidence weakened this month even as capacity utilization improved.
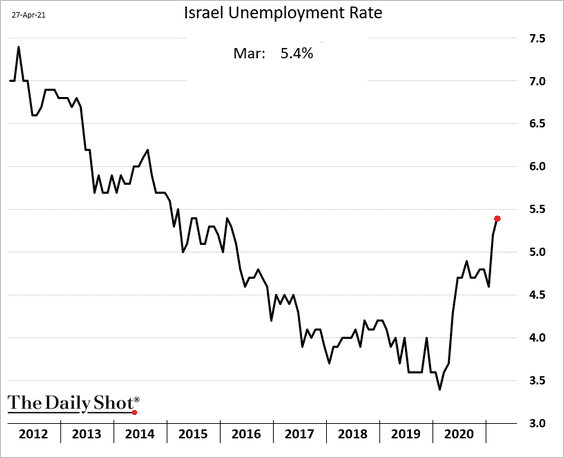
4. Israel’s unemployment rate keeps grinding higher.
5. This chart shows India’s labor force participation rates.
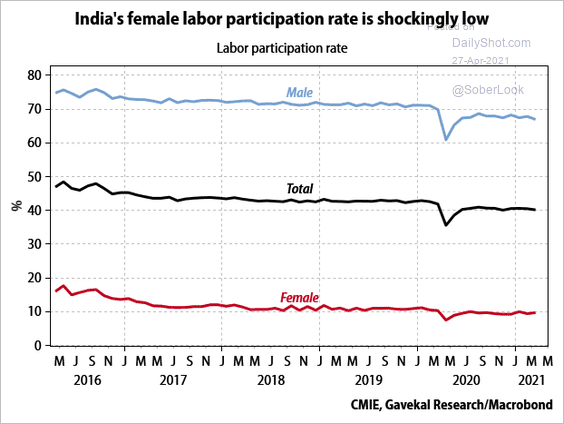 Source: Gavekal Research
Back to Index
Cryptocurrency
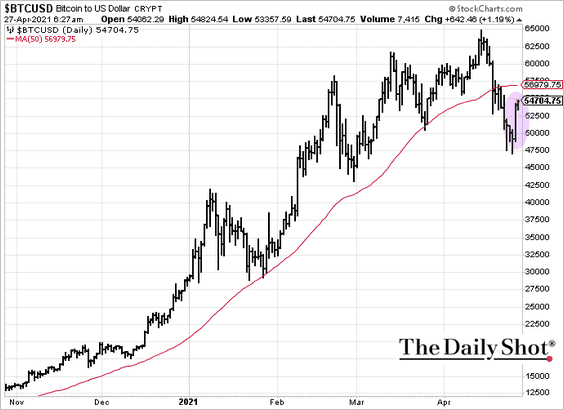
1. Bitcoin continues to recover.
2. Here is a comparison of bitcoin drawdowns vs. other currencies.
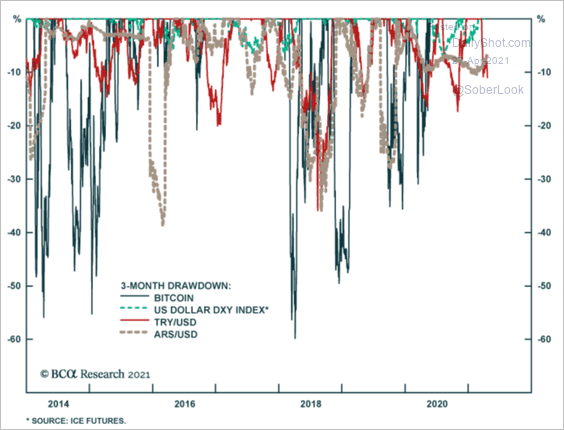 Source: BCA Research
3. How correlated are US stocks with cryptocurrencies?
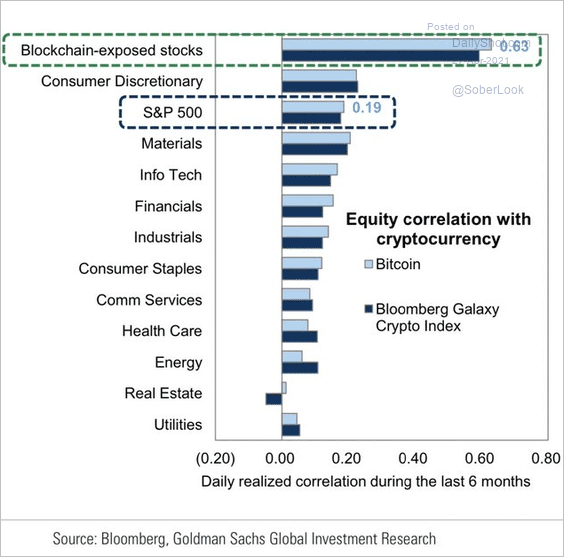 Source: Goldman Sachs; @carlquintanilla
Back to Index
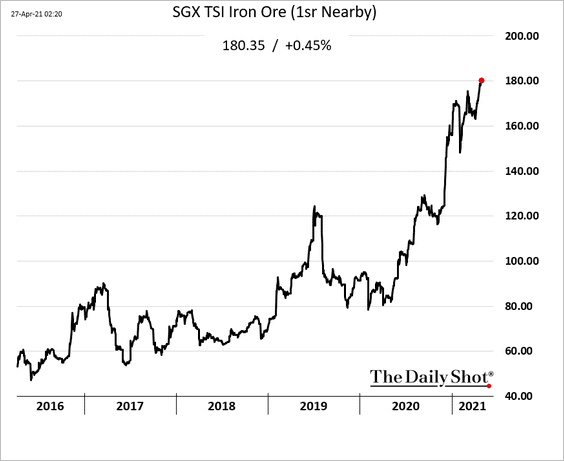
Commodities
The trends we highlighted yesterday are accelerating.
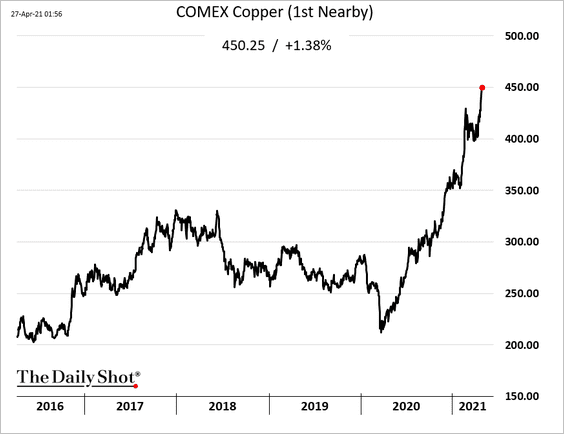
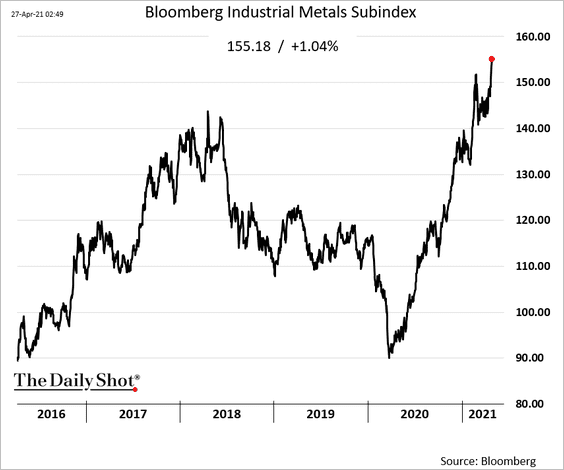
• Industrial commodities:
– Iron ore:
 Source: Reuters Read full article
– Copper:
– Bloomberg’s industrial metals index:
——————–
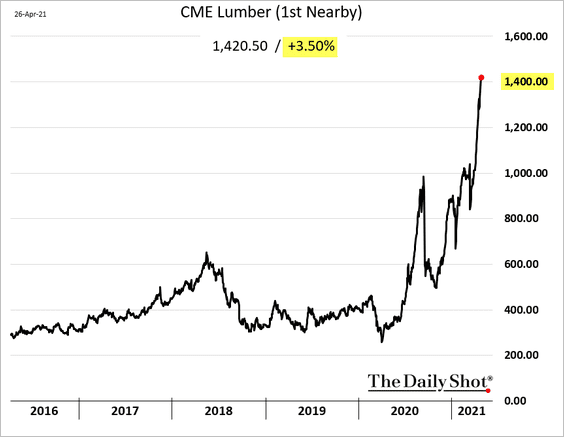
• US lumber:
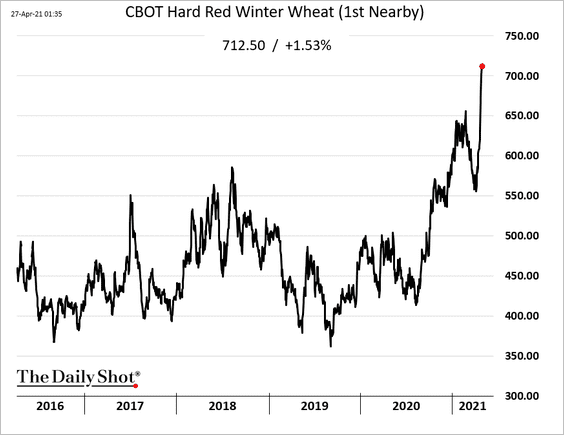
• US grains (boosted by concerns about dry weather conditions):
– Wheat:
– Corn:
 Source: @WSJ Read full article
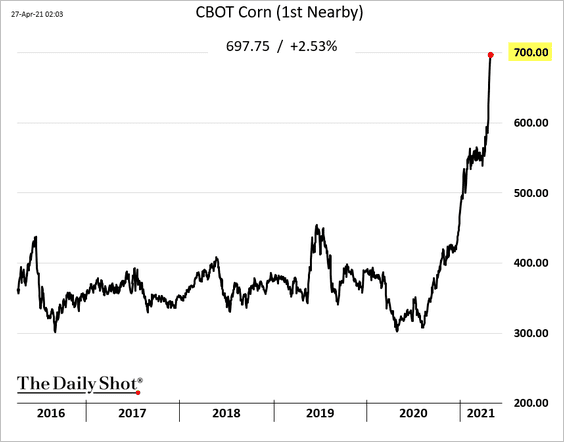
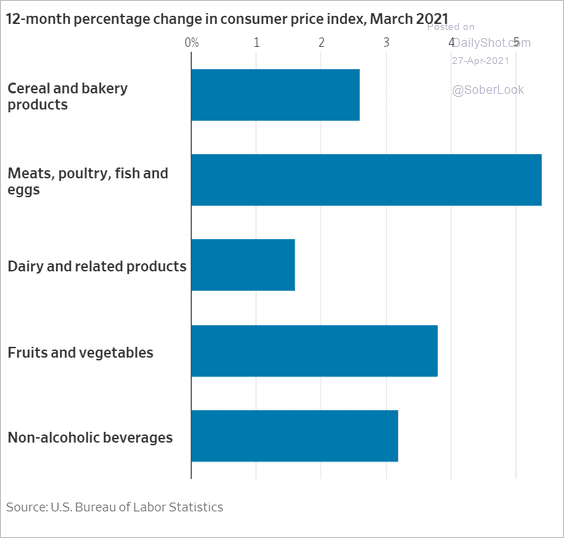
We are going to see further gains in food prices.
 Source: @WSJ Read full article
Back to Index
Energy
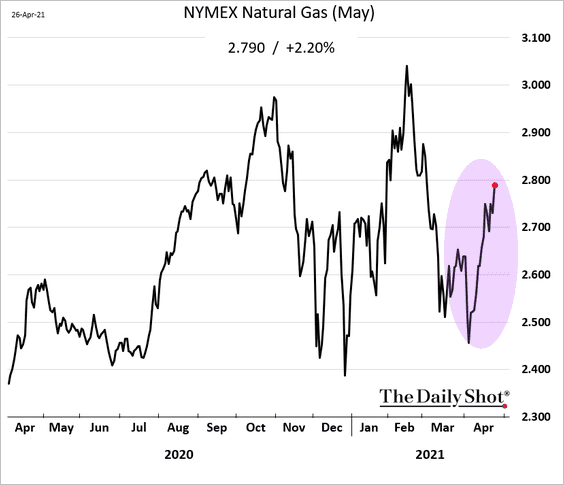
1. US natural gas is gaining amid rising LNG demand.
2. Uranium miners have been rallying. Nuclear energy may be the only viable way of meeting the aggressive emission reduction targets that are now in place.
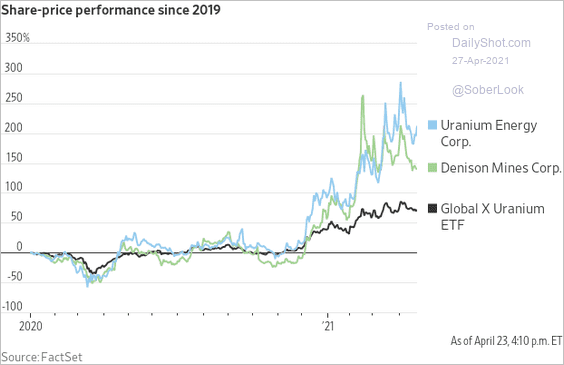 Source: @WSJ Read full article
3. This chart shows the oil price vs. days of demand.
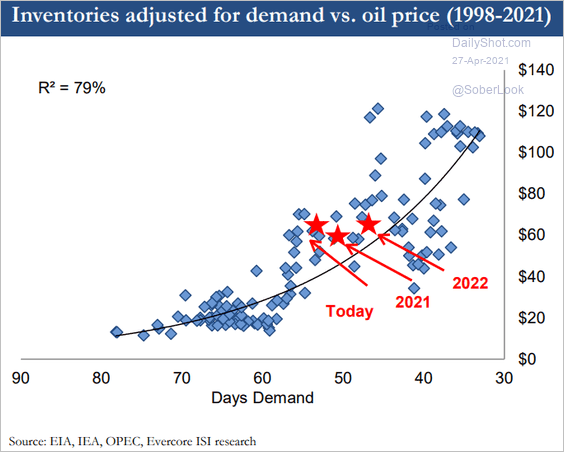 h/t Evercore ISI
Back to Index
Equities
1. BofA’s private client equity allocations hit a record high.
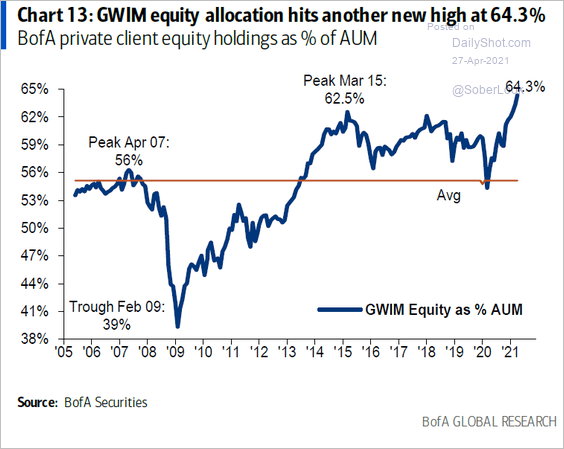 Source: BofA Global Research
Here are the private clients’ ETF flows over the past four weeks.
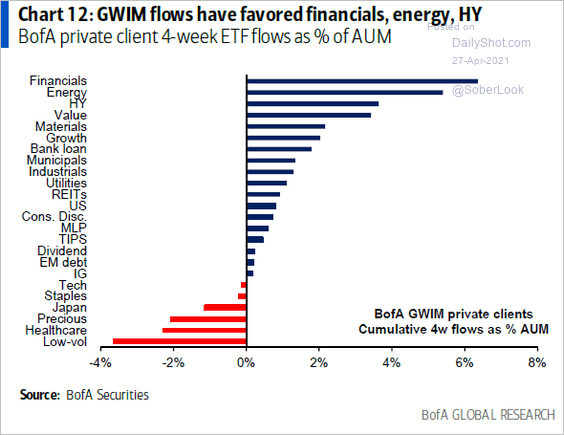 Source: BofA Global Research
——————–
2. The S&P 500 remains highly concentrated.
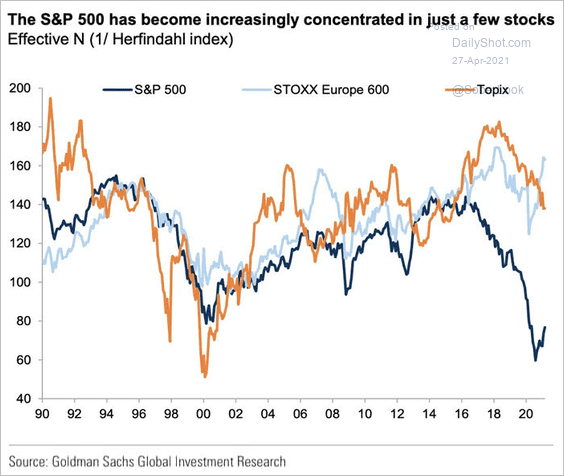 Source: @ISABELNET_SA, @GoldmanSachs
3. This chart shows how companies have been performing vs. estimates (by sector).
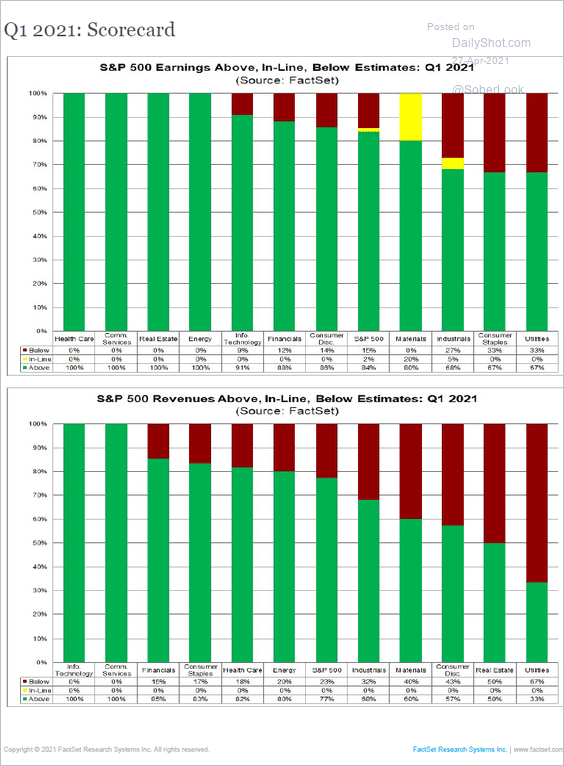 Source: @FactSet
4. This year’s surge in IPOs is on track to outpace 2020.
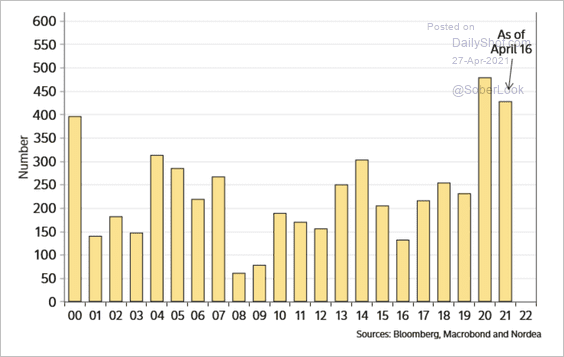 Source: Nordea Markets
5. Investors are still underweight value stocks.
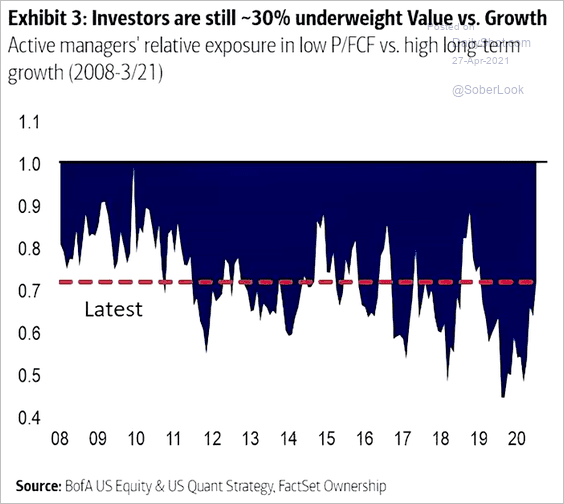 Source: @ISABELNET_SA, @BofAML
6. Capital-light businesses continue to outperform.
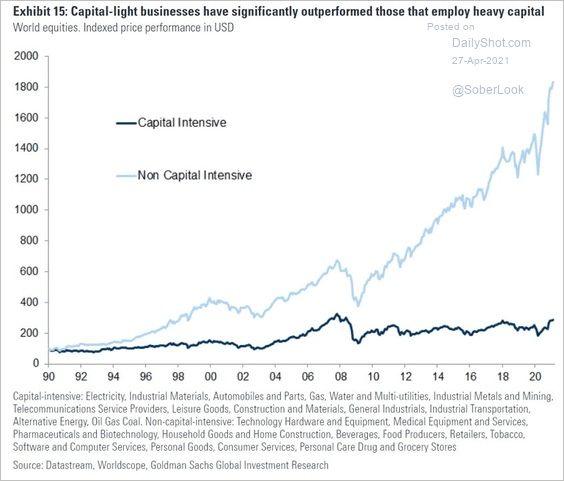 Source: Goldman Sachs; @jsblokland
Back to Index
Alternatives.
1. The tech sector is dominating private equity activity this year.
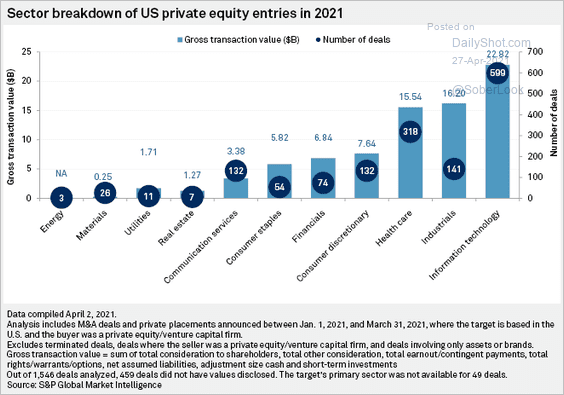 Source: S&P Global Market Intelligence
2. There is $130 billion of SPAC capital chasing private deals.
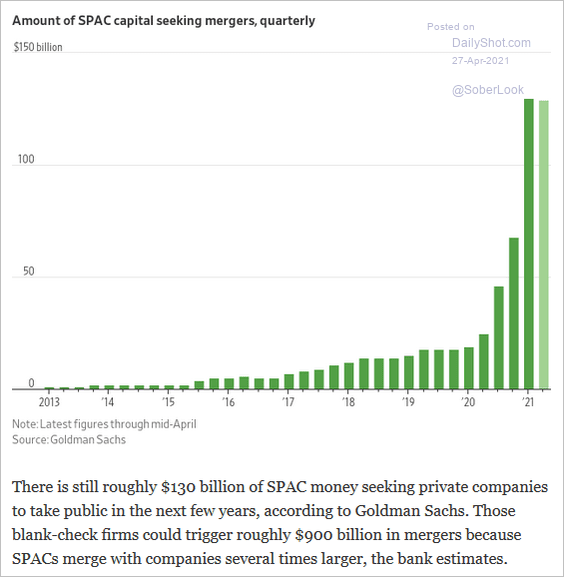 Source: @AmrithRamkumar, @WSJ
Back to Index
Rates
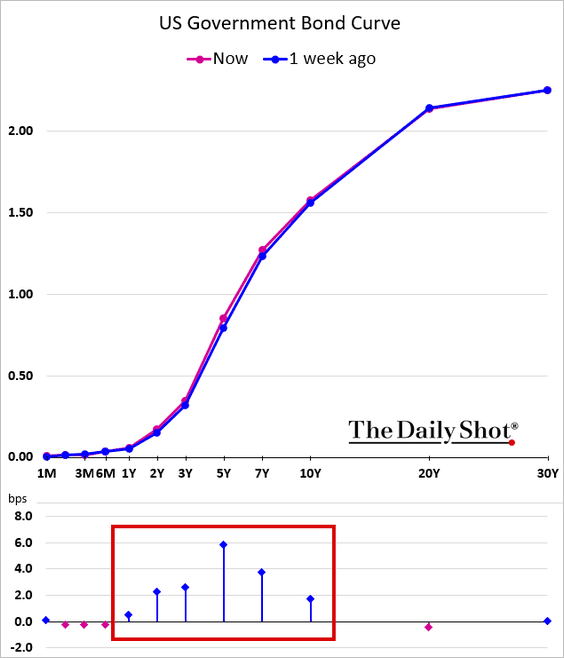
1. Short and intermediate-maturity Treasuries sold off in recent days.
2. How steep will the yield curve be a year from now?
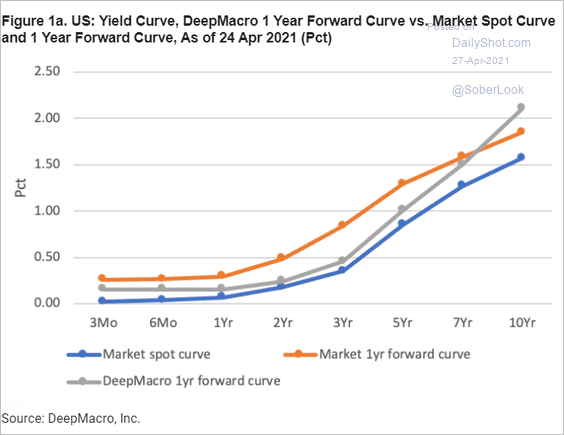 Source: @DeepMacro
3. The copper-to-gold ratio points to significantly higher Treasury yields.
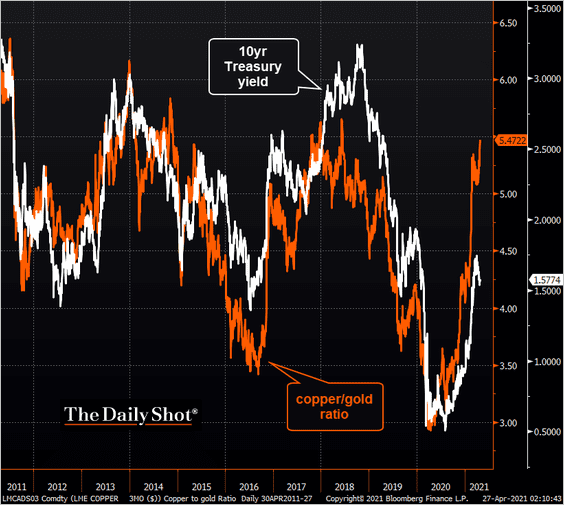 Source: @TheTerminal, Bloomberg Finance L.P.
4. The 10-year Treasury yield is finally catching up to the decline in the US economic surprise index, which peaked in July 2020.
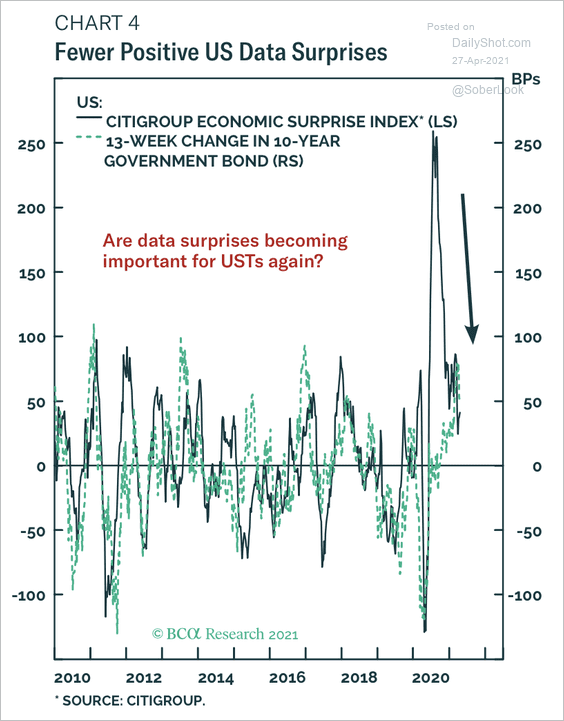 Source: BCA Research
5. Flows into short-term Treasury funds have spiked.
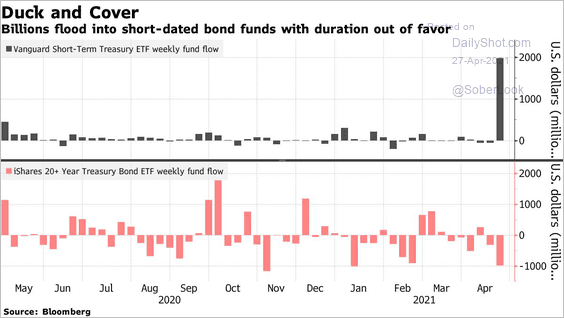 Source: Bloomberg Read full article
6. Yields typically rise materially 6-12 months before a recession/equity bear-market phase.
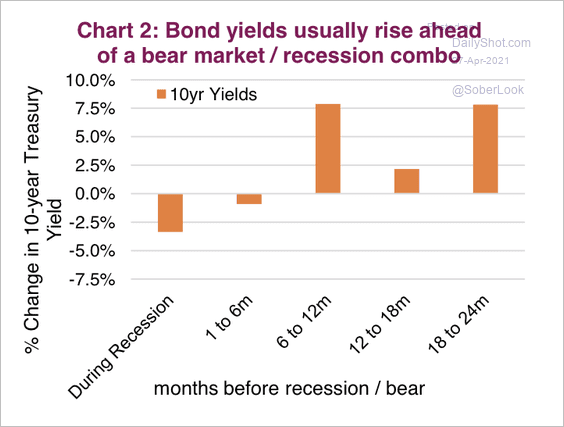 Source: Market Ethos, Richardson GMP
7. When will the Fed begin tapering?
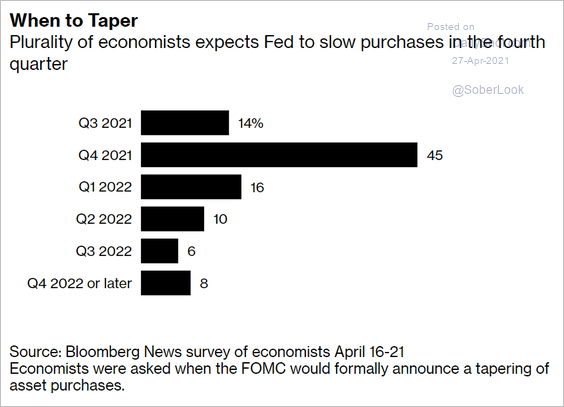 Source: Bloomberg Read full article
Back to Index
Global Developments
1. The latest global COVID surge has been driven by India.
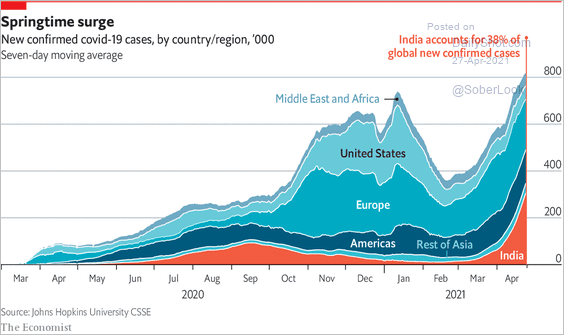 Source: The Economist Read full article
2. The outperformance of US GDP growth bodes well for the dollar.
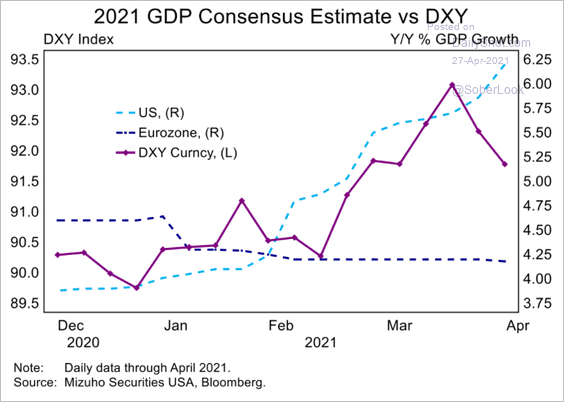 Source: Mizuho Securities USA
3. China’s slowing credit impulse points to a peak in manufacturing PMIs later this year.
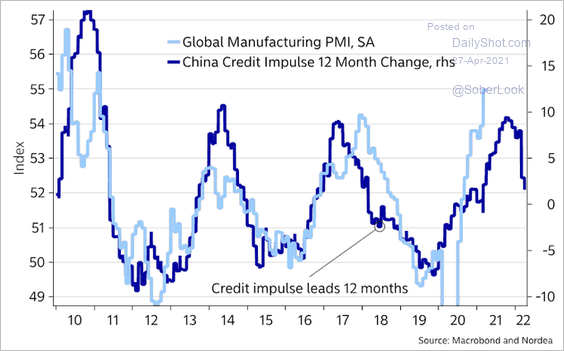 Source: @NordeaMacroLab, @AndreasSteno Read full article
Back to Index
Food for Thought
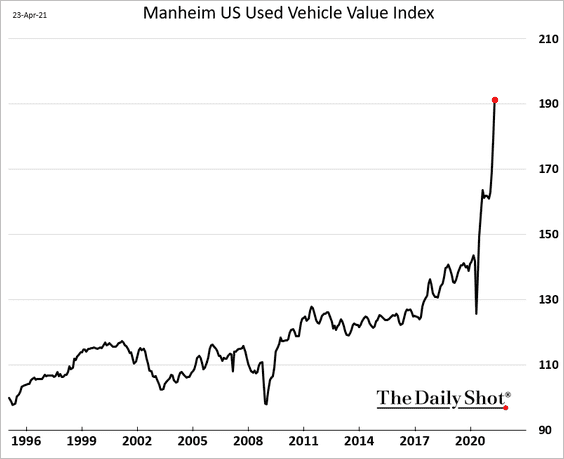
1. Used vehicle prices in the US:
2. Projected airline seat capacity:
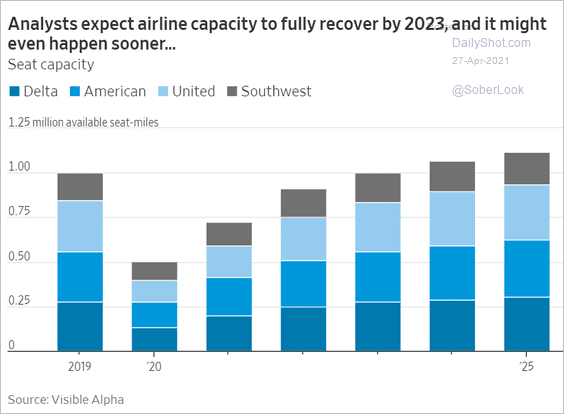 Source: @WSJ Read full article
3. Academy Awards:
 Source: Statista
4. Watching sports:
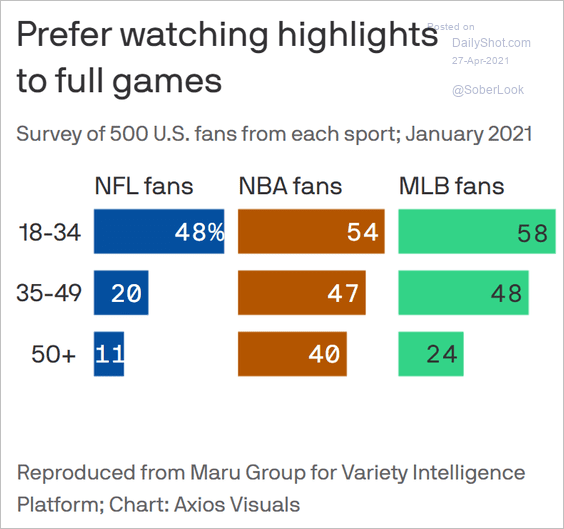 Source: @axios Read full article
5. Leaving Manhattan, but not moving too far:
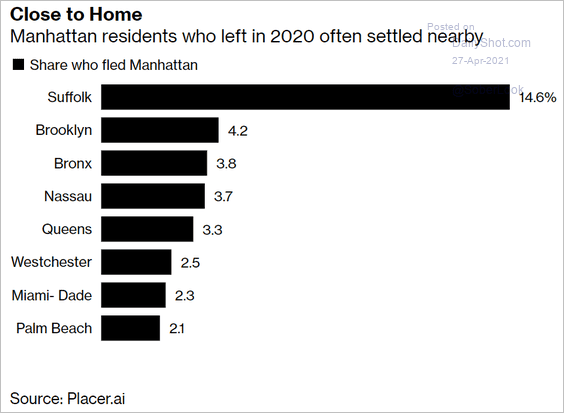 Source: Bloomberg Read full article
6. Vehicle sales by category:
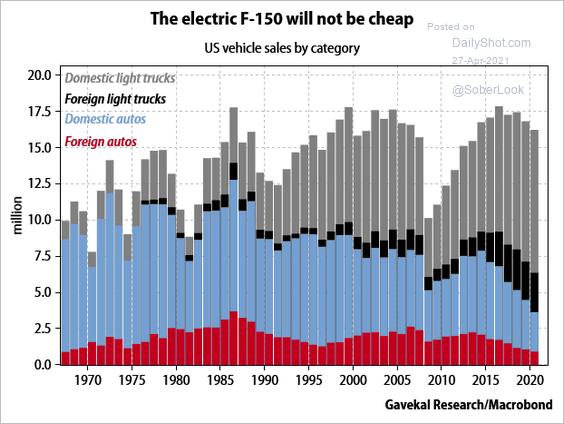 Source: Gavekal Research
7. Visiting public spaces:
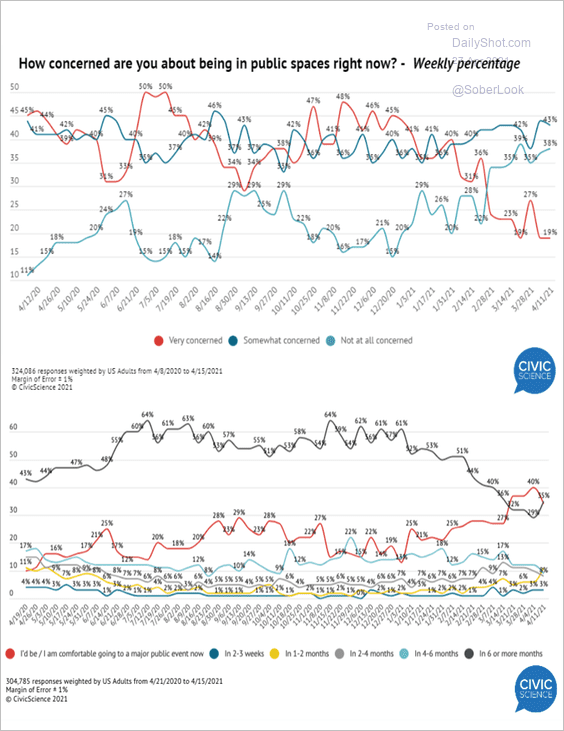 Source: CivicScience Read full article
8. Restaurant foot traffic:
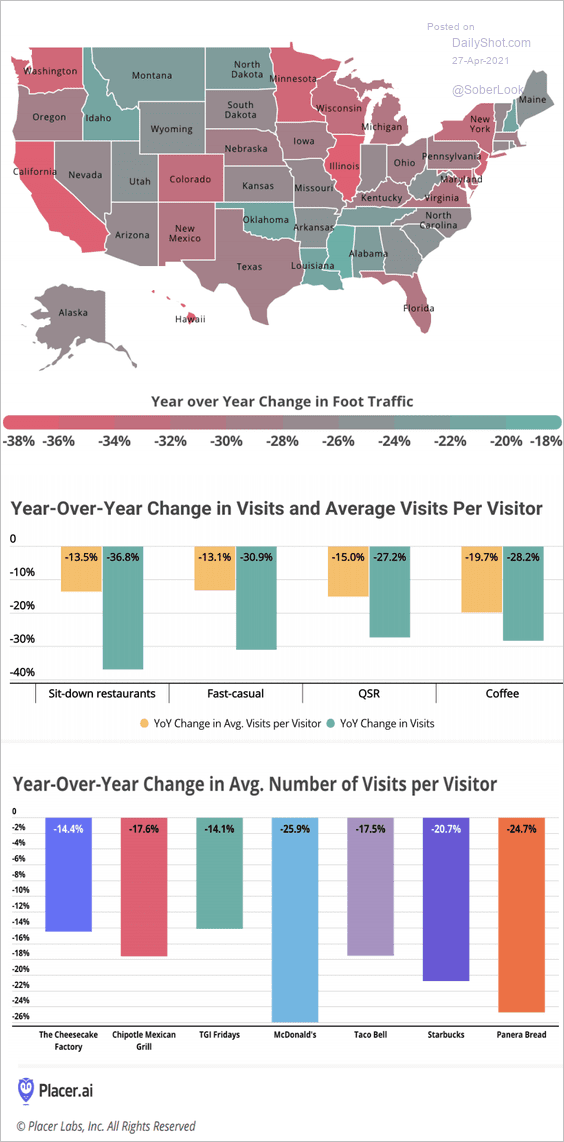 Source: Placer Labs Read full article
9. US public transit ridership:
![]() Source: @axios Read full article
Source: @axios Read full article
10. Vaccinations by country:
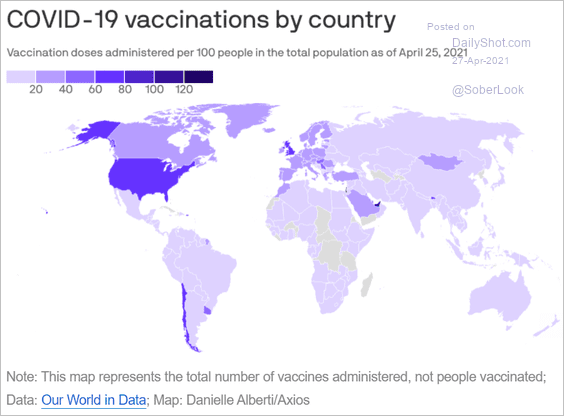 Source: @axios Read full article
11. US CEOs’ political affiliation:
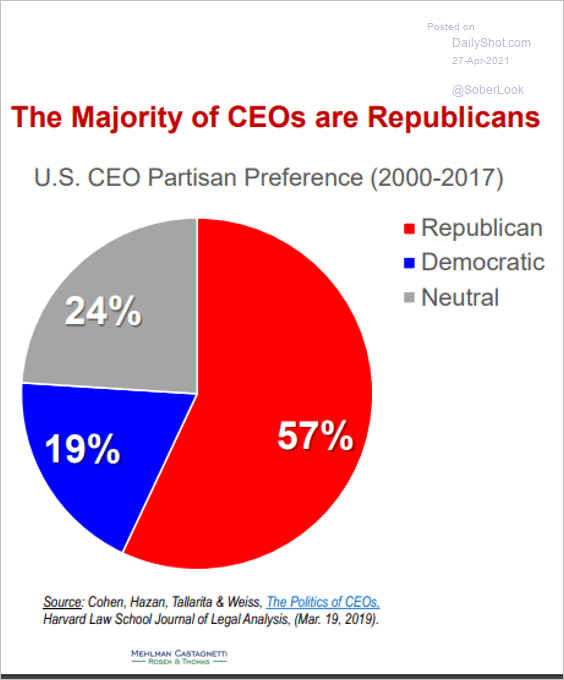 Source: MEHLMAN CASTAGNETTI ROSEN & THOMAS Read full article
12. Mozart’s grand tour of Europe (1763-1766):
 Source: Wikimedia Commons
——————–
Back to Index