
The Daily Shot: 29-Apr-21
• The United States
• Canada
• The United Kingdom
• The Eurozone
• Asia – Pacific
• China
• Emerging Markets
• Cryptocurrency
• Commodities
• Energy
• Equities
• Food for Thought
The United States
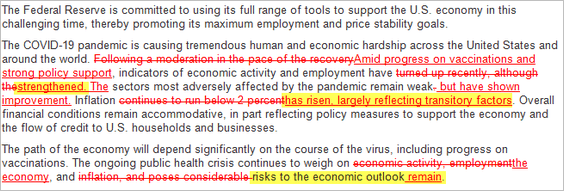
1. The Fed acknowledged economic improvements and higher inflation but sees price gains as “reflecting transitory factors.” Here are the changes from the previous FOMC statement.
 Source: @johnjhardy
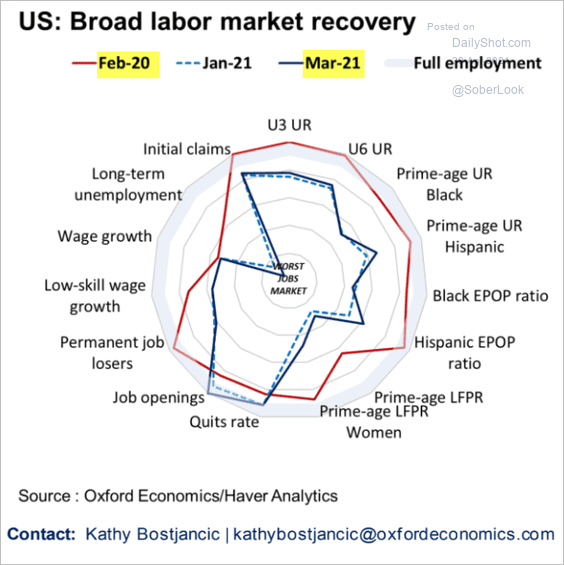
Moreover, Fed Chair Powell said that “it is not the time to start talking about tapering.” The US central bank remains extraordinarily dovish and entirely focused on the labor market recovery, especially in some vulnerable sectors.
 Source: Oxford Economics
——————–
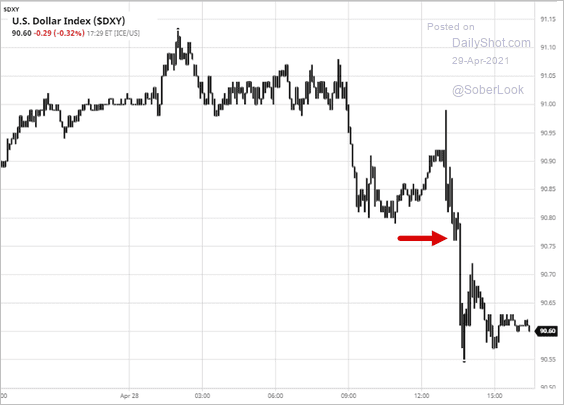
2. The market reaction was muted. The dollar weakened …
 Source: barchart.com
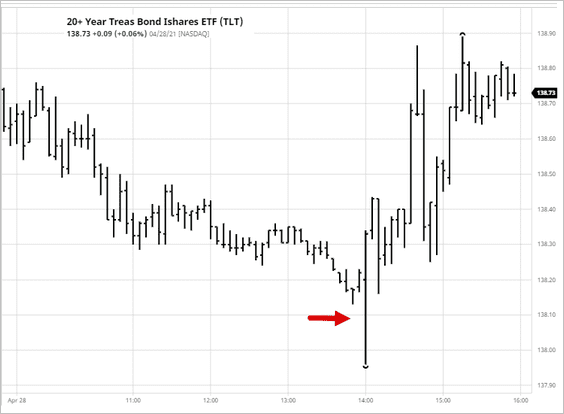
… while longer-dated Treasuries and gold gained.
 Source: barchart.com
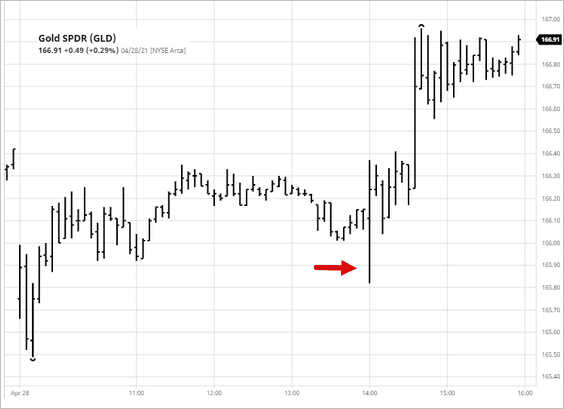 Source: barchart.com
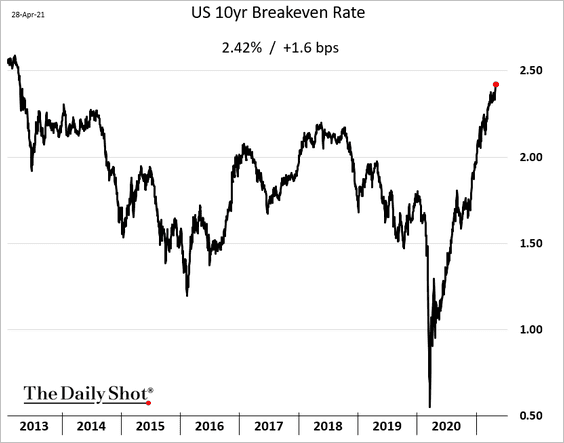
• Inflation expectations continue to grind higher.
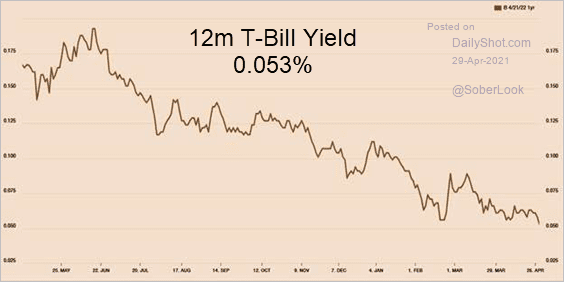
• The 12-month T-bill yield hit a record low as money markets are flooded with liquidity.
 Source: Tradeweb
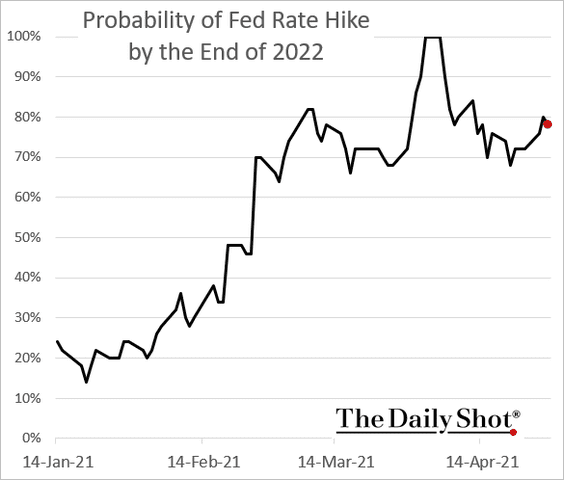
• The futures-based probability of a rate hike next year remains near 80%.
——————–
2. Wholesale inventories jumped last month.
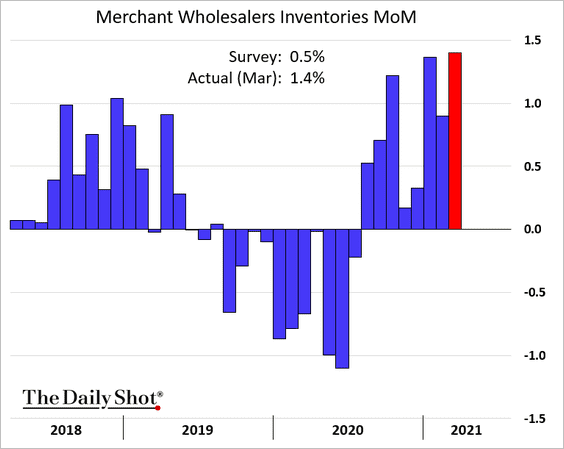
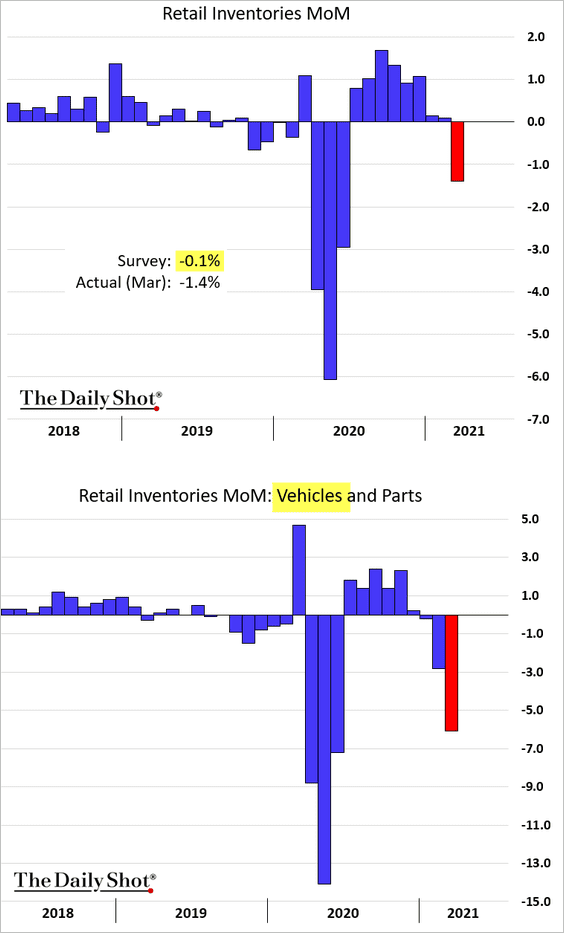
But retail inventories tumbled. Car inventories shrunk further due to chip shortages (2nd chart).
——————–
3. The trade deficit in goods hit a new record, exceeding forecasts. Trade has been a drag on the Q1 GDP growth.
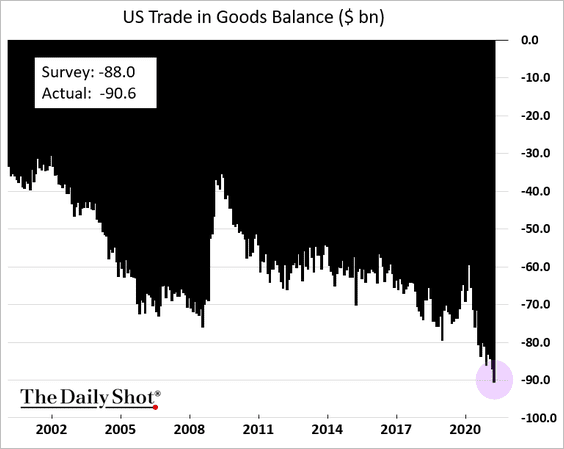
The container shipments trend shows why the trade gap keeps widening.
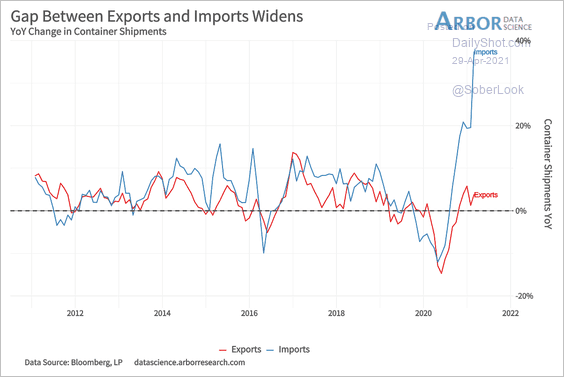 Source: Arbor Research & Trading
——————–
4. The US dollar is getting mixed signals.
• US GDP outperformance bodes well for the dollar.
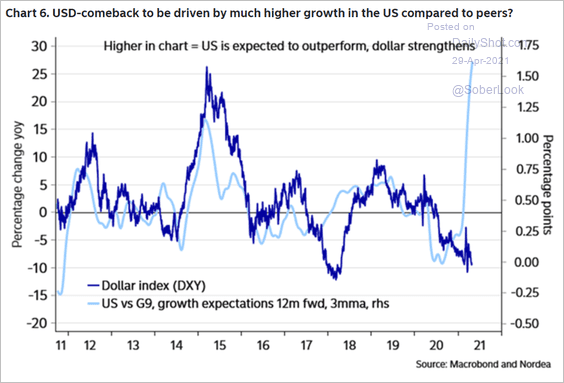 Source: Nordea Markets
• Massive government stimulus and the twin deficits, on the other hand, point to a weaker greenback.
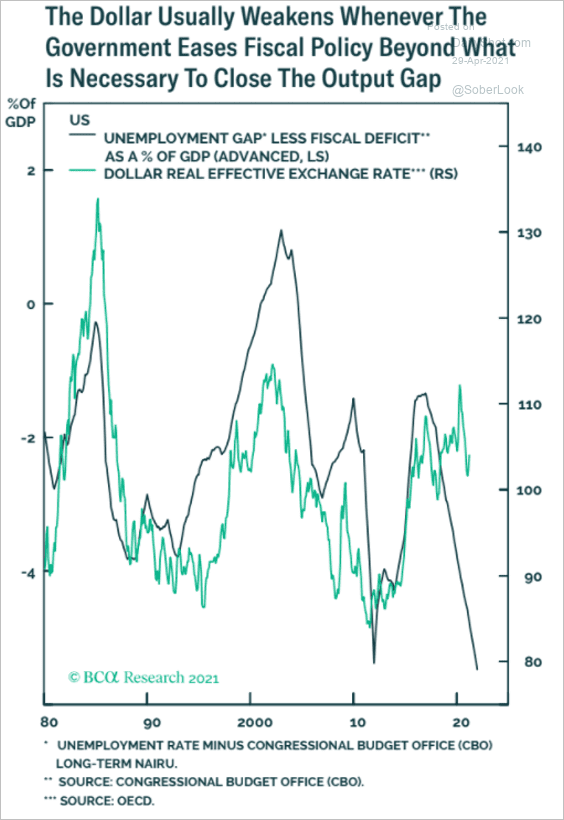 Source: BCA Research
——————–
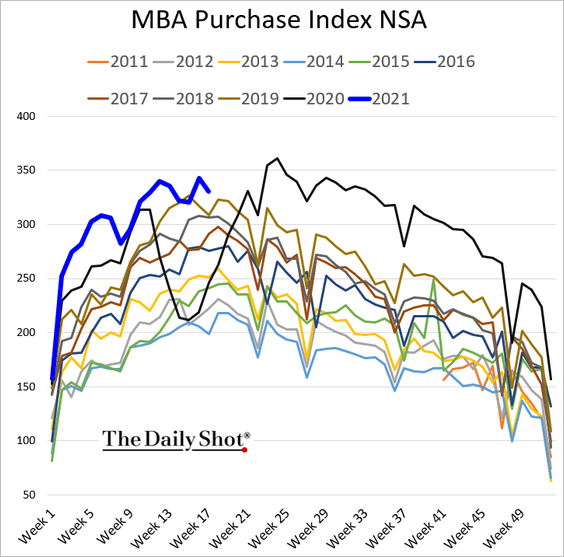
5. Next, we have some updates on the housing market.
• House purchase loan applications remain robust, but there has been some loss of momentum.
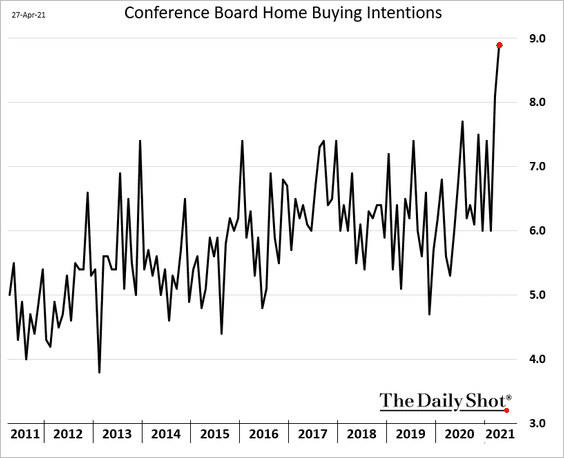
• The Conference Board’s home buying intentions index has been rising.
• Housing inventories are shrinking across all price tiers.
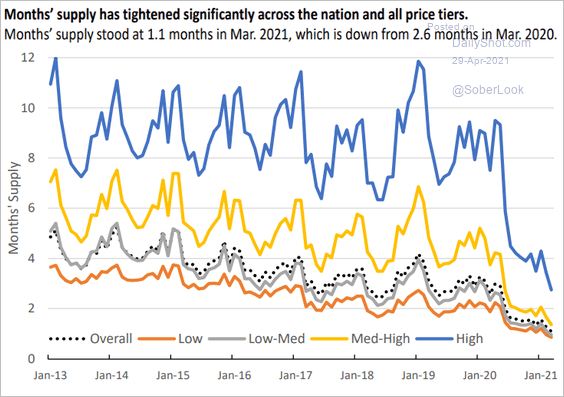 Source: Edward Pinto, Tobias Peter, AEI Housing Center
• Most metro areas see rapid price gains.
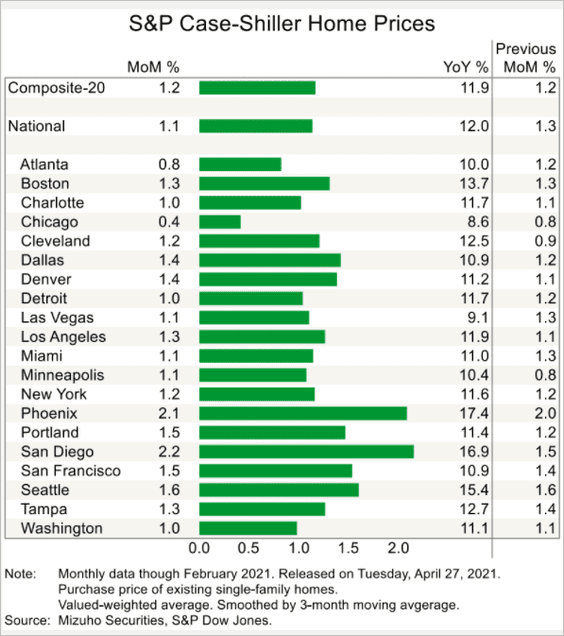 Source: Mizuho Securities USA
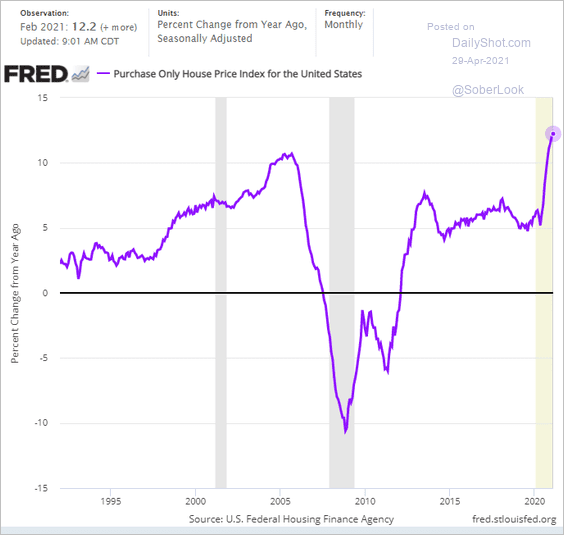
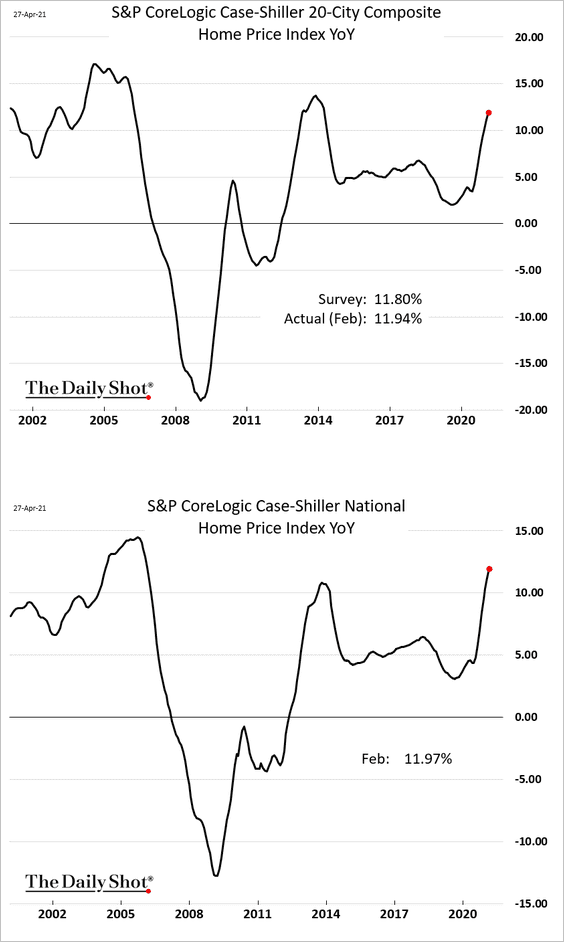
• At the national level, we continue to see faster (double-digit) price appreciation.
– FHFA:
– Case-Shiller:
– Transaction (sales) prices:
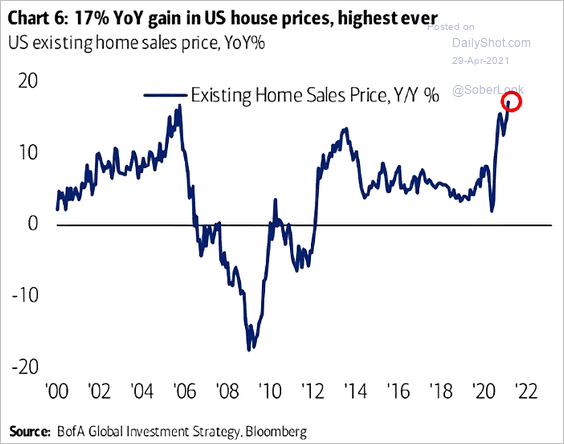 Source: @ISABELNET_SA, @BofAML
– AEI Housing Center:
 Source: Edward Pinto, Tobias Peter, AEI Housing Center
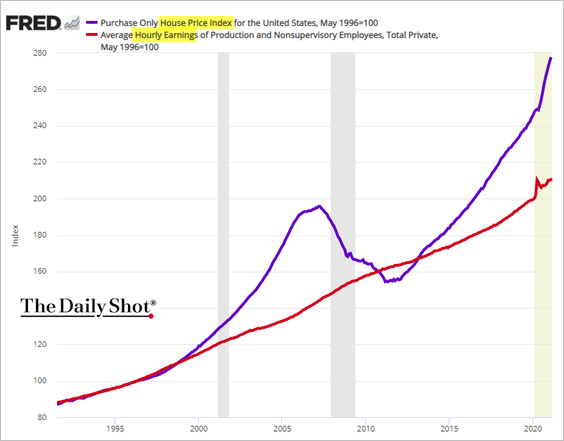
• Home prices continue to outpace wages.
Back to Index
Canada
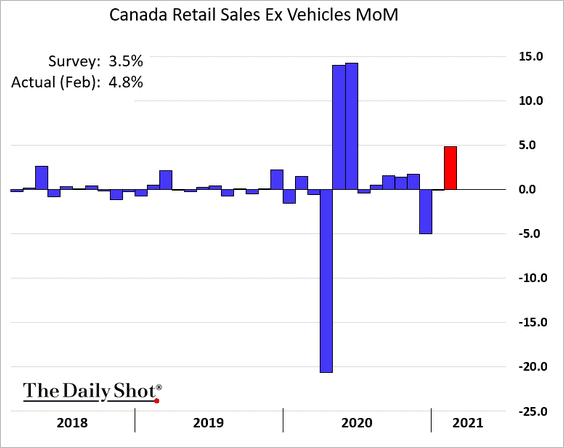
1. Retail sales rebounded in February.
2. On some metrics, housing market tightness is more severe now than in 2016-2017.
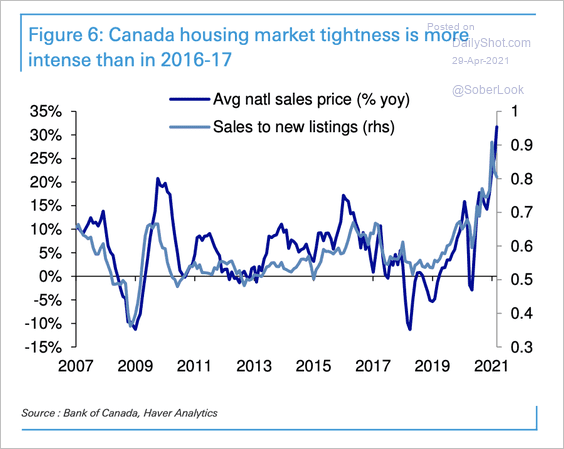 Source: Deutsche Bank Research
3. The Oxford Economics Recovery Tracker has been trending lower.
![]() Source: Oxford Economics
Source: Oxford Economics
Back to Index
The United Kingdom
1. Credit availability increased in Q1 and is projected to climb further in Q2.
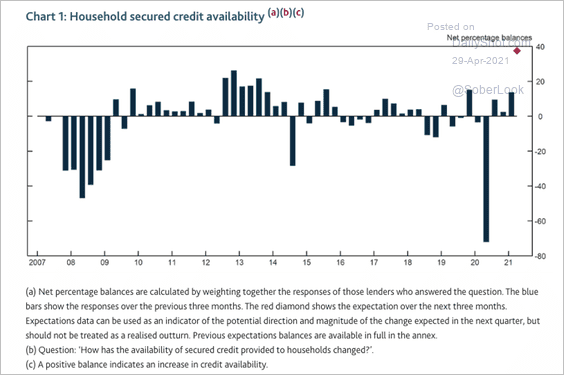 Source: BOE Read full article
Demand for secured lending for housing fell in Q1 but is expected to recover.
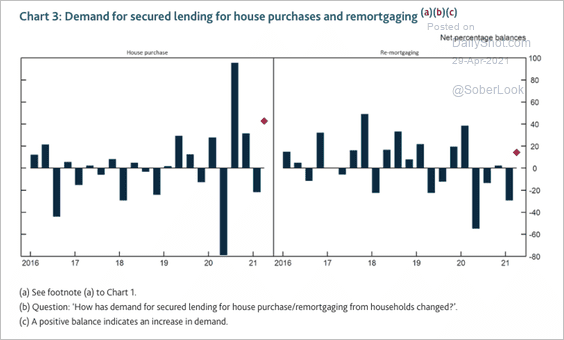 Source: BOE Read full article
——————–
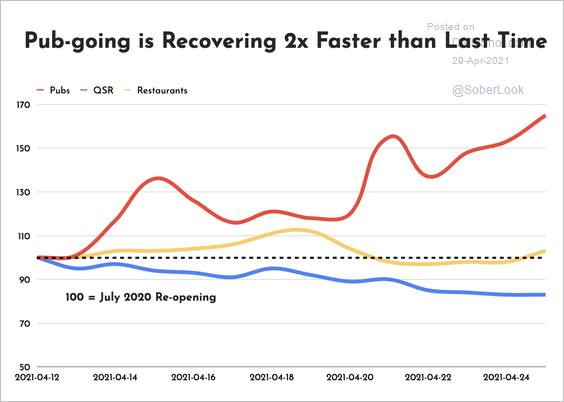
2. Back to the pubs …
 Source: Huq Read full article
3. The British public supports “green” taxes.
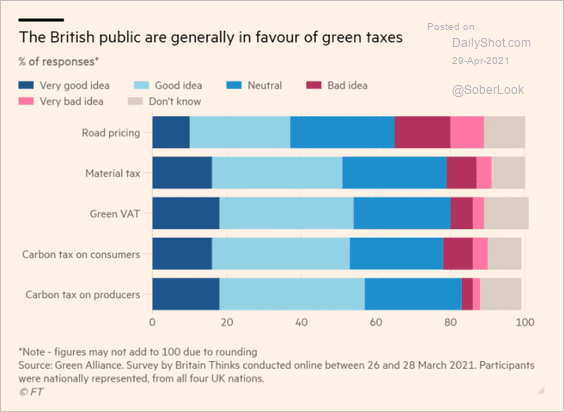 Source: @financialtimes Read full article
Back to Index
The Eurozone
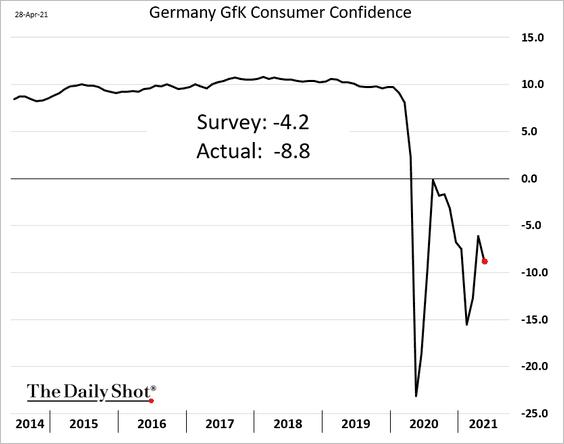
1. Let’s begin with Germany.
• Consumer confidence remains depressed.
• Policy uncertainty has been trending higher.
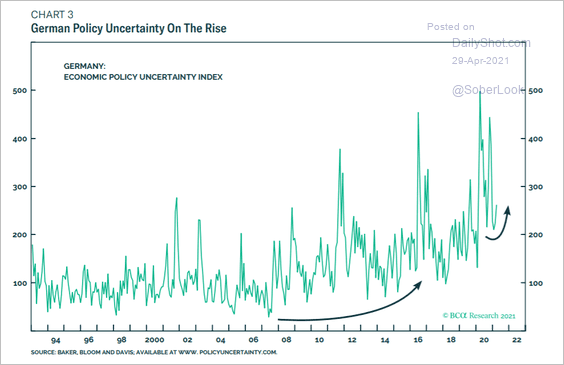 Source: BCA Research
• Short-time work programs “saved the day.”
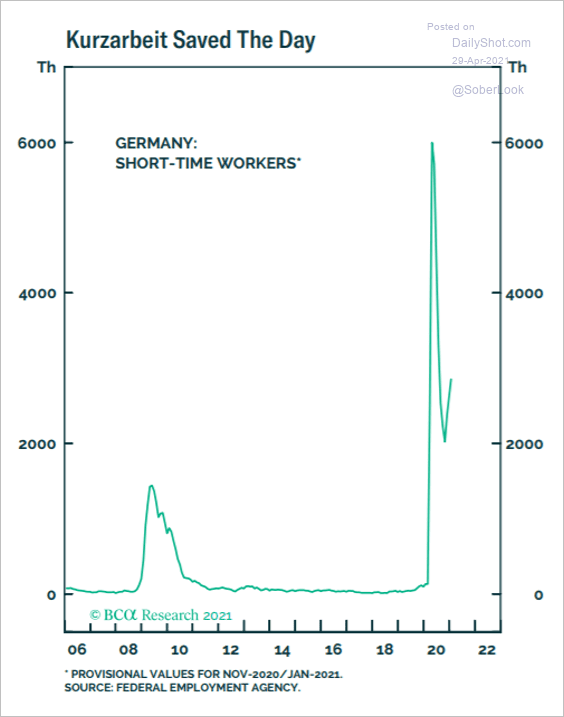 Source: BCA Research
• Germany’s yield curve remains much flatter than in the UK.
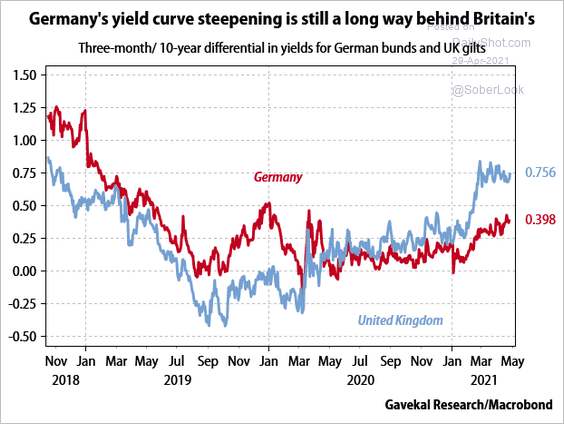 Source: Gavekal Research
——————–
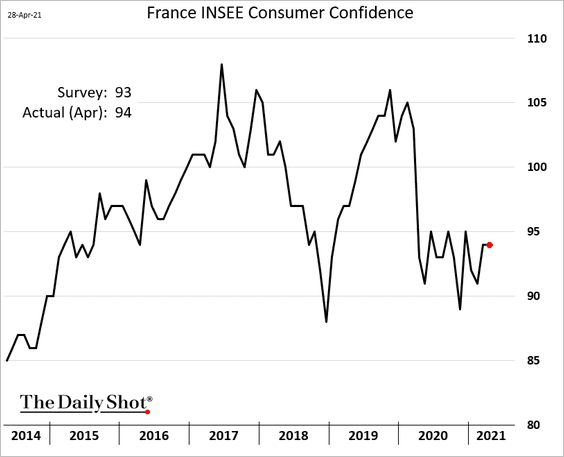
2. French consumer confidence held steady this month.
3. Mortgage lending in Spain continues to deteriorate.

Back to Index
Asia – Pacific
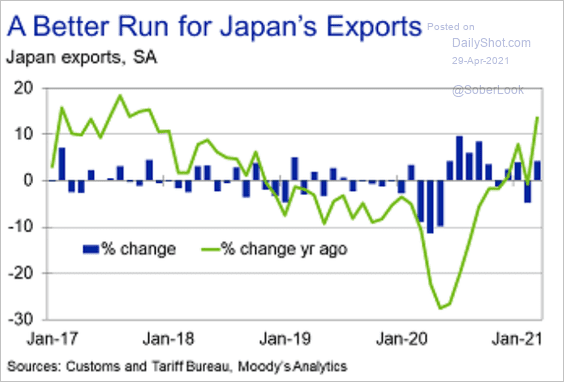
1. Japan’s exports have been recovering.
 Source: Moody’s Analytics
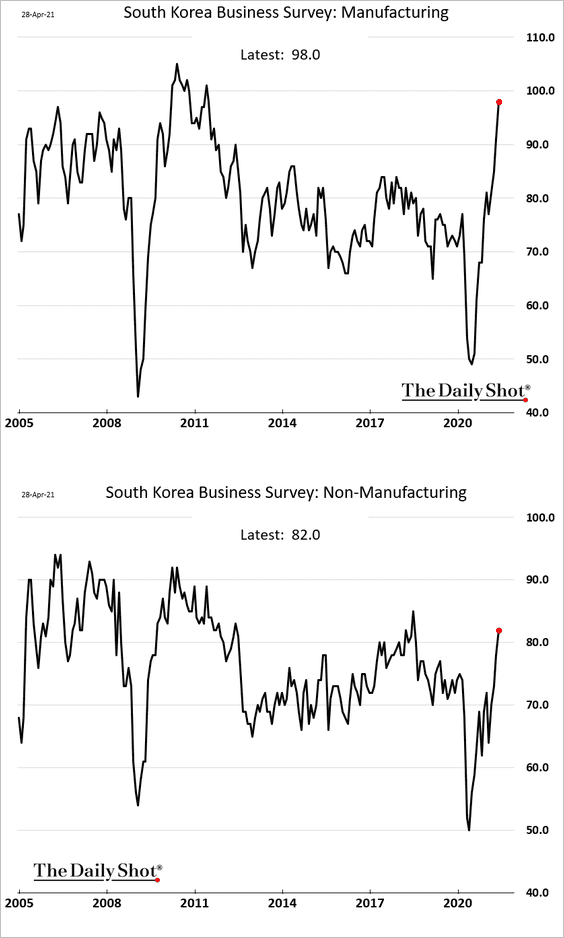
2. South Korea’s company surveys point to a strong rebound in business activity.
Back to Index
China
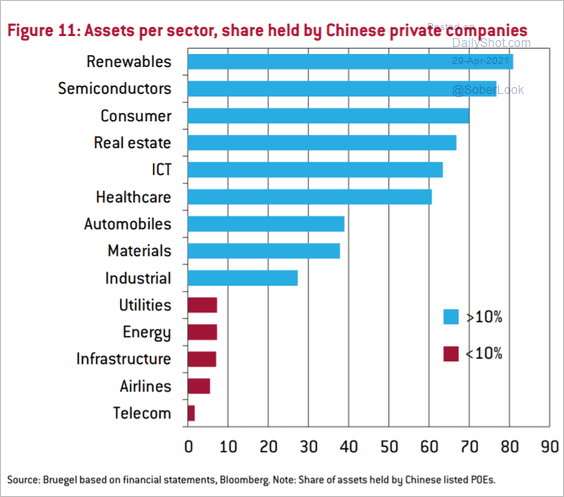
1. This chart shows the share of assets held by China’s private companies.
 Source: Bruegel Read full article
2. The industrial cycle appears to have peaked in Q1.
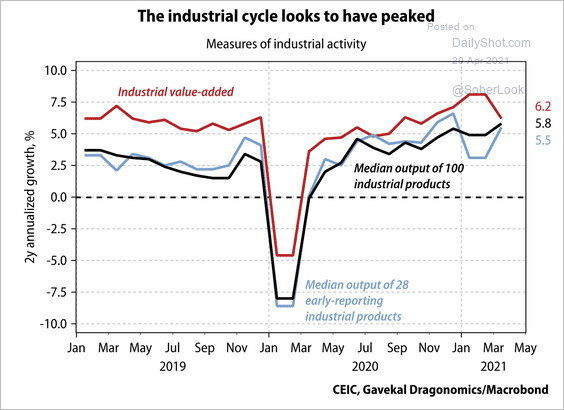 Source: Gavekal Research
3. Hong Kong’s office rents have been falling since 2019.
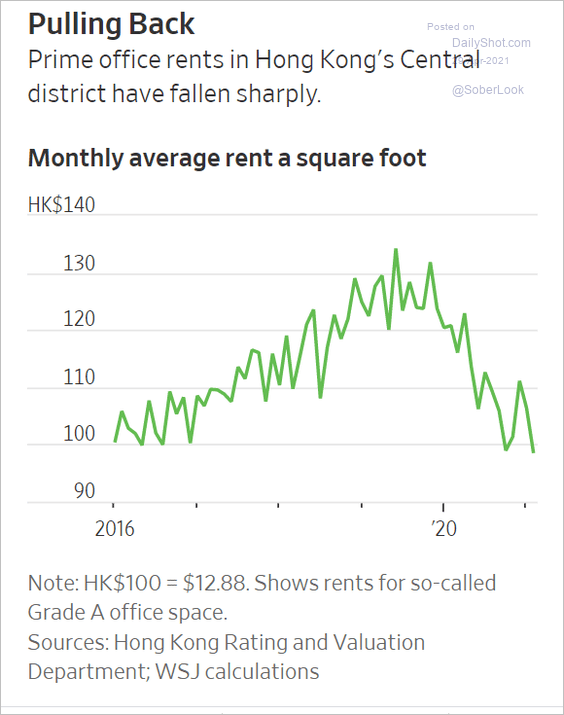 Source: @WSJ Read full article
Back to Index
Emerging Markets
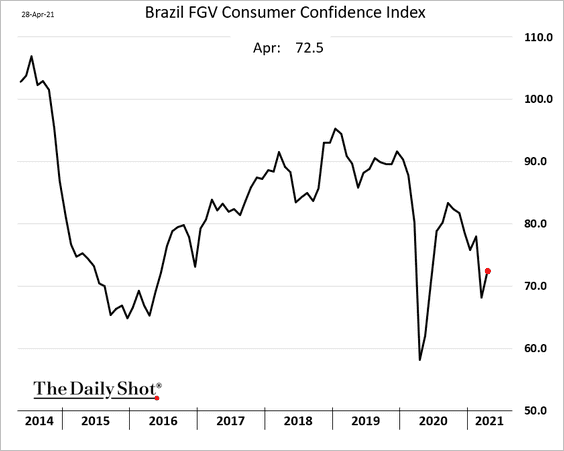
1. Let’s begin with Brazil.
• Consumer confidence is still soft.
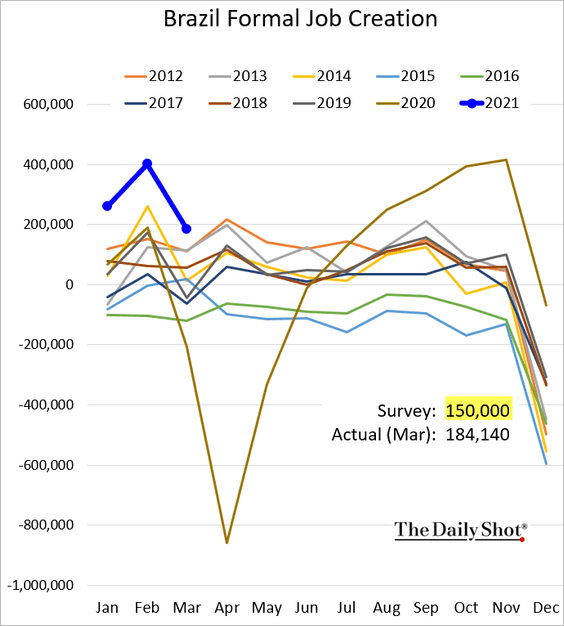
• Last month’s job creation topped forecasts.
• The real continues to strengthen as USD/BRL broke below the 200-day moving average.
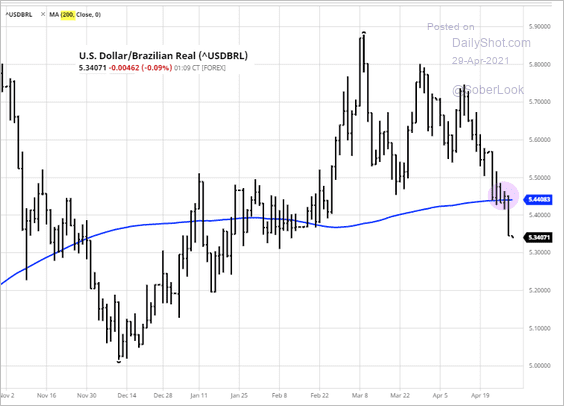 Source: barchart.com
——————–
2. Next, we have some updates on India.
• The World Economics SMI shows deterioration in business activity this month.
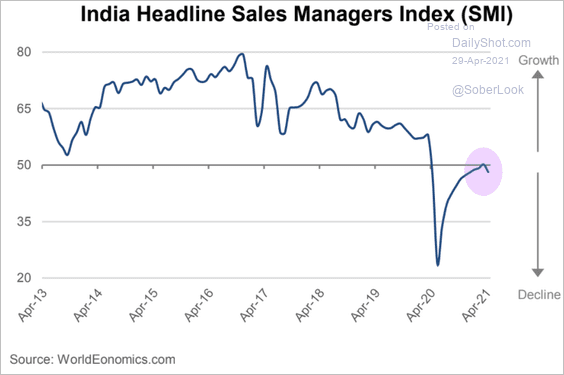 Source: World Economics
• Foreign ownership of India’s stocks has peaked for now.
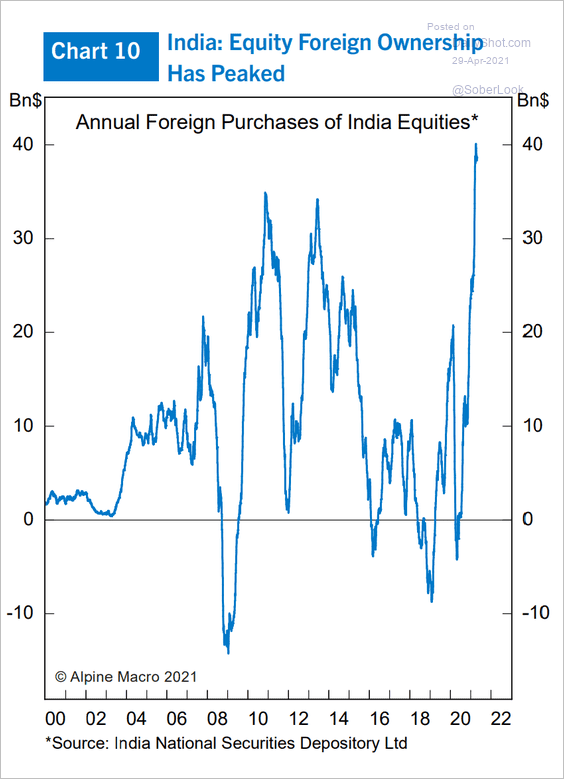 Source: Alpine Macro
• The fiscal situation has worsened substantially.
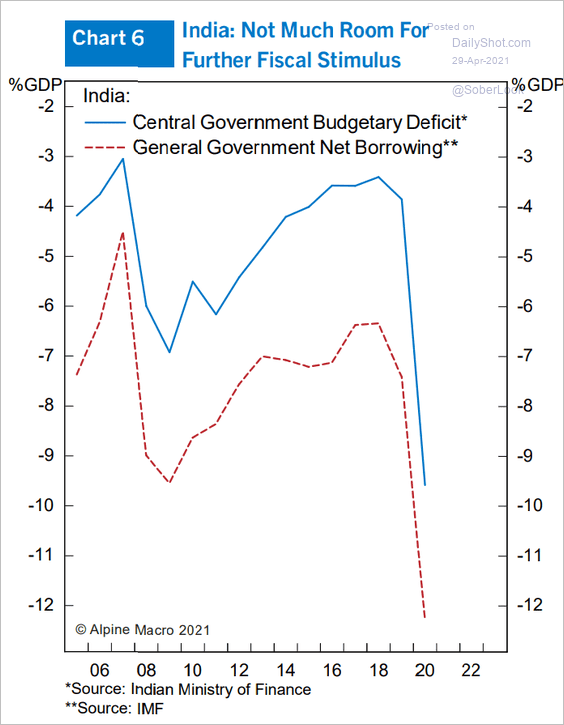 Source: Alpine Macro
• Black-market prices for COVID-related products surged in recent weeks.
 Source: Statista
——————–
3. Vietnam’s trade unexpectedly shifted into deficit this month.

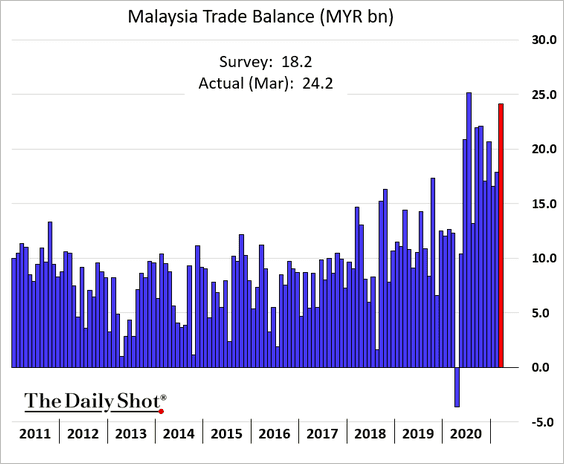
4. Malaysia’s trade surplus is near the highs.
5. IIF expects government debt-to-GDP ratios to stabilize across EM regions except for EM Asia.
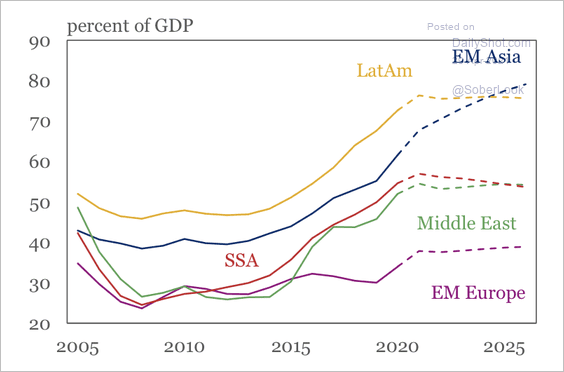 Source: IIF
EM sovereign debt risk has eased back to pre-pandemic levels.
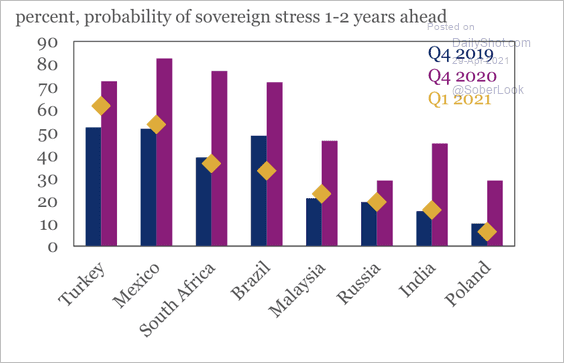 Source: IIF
Back to Index
Cryptocurrency
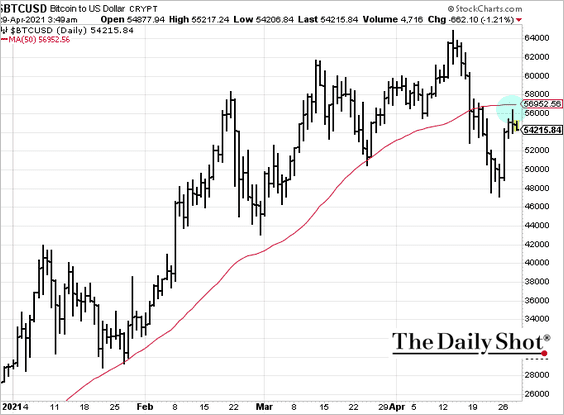
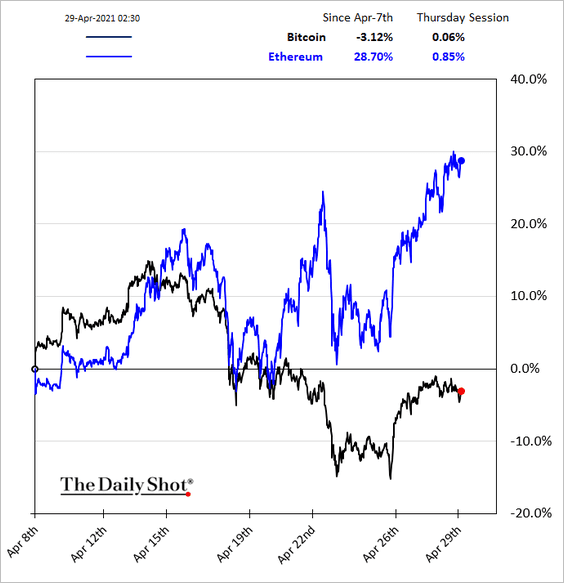
1. Bitcoin held resistance at the 50-day moving average.
2. A more resilient bid for Ether (ETH) futures during the recent crypto sell-off has allowed for a more rapid price recovery in ETH versus bitcoin (BTC), according to JPMorgan.
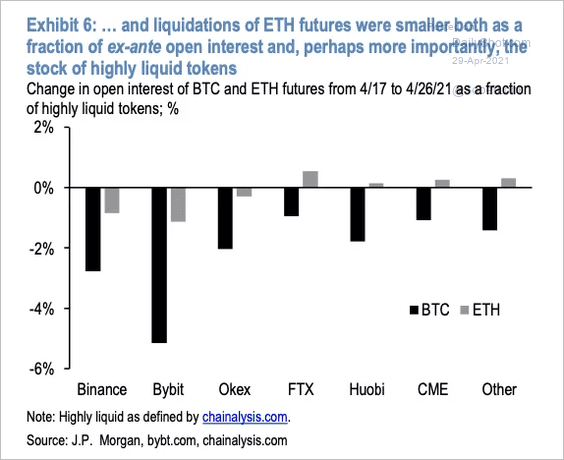 Source: JP Morgan Read full article
——————–
3. According to Alpine Macro, if the US economy were priced in bitcoin terms, the country’s entire GDP would be worth about 500 million coins. Given bitcoin’s supply cap at 21 million, the US economy would need to deflate by 95% if BTC were used as a standard currency.
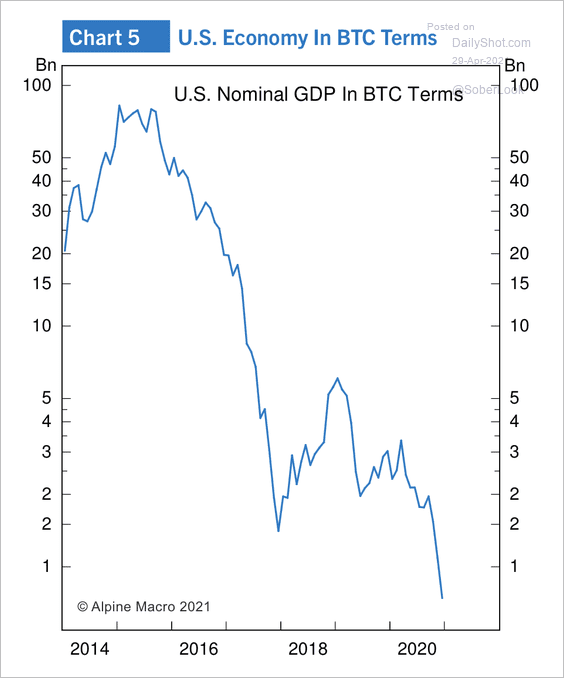 Source: Alpine Macro
4. Blockchain and cryptocurrency-related stocks have outperformed the S&P 500 this year.
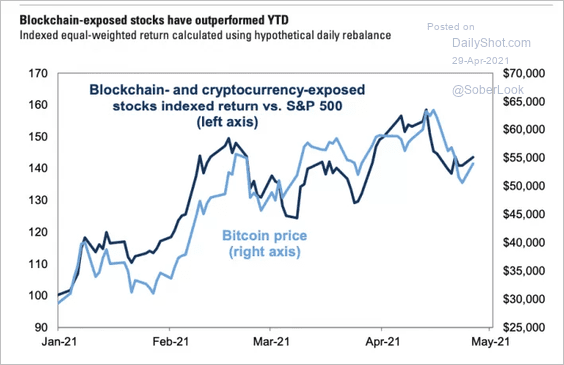 Source: Goldman Sachs Read full article
5. Will a reduction in the Fed’s balance sheet trigger a bitcoin sell-off?
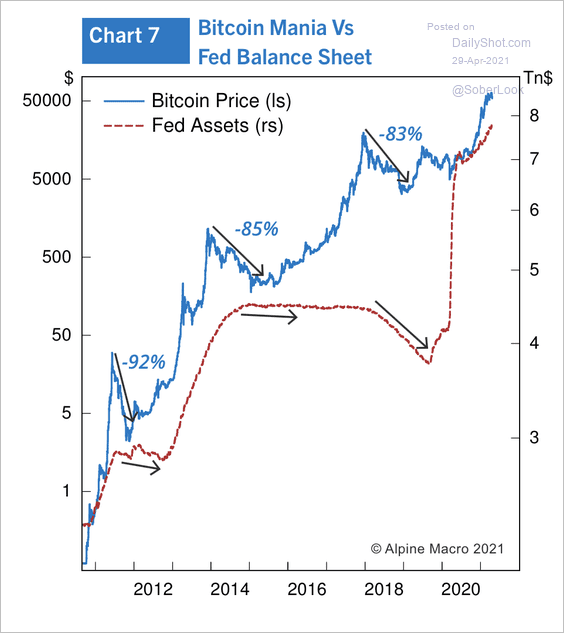 Source: Alpine Macro
6. Genesis Trading, a digital currency prime broker, transacted $31.5 billion in spot trading in Q1 – $8 billion of which was traded by corporates using bitcoin as a treasury reserve asset.
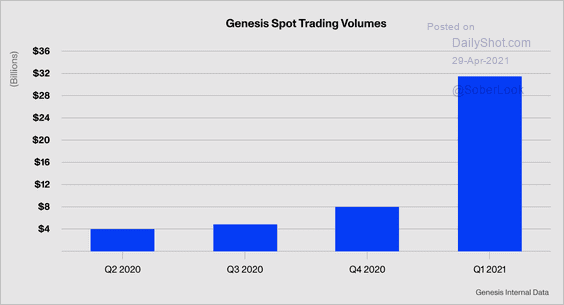 Source: Genesis Trading
7. Digital currency and digital wallet complaints to CFPB keep rising.
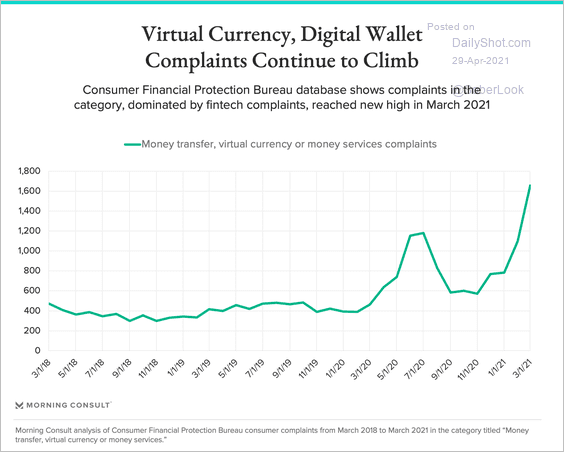 Source: Morning Consult Read full article
Back to Index
Commodities
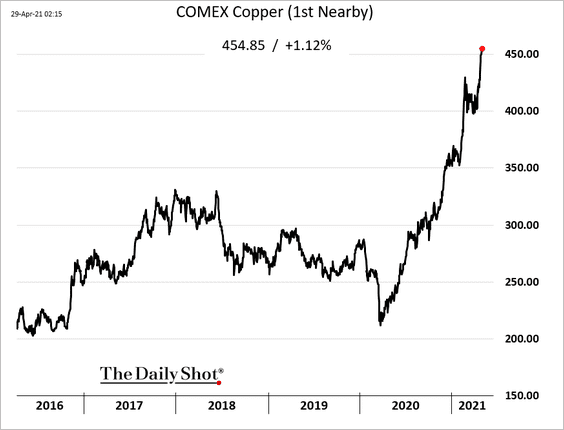
1. Let’s begin with copper.
• Prices continue to hit multi-year highs.
• The global push toward lower emissions will boost demand for copper.
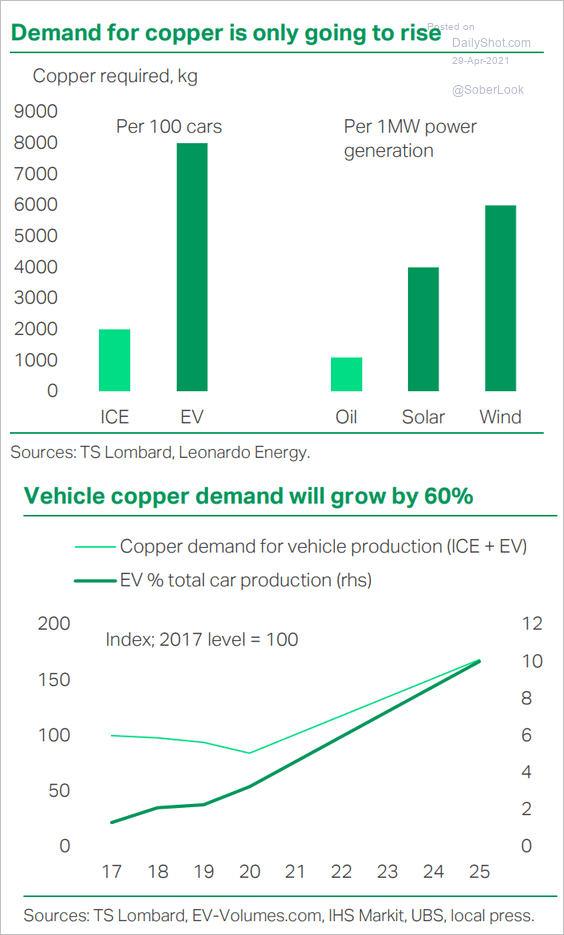 Source: TS Lombard
• Here is copper’s correlation with various currencies.
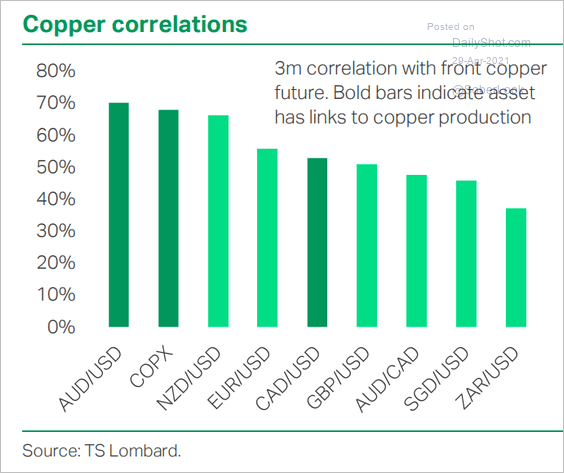 Source: TS Lombard
——————–
2. Below is Bloomberg’s broad commodities index (monthly changes).
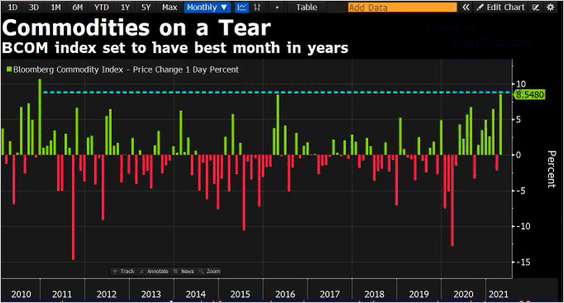 Source: @CityNational, @nope_its_lily, @Reuters, @johnauthers, @BosHeraldSports, @DavidInglesTV Read full article
3. Which commodities are in backwardation?
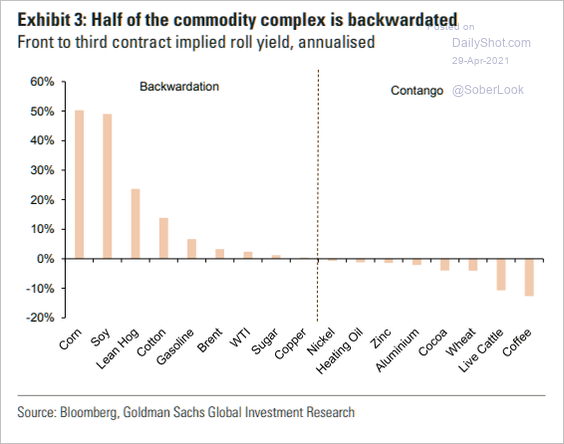 Source: Goldman Sachs; @themarketear
4. EU emission allowance contracts continue to surge.

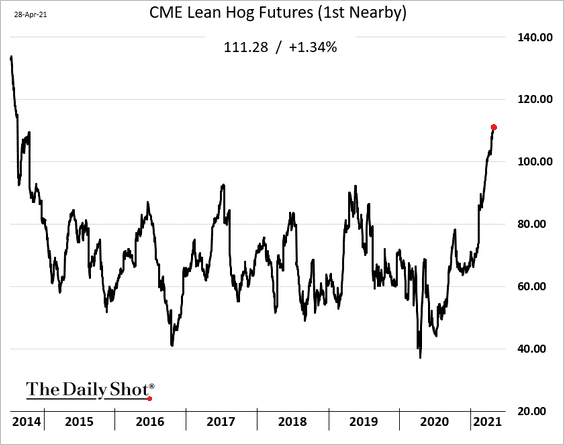
5. Tight supply outlook and low inventories keep driving Chicago hog futures higher (highest since 2014).
US agricultural prices have been surging this year.
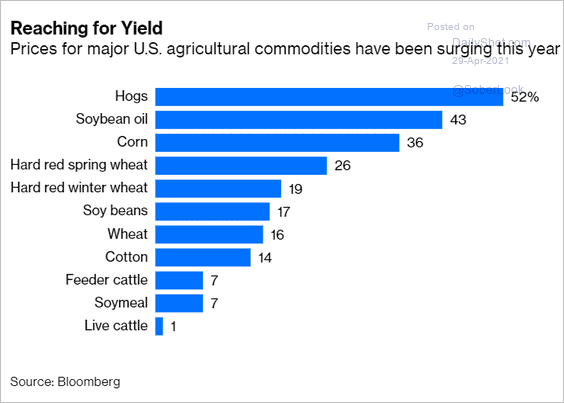 Source: @davidfickling, @bopinion Read full article
Back to Index
Energy
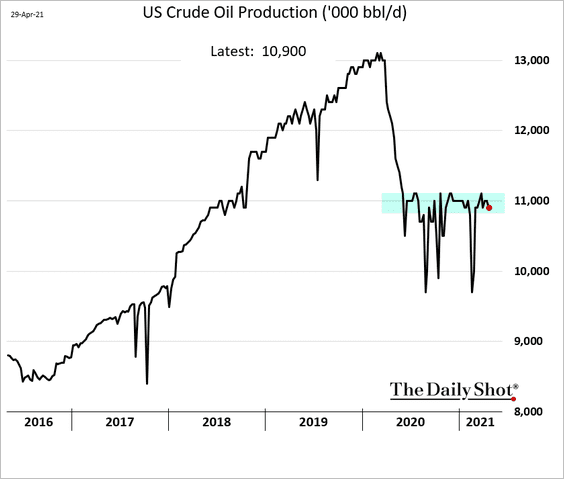
1. US crude oil production remains capped at 11 million barrels per day.
2. The following two charts show the US implied gasoline demand and refinery runs.
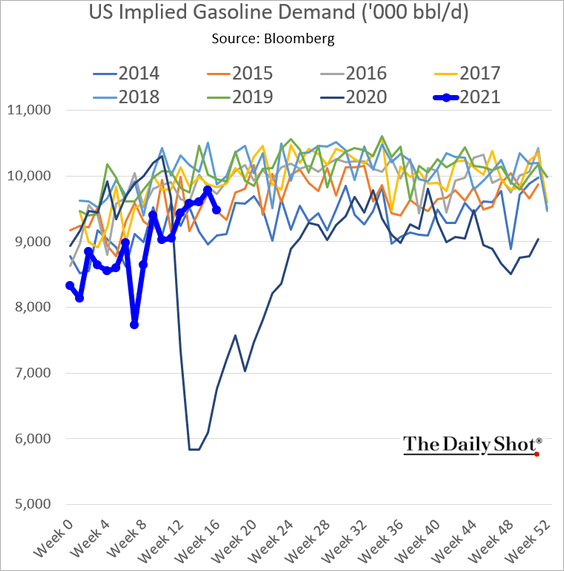
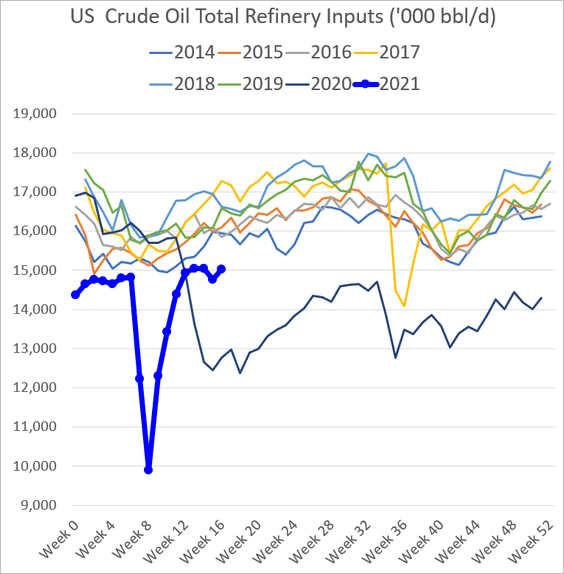
——————–
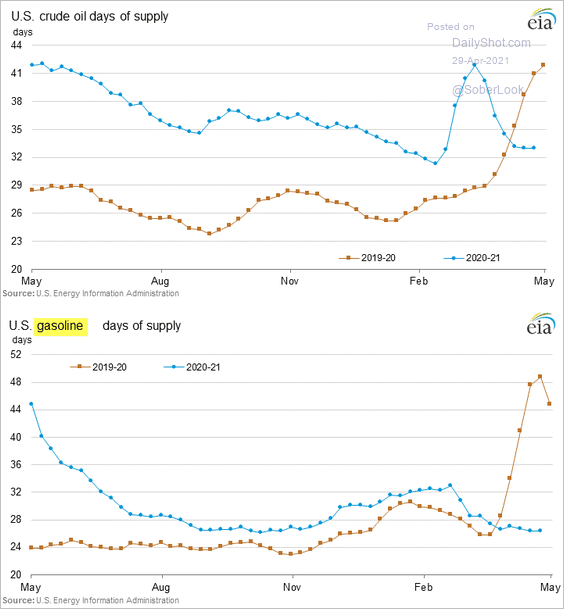
3. And here are US crude oil and gasoline inventories measured in days of supply.
Back to Index
Equities
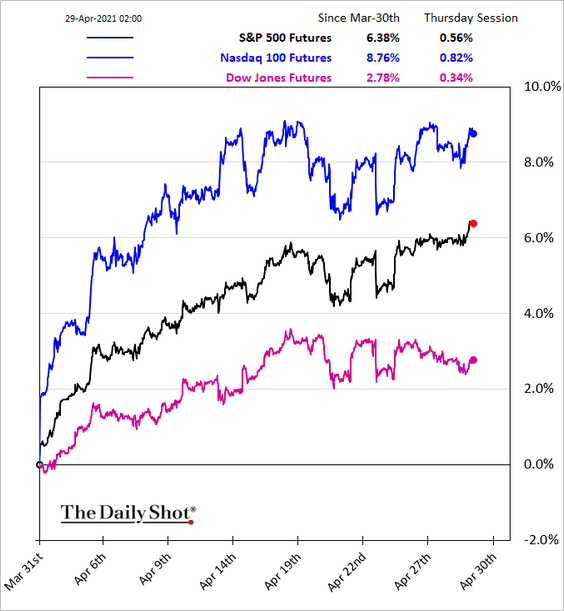
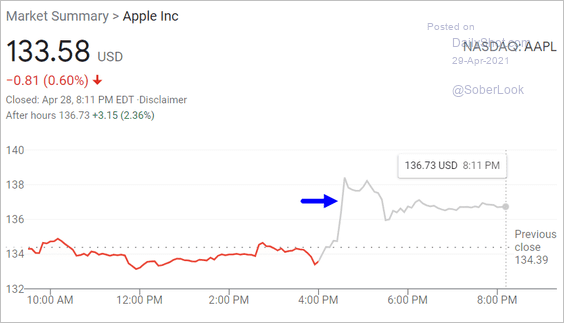
1. US futures are higher this morning after the dovish FOMC statement and a strong earnings report from Apple.
 Source: Google
——————–
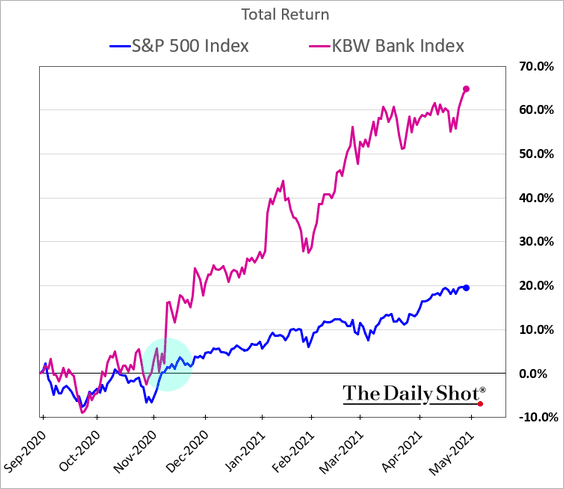
2. US bank shares have outperformed massively since the vaccine announcement in November.
 h/t @Matt_Turnerr
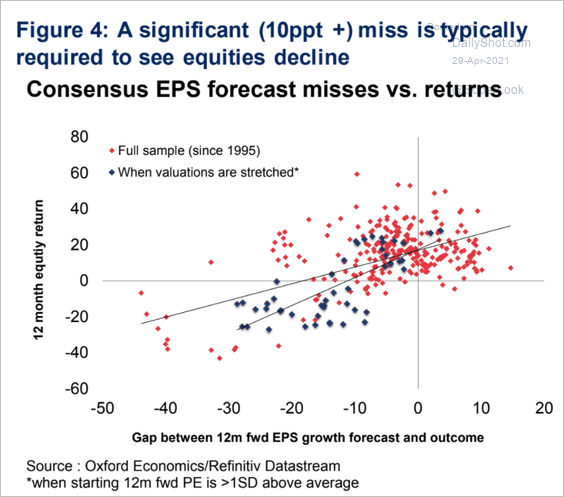
3. How do earnings misses impact returns?
 Source: Daniel Grosvenor, Oxford Economics
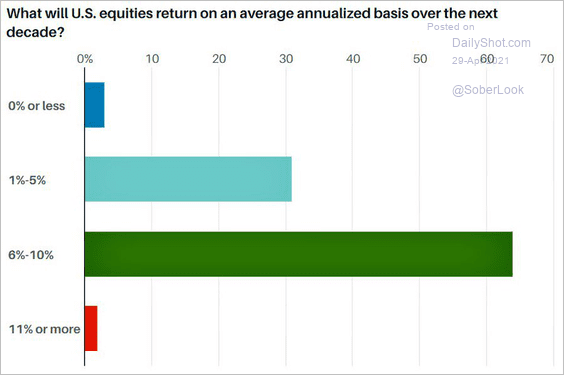
4. Here is how US equities will perform over the next decade, according to a survey of money managers.
 Source: @LizAnnSonders, @barronsonline Read full article
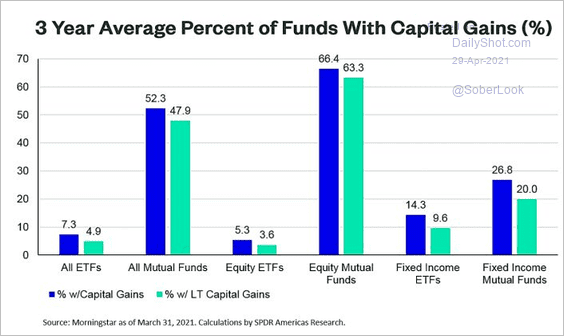
5. This chart shows the percentage of mutual funds and ETFs with capital gains.
 Source: Matthew Bartolini
6. Which sectors are most vulnerable to tax hikes?
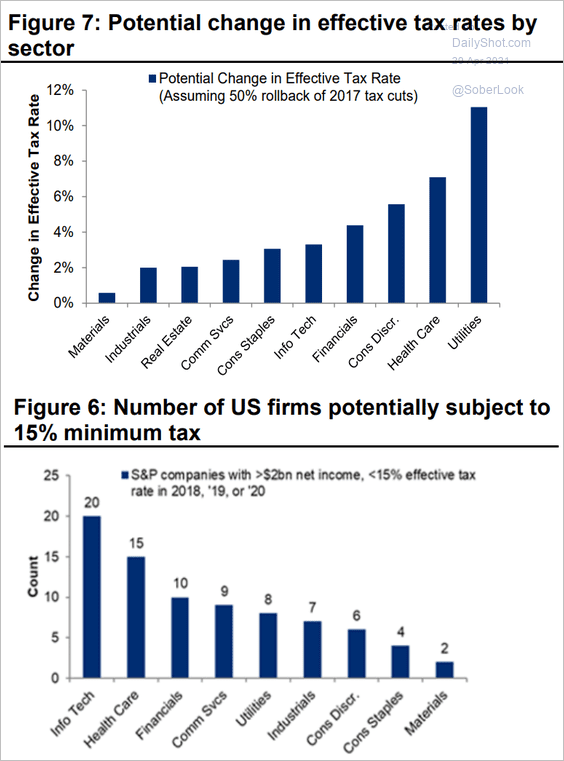 Source: Citi Private Bank
7. This chart shows the stock market performance in the first 100 days of each US president.
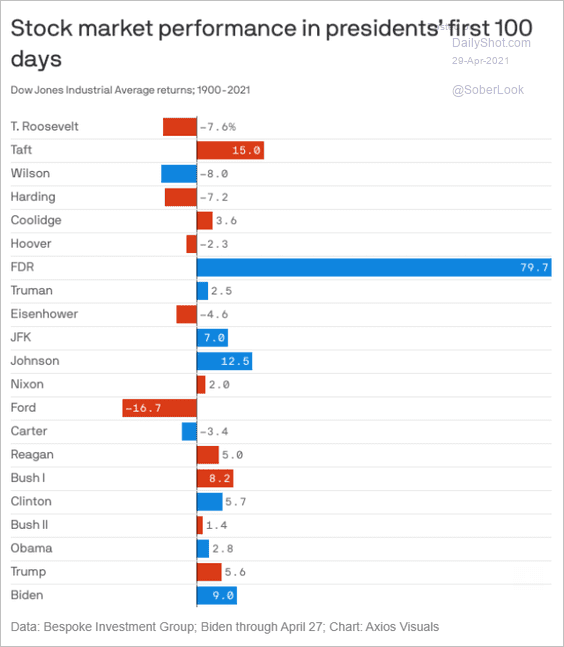 Source: @axios Read full article
8. The media should stop hyperventilating over margin debt. While debt levels have risen substantially, the increase and the overall levels are not extreme relative to market capitalization.
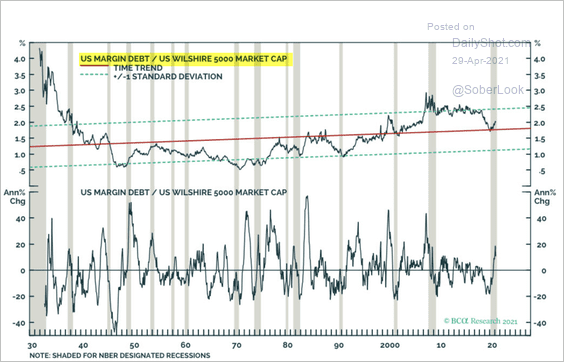 Source: Anastasios Avgeriou
9. Virtual shareholder meetings have been common.
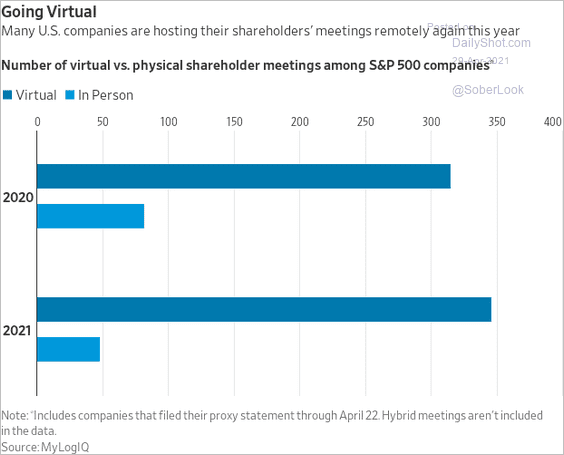 Source: @WSJ Read full article
——————–
Food for Thought
1. US private sector demand deposits:

2. Comfort level with taking a vacation:
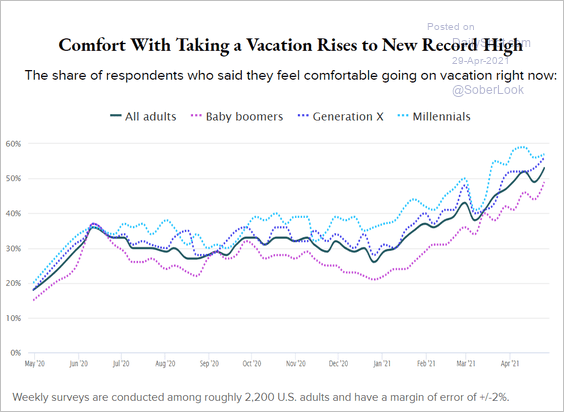 Source: Morning Consult Read full article
3. Vaccination progress by state:
 Source: @business_econ, @GregDaco, @OxfordEconomics
4. Nuclear stockpiles:
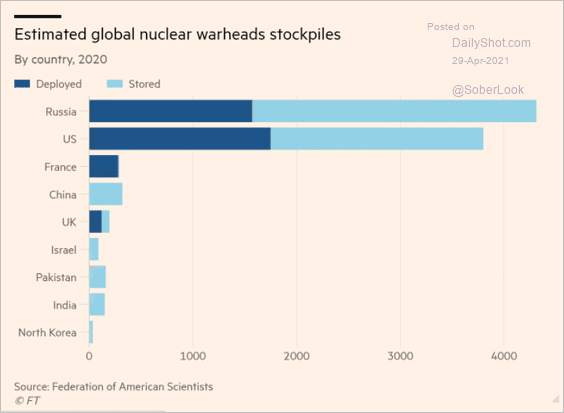 Source: @financialtimes Read full article
5. Americans’ perceptions of China, Russia, and North Korea as the “greatest enemy.”
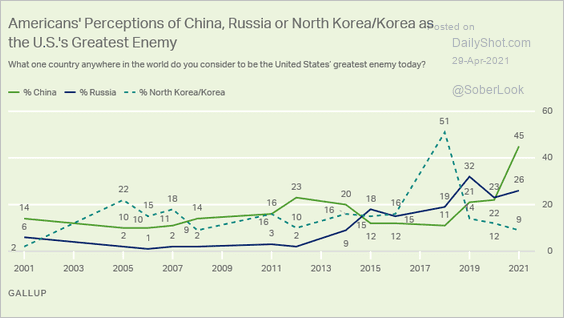 Source: Gallup Read full article
6. Monarchies:
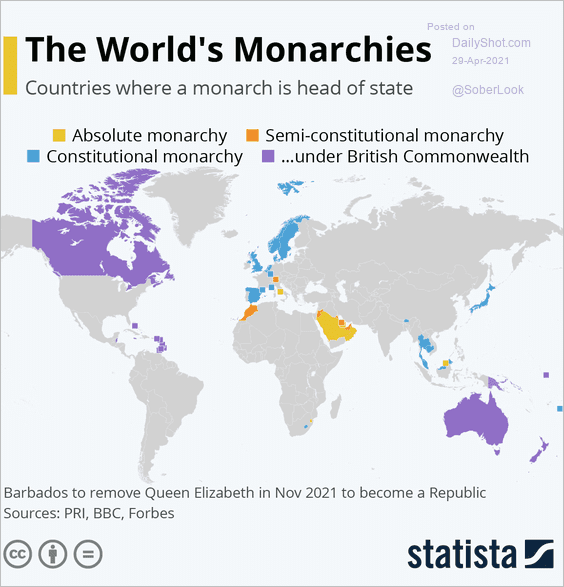 Source: Statista
7. US college enrollment:
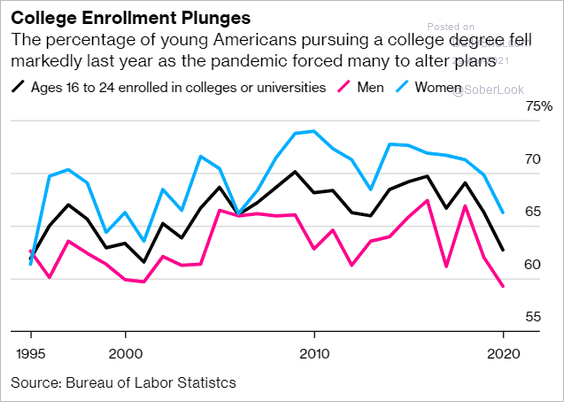 Source: @business Read full article
8. States losing or gaining seats in Congress:
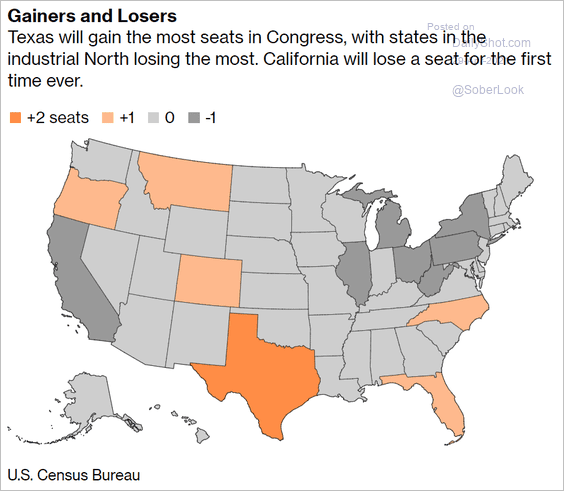 Source: Bloomberg Read full article
9. Film formats:
 Source: The Darkroom Read full article
——————–
Back to Index