
The Daily Shot: 30-Apr-21
• The United States
• Canada
• The United Kingdom
• The Eurozone
• Europe
• Japan
• Asia – Pacific
• China
• Emerging Markets
• Cryptocurrency
• Commodities
• Energy
• Equities
• Credit
• Rates
• Food for Thought
The United States
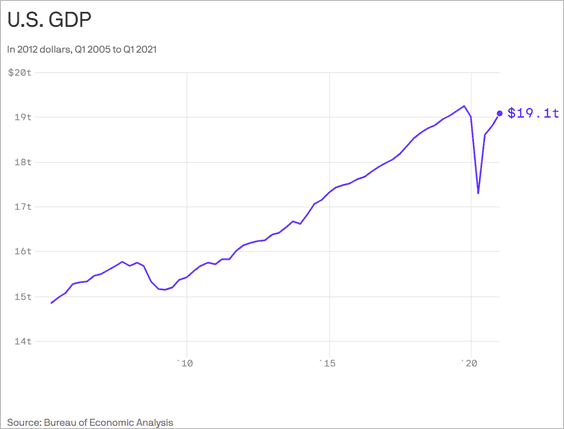
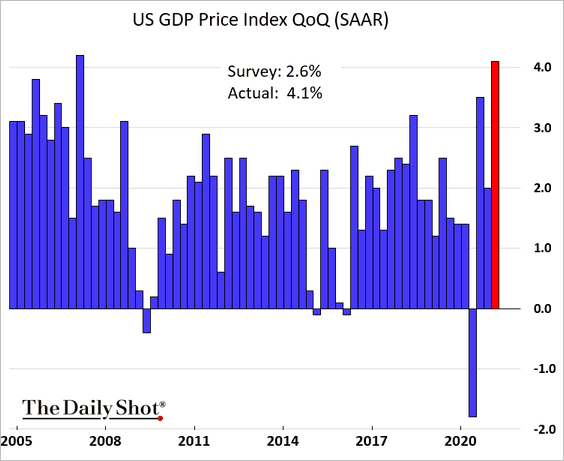
1. The first-quarter GDP report was roughly in line with expectations.
• The economy has almost recovered.
 Source: @axios Read full article
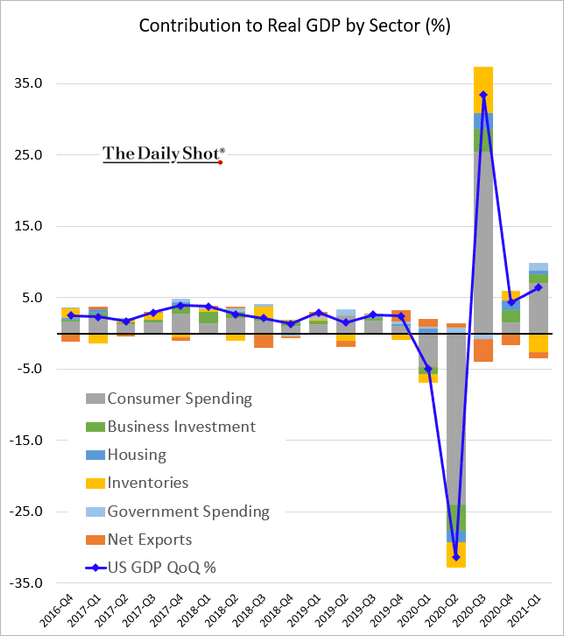
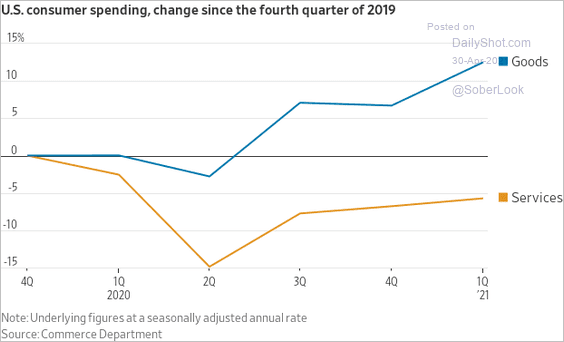
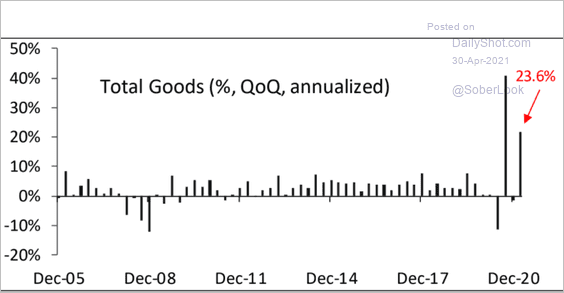
• Higher consumer spending (mostly on goods) drove much of the gains last quarter (3 charts).
 Source: @WSJ Read full article
 Source: Piper Sandler
——————–
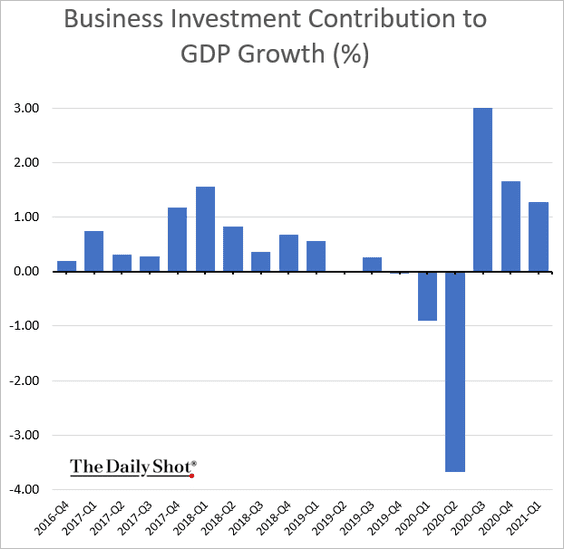
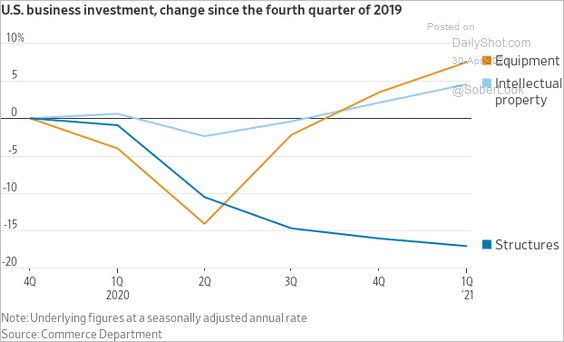
• We have now seen three consecutive quarters of growth in business investment.
 Source: @WSJ Read full article
——————–
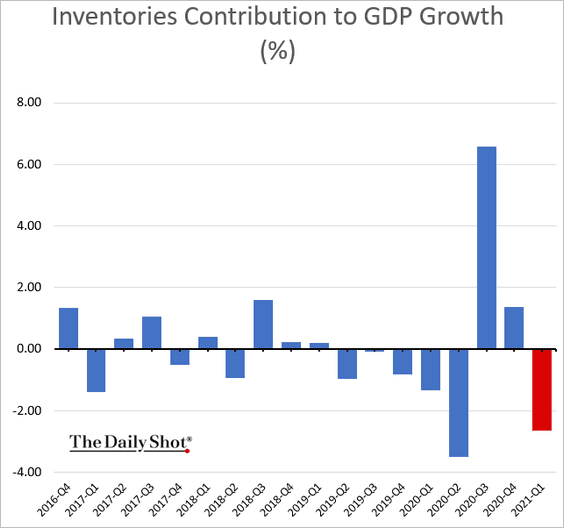
• Shrinking inventories were a drag on growth, which bodes well for the Q2 GDP (restocking).
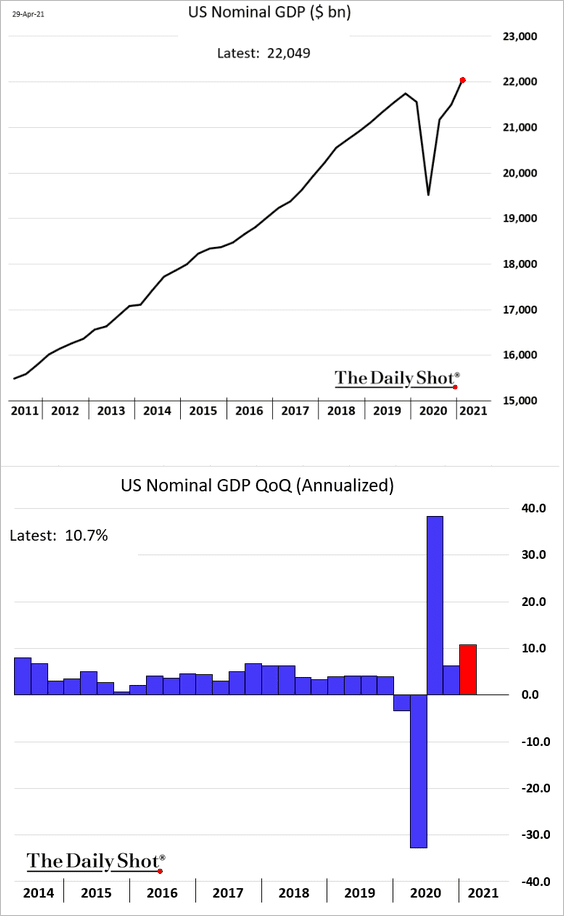
• The nominal GDP grew 10.7% in Q1 and is now well above the pre-pandemic highs.
• The **GDP deflator**https://www.investopedia.com/terms/g/gdppricedeflator.asp
** was much higher than expected (highest increase since 2007), accounting for the gap between the nominal and real GDP figures.
• How does the GDP trajectory compare to the post-2008 recovery?
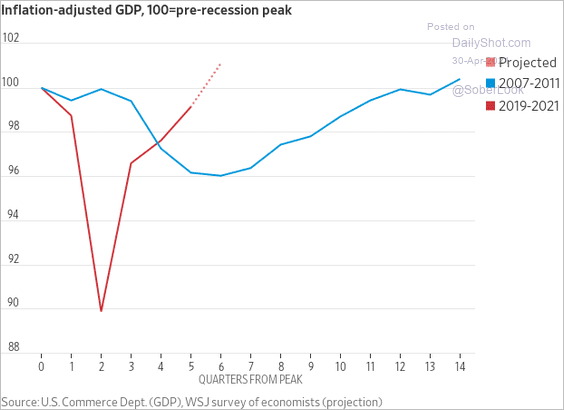 Source: @WSJ Read full article
Where do we stand relative to the CBO’s potential GDP estimate?
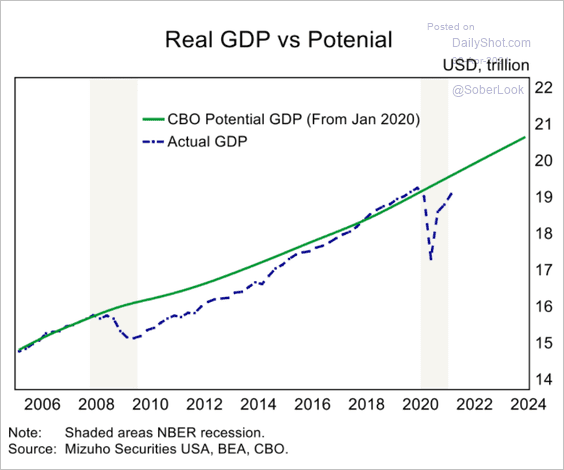 Source: Mizuho Securities USA
——————–
• Now, let’s take a look at some forecasts.
– Morgan Stanley’s quarterly projection:
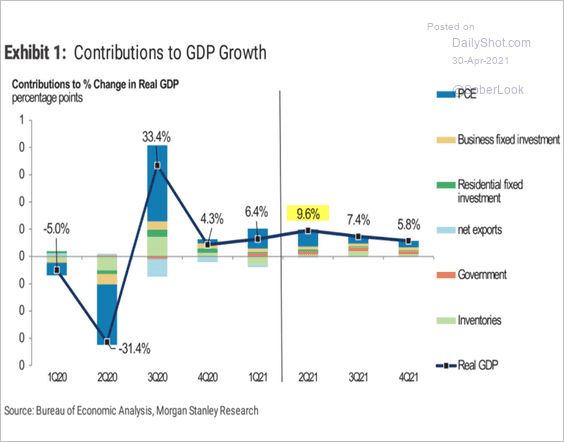 Source: Morgan Stanley Research
– Oxford Economics 2021 estimate:
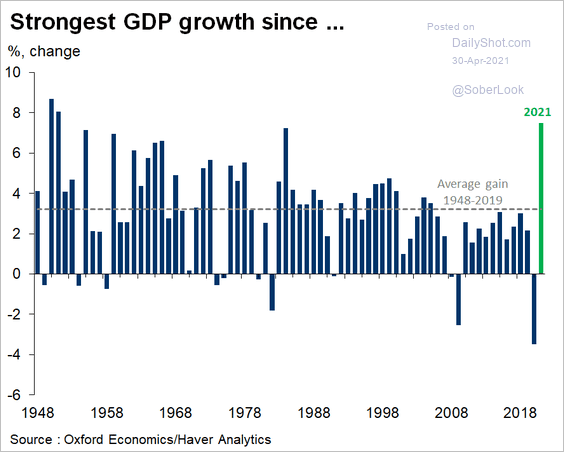 Source: @GregDaco
– The GDP trajectory relative to the pre-pandemic trend:
Pantheon Macroeconomics:
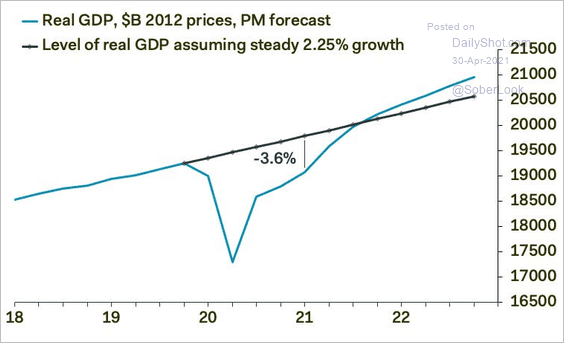 Source: Pantheon Macroeconomics
ING:
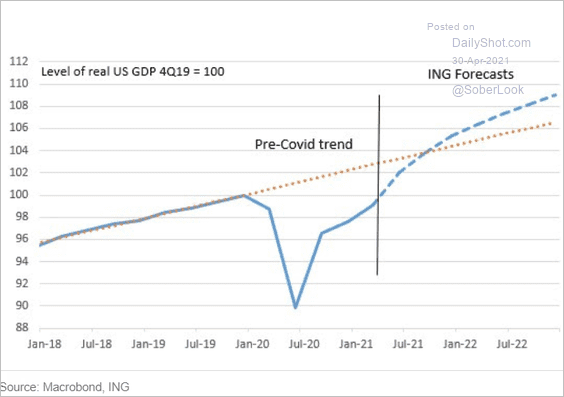 Source: ING
Oxford Economics:
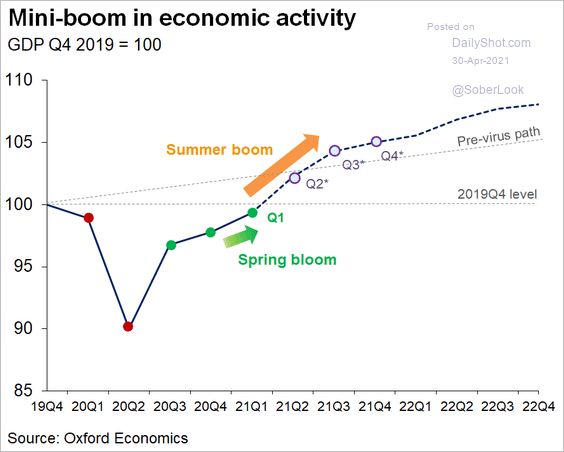 Source: @GregDaco
——————–
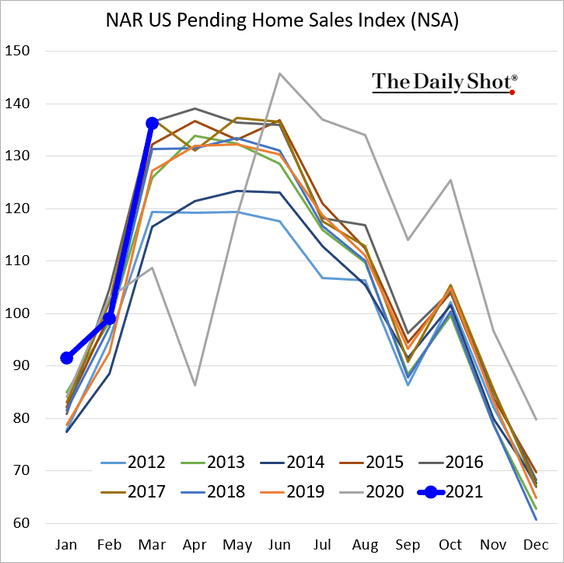
2. March pending home sales came in well below forecasts amid tight inventories and soaring prices.
 Source: Mortgage News Daily Read full article
 Source: CNBC Read full article
——————–
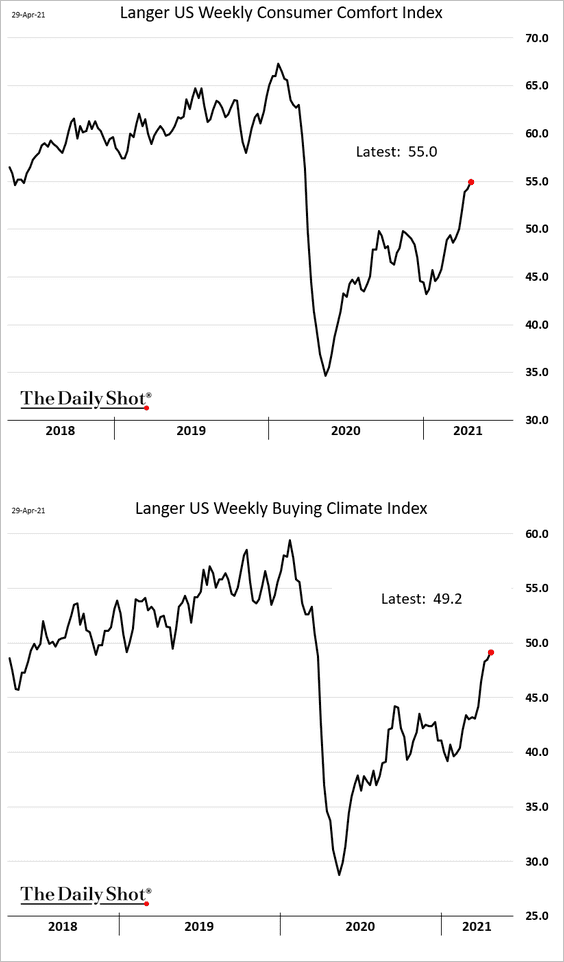
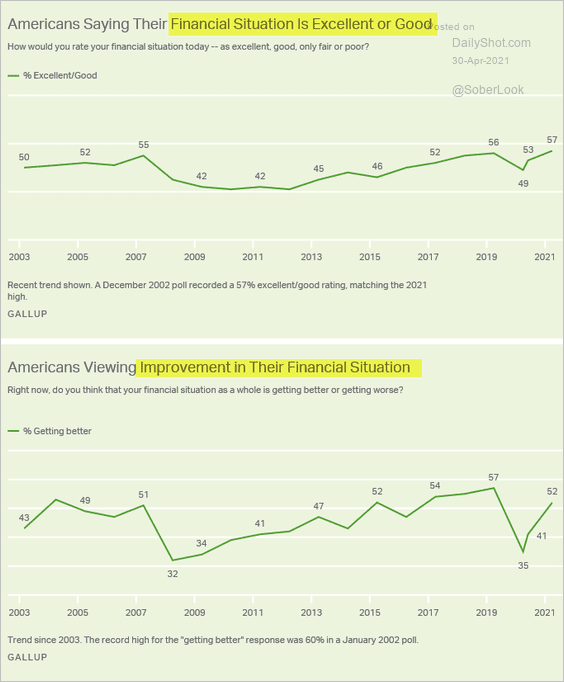
3. Consumer confidence continues to recover.
 Source: Gallup Read full article
Business confidence is surging, …
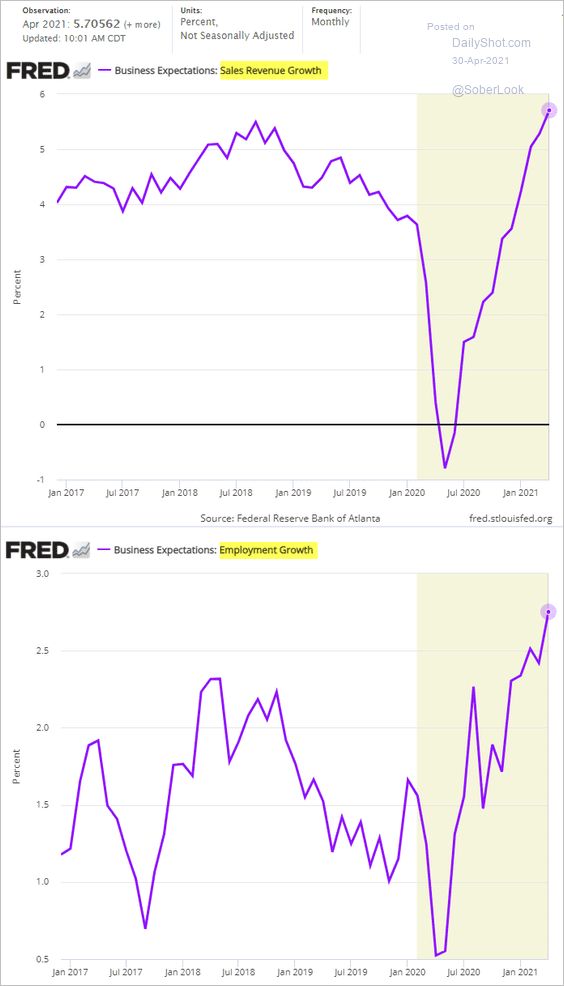
… as US companies enjoy more pricing power than global peers.
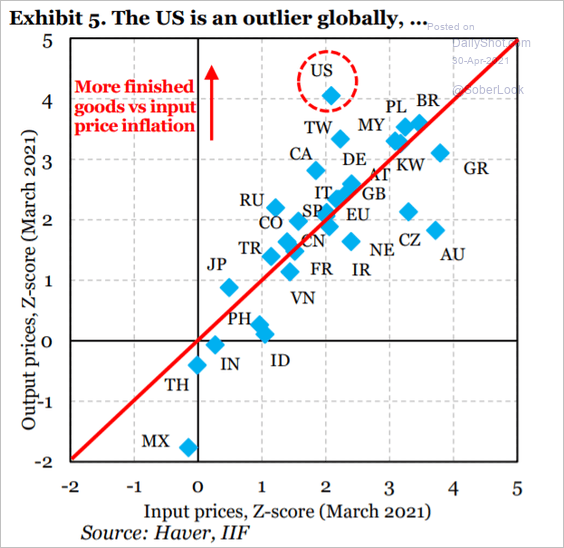 Source: IIF
——————–
4. Initial jobless claims continue to drift lower as the labor market heals.
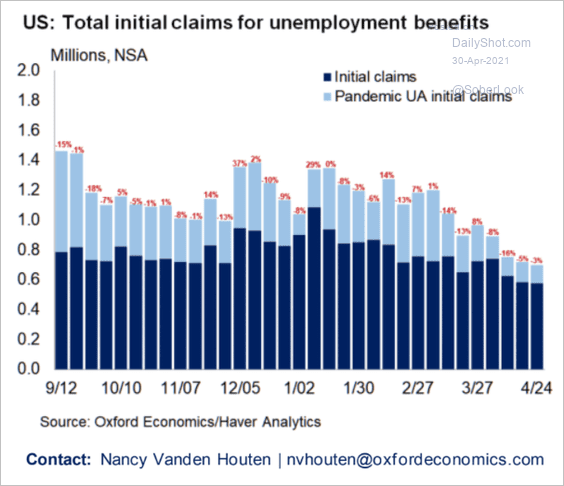 Source: Oxford Economics
Applications for extended benefits are down sharply.
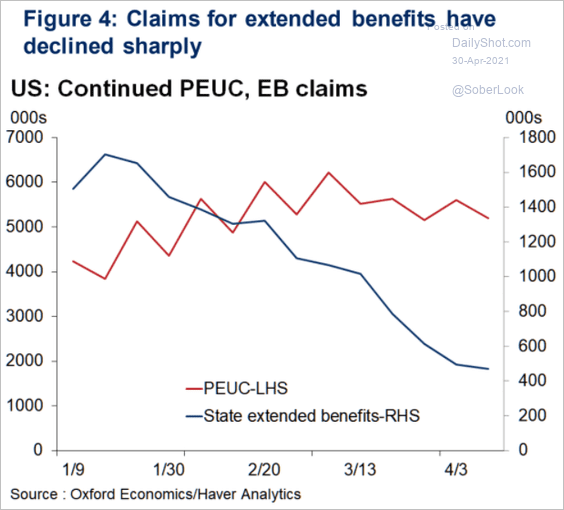 Source: Oxford Economics
——————–
5. Unlike 2009, the Fed has revised its growth estimates higher following the pandemic-induced recession.
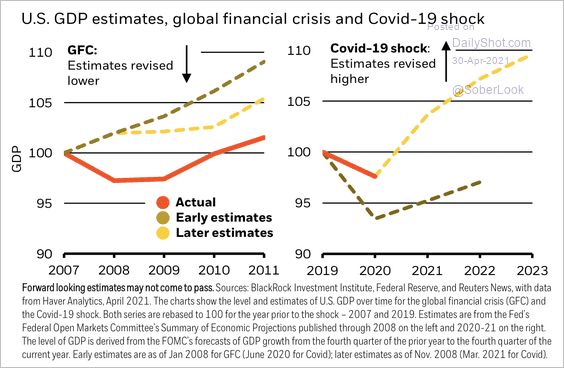 Source: BlackRock
6. Finally, we have the composition of Biden’s 4 trillion economic plan.
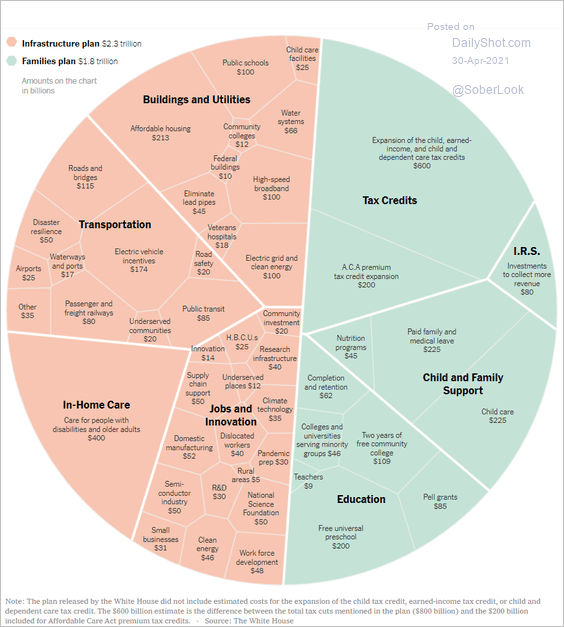 Source: The New York Times Read full article
Back to Index
Canada
1. The loonie keeps climbing vs. USD, …
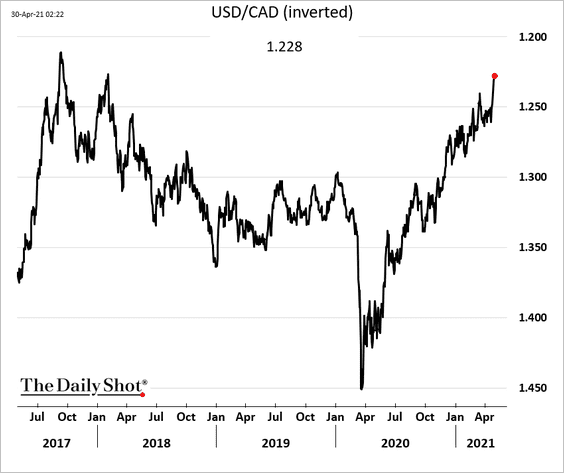
… as the BoC’s policy diverges from the Fed’s.
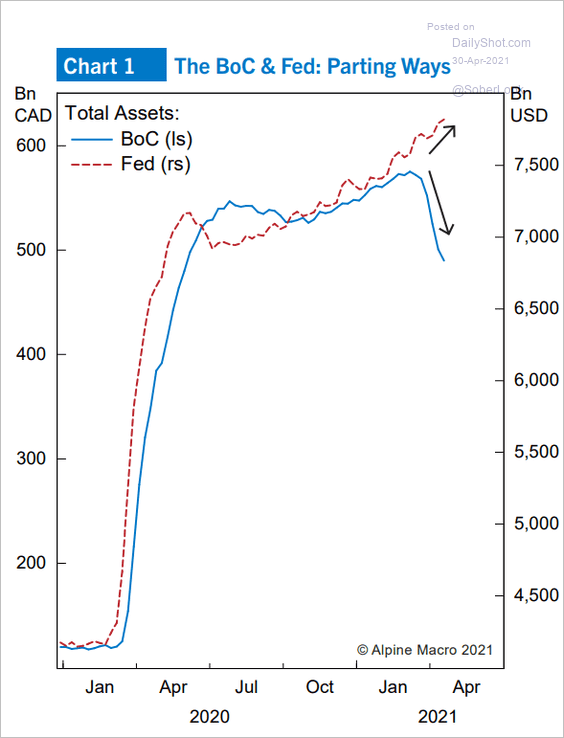 Source: Alpine Macro
——————–
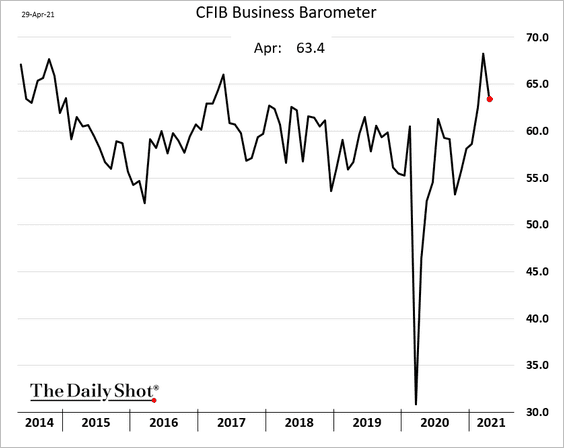
2. The CFIB small business index retreated from the highs.
3. Notes (cash) in circulation spiked at the outset of the pandemic.
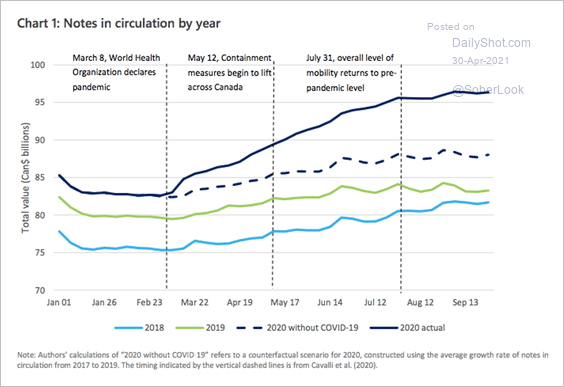 Source: Bank of Canada Read full article
At the same time, bank deposits dropped and still have not recovered.
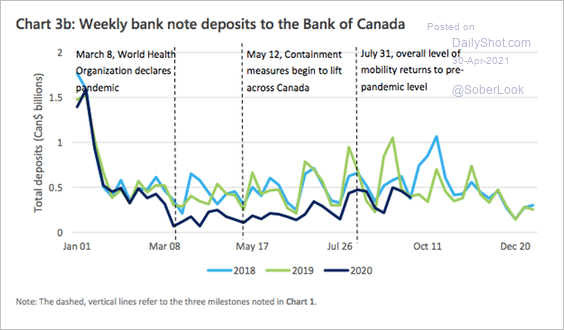 Source: Bank of Canada Read full article
Back to Index
The United Kingdom
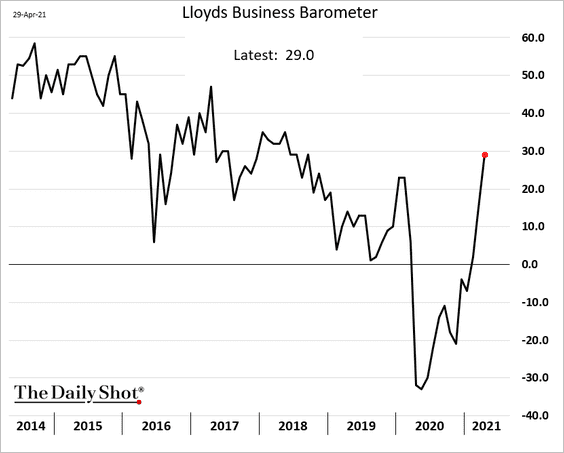
1. The Lloyds Business Barometer is now above pre-pandemic levels.
2. Labor market dynamics during the COVID crisis were quite different from what we saw after 2008.
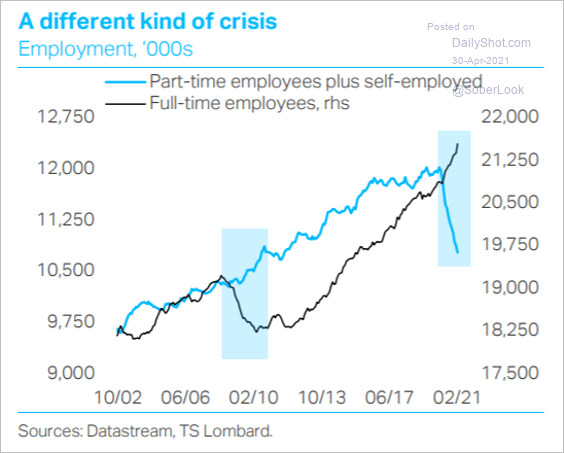 Source: TS Lombard
3. Immigration seems to be rebounding.
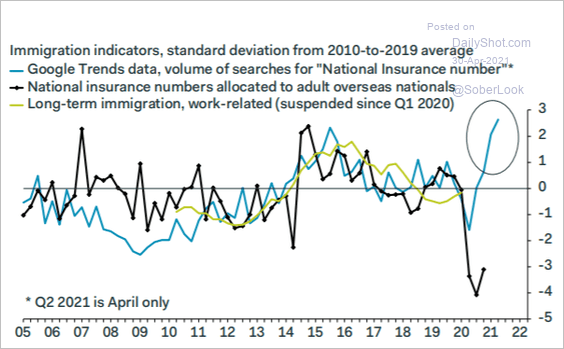 Source: Pantheon Macroeconomics
Back to Index
The Eurozone
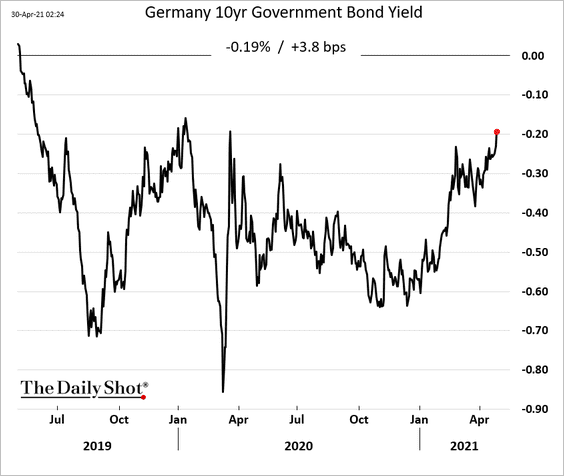
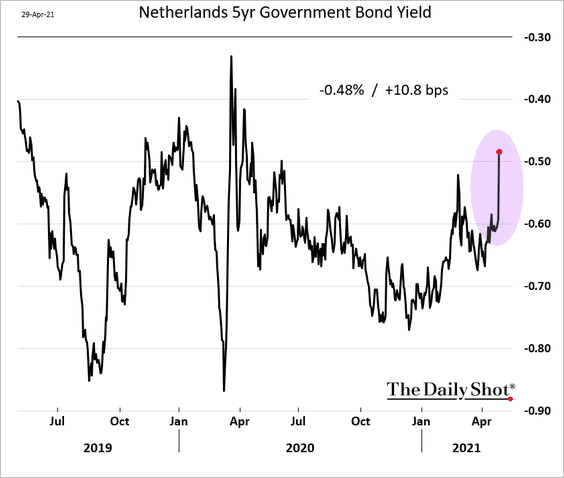
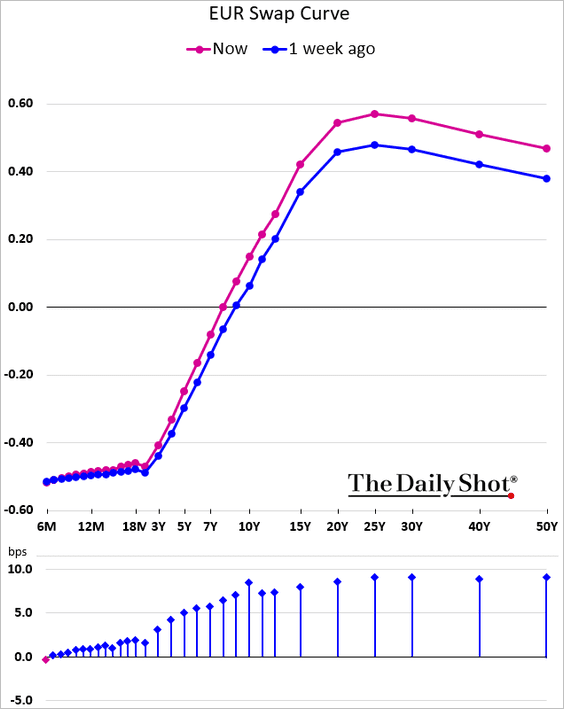
1. Euro-area longer-dated rates are rising.
• 10yr Bund:
• Dutch 5yr yield:
• The 10yr swap rate:
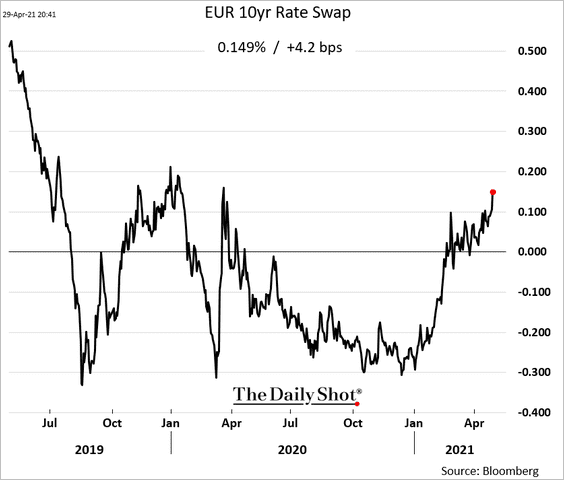
Here is the swap curve.
——————–
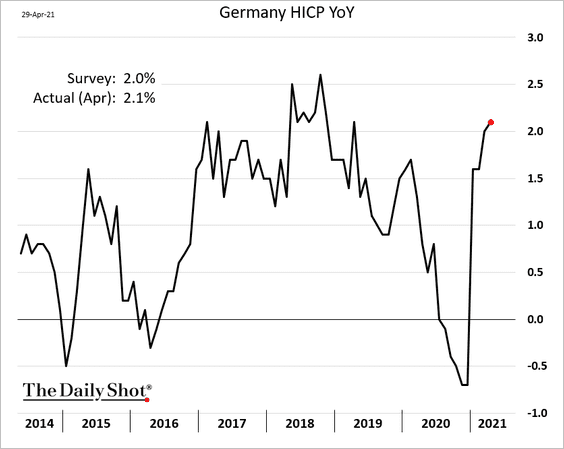
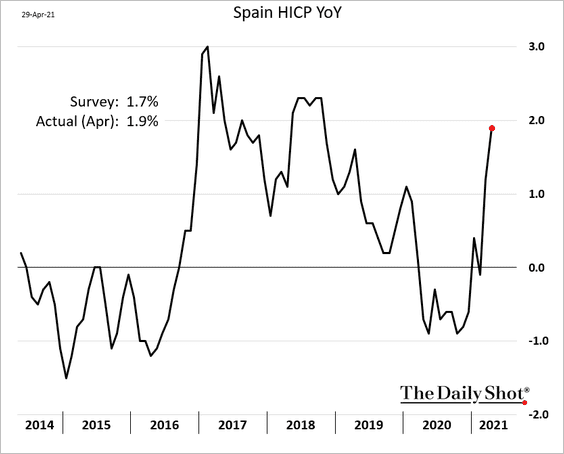
2. April inflation reports were a bit firmer than expected.
• Germany:
• Spain:
——————–
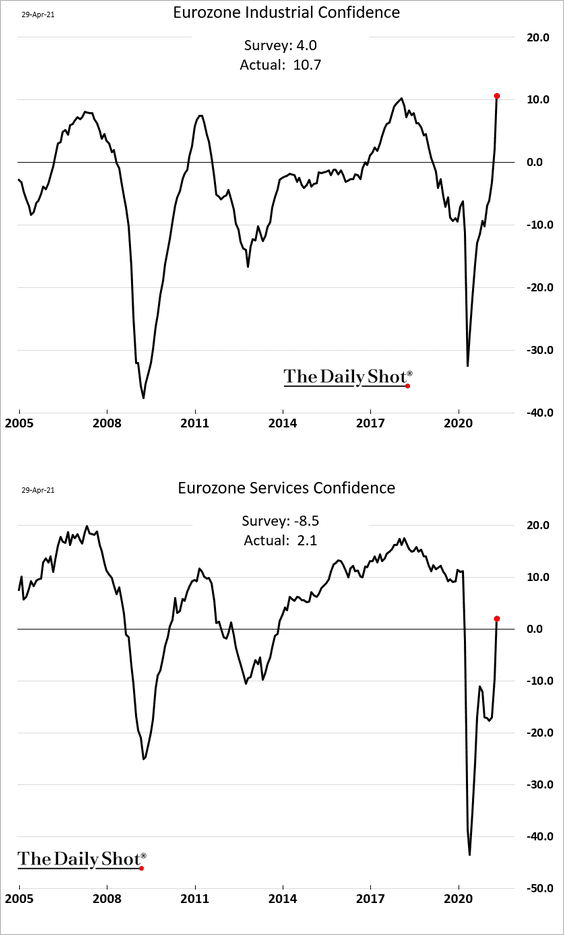
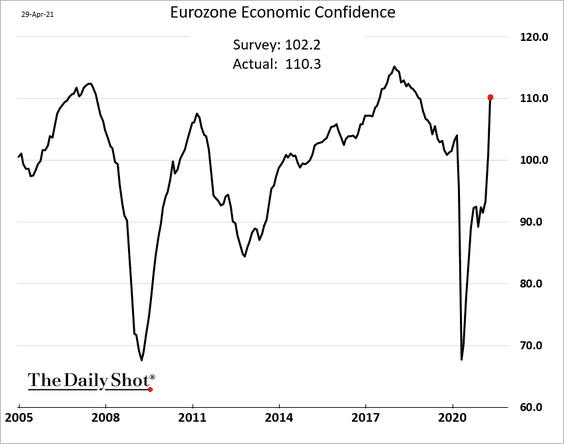
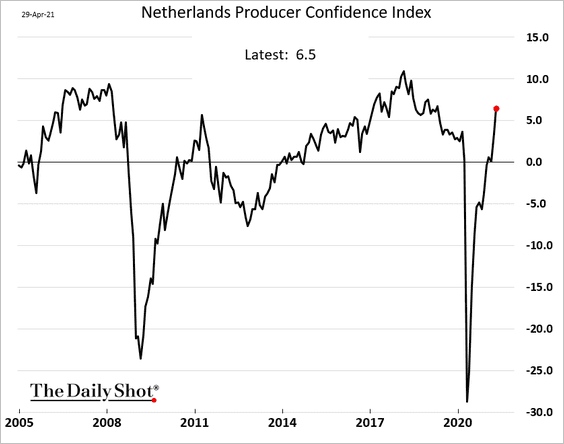
3. Business sentiment indicators strengthened substantially faster than economies were projecting.
——————–
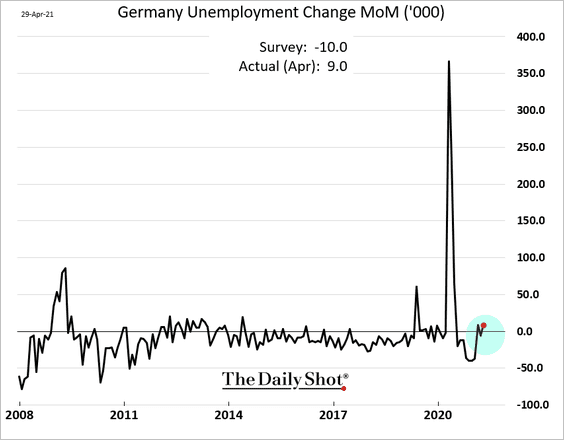
4. Germany’s unemployment unexpectedly increased.
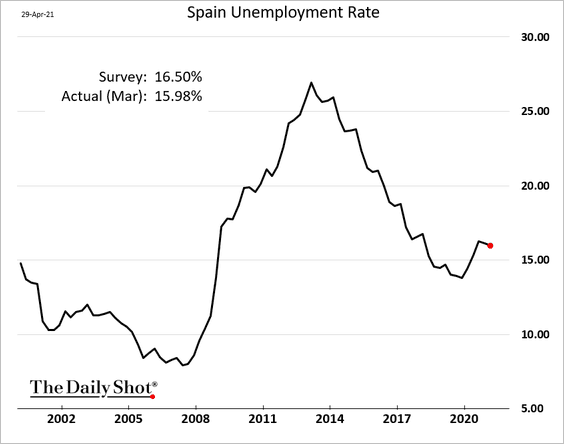
5. Spain’s unemployment rate edged lower.
6. Here is the breakdown of Italy’s recovery plan.
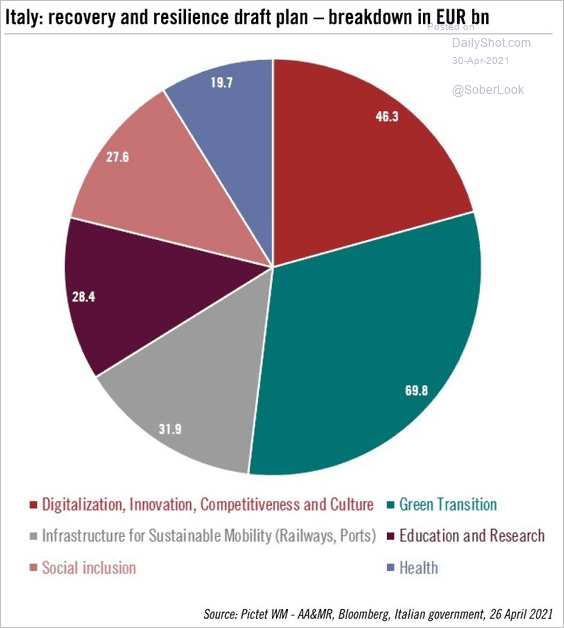 Source: @fwred, @nghrbi
Back to Index
Europe
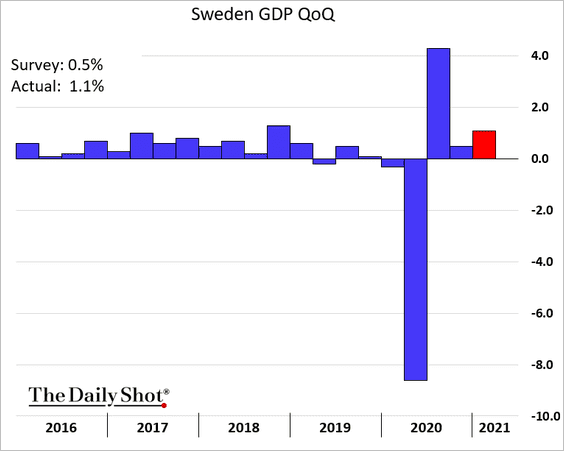
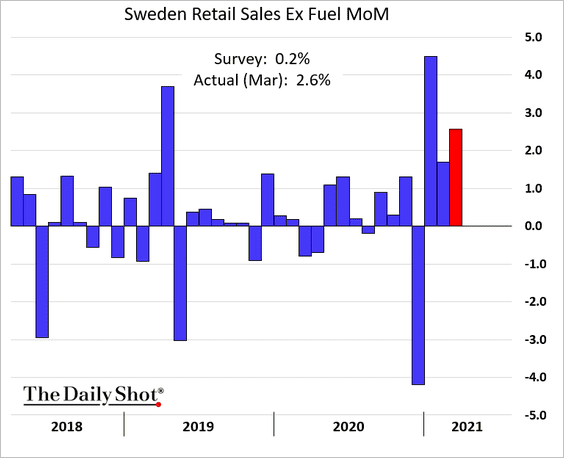
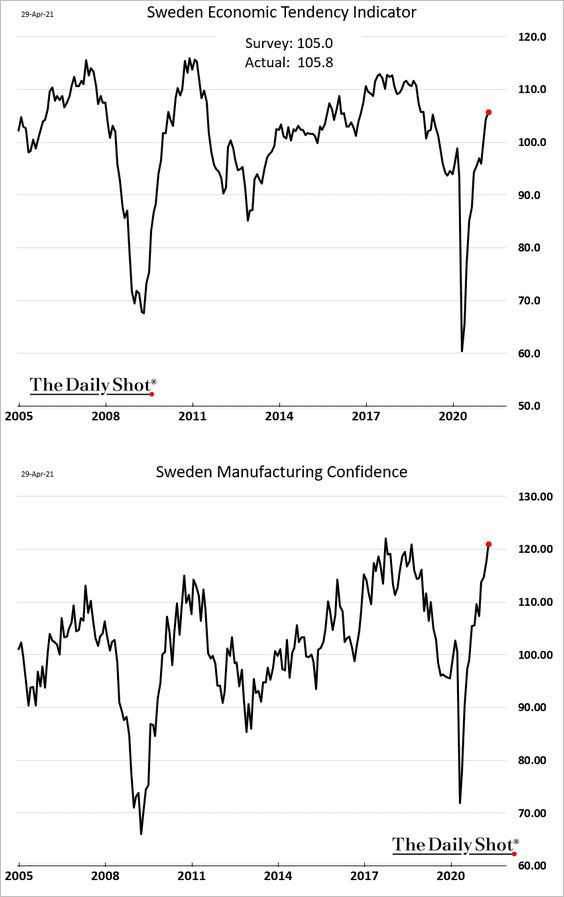
1. Let’s begin with Sweden, where economic growth is accelerating.
• The Q1 GDP growth (above consensus):
• March retail sales (very strong):
• Economic sentiment:
——————–
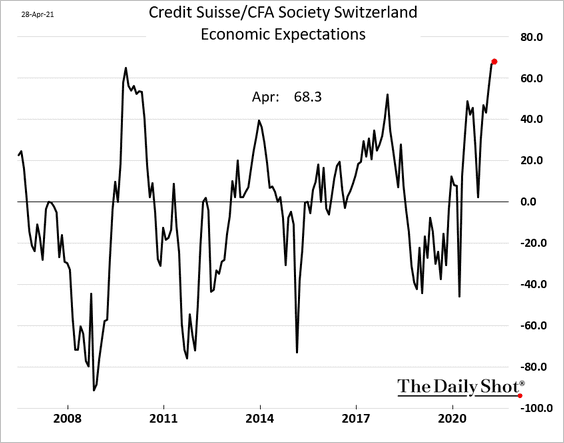
2. Swiss economic expectations have surged this year.
3. Next, we have some data on EU exports to China.
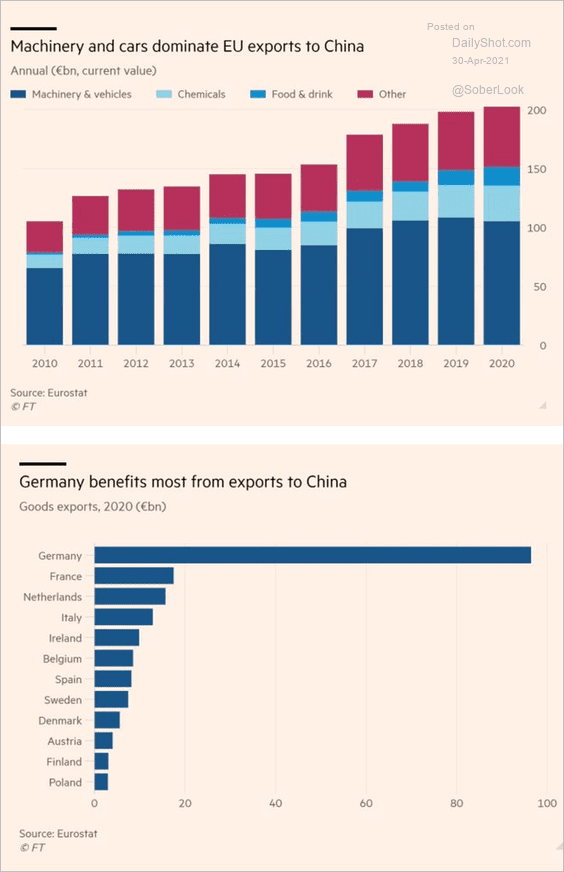 Source: @adam_tooze, @financialtimes Read full article
4. This chart shows vehicle production per employee.
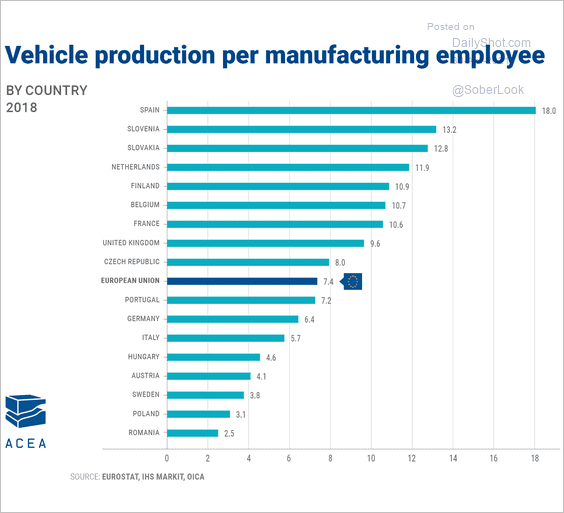 Source: @ACEA_eu Read full article
5. Here is a look at the unemployment rate across Europe in 2020.
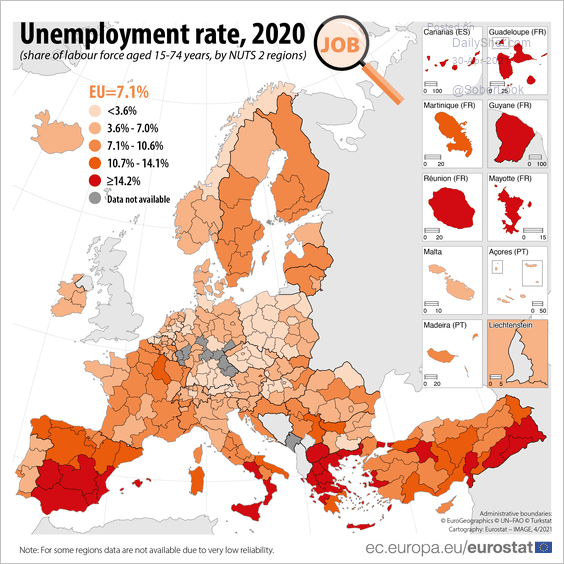 Source: Eurostat Read full article
Back to Index
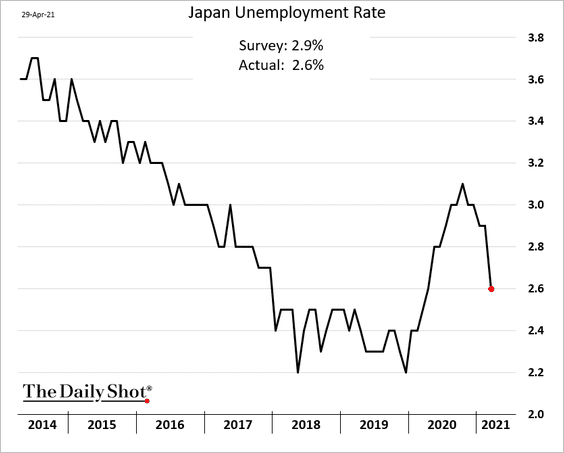
Japan
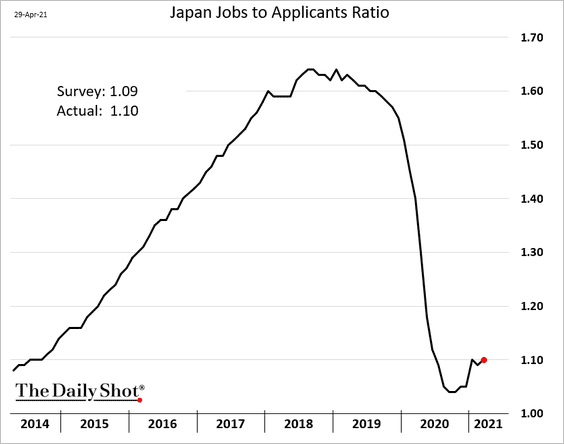
1. The labor market is recovering.
• The unemployment rate:
• Jobs-to-applicants ratio:
——————–
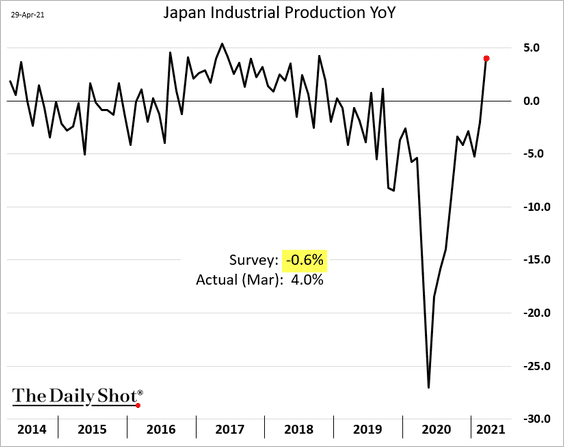
2. Industrial production exceeded forecasts.
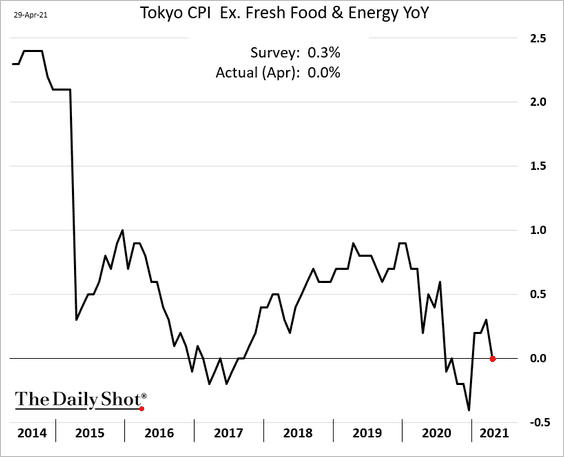
3. The April Tokyo core CPI is back at zero.
Back to Index
Asia – Pacific
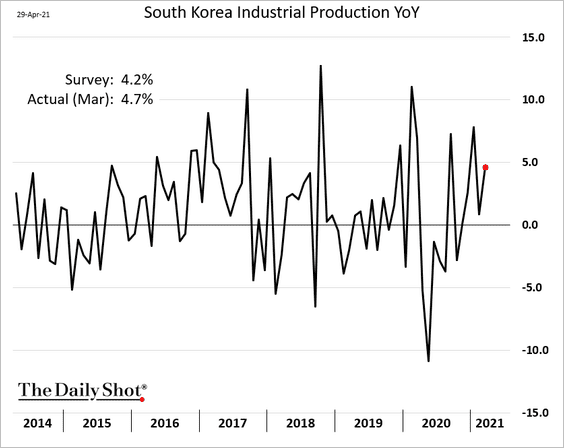
1. South Korea’s industrial production continues to expand at a healthy pace.
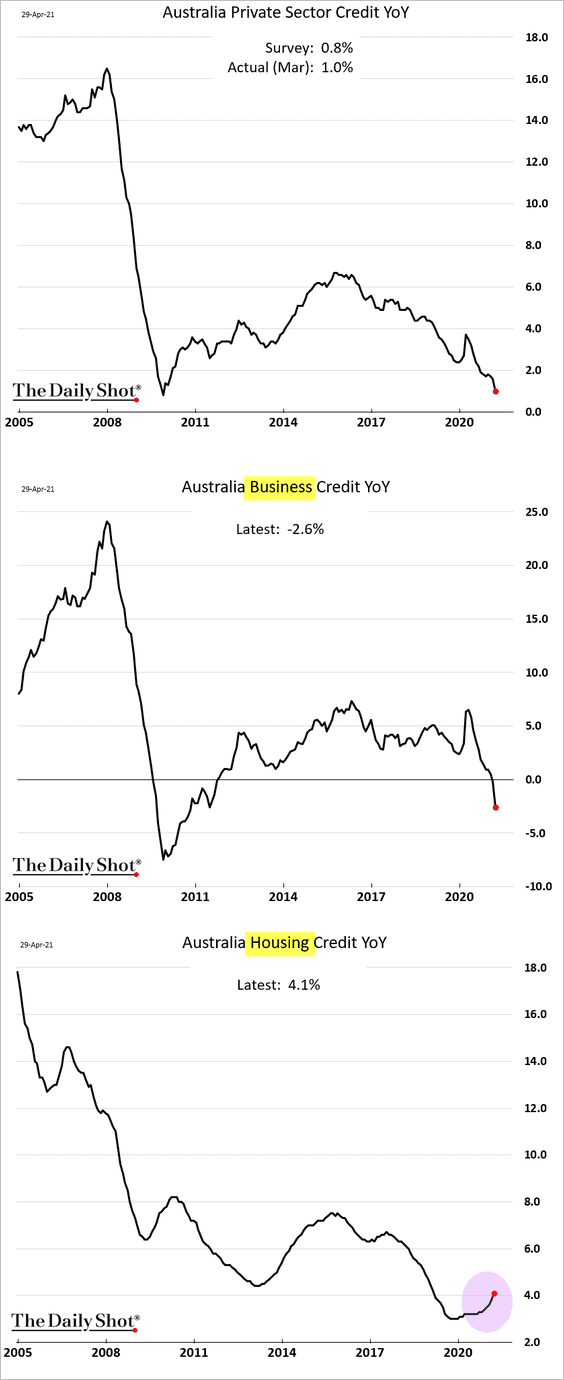
2. Australia’s private-sector credit expansion keeps slowing, driven by business lending contraction. But housing credit growth is strengthening.
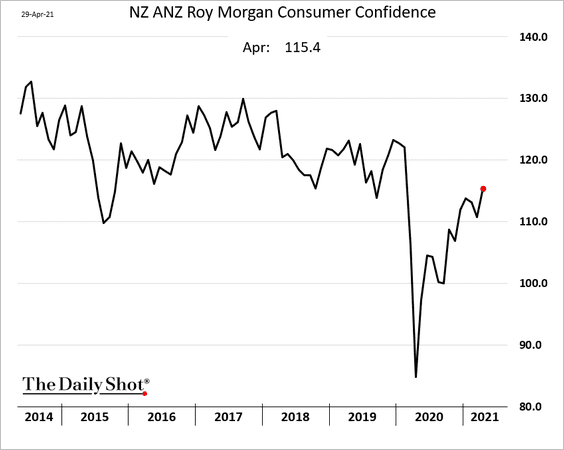
3. Next, we have some updates on New Zealand.
• Consumer confidence is recovering.
• Border crossings ground to a halt since the beginning of the pandemic as travel restrictions were put in place.
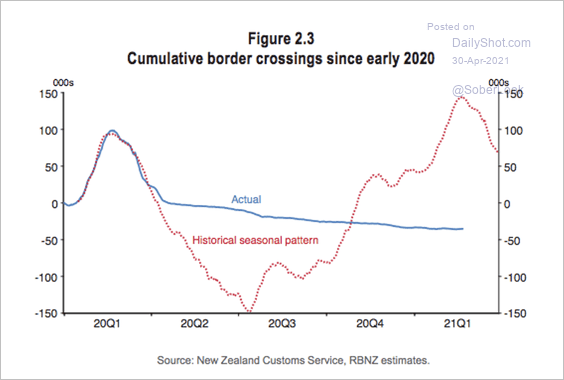 Source: RBNZ Read full article
• New Zealand’s transportation industry has taken a massive hit during the pandemic.
![]() Source: RBNZ Read full article
Source: RBNZ Read full article
Back to Index
China
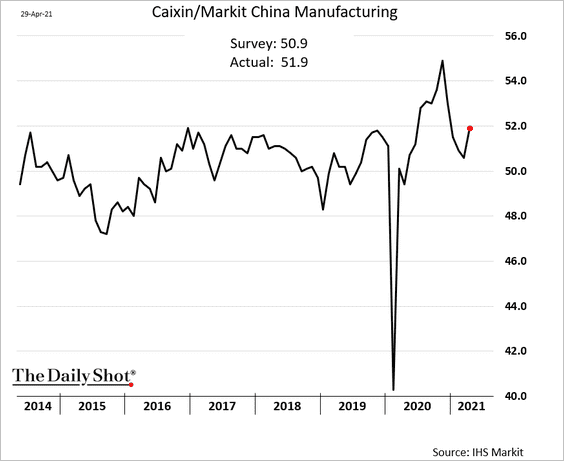
1. We are getting some contradicting PMI data this month.
• The Markit manufacturing PMI report showed faster growth (above forecasts). That’s consistent with the World Economics SMI trend (see chart from last week).
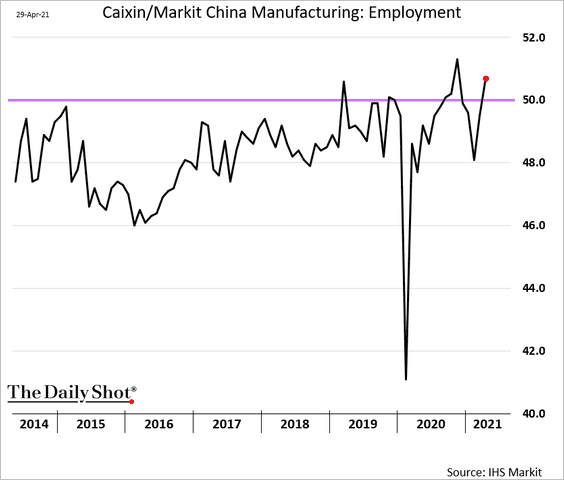
Factories are hiring again.
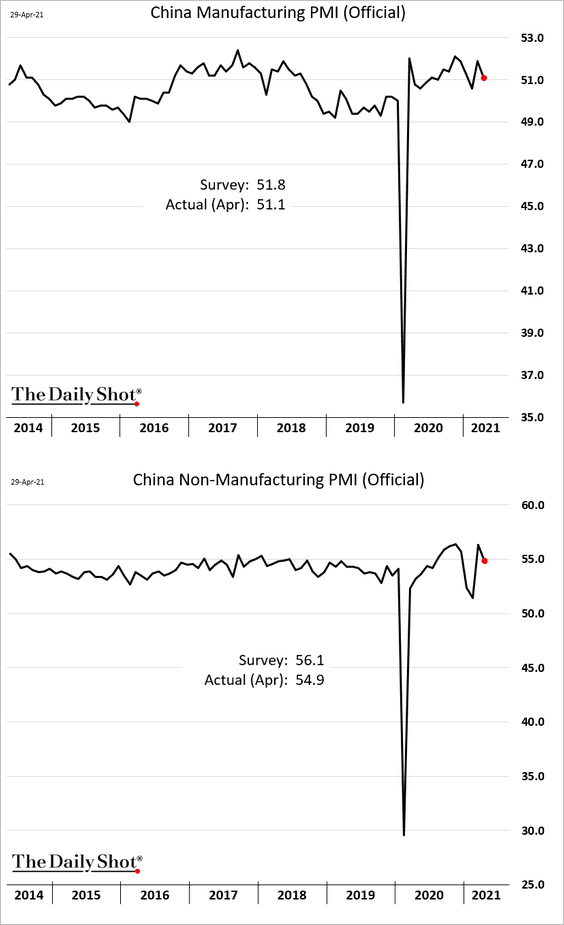
• However, the official PMI report showed slower growth.
——————–
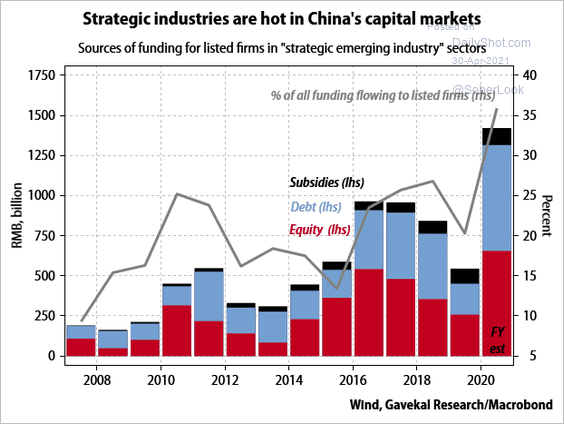
2. Fundraising in strategic industries, such as semiconductors, soared last year (encouraged by Bejing).
 Source: Gavekal Research
3. How much of their revenues do companies generate abroad?
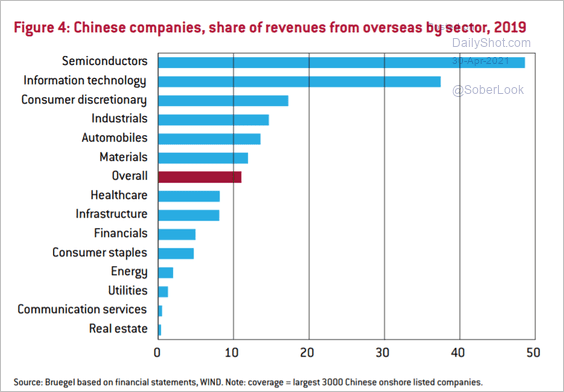 Source: Bruegel Read full article
4. Here is the number of Global Fortune 500 firms based in China.
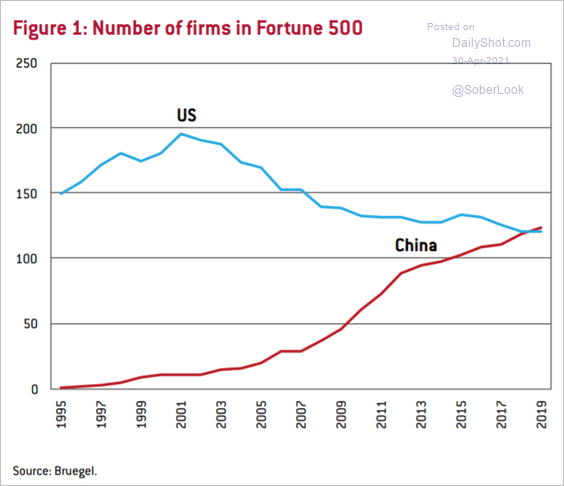 Source: Bruegel Read full article
5. Next, we have some updates on China’s demographics.
• China’s population fell last year.
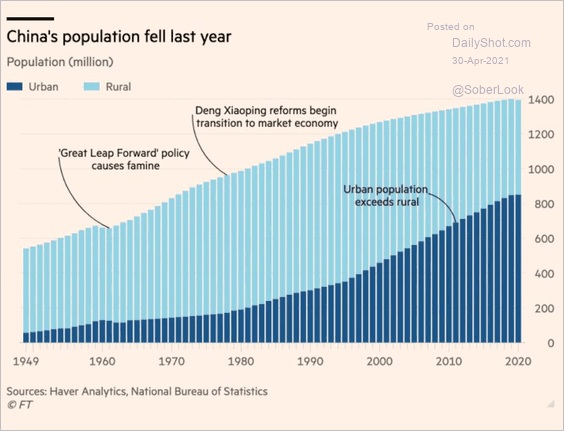 Source: @adam_tooze, @financialtimes Read full article
• Marriage rates are falling, while divorces are increasing.
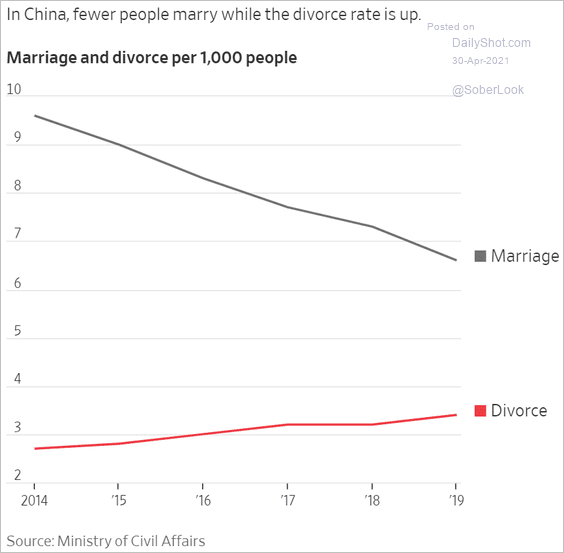 Source: @WSJ Read full article
• Projections show further population declines ahead, which will be a drag on growth (2 charts).
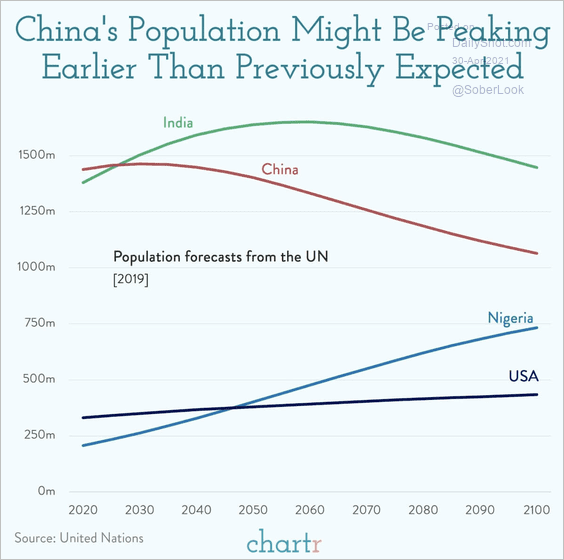 Source: @chartrdaily
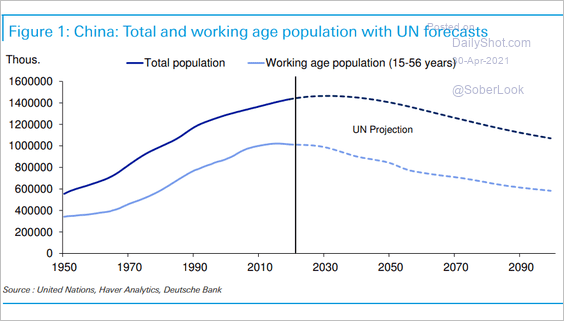 Source: Deutsche Bank Research
Back to Index
Emerging Markets
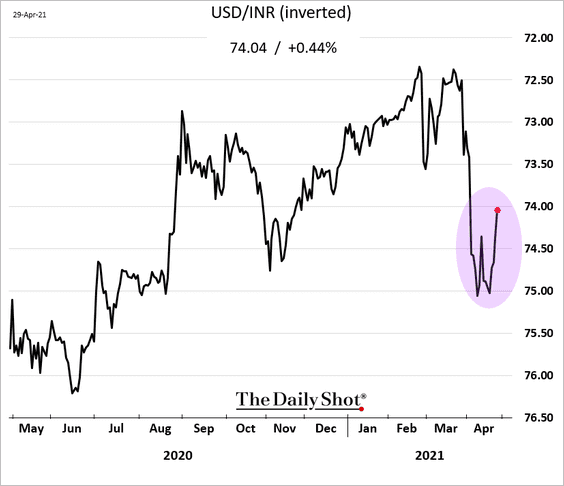
1. The Indian rupee is rebounding.
Separately, India’s interest expenses are putting a heavy burden on the government’s finances.
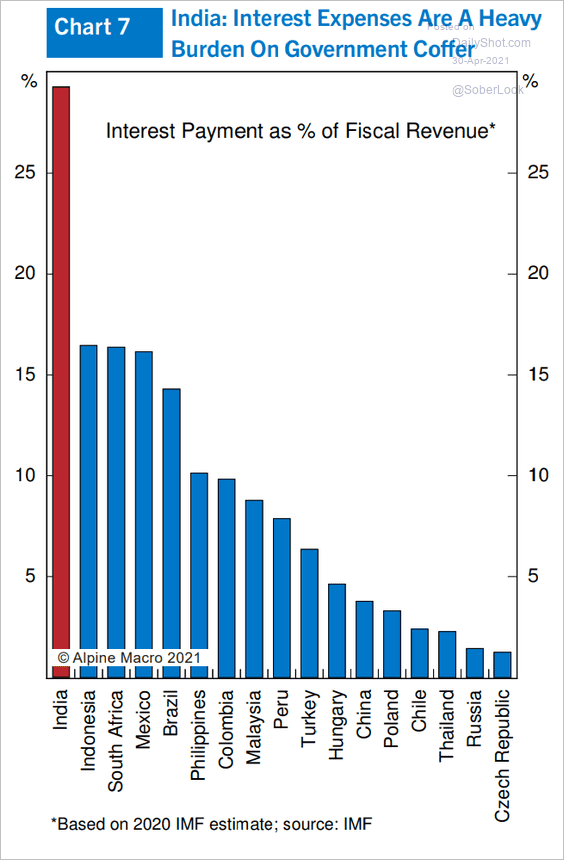 Source: Alpine Macro
——————–
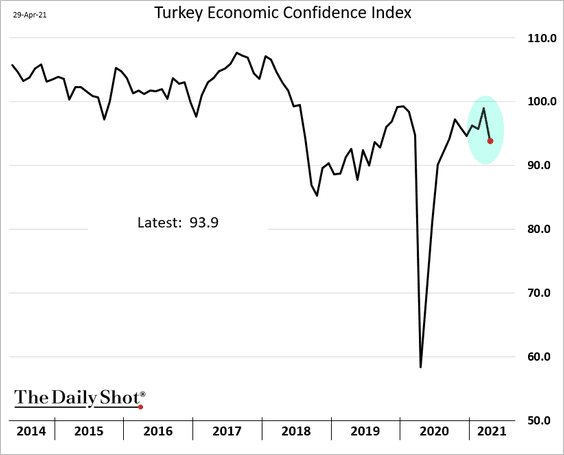
2. Turkey’s economic confidence deteriorated this month as the lira tumbled.
3. Here are some updates on North Korea.
• North Korea’s economy contracted over the past decade.
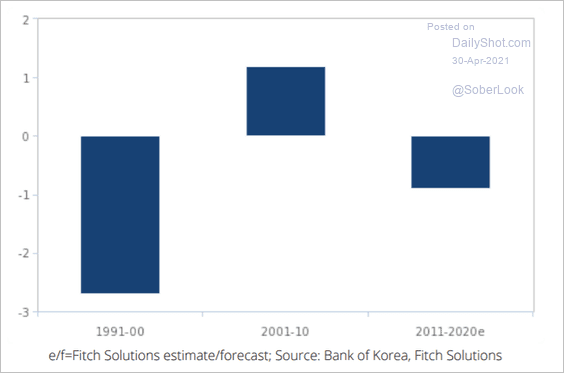 Source: Fitch Solutions Macro Research
• Here is how sanctions changed North Korean exports.
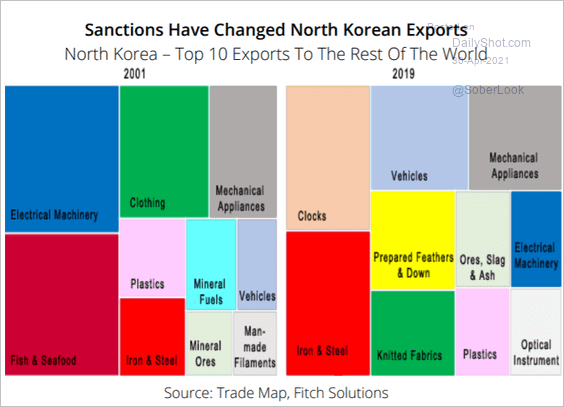 Source: Fitch Solutions Macro Research
• Trade with China has slowed.
 Source: Fitch Solutions Macro Research
——————–
4. Colombia’s debt has been trading at junk levels.
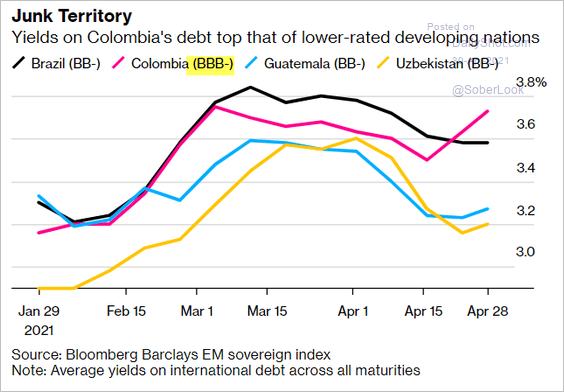 Source: Bloomberg Read full article
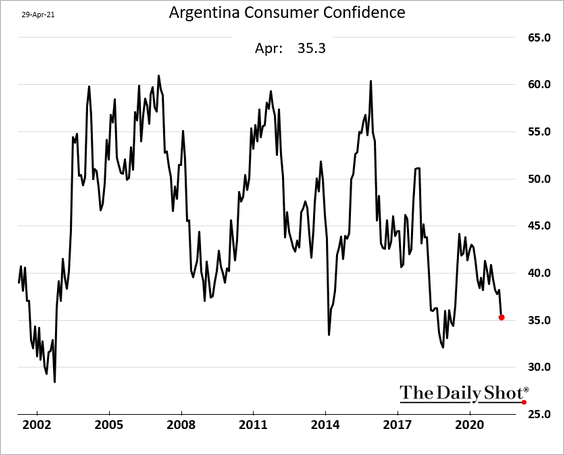
5. Argentina’s consumer confidence is deteriorating again.
6. China’s loans to other countries increasingly use confidentiality clauses.
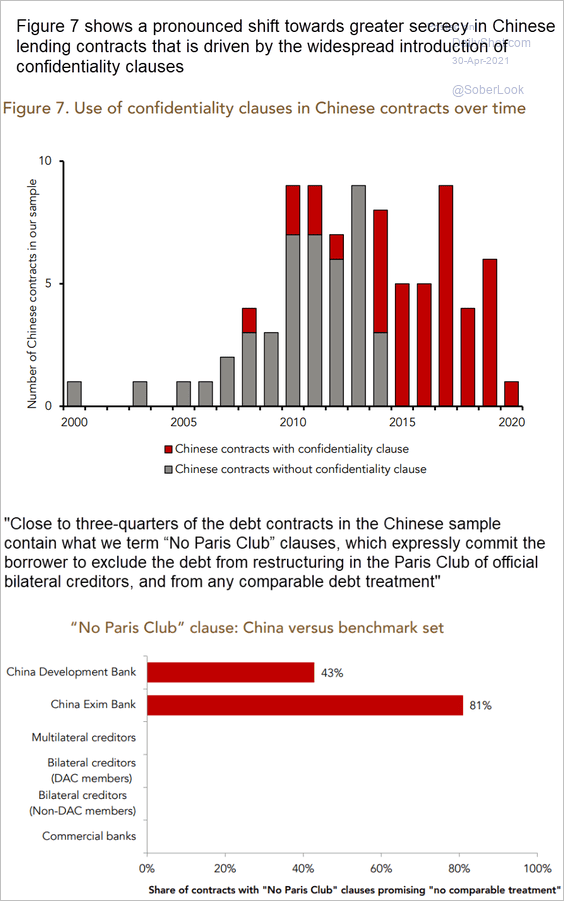 Source: Anna Gelpern, Sebastian Horn, Scott Morris, Brad Parks, Christoph Trebesch Read full article
Some of the borrowers are massively indebted to China.
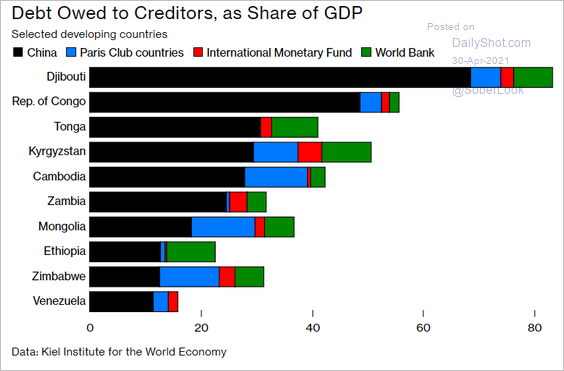 Source: Bloomberg Read full article
Back to Index
Cryptocurrency
1. Bitcoin has underperformed other large cryptocurrencies this month while XRP took the lead.
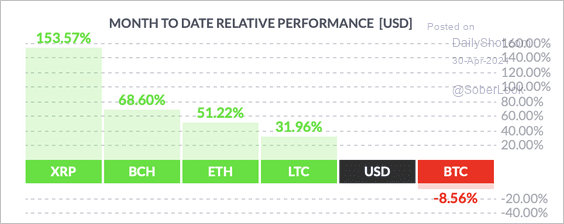 Source: FinViz
2. Ethereum is headed toward $3k.
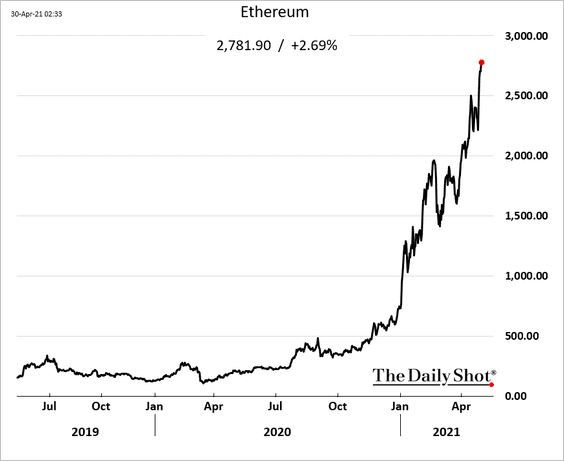
Ethereum (ETH) spot volumes have picked up since mid-April.
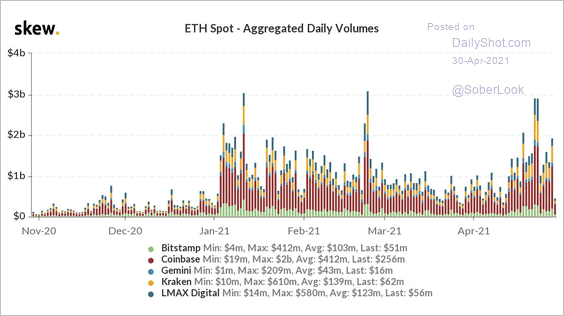 Source: @skewdotcom
——————–
3. Bitcoin performs well in risk-on environments.
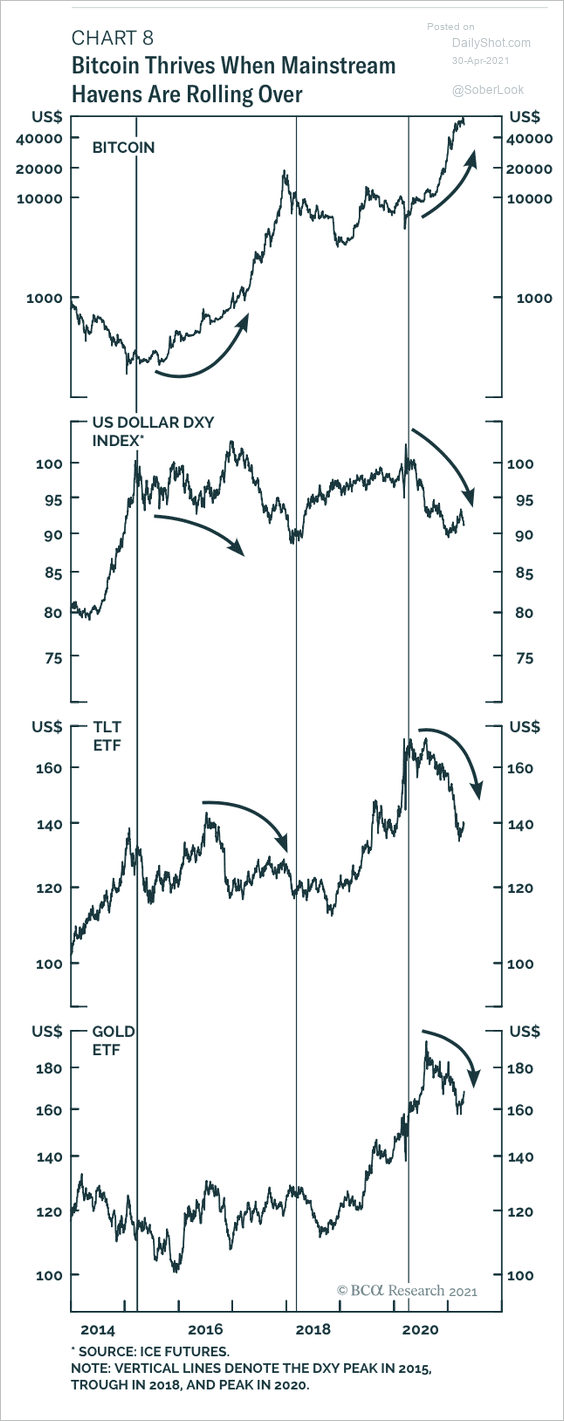 Source: BCA Research
4. Bitcoin price volatility is 15 times higher than the dollar.
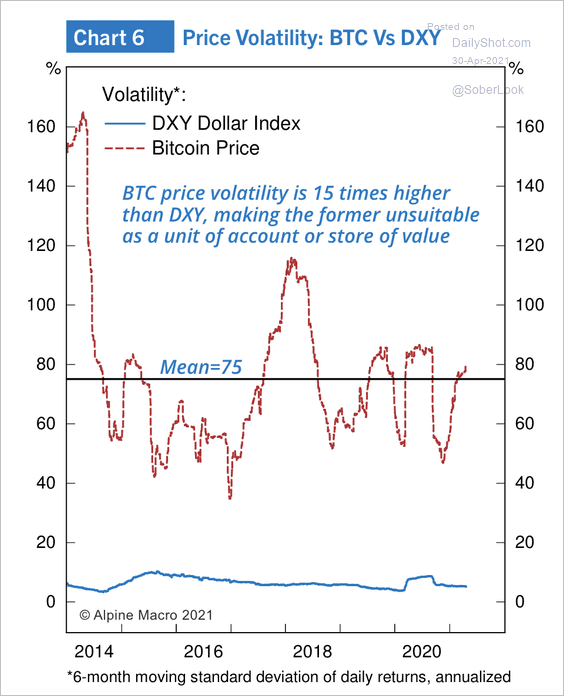 Source: Alpine Macro
5. The average daily turnover for cryptocurrencies is roughly 3% of the overall foreign exchange turnover, according to BCA Research.
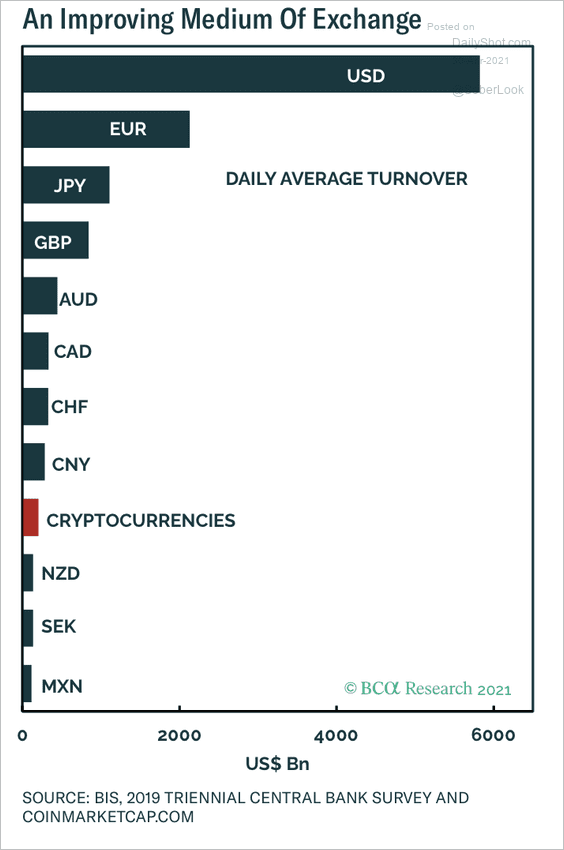 Source: BCA Research
6. This chart shows the rise in cryptocurrency market cap versus gold.
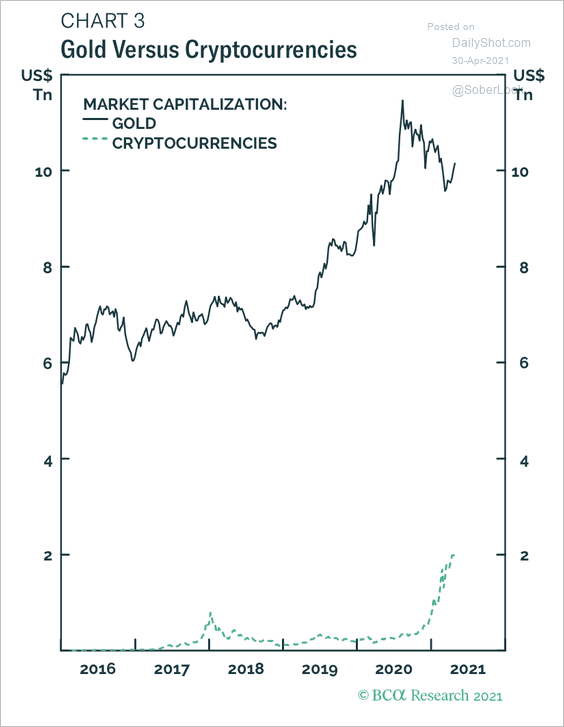 Source: BCA Research
7. Decentralized finance (DeFi) is now a $100 billion sector.
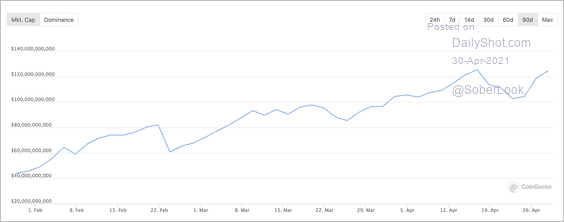 Source: CoinGecko
8. This chart compares the total funds entrusted in DeFi smart contracts to funds that went to founders in initial coin offerings (ICOs) during the 2017-2018 boom (right before the bust).
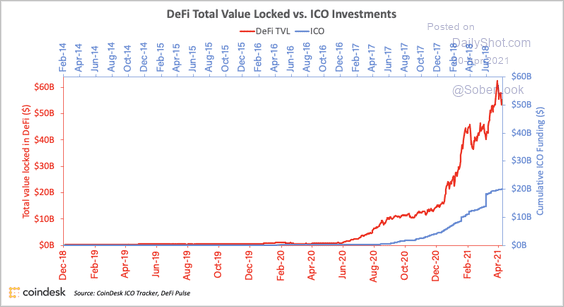 Source: CoinDesk Read full article
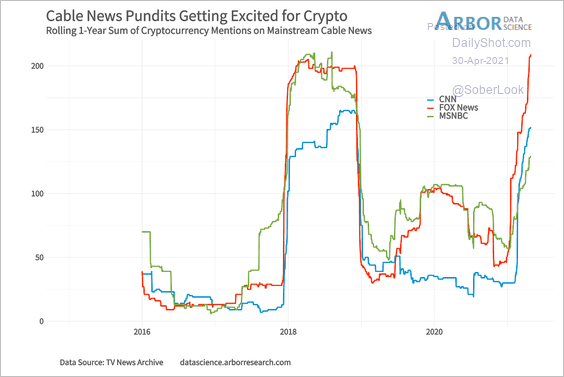
9. The media has been captivated by cryptocurrencies (2 chars).
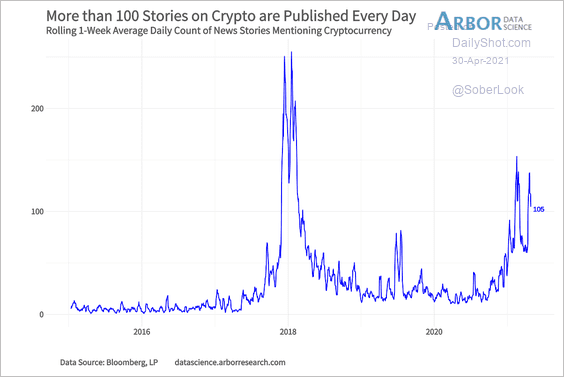 Source: Arbor Research & Trading
 Source: Arbor Research & Trading
Back to Index
Commodities
1. Gold demand held steady last quarter.
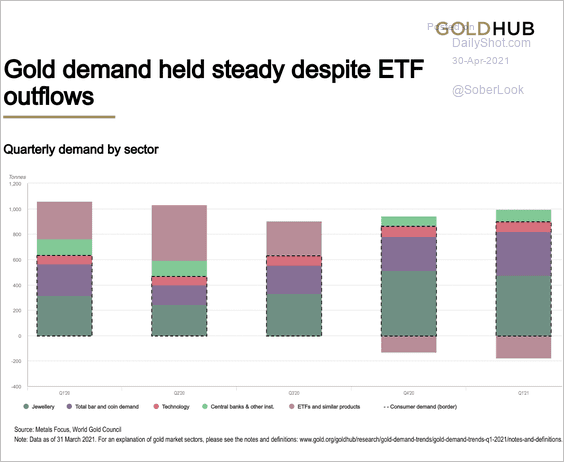 Source: Goldhub Read full article
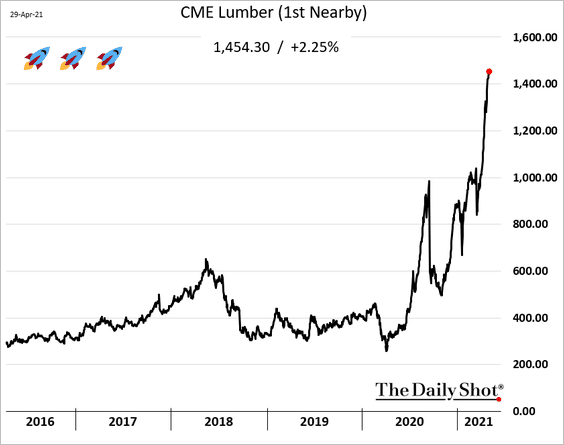
2. Time to cut down some of those trees in the backyard.
Back to Index
Energy
1. Global oil demand expectations were largely revised higher for 2021 this month.
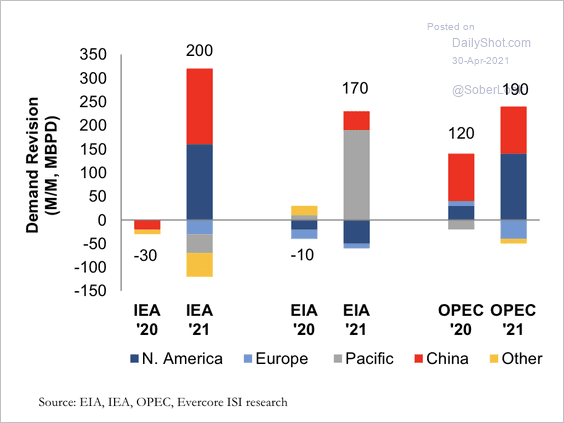 Source: Evercore ISI
The spread between Goldman’s pre-covid and current demand projections is tightening.
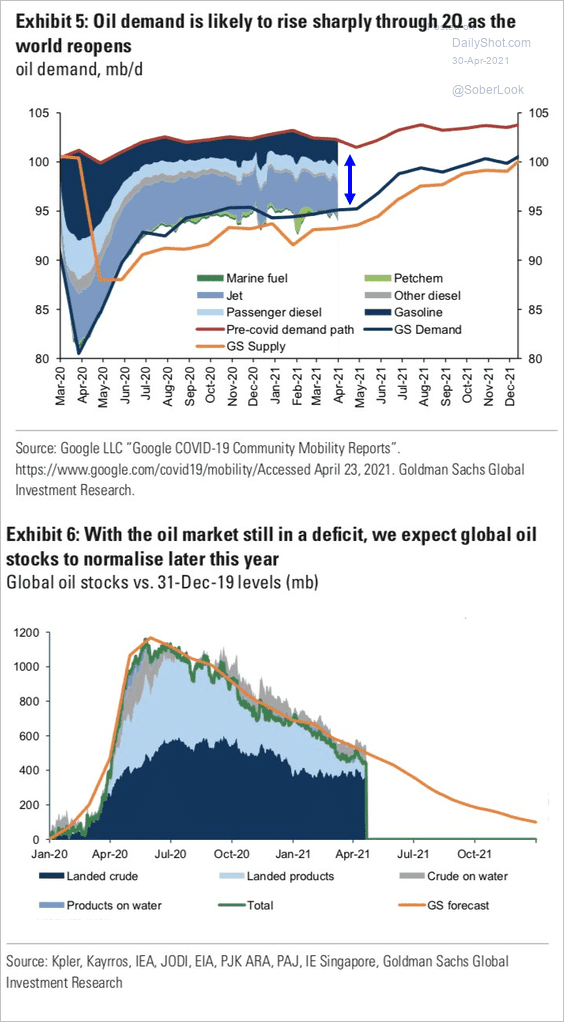 Source: Goldman Sachs; @HFI_Research
——————–
2. There is a close but nonlinear relationship between global oil demand and the Brent oil price.
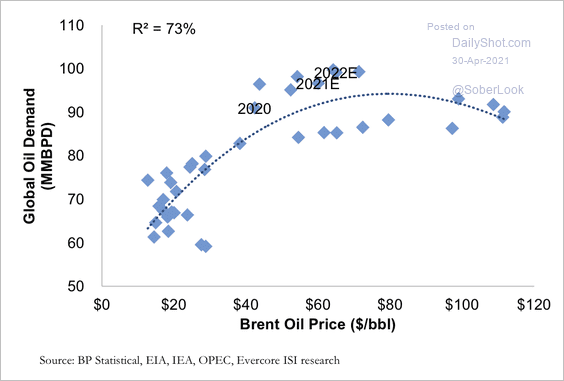 Source: Evercore ISI
3. Energy companies have diverging views on long-term oil demand.
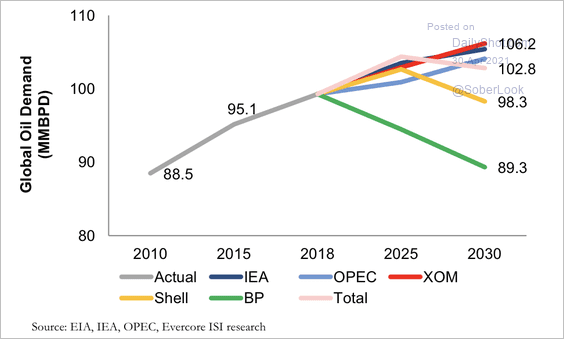 Source: Evercore ISI
4. Here is China’s energy consumption over time.
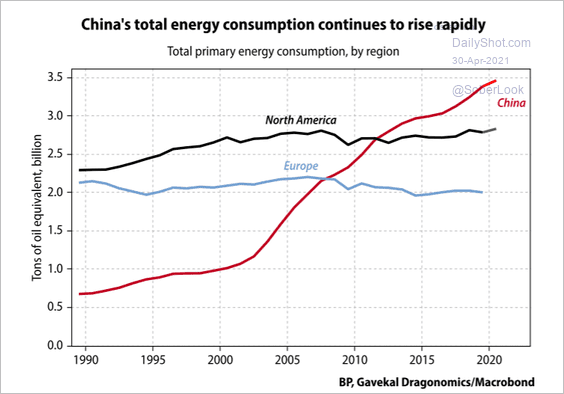 Source: Gavekal Research
5. This chart shows US wind and solar capacity.
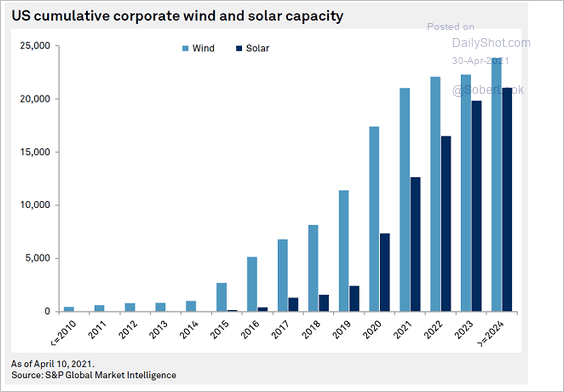 Source: S&P Global Market Intelligence
Back to Index
Equities
1. The proportion of S&P 500 companies beating earnings estimates hit a new record.
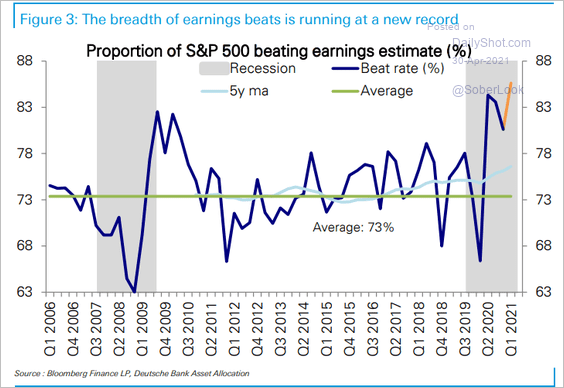 Source: Deutsche Bank Research
2. Here is an illustration of how reopening is impacting different sectors.
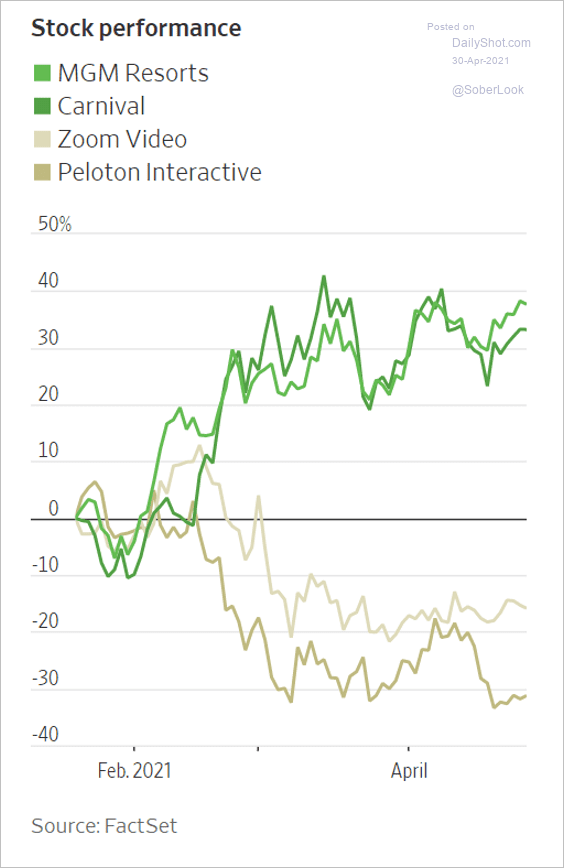 Source: @WSJ Read full article
3. Searches for trading content and strategies have retreated from last year’s craze.
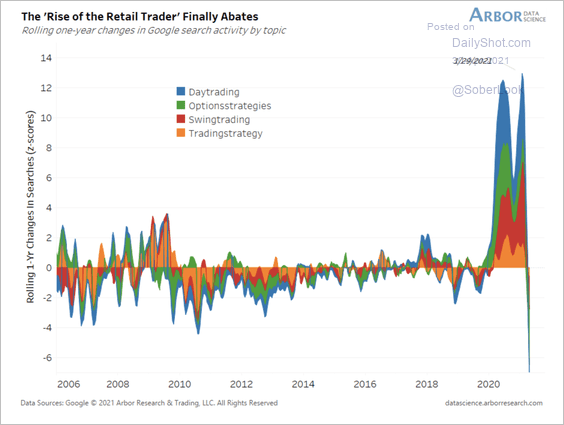 Source: Arbor Research & Trading
Investor searches have become more bearish over the past two weeks, which typically precede periods of elevated volatility.
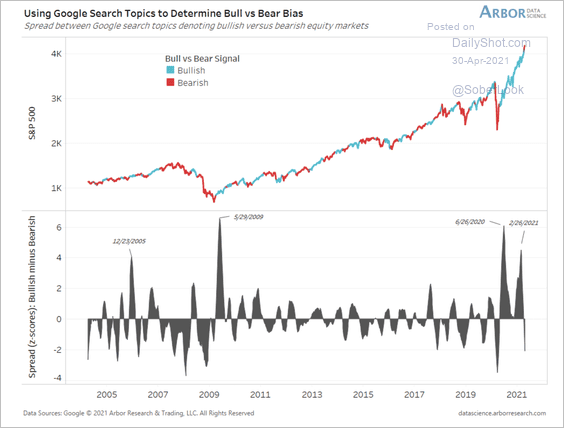 Source: Arbor Research & Trading
——————–
4. CTAs remain bullish.
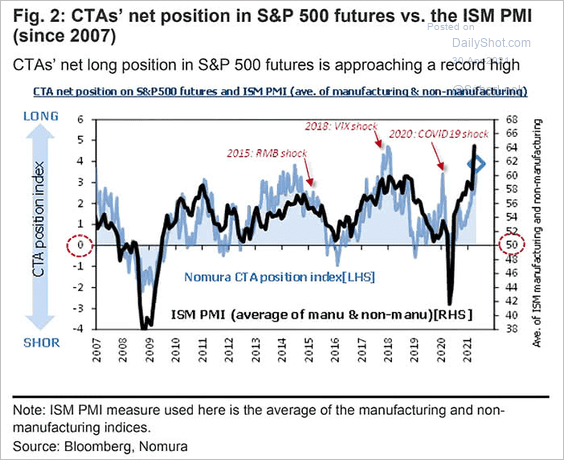 Source: @ISABELNET_SA, @Nomura
5. Dividends are recovering.
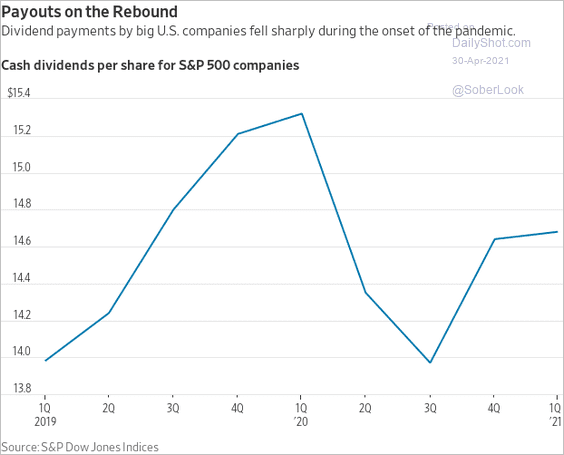 Source: @WSJ Read full article
6. This chart shows US households’ equity holdings by wealth category.
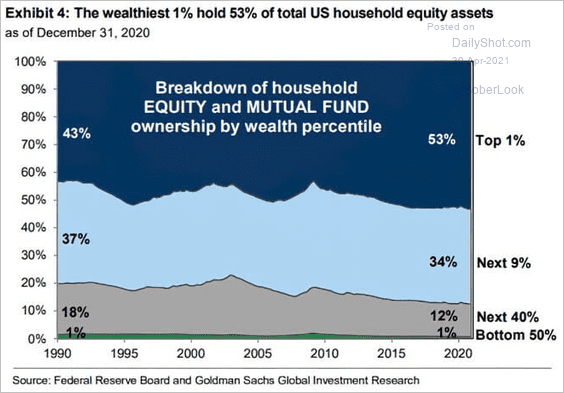 Source: @ISABELNET_SA, @GoldmanSachs
Back to Index
Credit
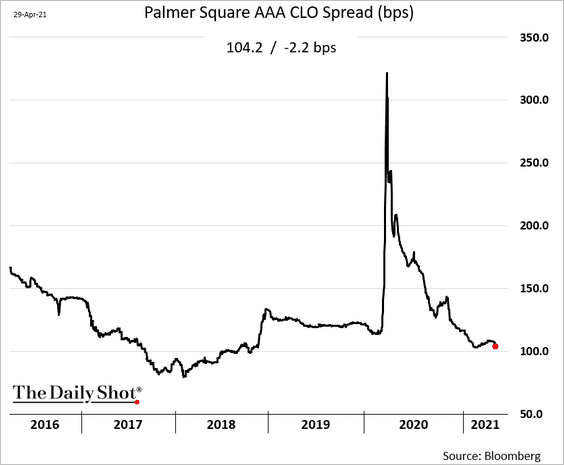
1. AAA CLO spreads have tightened substantially amid stronger demand from banks this year.
2. Leveraged loans’ amend-to-extend volume accelerated last month.
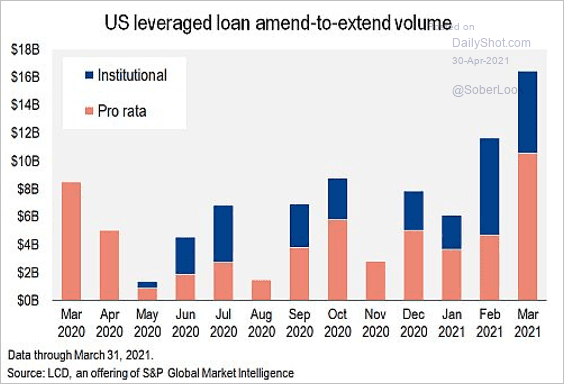 Source: @lcdnews
3. Covenant-lite share of leveraged loans outstanding is nearing 85%.
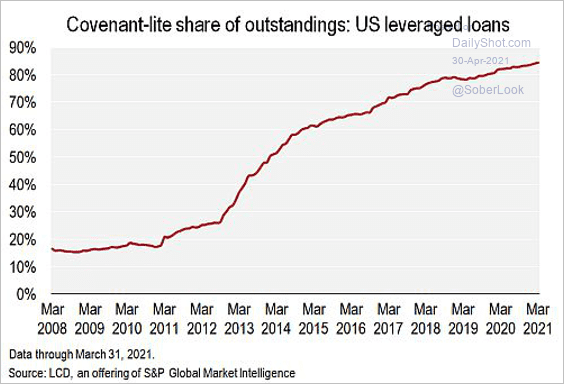 Source: S&P Global Market Intelligence
4. The private credit market is approaching $1 trillion.
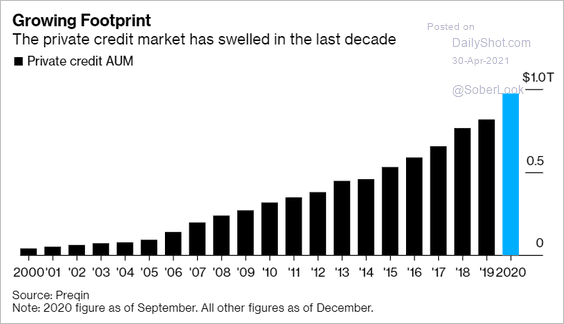 Source: @markets Read full article
Back to Index
Rates
1. Treasury bill yields are moving deeper into negative territory.
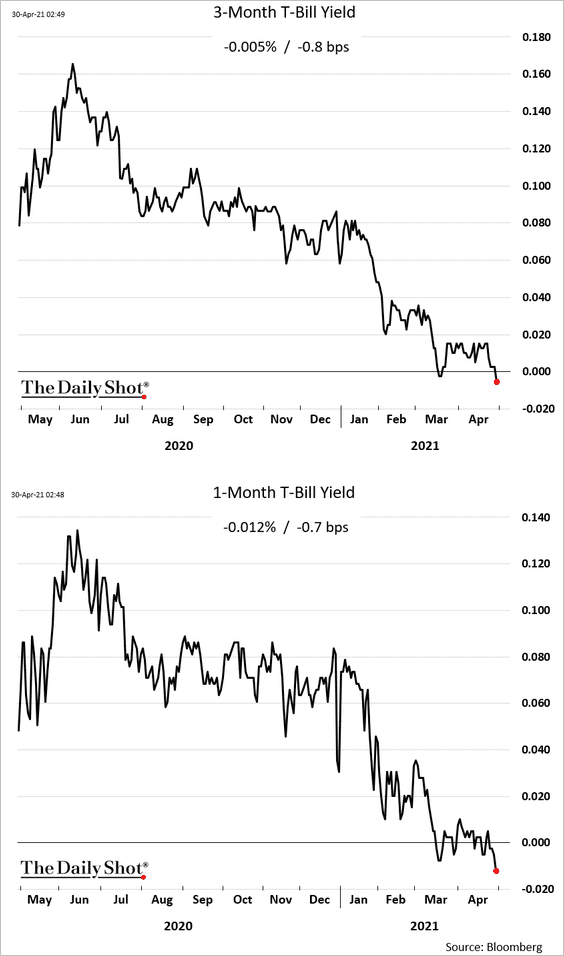
The government sold bills at zero yield again.
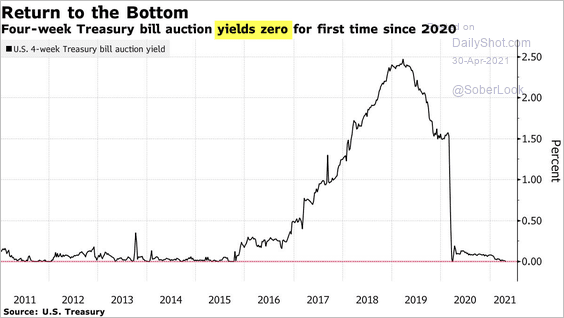 Source: @markets Read full article
——————–
2. Zero/negative money market rates have created strong demand for the Fed’s RRP program.
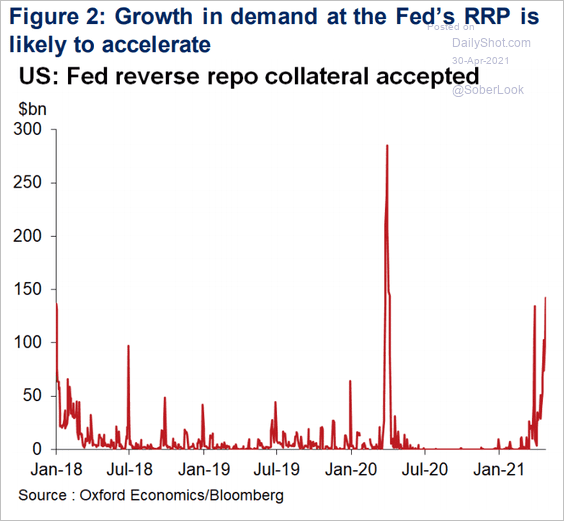 Source: Oxford Economics
3. This chart shows Morgan Stanley’s estimate of the US shadow overnight rate (extremely accommodative policy).
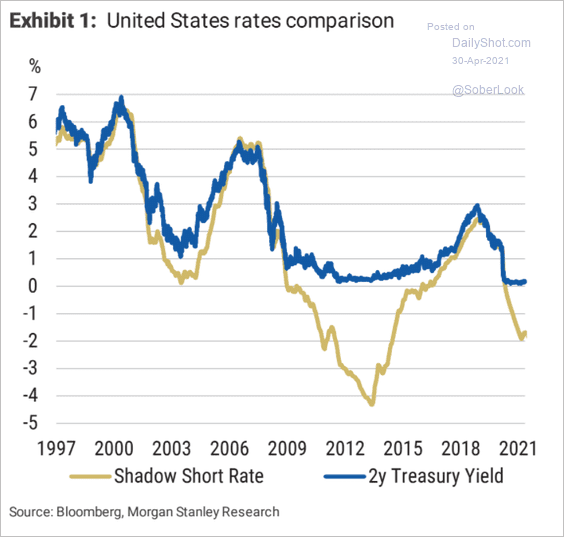 Source: Morgan Stanley Research
4. The market is very hawkish relative to the Fed dots.
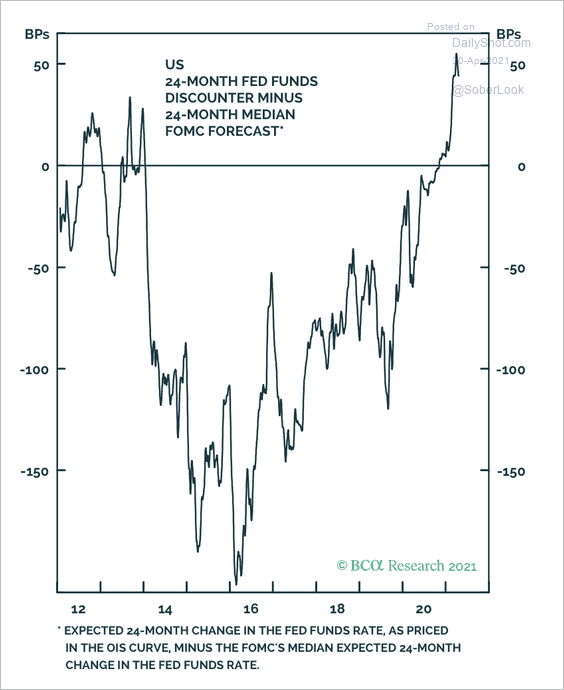 Source: BCA Research
5. The 10-year Treasury yield is entering a seasonally weak period.
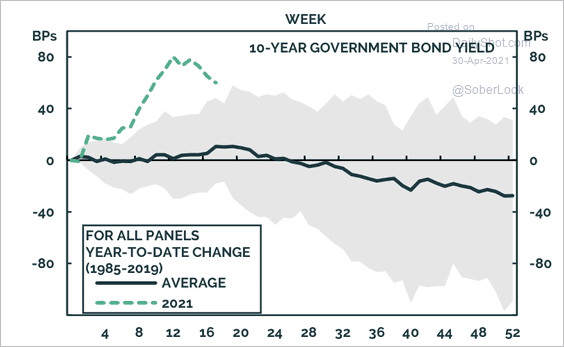 Source: BCA Research
——————–
Food for Thought
1. The world’s most valuable companies:
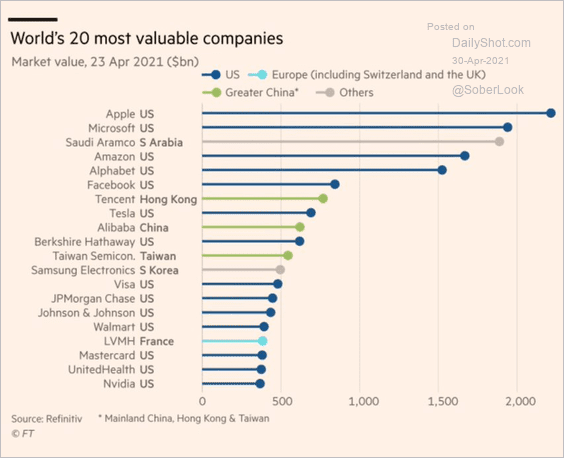 Source: @adam_tooze, @financialtimes Read full article
2. US agricultural trends:
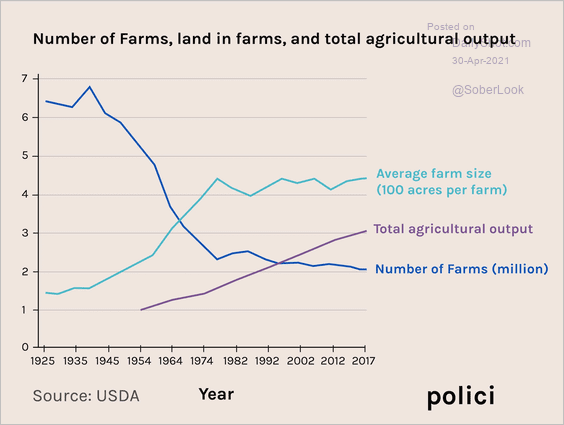 Source: polici Read full article
3. Office space per employee:
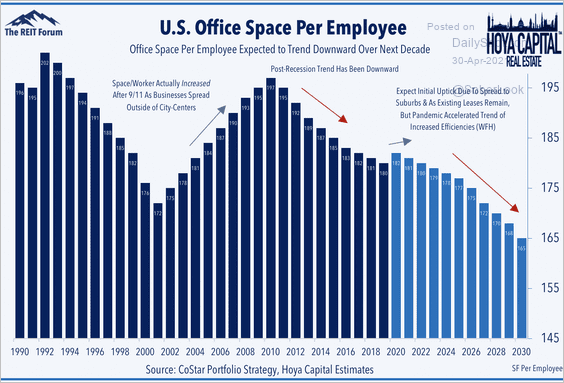 Source: Hoya Capital Real Estate
4. The purpose of education:
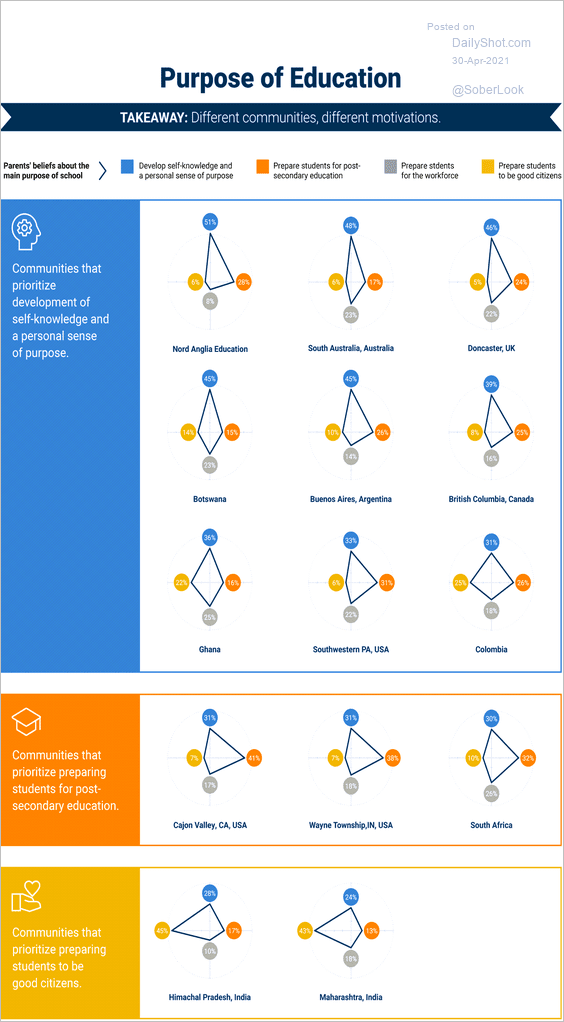 Source: Brookings Read full article
5. Universities with the most student loan originations:
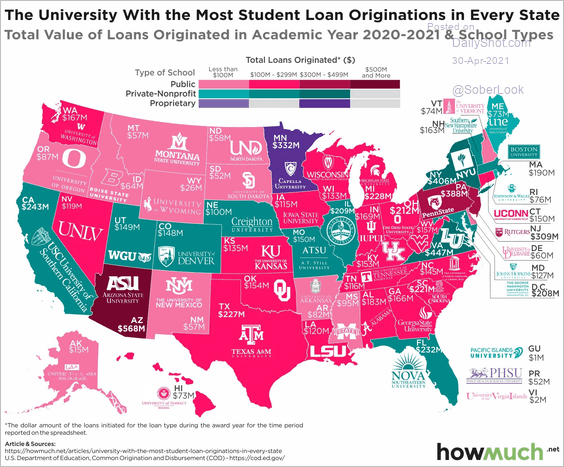 Source: @howmuch_net Read full article
6. Share of urban population:
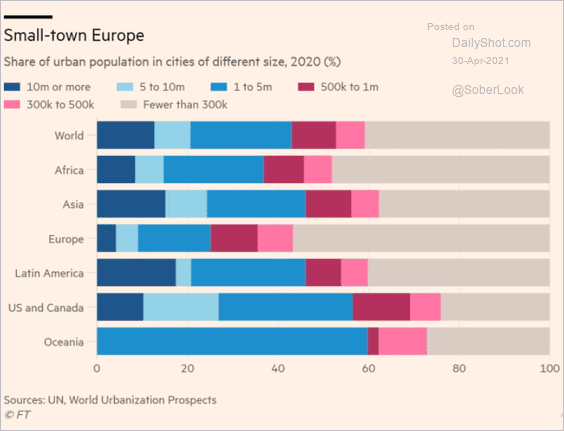 Source: @financialtimes Read full article
7. Black population in the US:
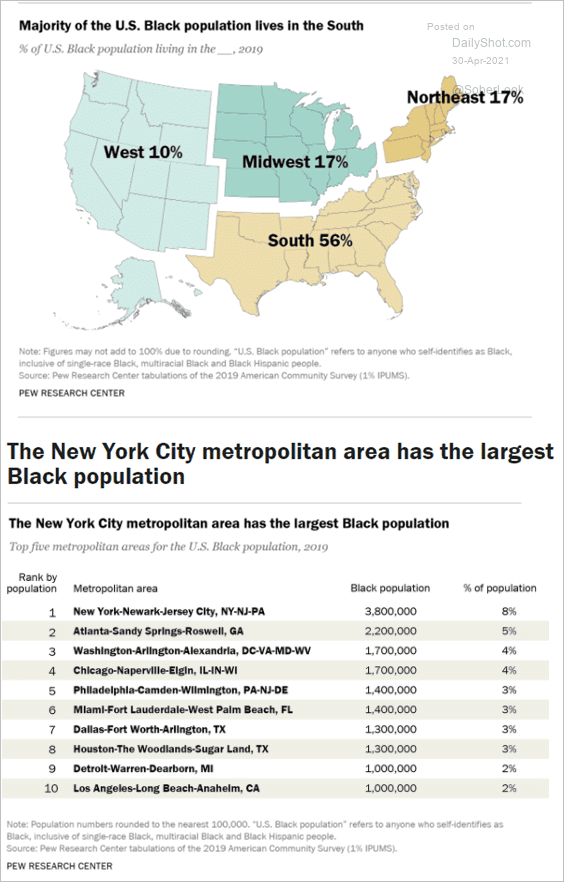 Source: Pew Research Center Read full article
8. EV sales by region:
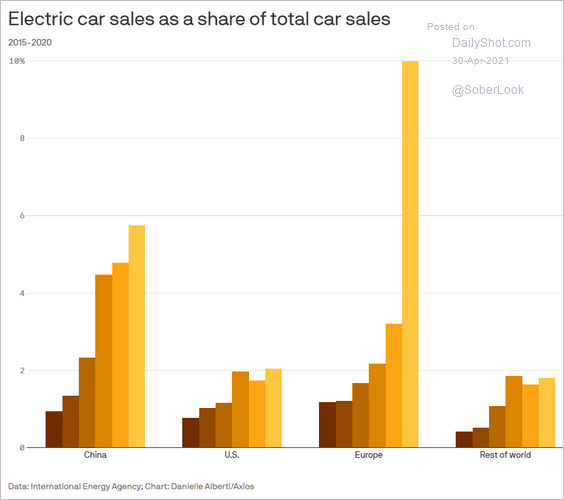 Source: @axios Read full article
9. Most-watched TV news interviews:
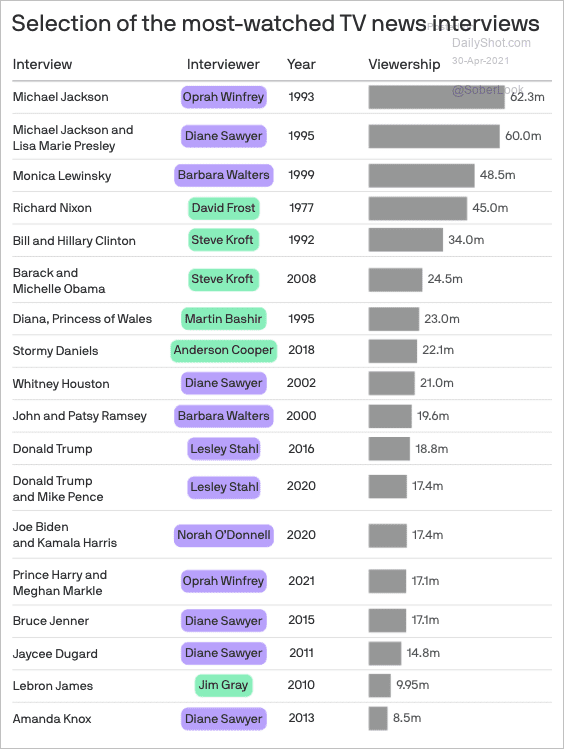 Source: @axios Read full article
——————–
Have a great weekend!
Back to Index