
The Daily Shot: 03-May-21
• The United States
• The Eurozone
• Asia – Pacific
• China
• Emerging Markets
• Cryptocurrency
• Commodities
• Equities
• Rates
• Food for Thought
The United States
1. Household incomes surged in March, driven by government checks.
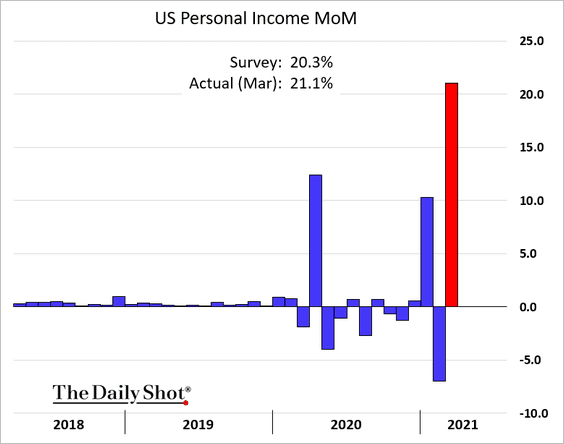
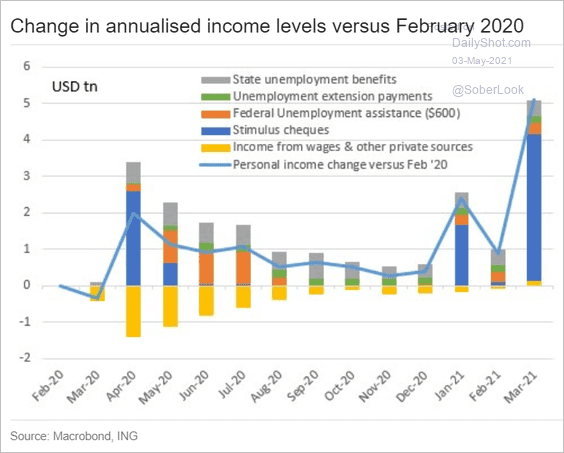 Source: ING
——————–
2. Spending increased sharply, …

… and is now above pre-COVID levels.
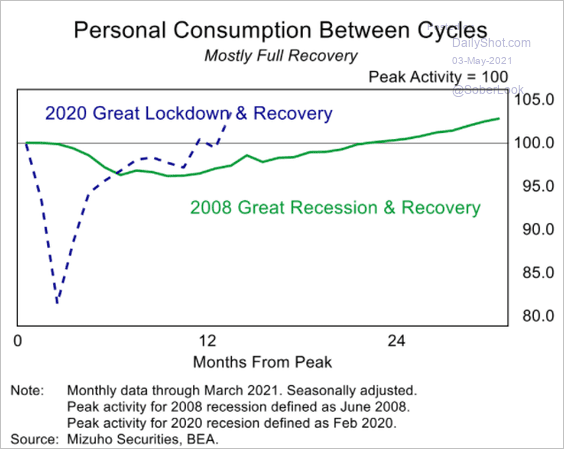 Source: Mizuho Securities USA
Below is a forecast for the whole year from Oxford Economics.
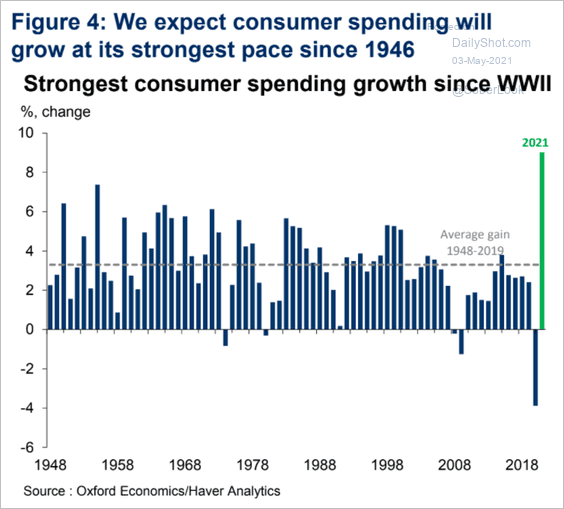 Source: Oxford Economics
——————–
3. Saving has been extremely high.
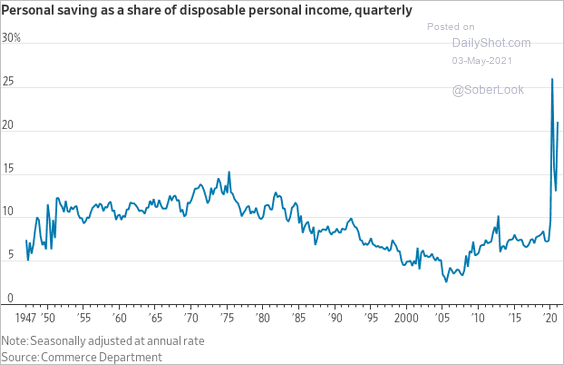 Source: @WSJ Read full article
Here is a comparison to 2008.
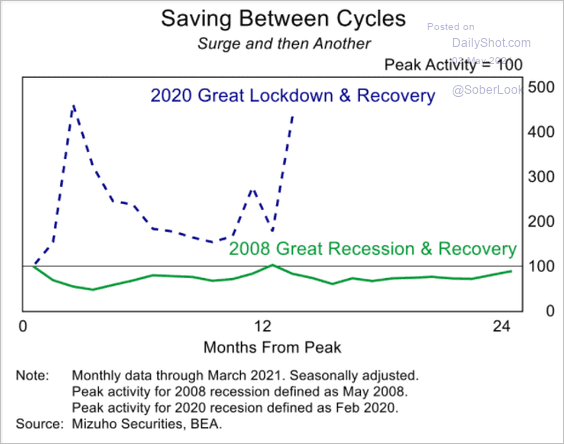 Source: Mizuho Securities USA
——————–
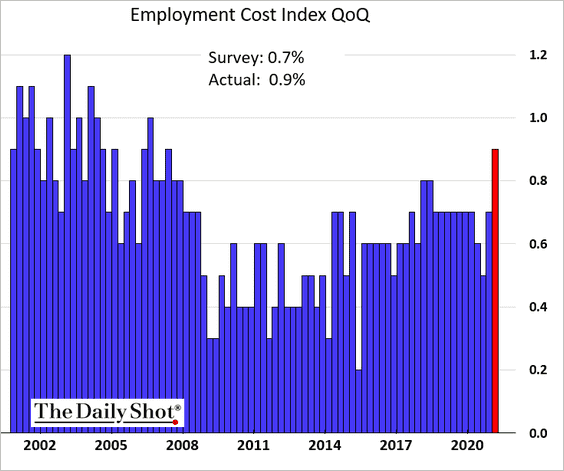
4. Next, we have some updates on wage growth.
• The employment cost index increased by most since 2007 in the first quarter.
• Wages are now above pre-COVID levels.
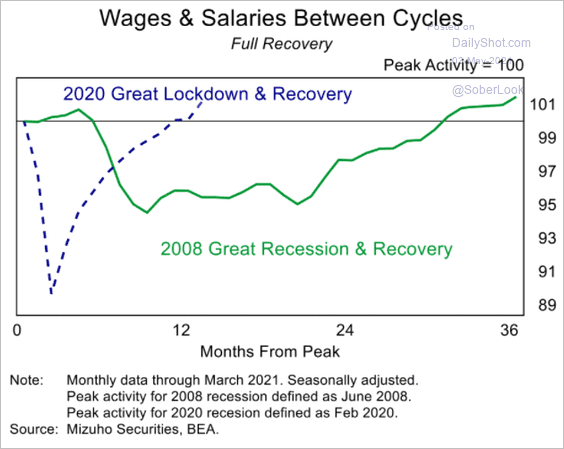 Source: Mizuho Securities USA
• Sustained gains in wage costs could boost inflation.
 Source: @markets Read full article
• Wages in low-skill occupations are rebounding from the pandemic-related slump.
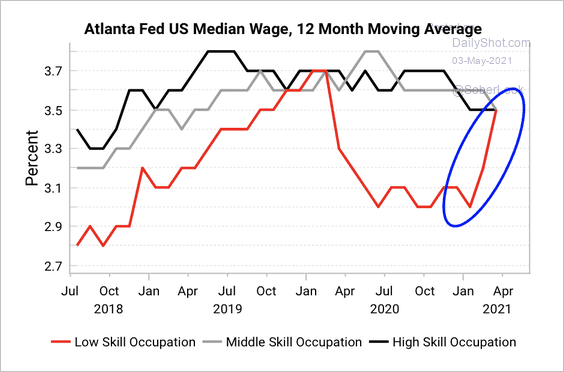 Source: Variant Perception
• Despite tight labor markets in recent years, wage inflation has remained subdued. Is it different this time?
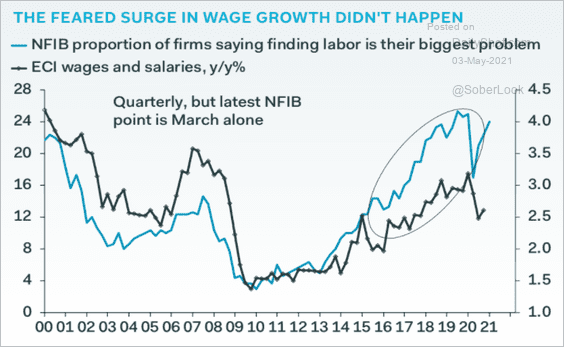 Source: Pantheon Macroeconomics
——————–
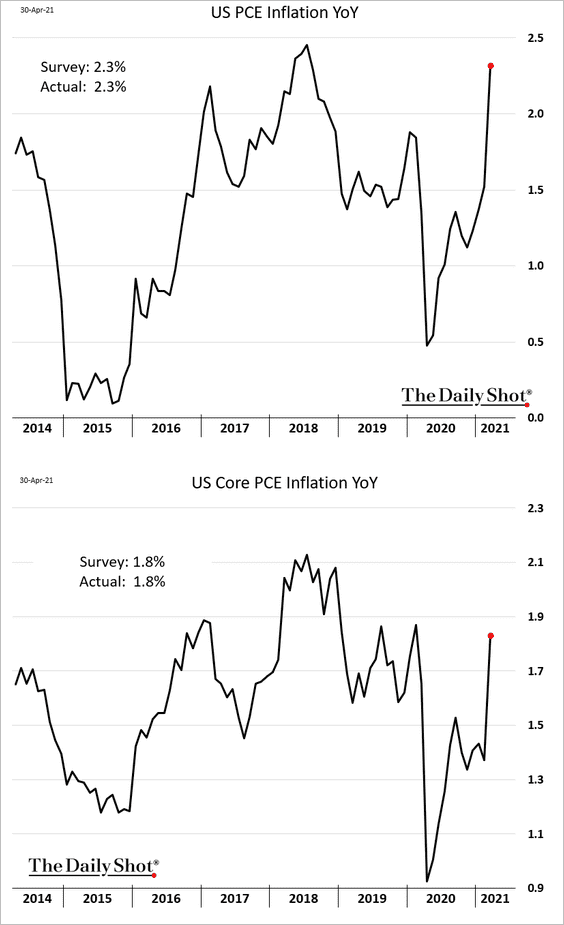
5. The PCE inflation report was roughly in line with expectations. The year-over-year figures are distorted to the upside by base effects.
Does the declining loan-to-deposit ratio point to softer inflation ahead?
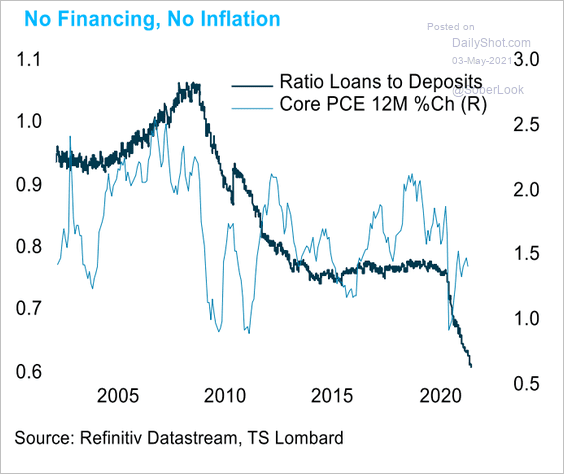 Source: TS Lombard
——————–
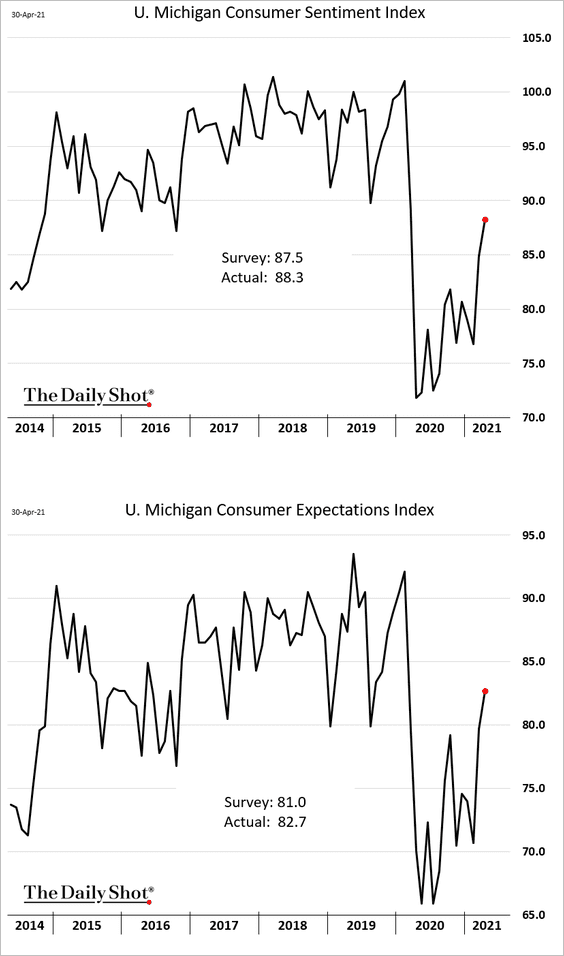
6. The updated April U. Michigan consumer sentiment index was even stronger than the prior report.
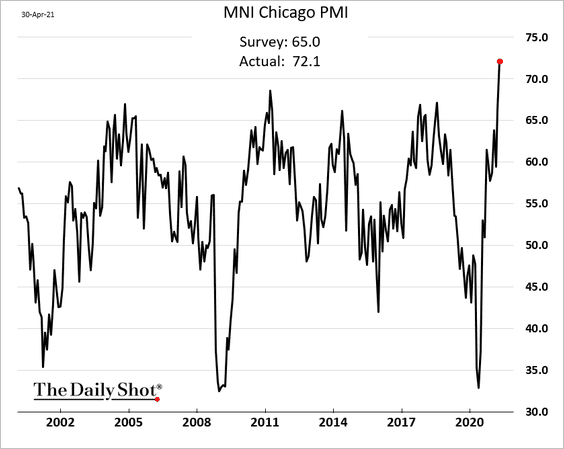
7. The Chicago PMI index hit a multi-decade high, pointing to remarkable strength in the manufacturing sector.
Here is a comparison to the ISM PMI at the national level.
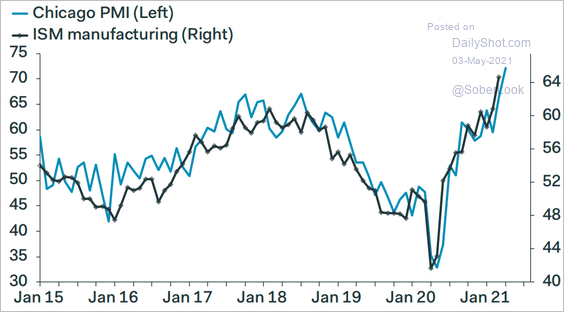 Source: Pantheon Macroeconomics
Back to Index
The Eurozone
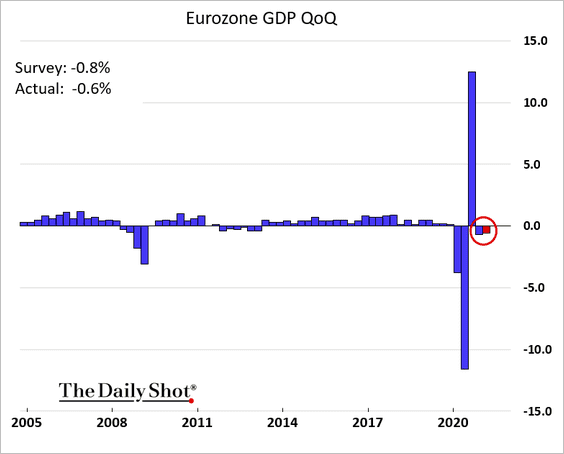
1. The euro area registered a double-dip recession in the first quarter, …
 Source: BBC Read full article
… lagging the US.
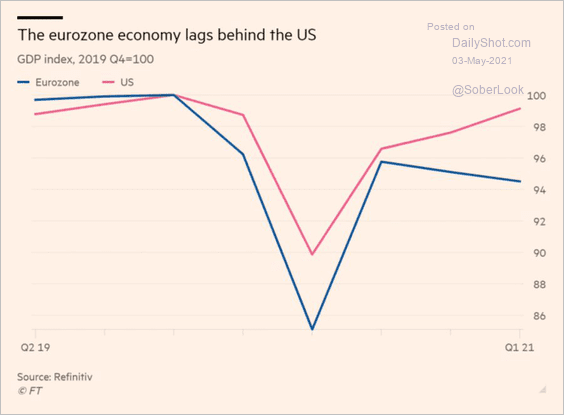 Source: @adam_tooze, @financialtimes Read full article
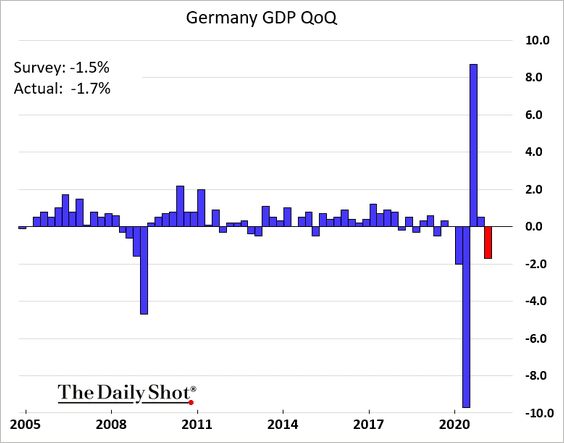
Here are the GDP trends by country.
• Germany (below consensus):
But economists expect robust growth for the rest of the year.
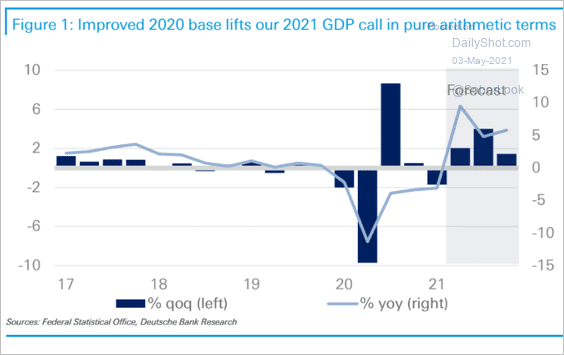 Source: Deutsche Bank Research
• France (above consensus; improved domestic demand):
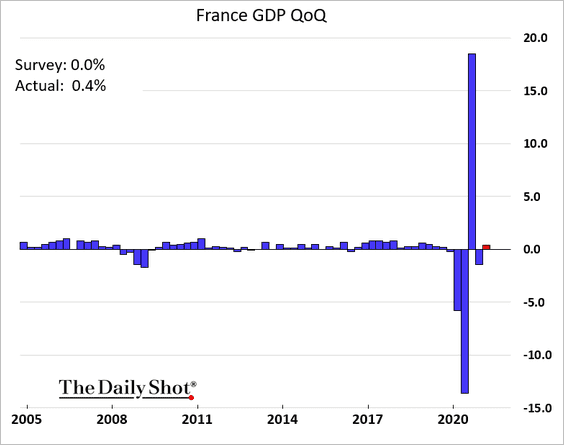
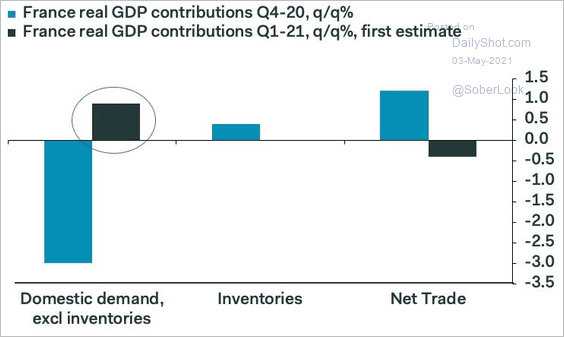 Source: Pantheon Macroeconomics
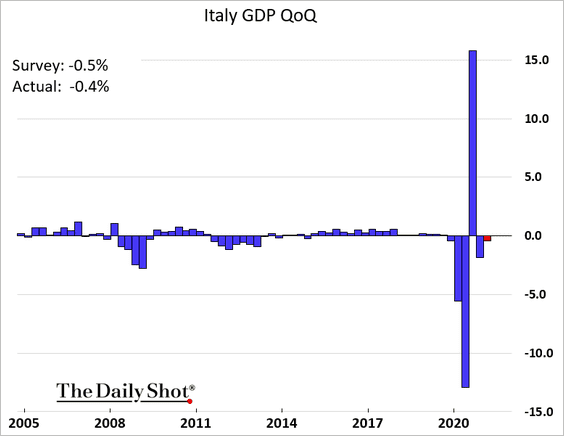
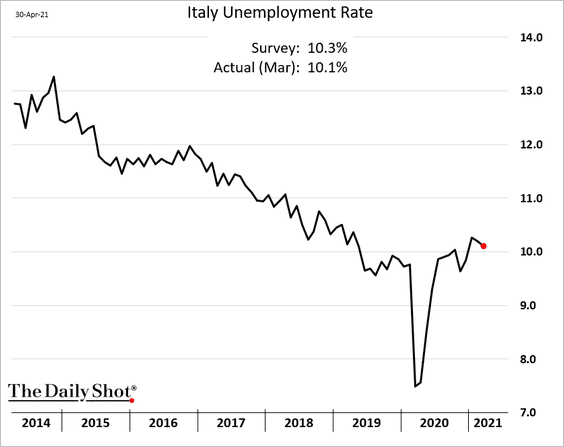
• Italy (not as severe as expected):
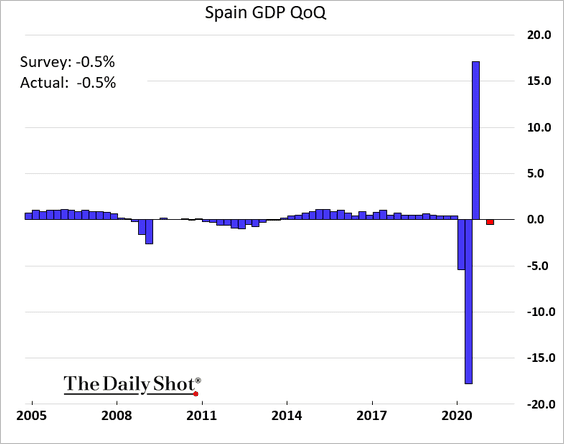
• Spain:
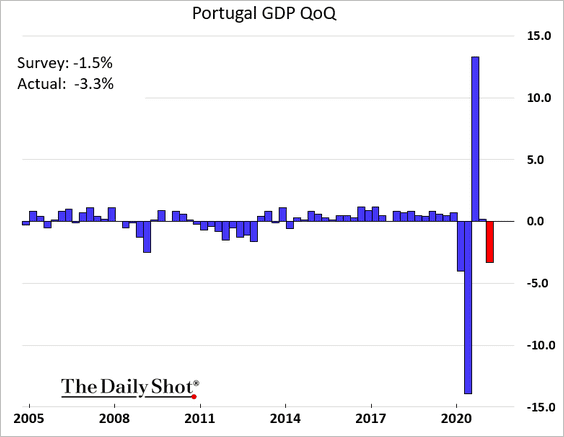
• Portugal (much worse than expected):
Here is a summary, …
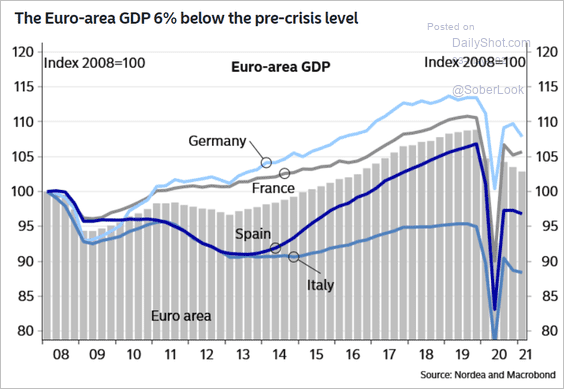 Source: Nordea Markets
… and a forecast.
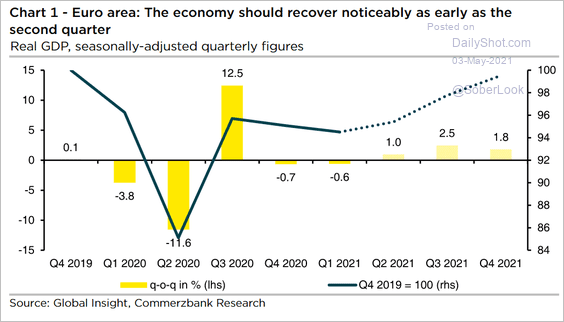 Source: Commerzbank Research
——————–
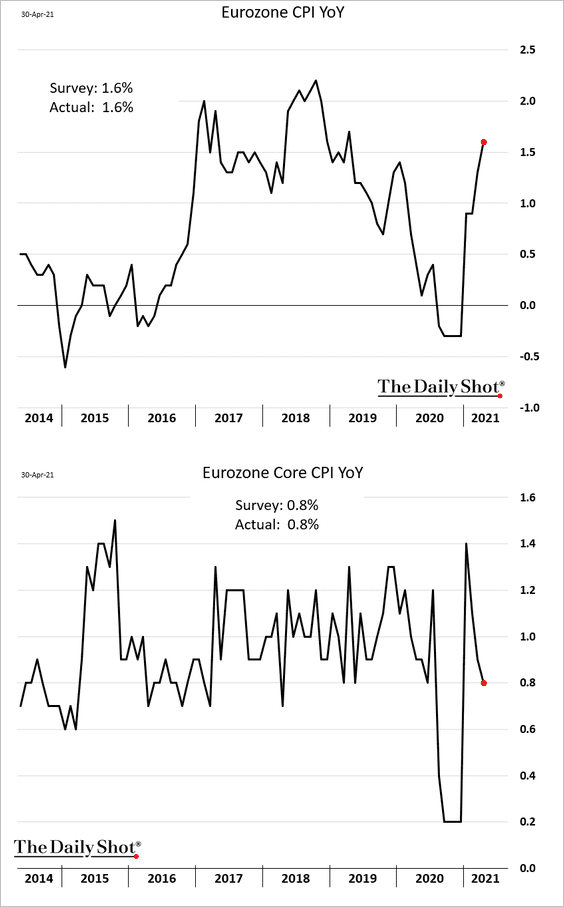
2. The euro-area CPI was in line with expectations, …
… with the headline inflation increase driven by energy.
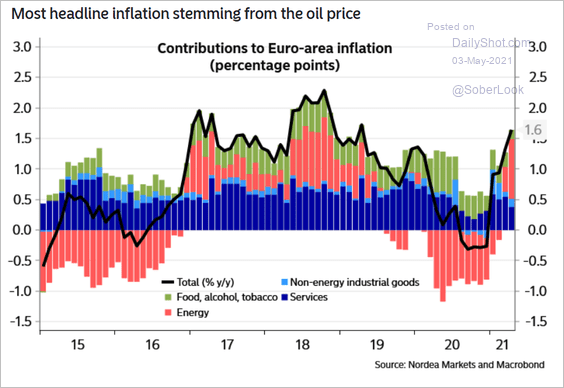 Source: Nordea Markets
Here are the contributions to the core CPI.
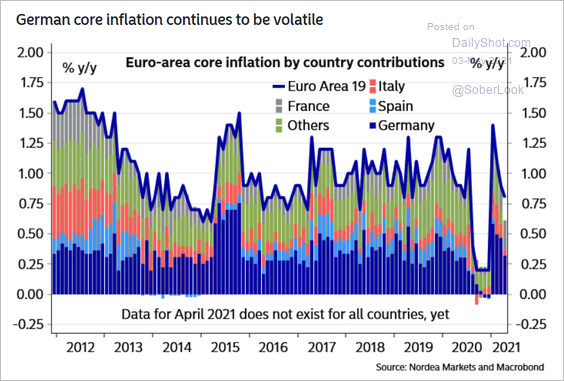 Source: Nordea Markets
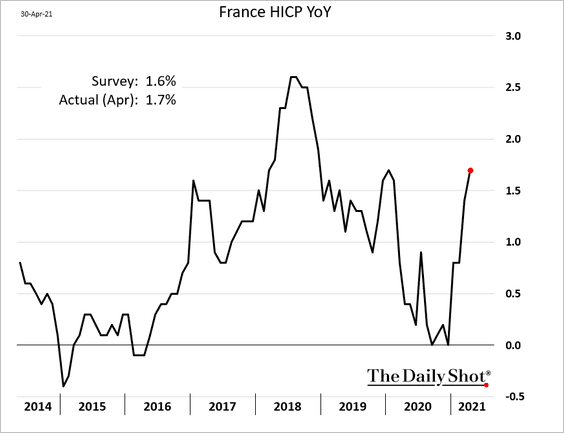
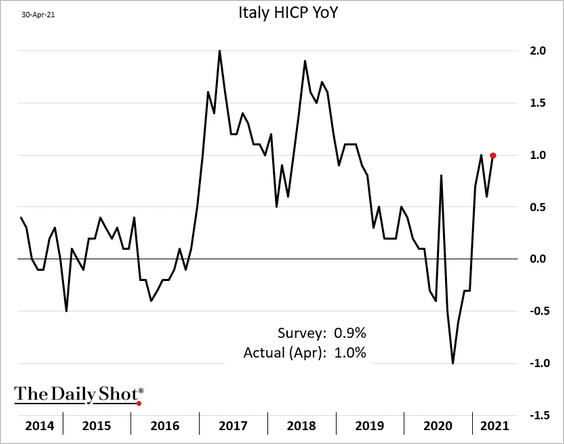
Both French and Italian inflation reports were a bit above consensus.
——————–
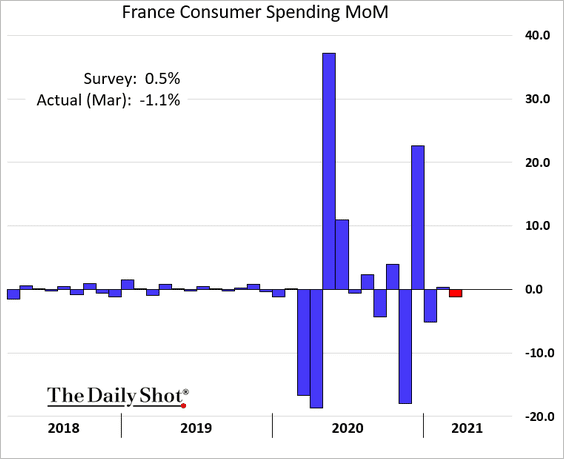
3. French consumer spending unexpectedly declined in March.
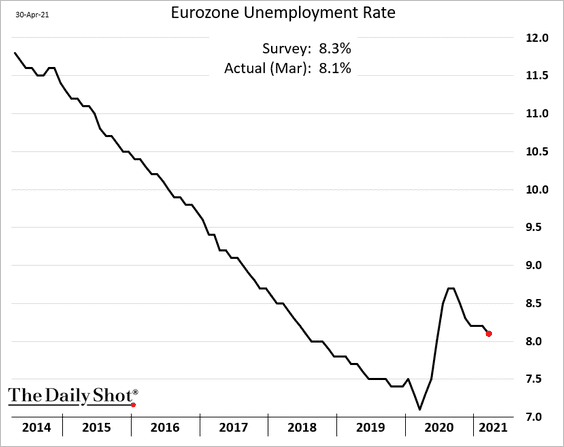
4. The euro-area unemployment rate was below forecasts.
——————–
5. The S&P Eurozone sovereign bond index yield is now positive.
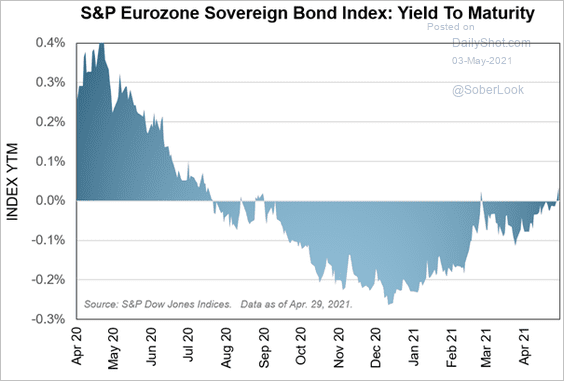 Source: S&P Global Market Intelligence
6. This chart shows the euro-area shadow rate.
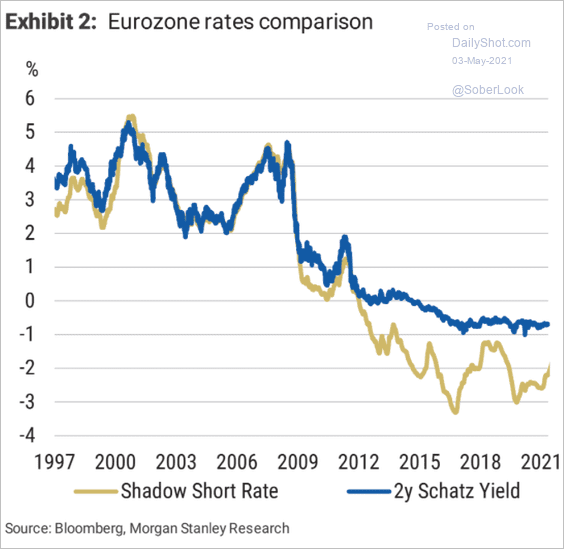 Source: Morgan Stanley Research
Back to Index
Asia – Pacific
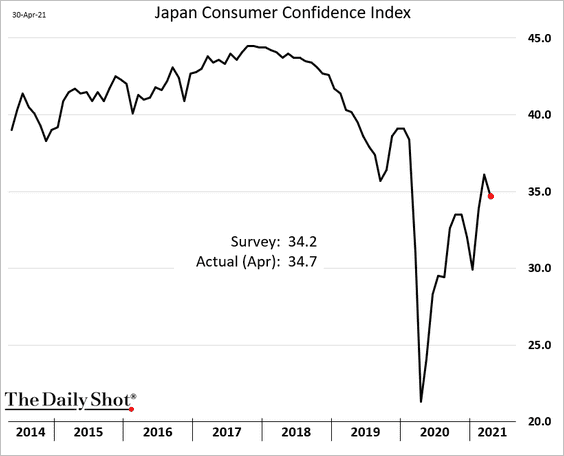
1. Japan’s consumer confidence declined less than expected amid a spike in COVID cases.
2. South Korea’s trade surplus unexpectedly collapsed, driven by higher imports.
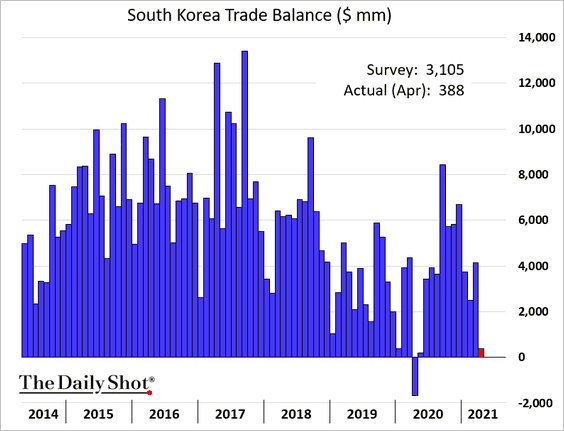
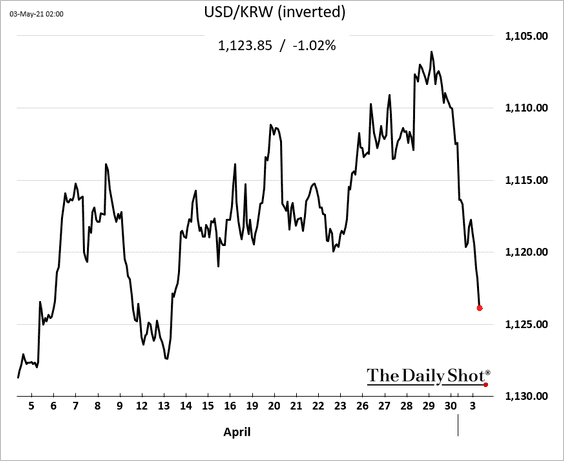
The won slumped in response.
South Korea’s manufacturing growth remains robust.
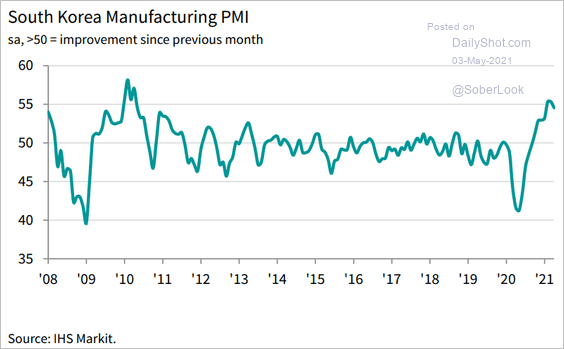 Source: IHS Markit
——————–
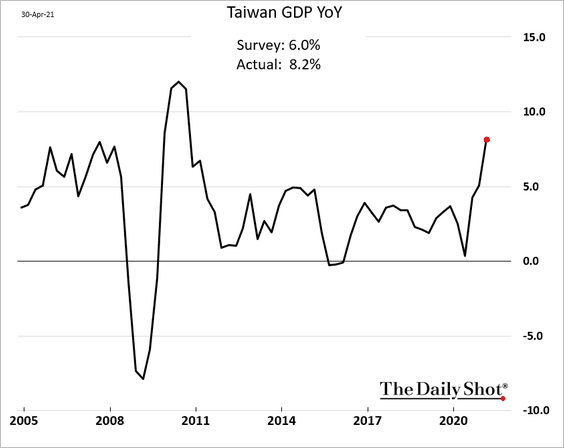
3. Taiwan’s GDP growth surprised to the upside.
Factory activity accelerated further in April.
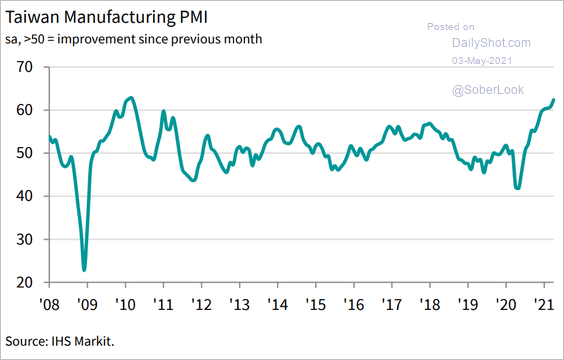 Source: IHS Markit
——————–
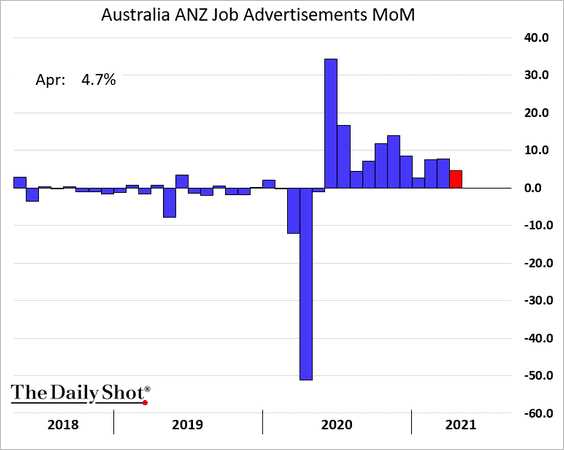
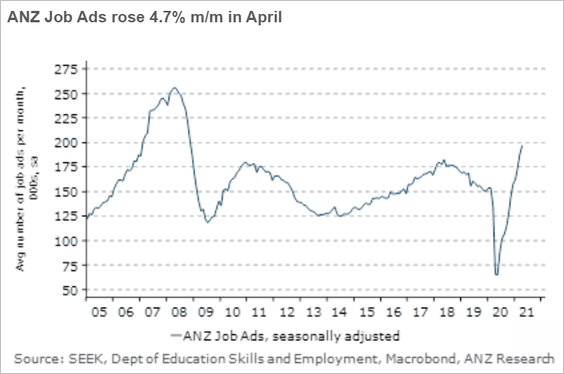
4. Australia’s job ads continue to climb, hitting the highest level in over a decade.
Back to Index
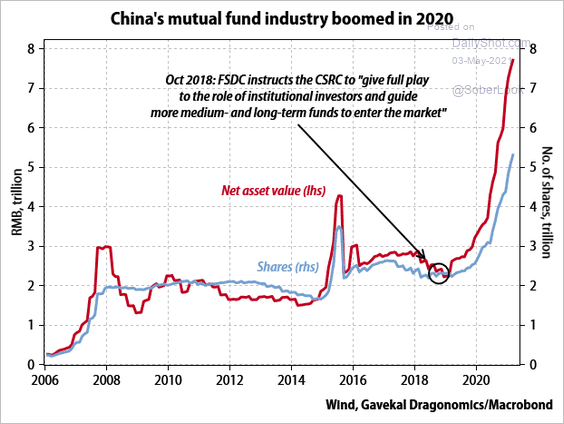
China
1. The mutual fund industry has been booming.
 Source: Gavekal Research
But returns have been linked to concentrated portfolios.
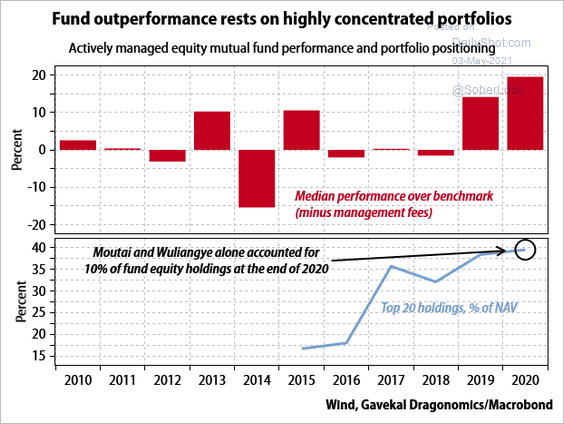 Source: Gavekal Research
——————–
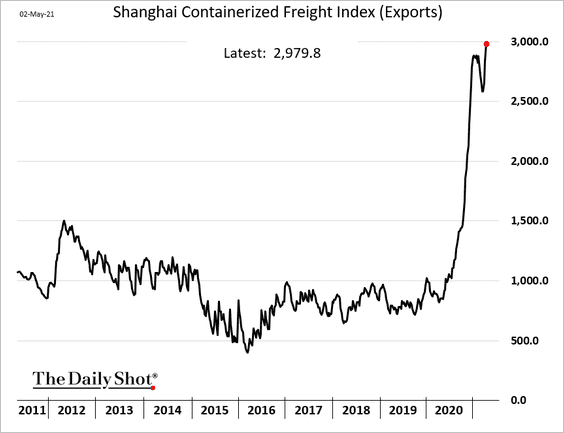
2. Container shipping rates continue to surge.
Back to Index
Emerging Markets
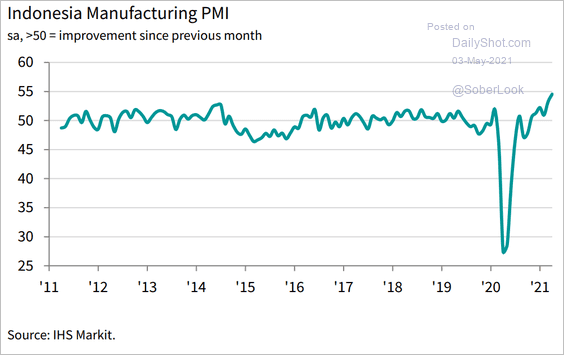
1. Let’s run through the April PMI charts for EM Asia.
• Indonesia (accelerating):
 Source: IHS Markit
• The Philippines (contracting again):
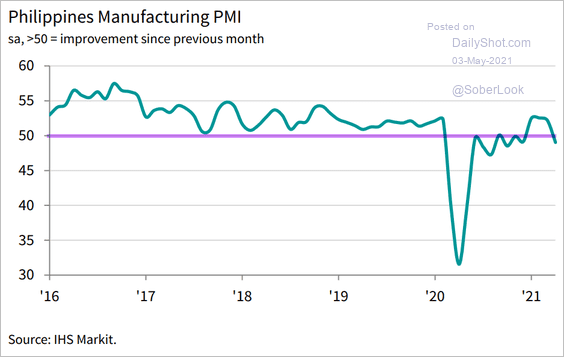 Source: IHS Markit
• Malaysia (accelerating):
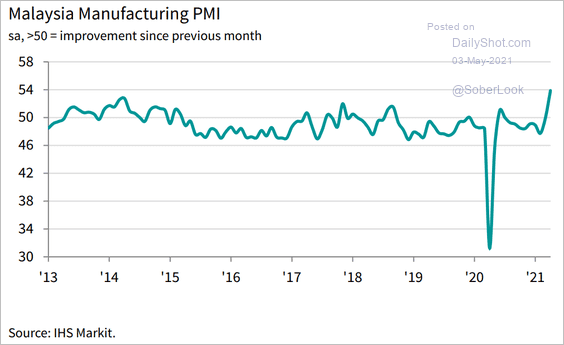 Source: IHS Markit
• India (still growing):
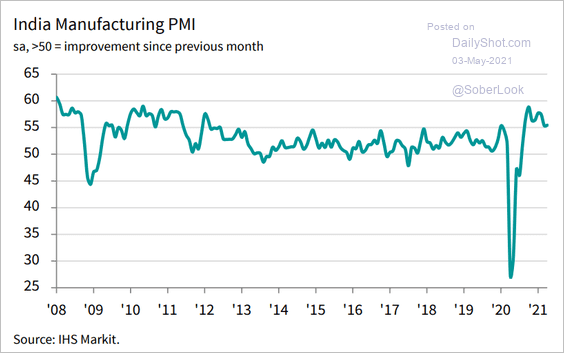 Source: IHS Markit
——————–
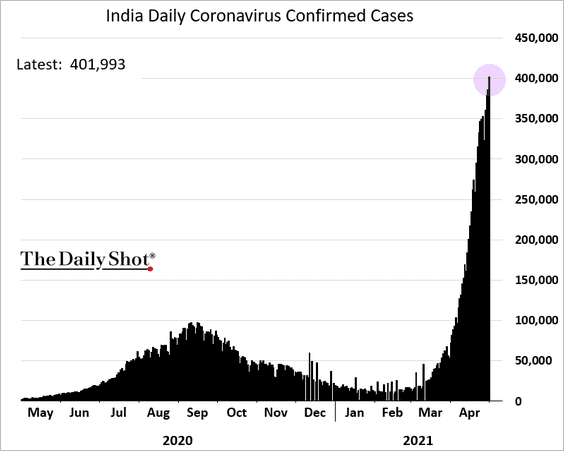
2. India’s COVID cases exceeded 400,000 per day.
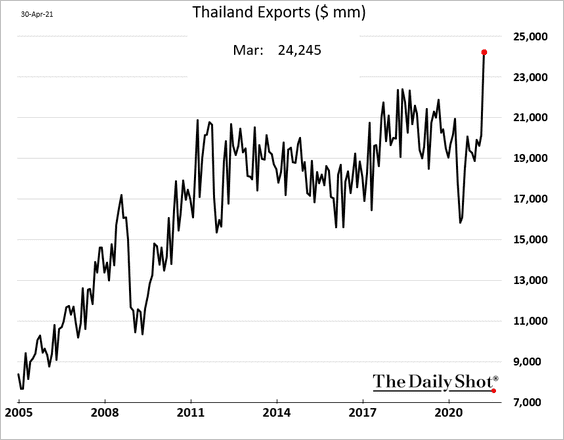
3. Thai exports surged in March.
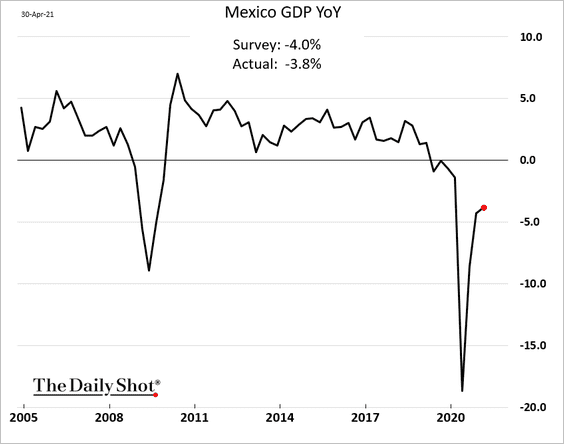
4. Mexico’s GDP recovery will take time.
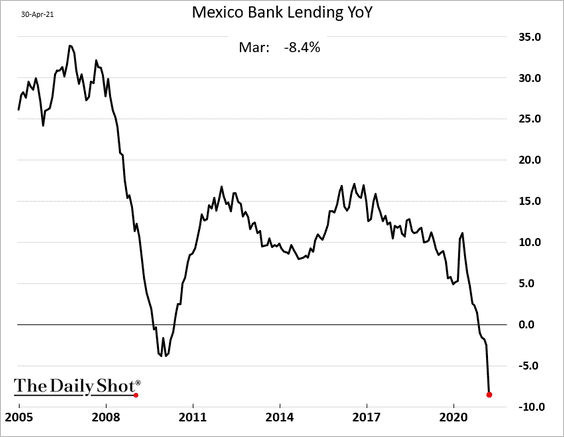
Credit growth has slowed.
Back to Index
Cryptocurrency
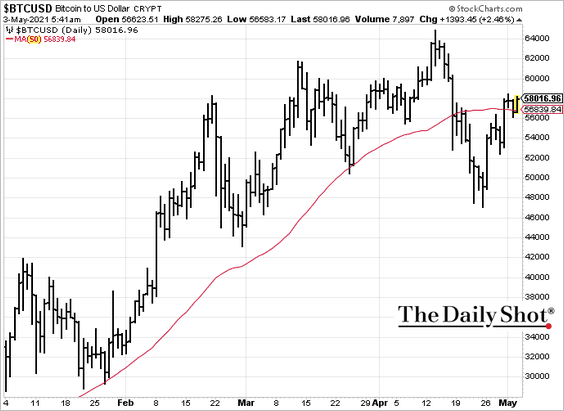
1. Bitcoin is above the 50-day moving average.
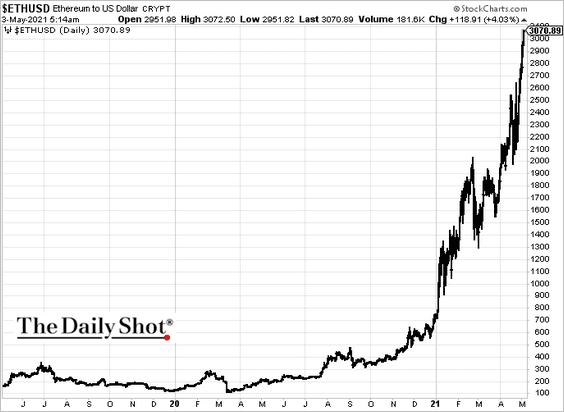
2. Ethereum broke above $3k.
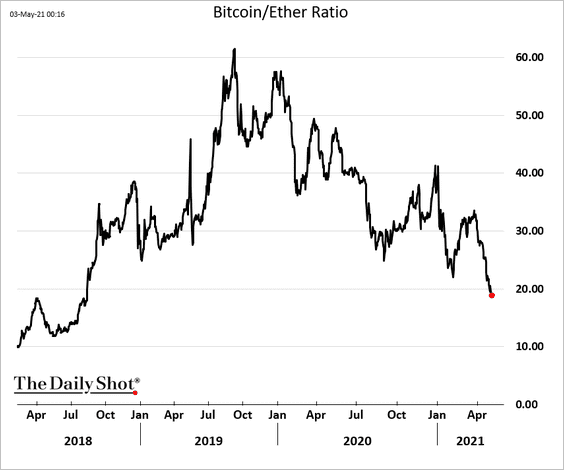
Here is the Etherium/Bitcoin ratio.
——————–
3. Bitcoin fund flows have been soft.
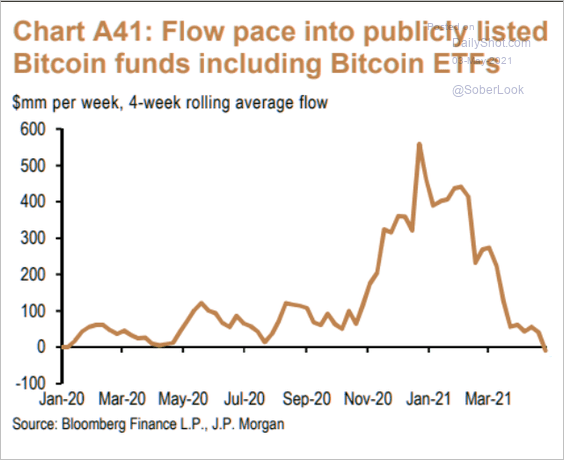 Source: JP Morgan, @themarketear
4. Tether’s market cap surged this year as crypto trading activity accelerated.
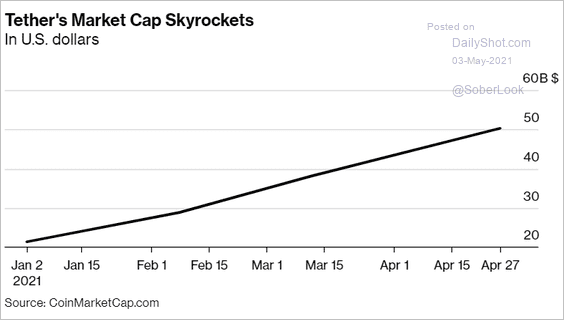 Source: @markets Read full article
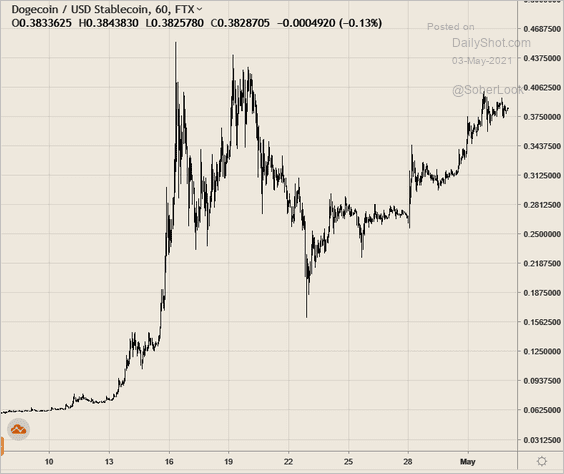
5. Taking Dogecoin to the moon …
 Source: Decrypt Read full article
Back to Index
Commodities
1. The CME lumber futures surged past $1,500.
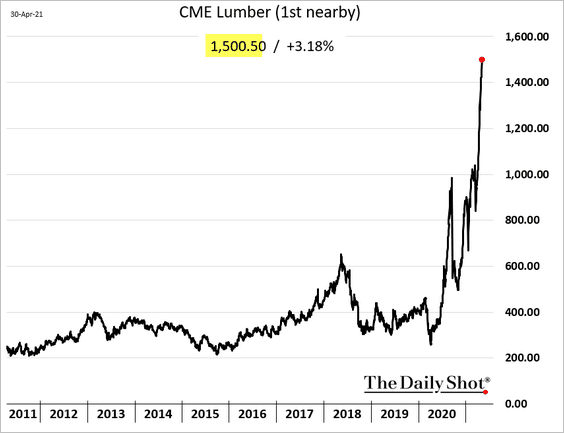
 Source: @markets Read full article
 Source: CNBC Read full article
——————–
2. US corn and soybeans continue to rally.
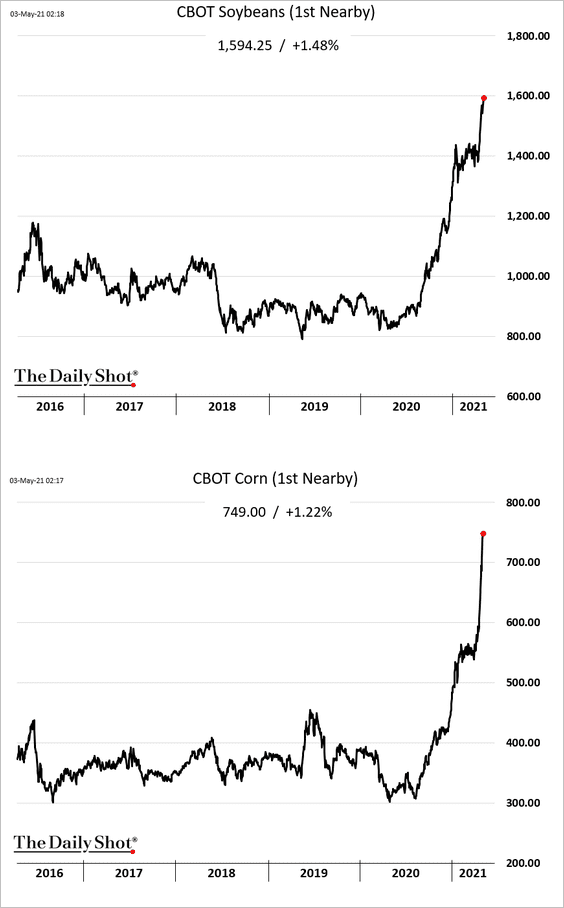
The drying waterways in South America are contributing to soaring grain prices.
 Source: @markets Read full article
——————–
3. Here is the percentage of commodity markets that are up 50% or more over the past year.
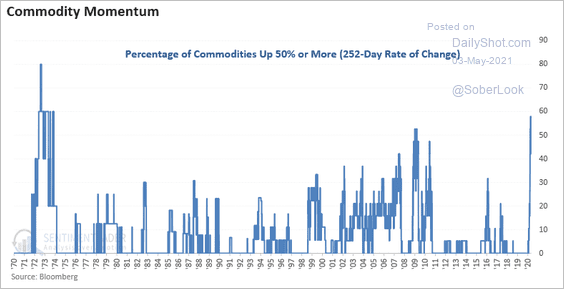 Source: @sentimentrader
And this is the weighted-average backwardation.
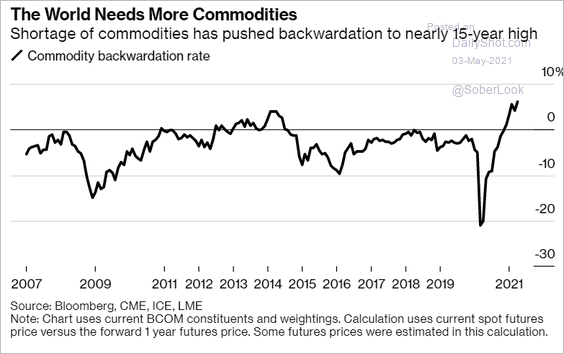 Source: @markets Read full article
Back to Index
Equities
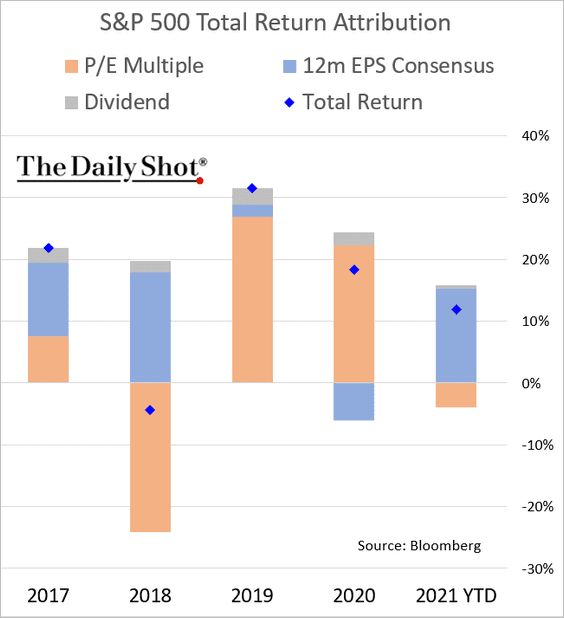
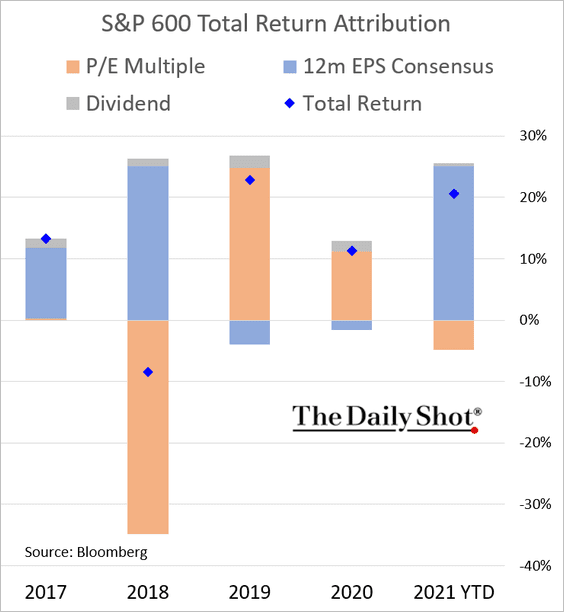
1. Let’s begin with the year-to-date return attribution for the S&P 500 …
… and the S&P 600 (small caps).
——————–
2. How frequently did 95% of S&P 500 stocks close above their 200-day moving average?
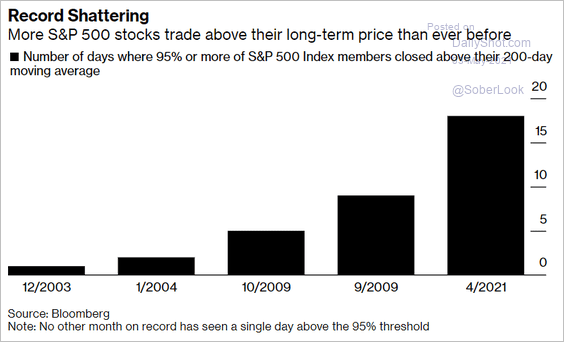 Source: @markets Read full article
3. What percentage of stocks are overbought (RSI > 70)? (See definition of EAFE.)
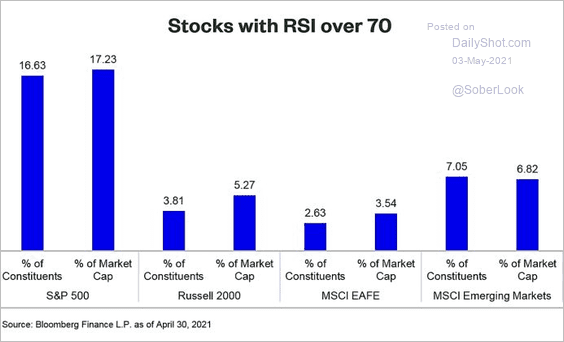 Source: Matthew Bartolini
4. M&A activity has been heating up in recent months.
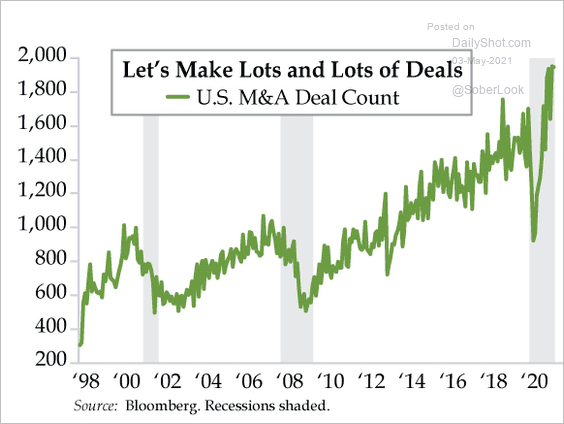 Source: The Daily Feather
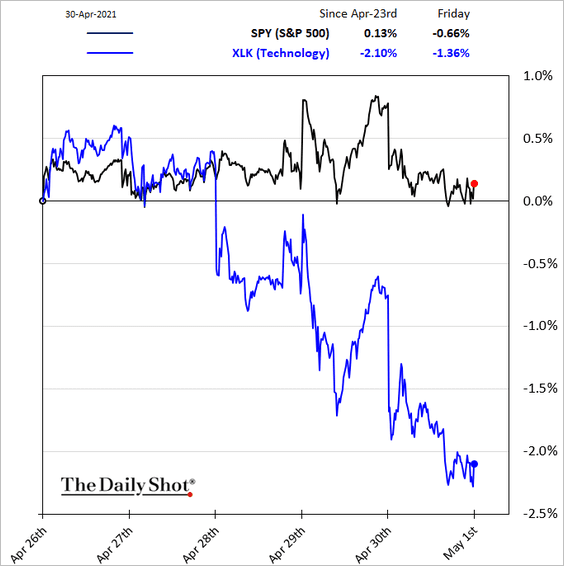
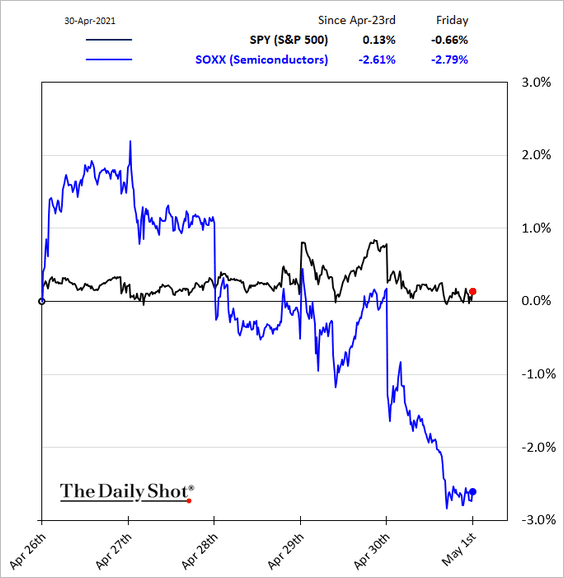
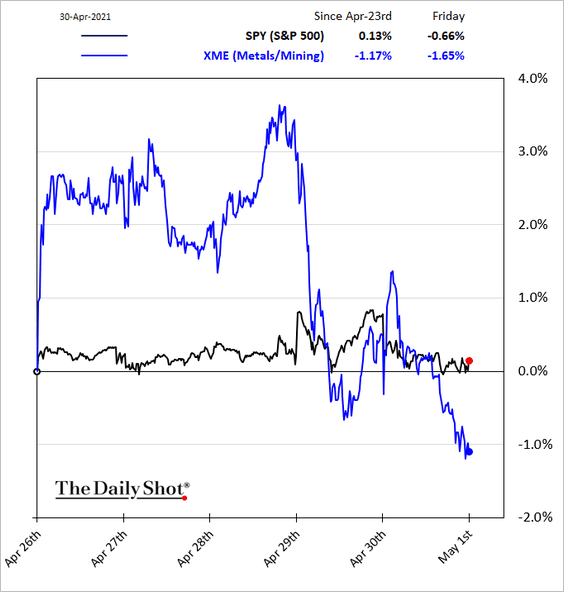
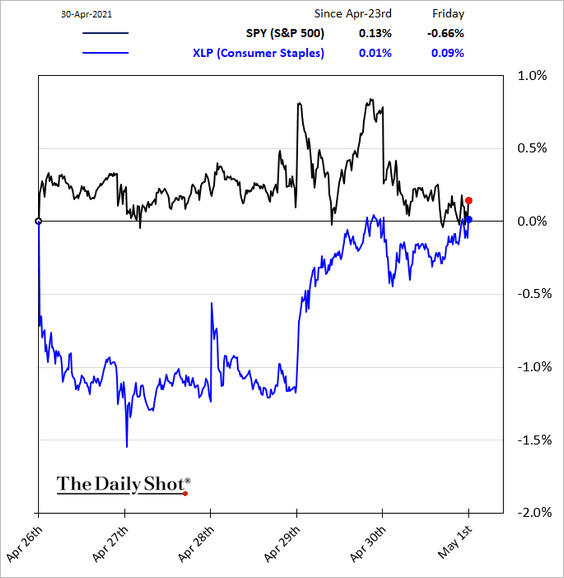
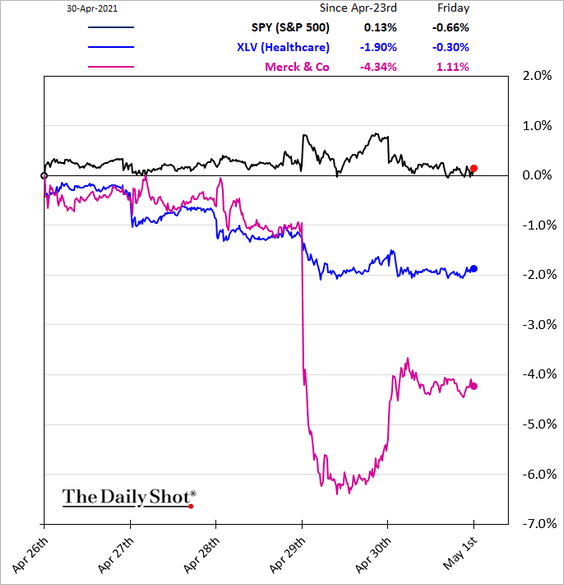
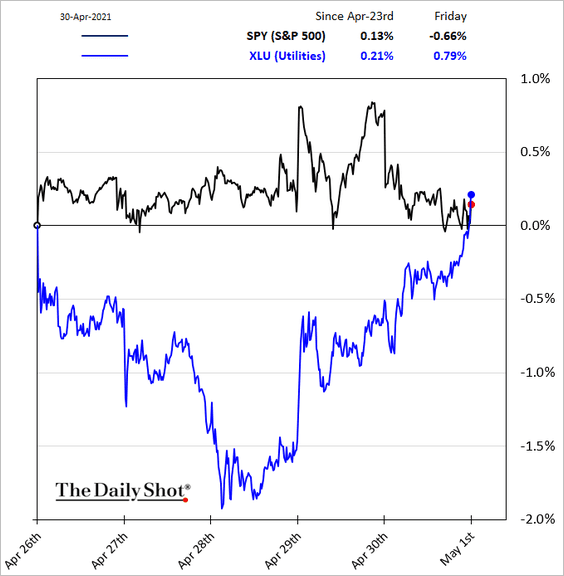
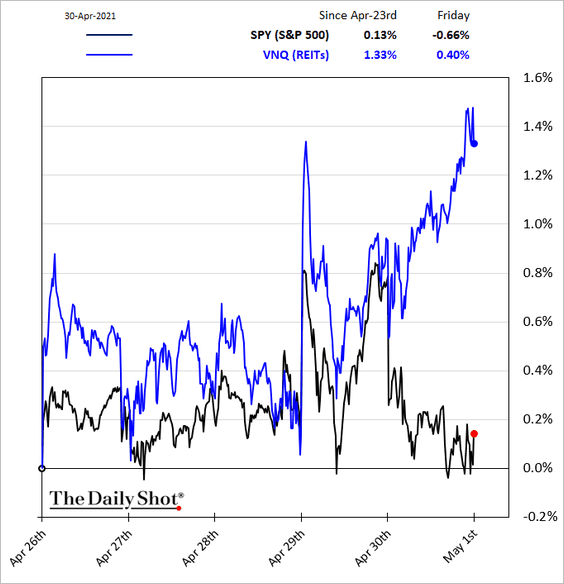
5. Next, we have some sector performance charts (for last week).
• Tech and semiconductors:
• Telecoms:
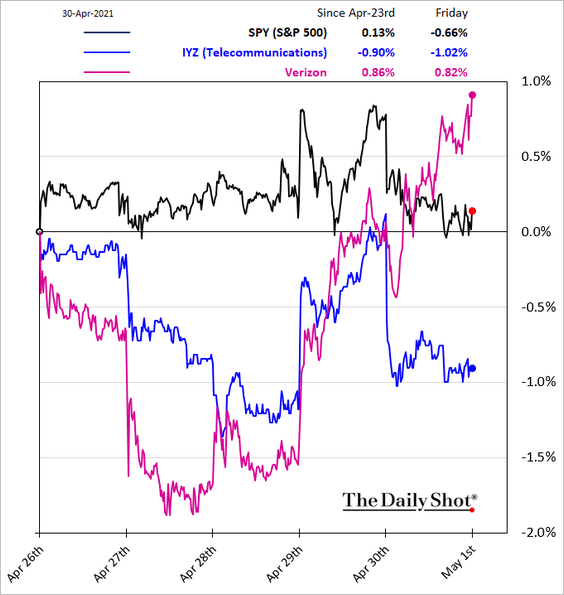
 Source: Reuters Read full article
• Metals & Mining:
• Consumer staples:
• Healthcare:
• Utilities:
• REITs:
——————–
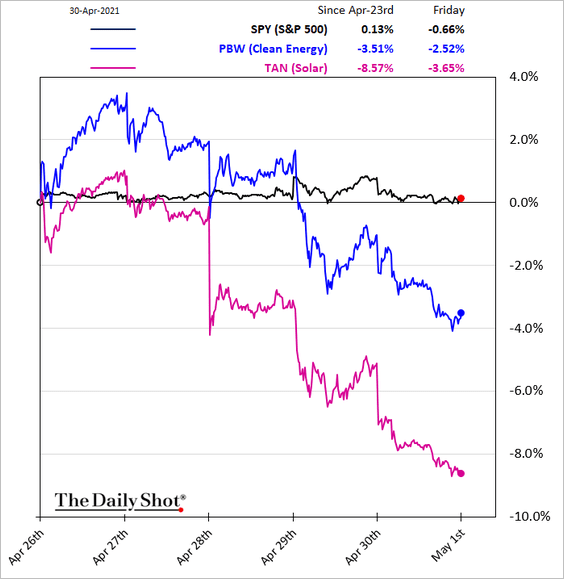
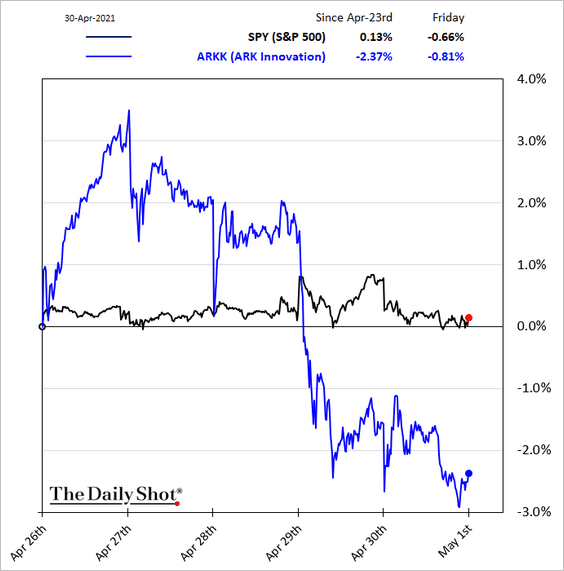
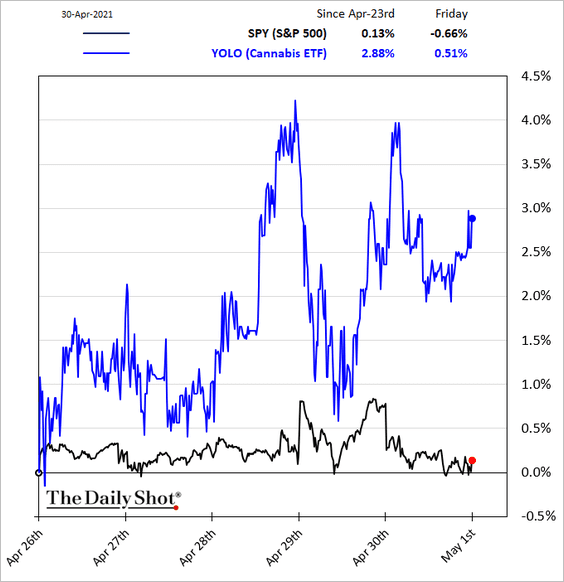
6. Now, let’s take a look at some thematic portfolios.
• Clean energy:
• ARK Innovation:
• Cannabis:
• The thematic ETF universe:
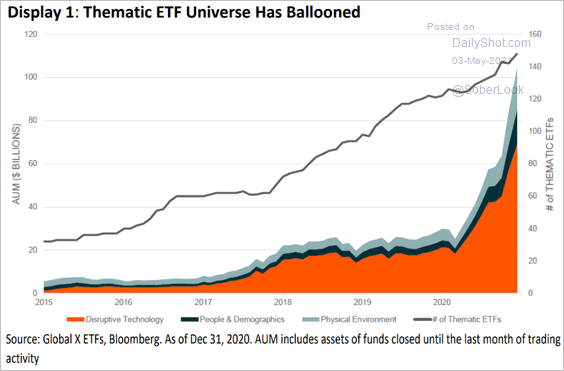 Source: Matrix Private Capital Group
——————–
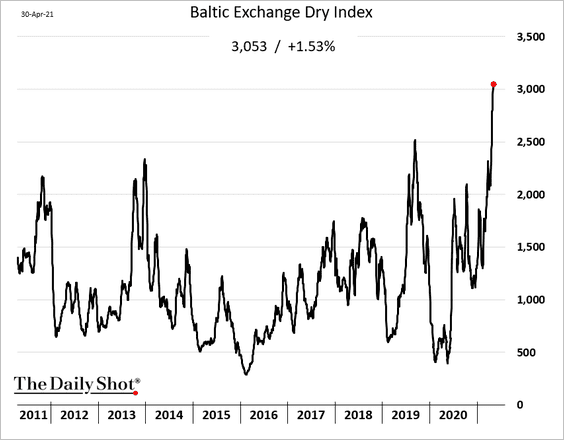
7. Bulk shipping stocks have been on fire, …
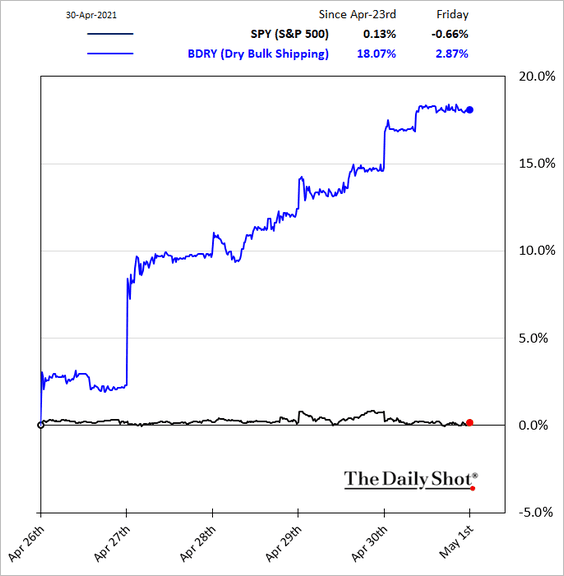
… as dry-bulk shipping costs surge.
——————–
8. We are entering a more uncertain period of the year for stocks.
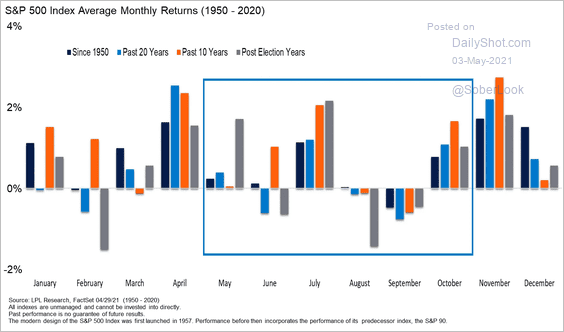 Source: LPL Research
But “sell in May …” could result in underperformance.
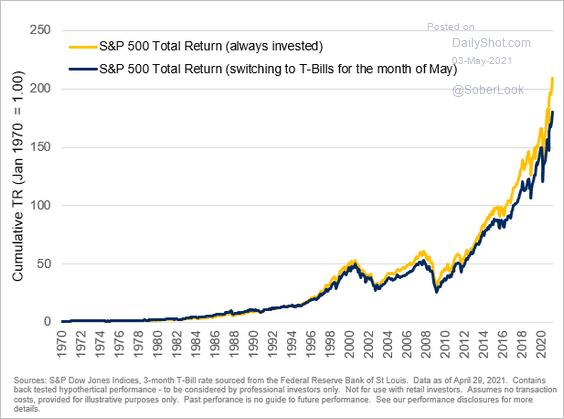 Source: S&P Global Market Intelligence
Back to Index
Rates
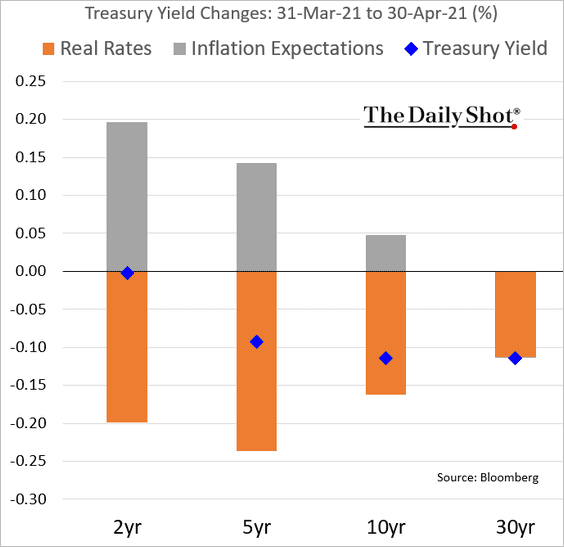
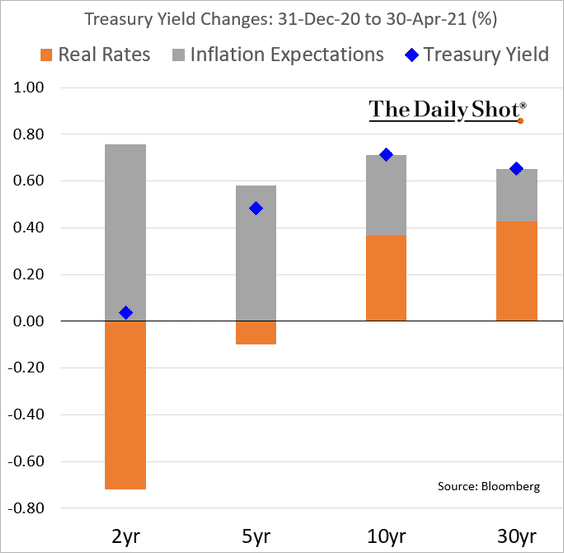
1. Here is the attribution of Treasury yield changes.
• April:
• Year-to-date:
——————–
2. Below is Goldman’s projection for net Treasury supply.
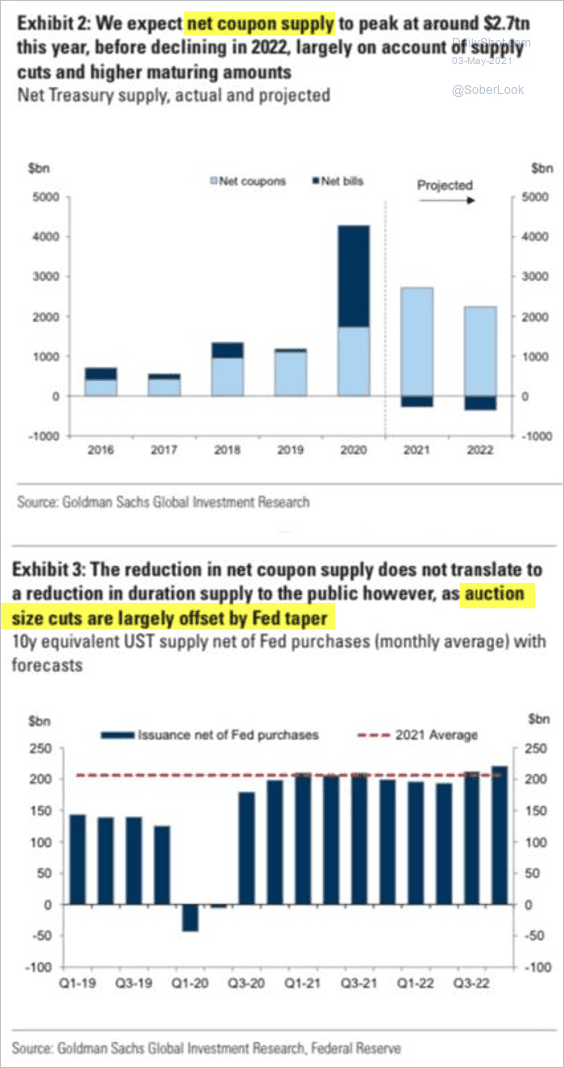 Source: Goldman Sachs; h/t J B
——————–
Food for Thought
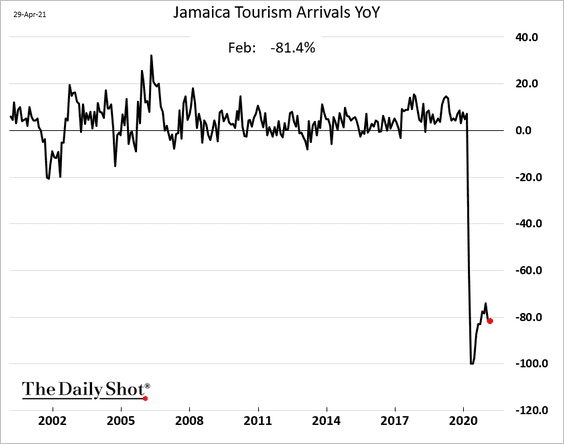
1. Jamaica’s tourism arrivals (year-over-year):
2. China’s vaccine usage:
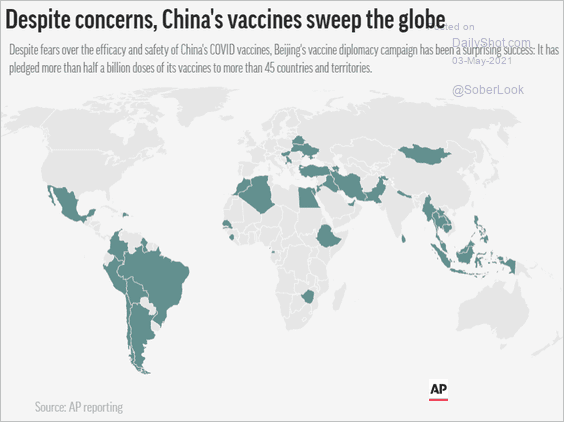 Source: AP Read full article
3. Oxygen demand:
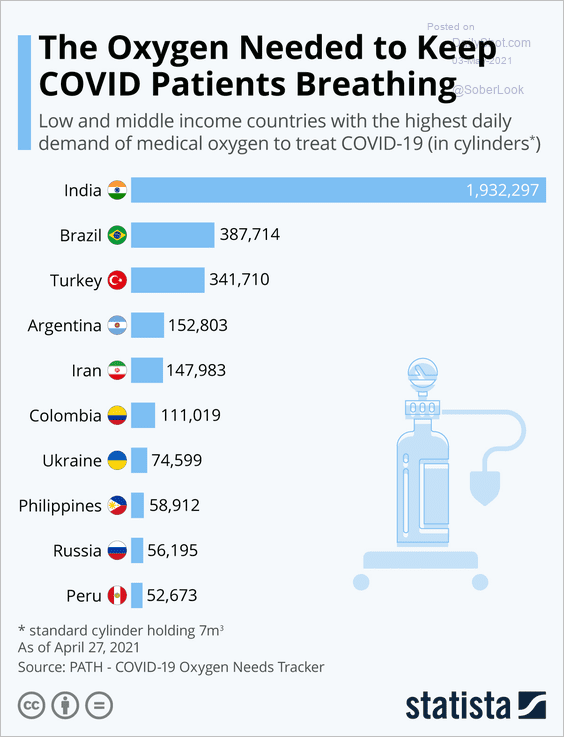 Source: Statista
4. US Jobless claims resulting in payments:
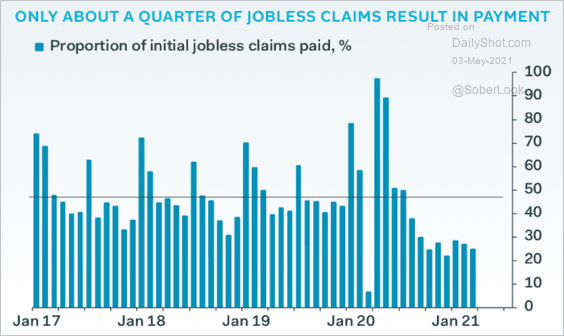 Source: Pantheon Macroeconomics
5. Working from home:
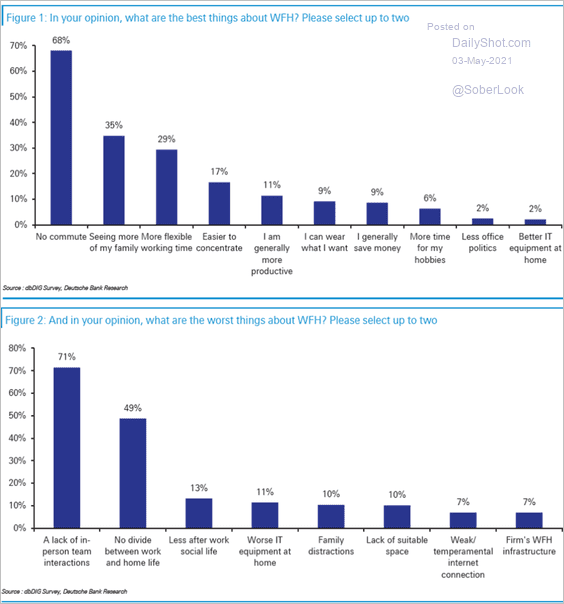 Source: Deutsche Bank Research
6. Highest-valued startups:
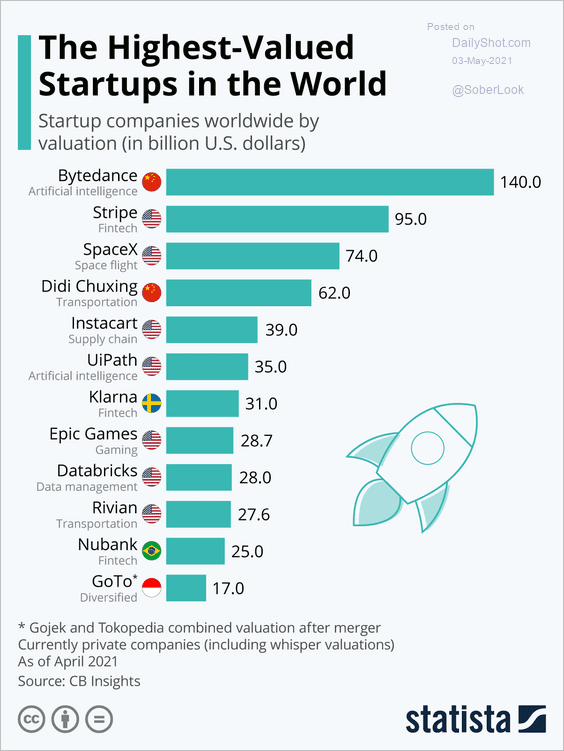 Source: Statista
7. The world’s longest walkable road:
 Source: Brilliant Maps Read full article
——————–
Back to Index