
The Daily Shot: 10-May-21
• The United States
• Canada
• The Eurozone
• Asia – Pacific
• China
• Emerging Markets
• Cryptocurrency
• Commodities
• Energy
• Equities
• Credit
• Rates
• Global Developments
• Food for Thought
The United States
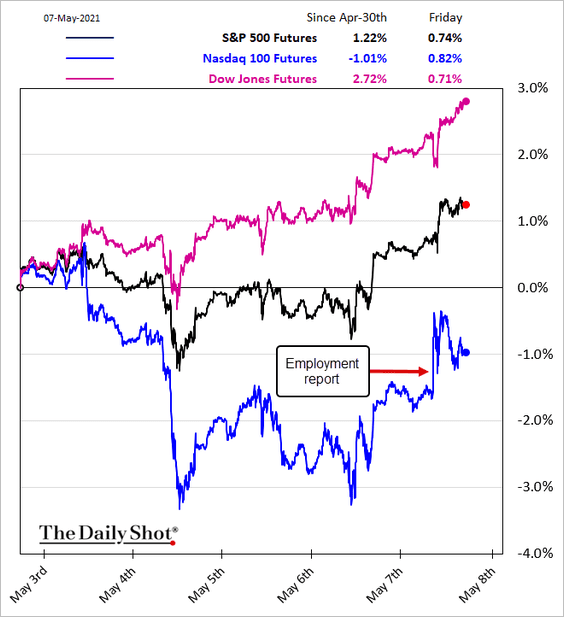
1. The April jobs report was shockingly weak relative to market expectations.
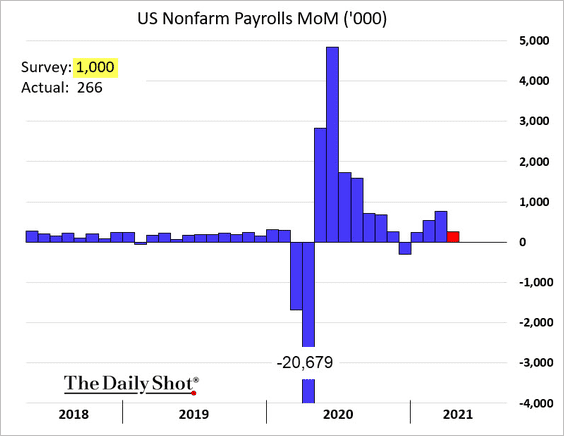
What happened?
• Many economists suspect that the weakness was due to supply constraints rather than a slowing demand for labor. For example, wages unexpectedly rose, suggesting that employers are forced to boost pay to attract workers.
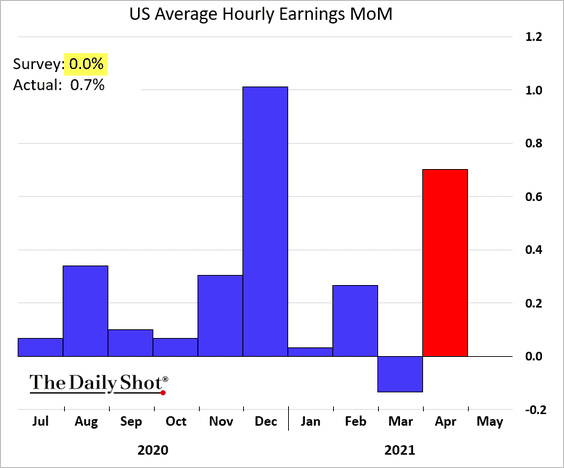
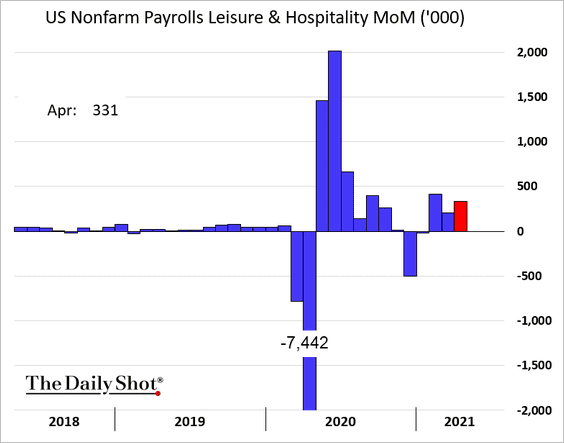
And this time, pay increases weren’t driven by the loss of lower-wage workers. Much of the growth in payrolls came from Leisure & Hospitality (2 charts).
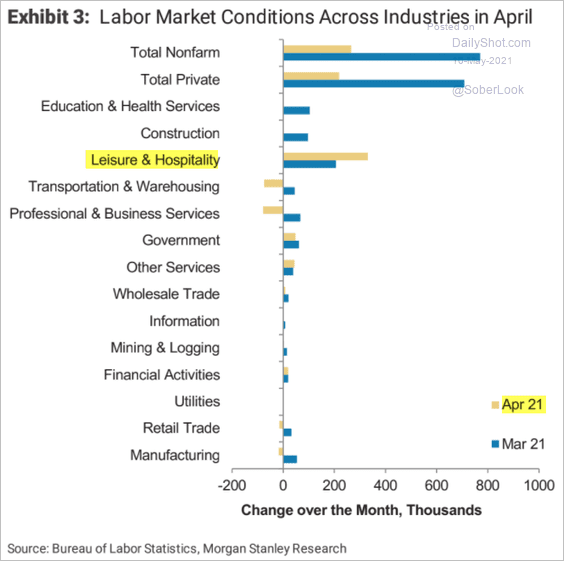 Source: Morgan Stanley Research
Longer work hours also suggest strong demand for labor.
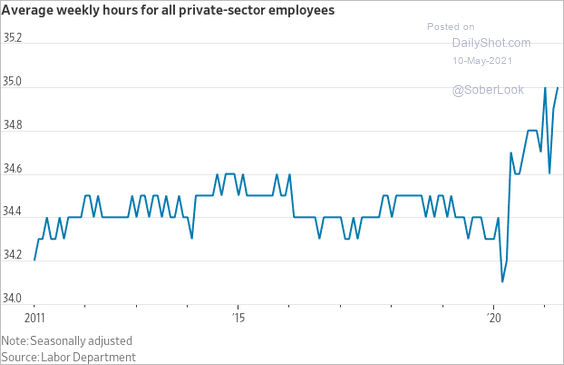 Source: @WSJ Read full article
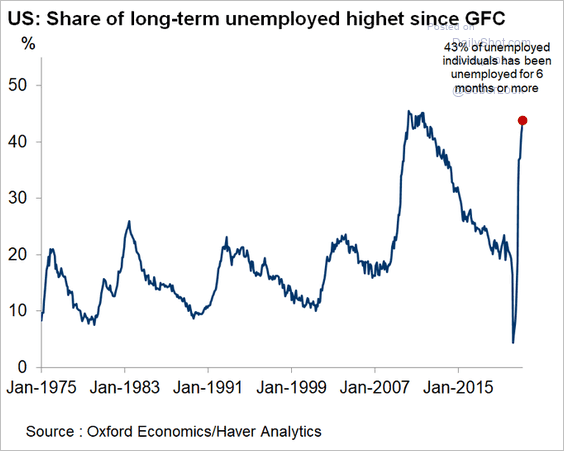
What is causing the tightness in the labor market? Some have suggested that the larger-than-usual unemployment benefits are keeping many workers from taking a job. According to some estimates, nearly half of Americans receiving jobless benefits are making more now than they did when working. Anecdotal evidence suggests that challenges related to childcare and the advantages of Medicaid vs. private insurance also contribute to this trend. Many workers are responsible for a meaningful portion of healthcare premiums, which have risen sharply over the past few years. Private insurance copayments have also been increasing relative to Medicaid in most states. The math of returning to work simply doesn’t make sense for many. As a result, long-term unemployment continues to climb.
 Source: @GregDaco
 Source: @ABC11_WTVD Read full article
• In addition to labor supply issues, employment data have been noisy due to seasonal adjustments. Here is the comparison.
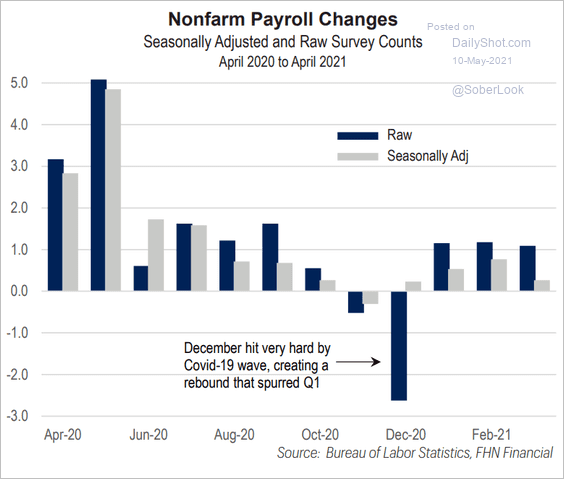 Source: FHN Financial
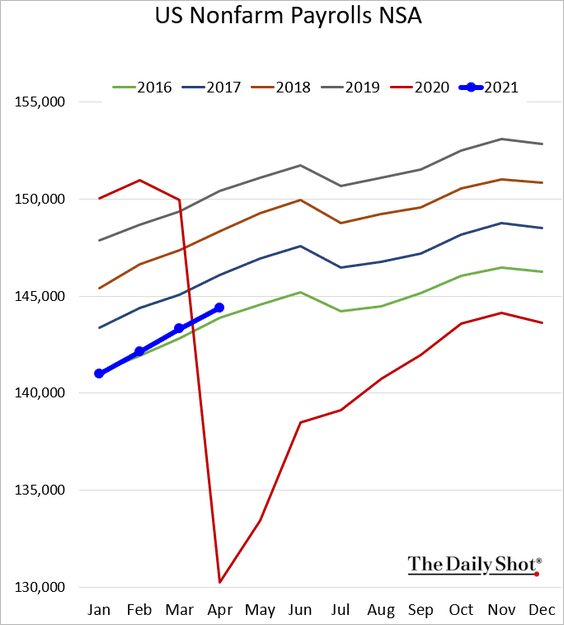
And this chart shows the absolute level of payrolls without seasonal adjustments.
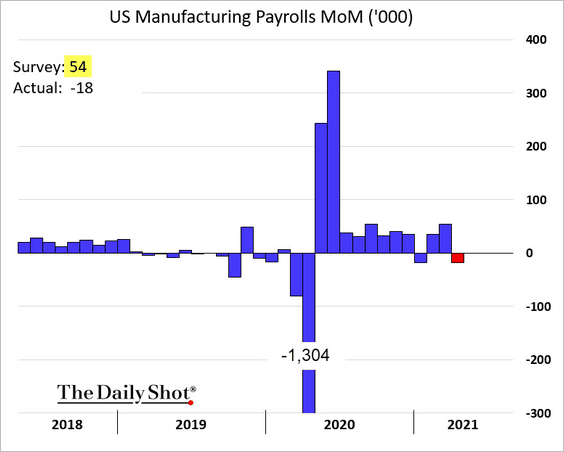
• Are supply-chain challenges pressuring factory employment?
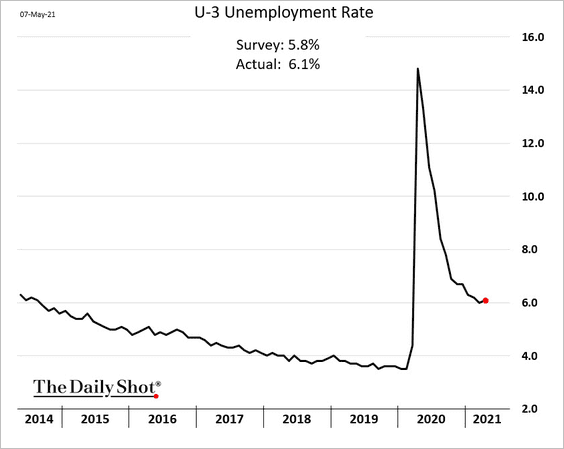
• The unemployment rate unexpectedly increased, …
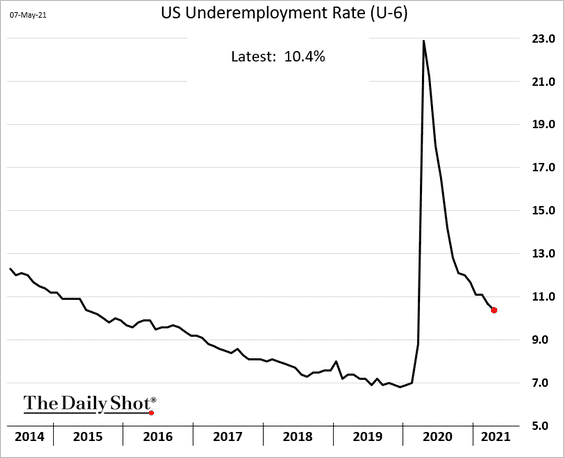
… but underemployment continued to decline.
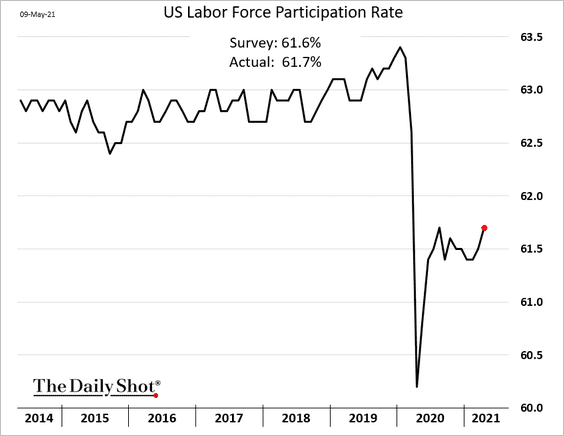
The labor-force participation rate is recovering.
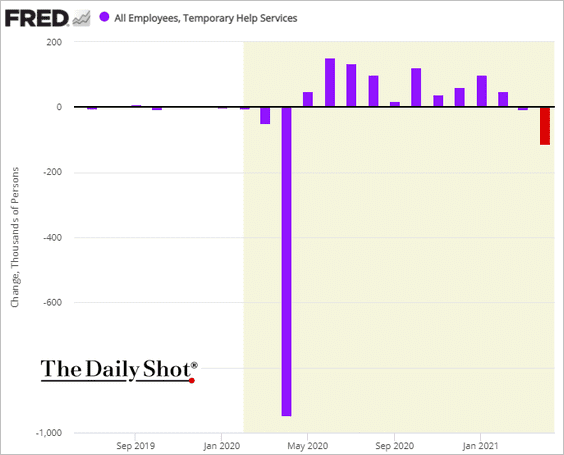
• Below are some additional highlights from the employment report.
– Temp jobs (perhaps some rotation from temp to permanent):
– Permanent layoffs:
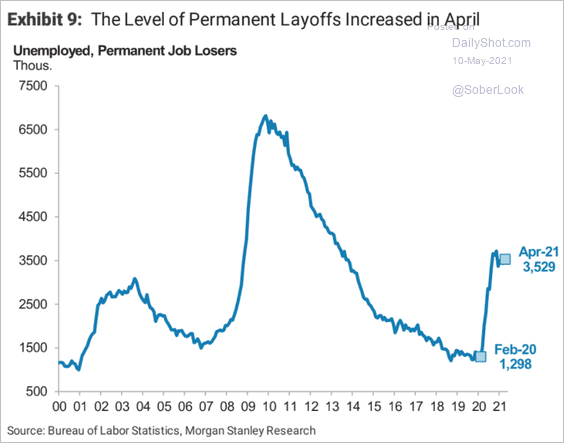 Source: Morgan Stanley Research
– Time it took to return to pre-downturn levels:
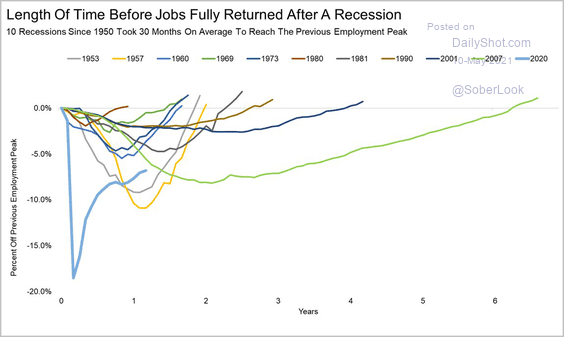 Source: @RyanDetrick
Here is a forecast from Oxford Economics.
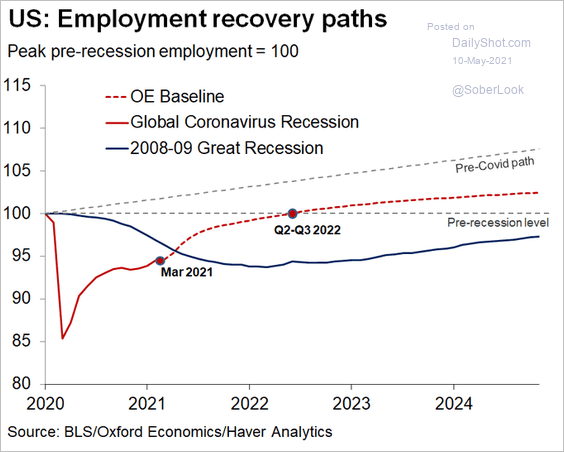 Source: @GregDaco
– Past unemployment trends and a forecast from ANZ:
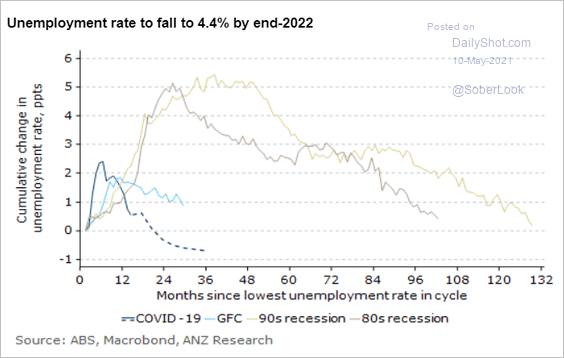 Source: ANZ Research
– Leaders & laggards:
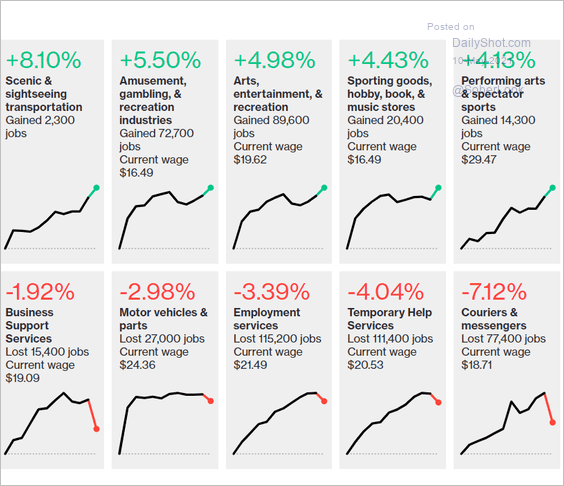 Source: Bloomberg Read full article
——————–
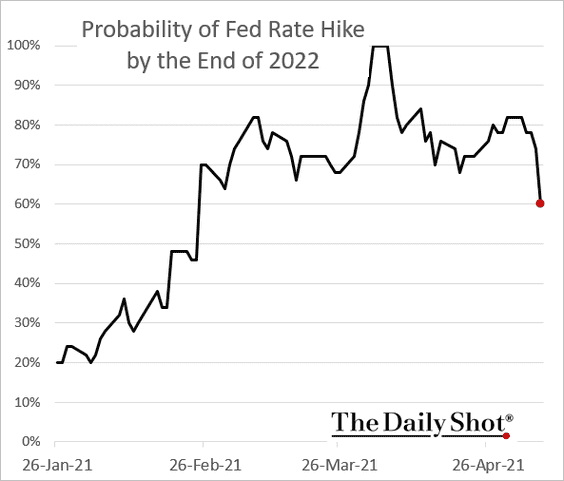
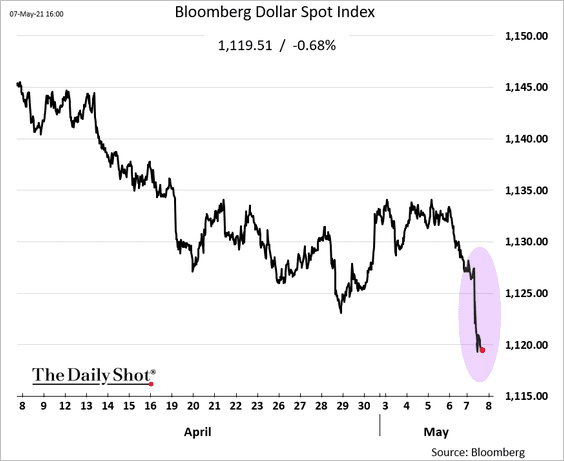
2. Markets sees the weak employment report keeping the Fed on hold for longer. Perhaps taper is off the table this year? The futures-based probability of a 2022 rate hike declined sharply.
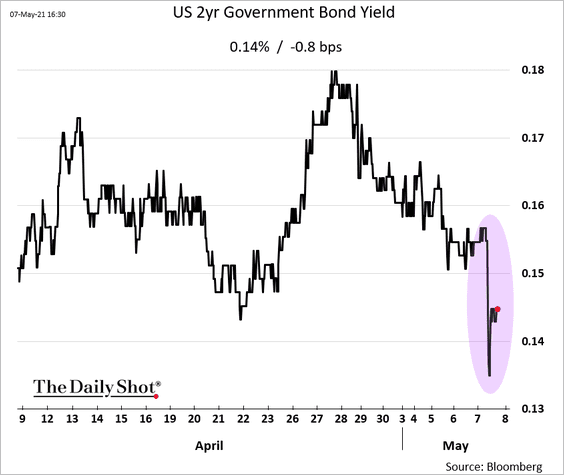
Short-term Treasury yields dipped, and the US dollar slumped.
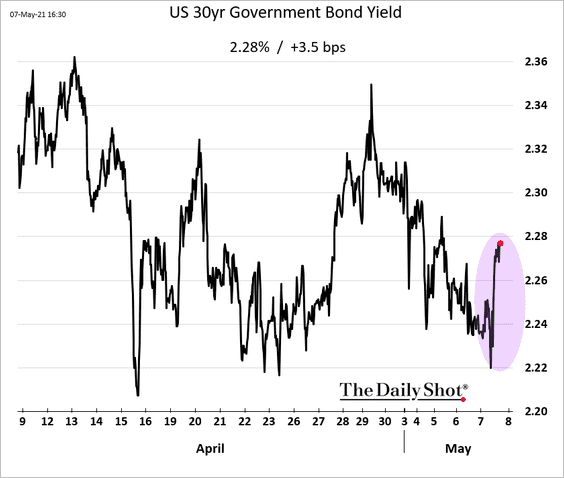
On the other hand, longer-term Treasury yields climbed as the curve steepened.
In an attempt to heal the labor market …
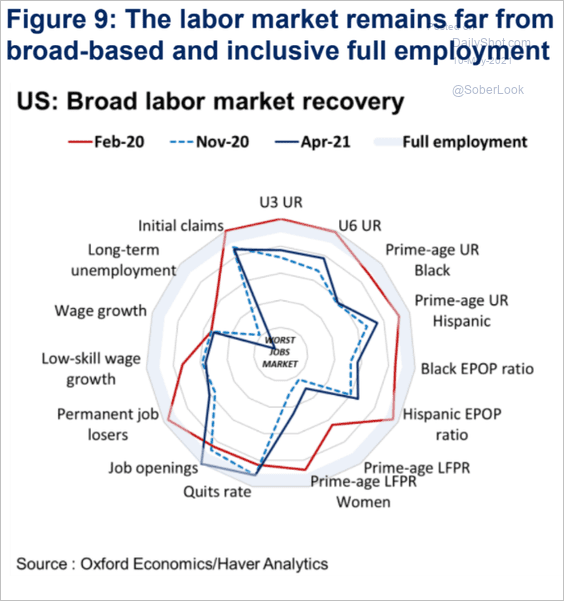 Source: Oxford Economics
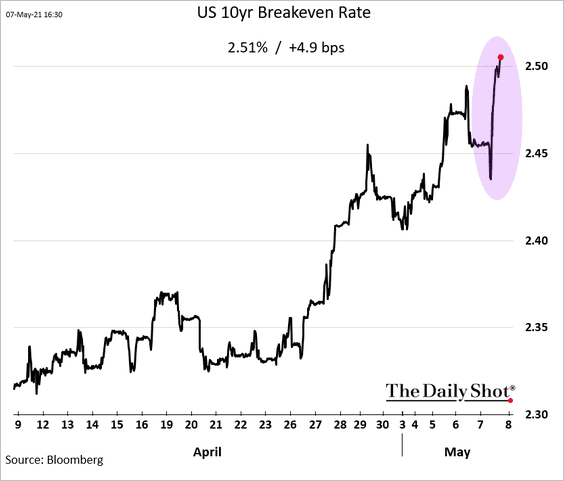
… the Fed may allow inflation to run hot for a while. Inflation expectations and gold jumped.
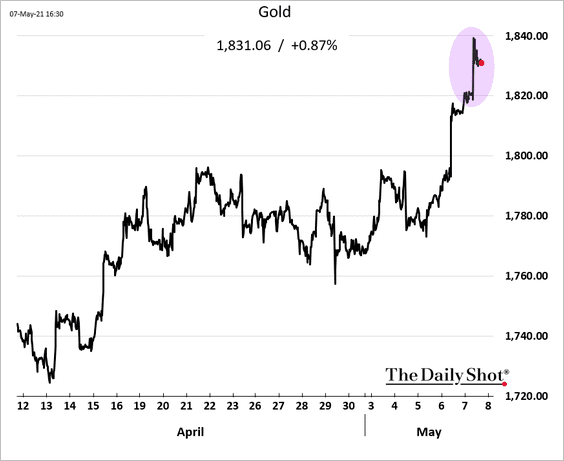
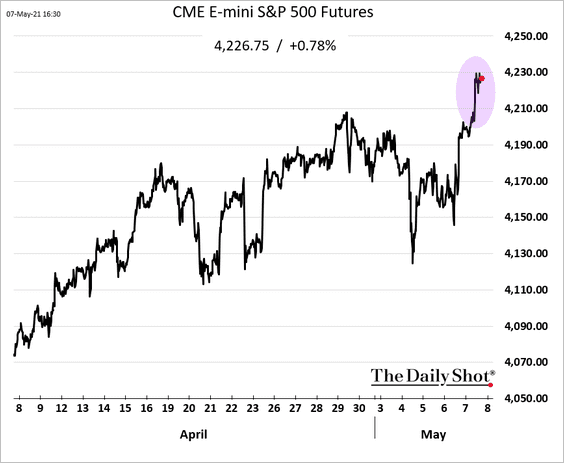
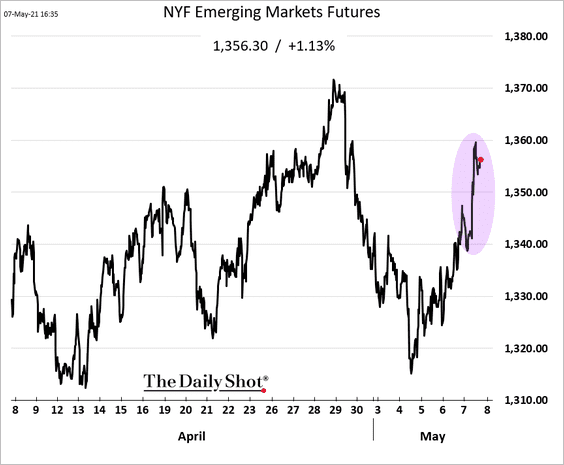
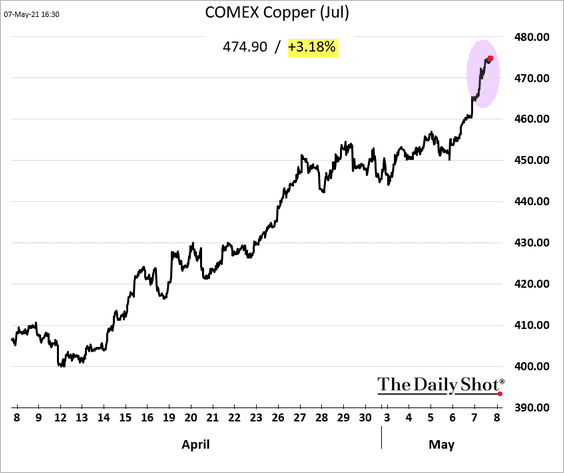
With the Fed’s taper uncertainty out of the way, for now, risk assets rallied.
• US stocks:
• Emerging markets:
• Copper:
——————–
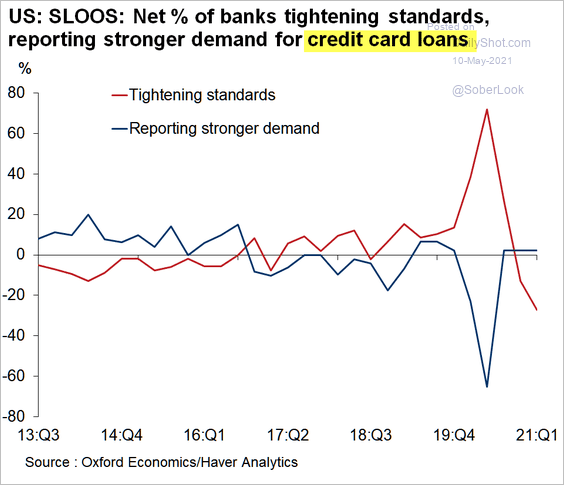
3. Consumers continued to use their credit cards in March, …
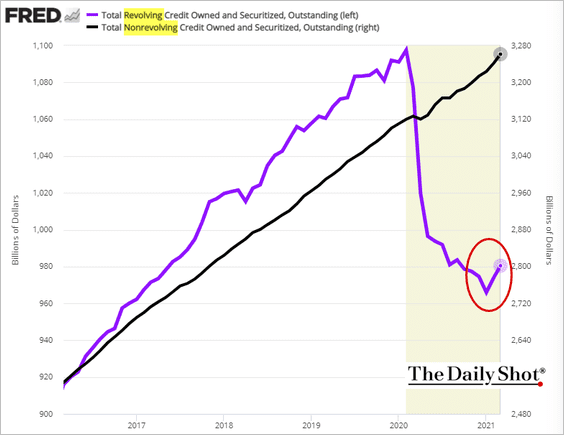
… as banks eased lending standards.
 Source: Oxford Economics
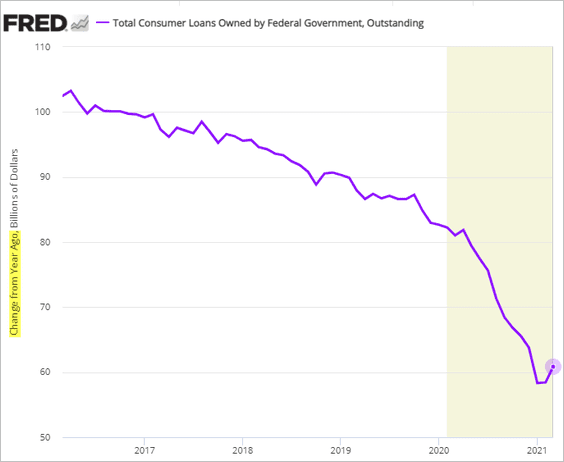
Student loan growth appears to have bottomed.
——————–
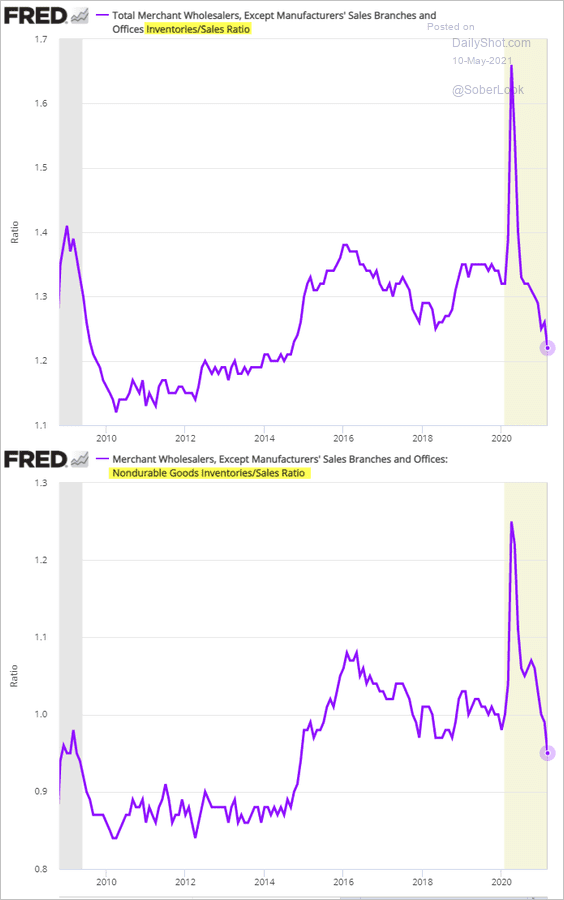
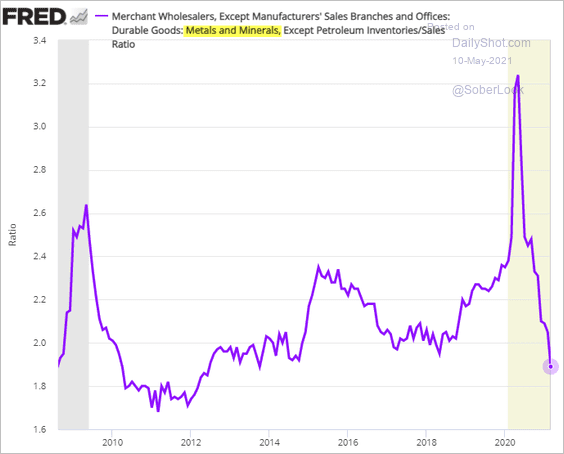
4. Business inventories-to-sales ratios continue to tighten.
——————–
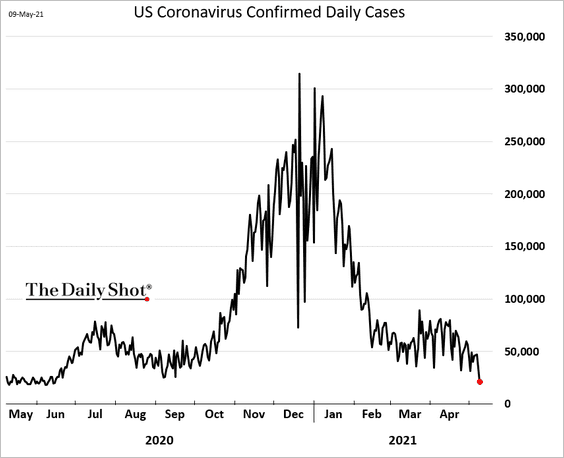
5. US COVID cases have been moderating.
The pace of vaccinations has slowed.
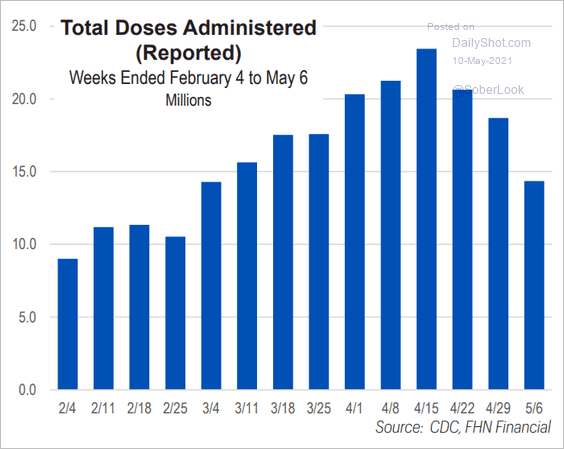 Source: FHN Financial
Back to Index
Canada
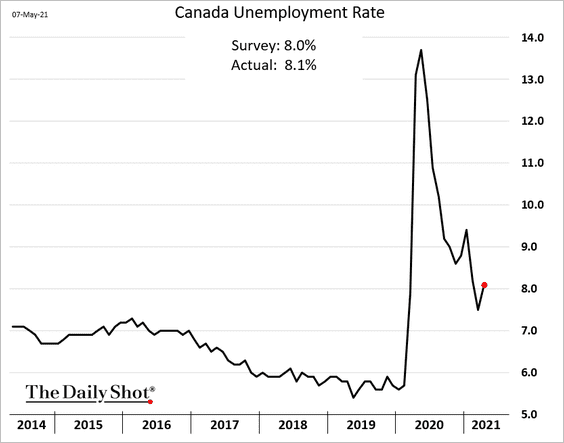
1. Canada’s April employment report was weaker than expected.
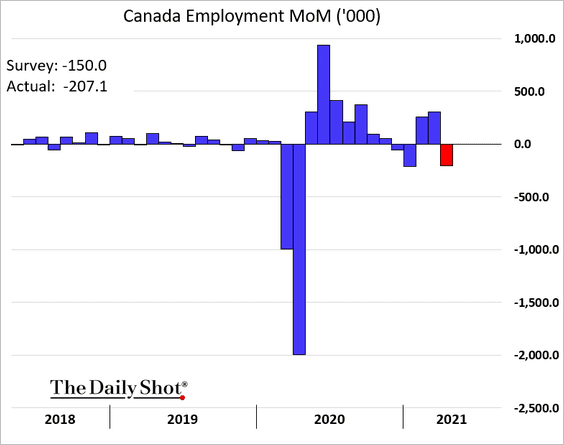
The unemployment rate rose.
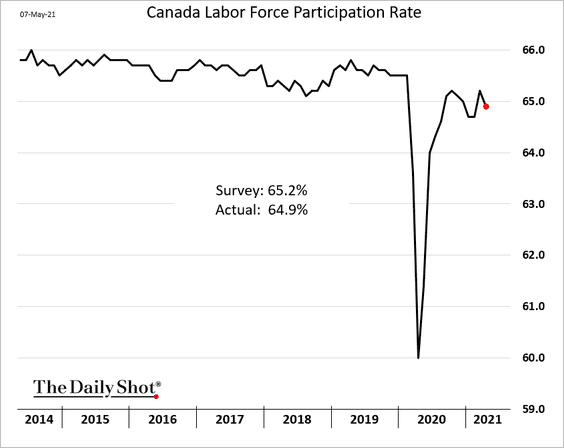
And the labor force participation rate dropped back below 65%.
——————–
2. Yield spreads and higher oil prices have driven the Canadian dollar higher over the past year.
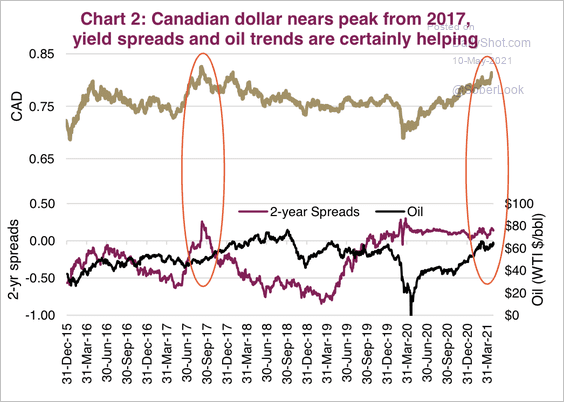 Source: Market Ethos, Richardson GMP
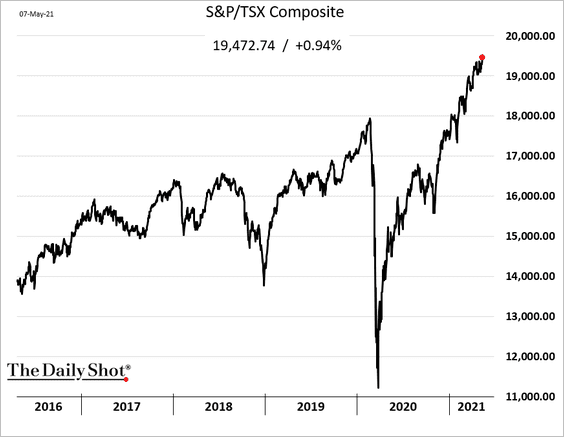
3. The benchmark stock market index hit a record high.
Back to Index
The Eurozone
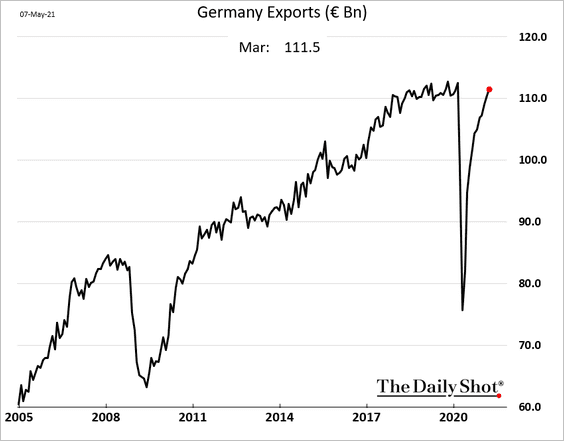
1. Let’s begin with Germany.
• Exports have rebounded, …
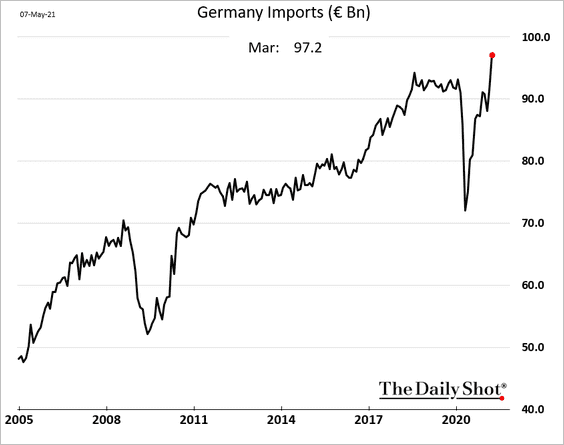
… while imports hit a record high.
• Is the weakness in auto production contributing to the gap between factory orders and industrial production?
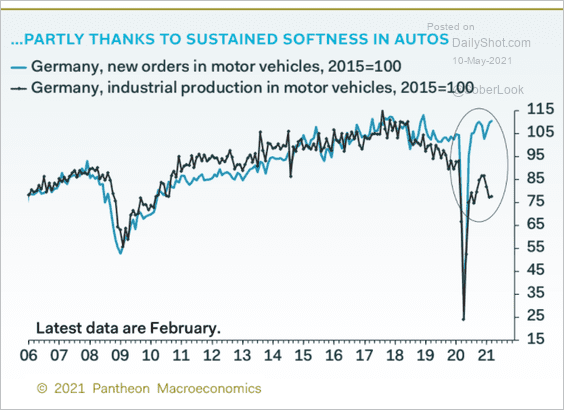 Source: Pantheon Macroeconomics
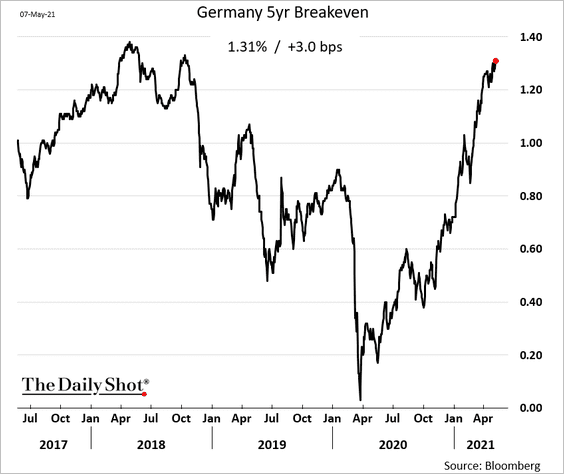
• Market-based inflation expectations are grinding higher.
• Germans dislike the US more than Russia.
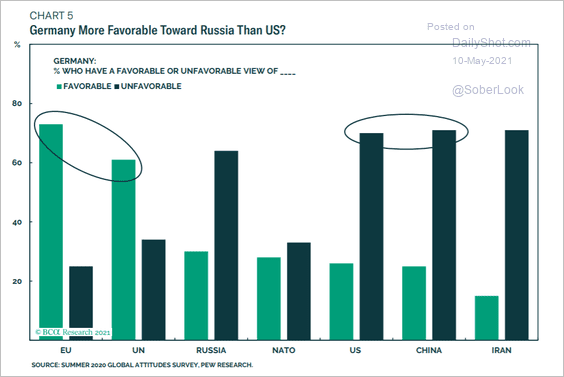 Source: BCA Research
——————–
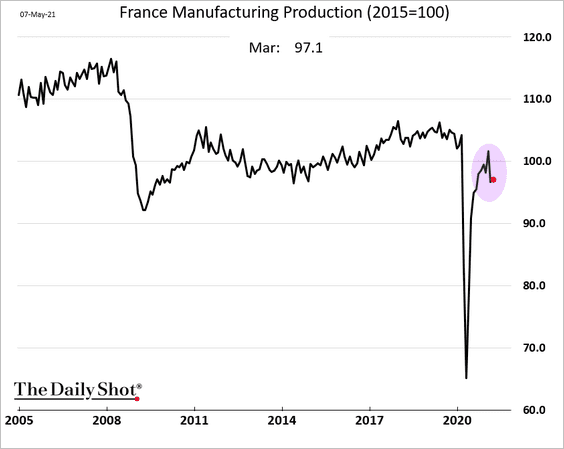
2. French industrial production recovery has stalled.
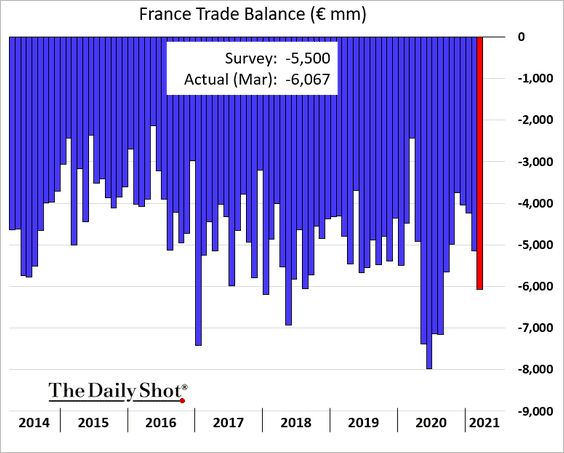
The trade deficit was higher than expected in March.
——————–
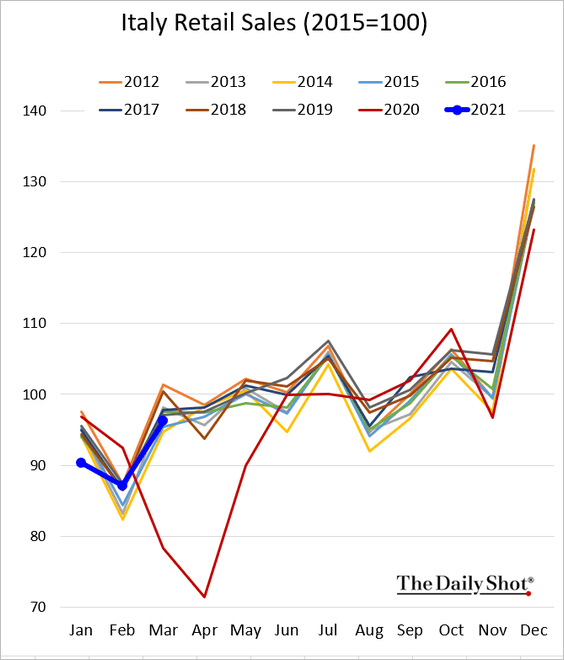
3. Italian retail sales are recovering.
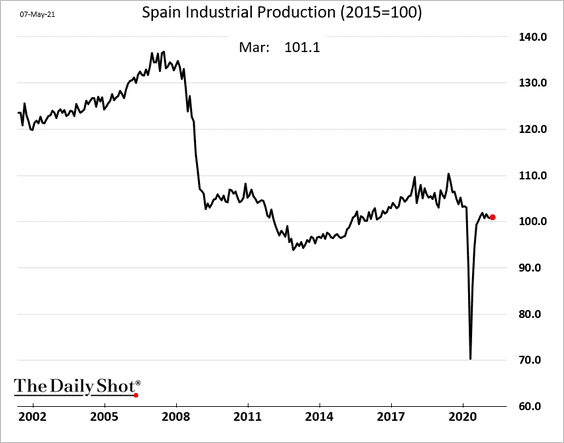
4. Spain’s industrial production has been holding steady.
5. The ECB taper starting this summer?
 Source: @markets Read full article
Back to Index
Asia – Pacific
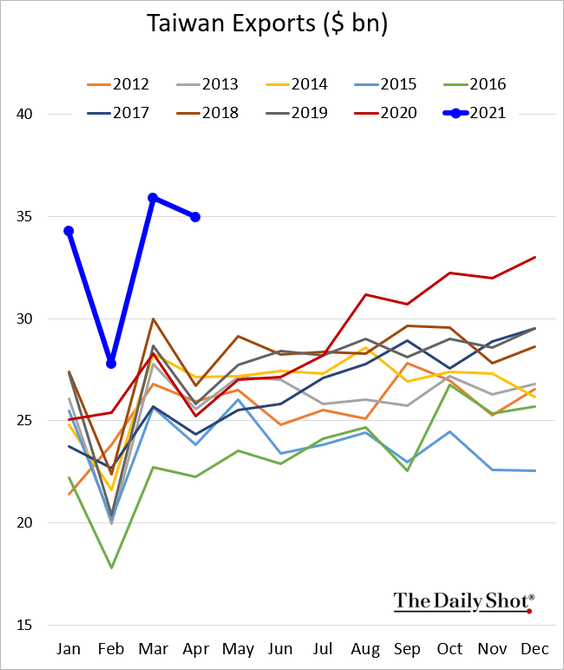
1. Taiwan’s exports remain exceptionally strong, driven by semiconductors.
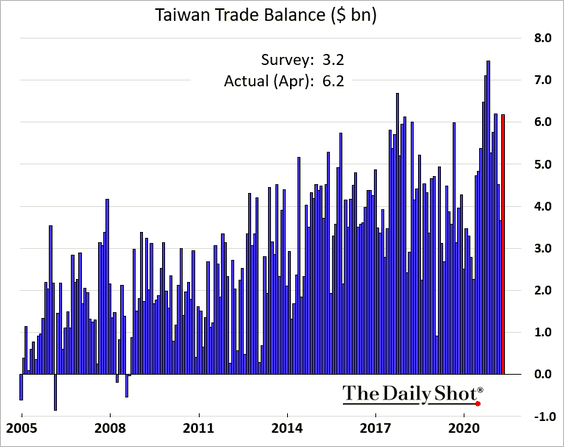
Last month’s trade surplus surprised to the upside.
——————–
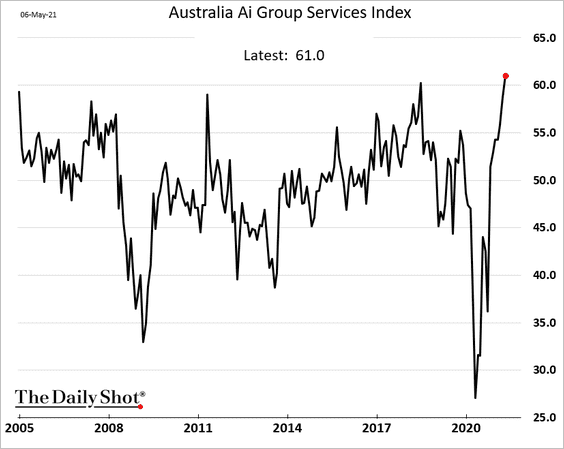
2. Australia’s business confidence continues to surge, …
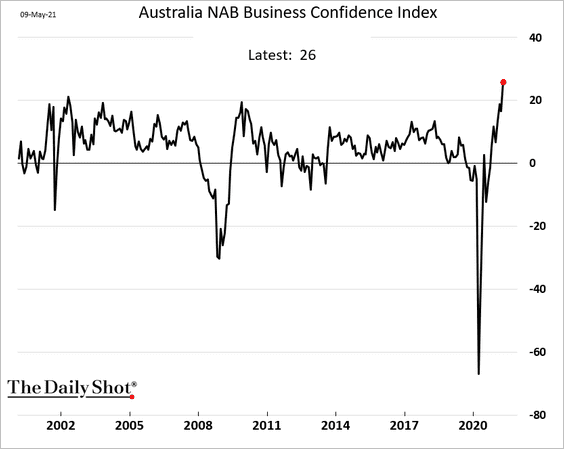
… as activity in service industries accelerates.
Back to Index
China
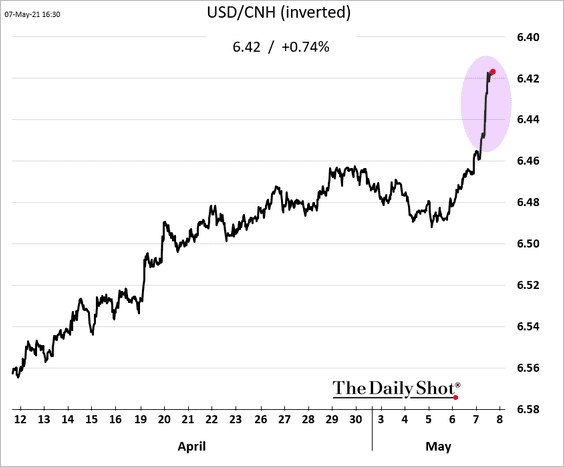
1. The renminbi rose sharply in response to the soft US jobs report.
2. Have China’s exports peaked?
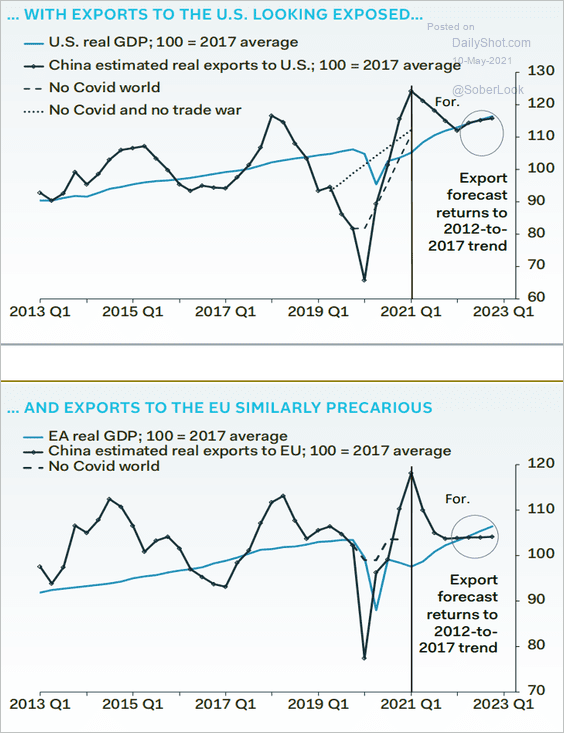 Source: Pantheon Macroeconomics
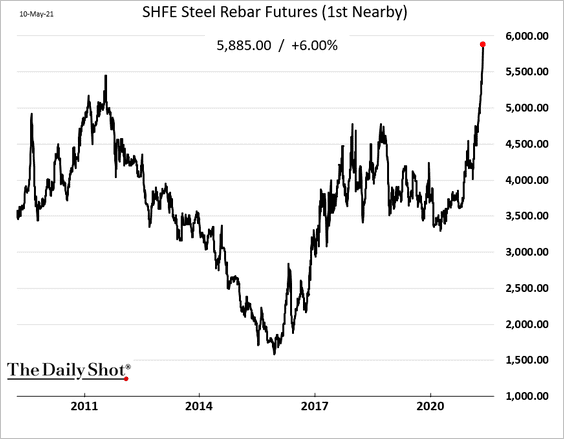
3. Surging industrial commodity prices and shipping costs could become a drag on economic output.
4. China’s elevated real policy rate points to a restrictive monetary policy.
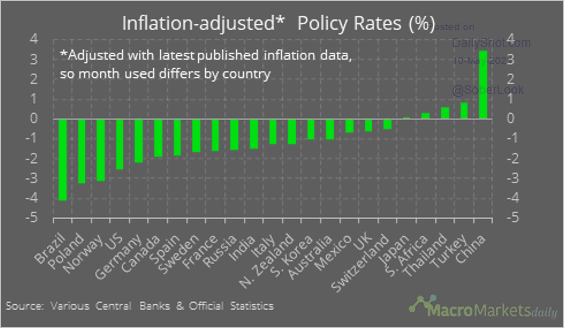 Source: @macro_daily
Back to Index
Emerging Markets
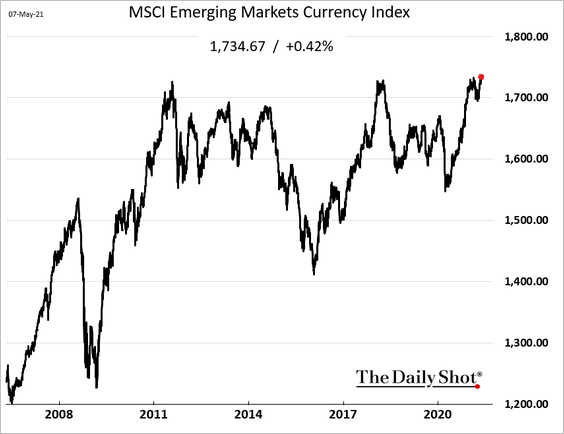
1. The weak US jobs report sent the MSCI EM currency index to a new high.
2. The recovery in EM inflows during April was mainly supported by debt flows.
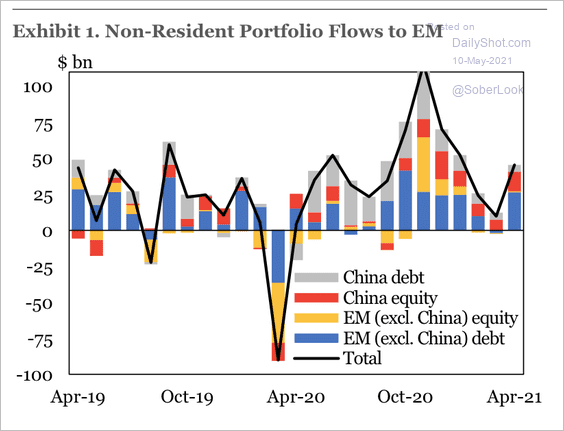 Source: IIF
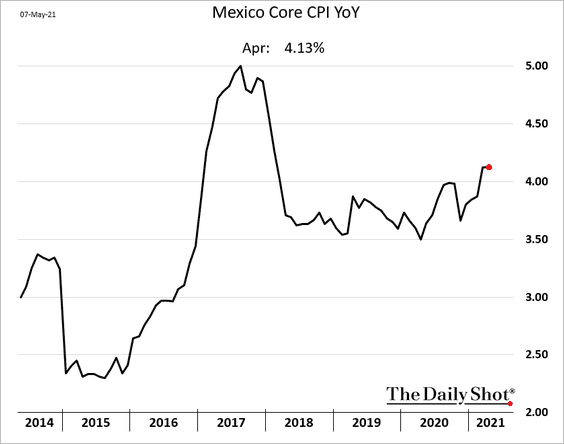
3. Mexico’s consumer confidence continues to recover.

The core CPI is holding above 4%.
——————–
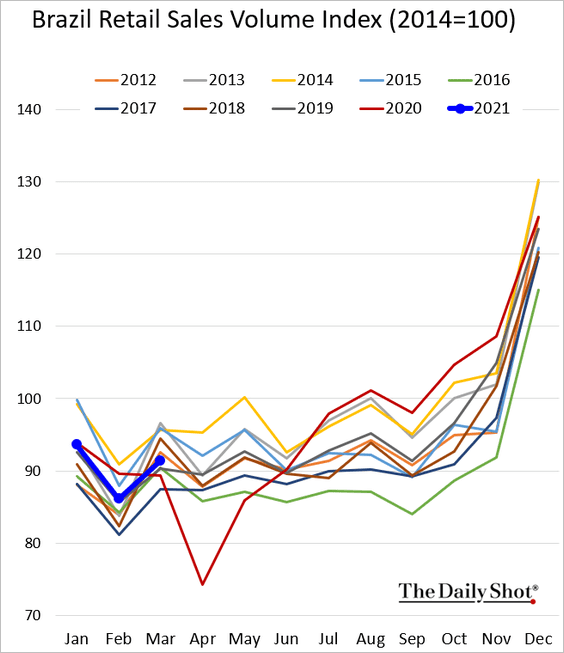
4. Brazil’s March retail sales were stronger than expected (the market expected a decline).
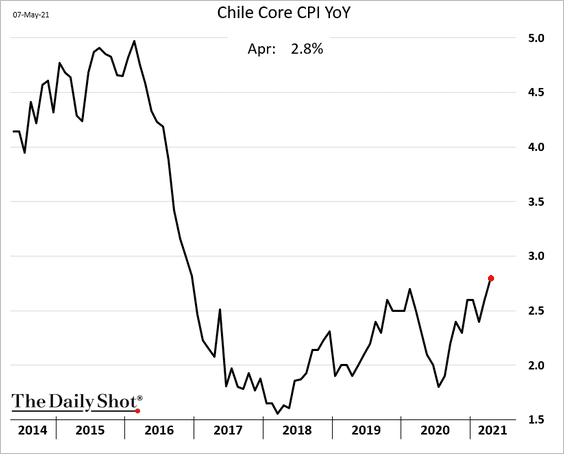
5. Chile’s core inflation continues to climb.
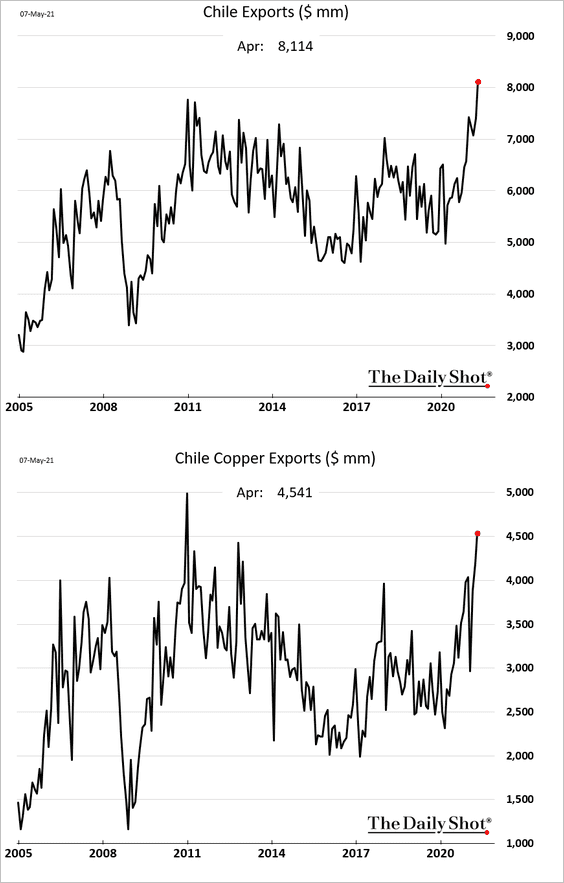
Chile’s exports hit a record high last month.
——————–
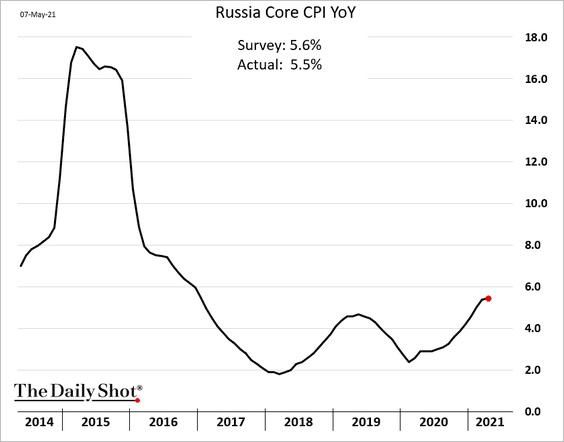
6. Russia’s core CPI increased less than expected.
Back to Index
Cryptocurrency
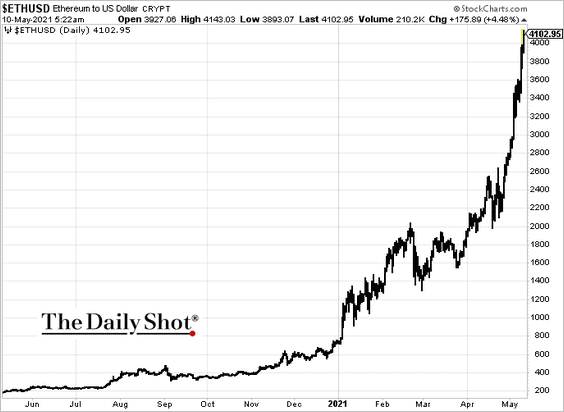
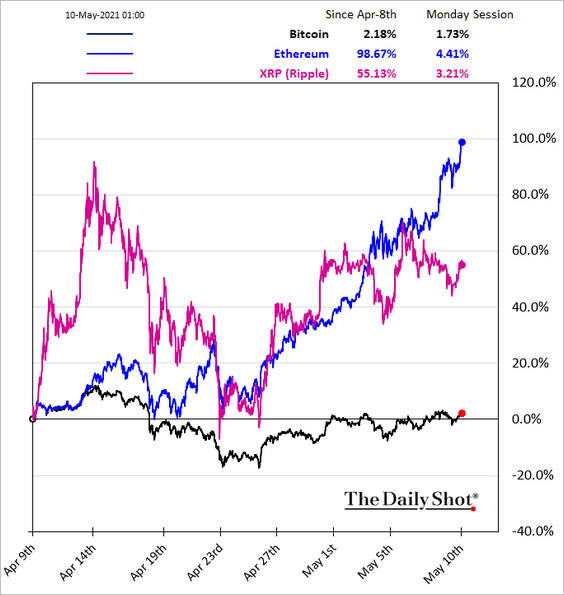
1. Ethereum blasted past $4k.
Here is the relative performance over the past month.
——————–
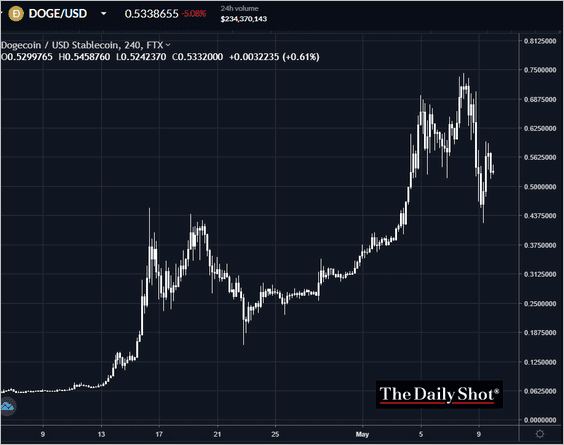
2. Dogecoin is holding above 50 cents after the post-SNL tumble.
 Source: Reuters Read full article
 Source: FTX
Back to Index
Commodities
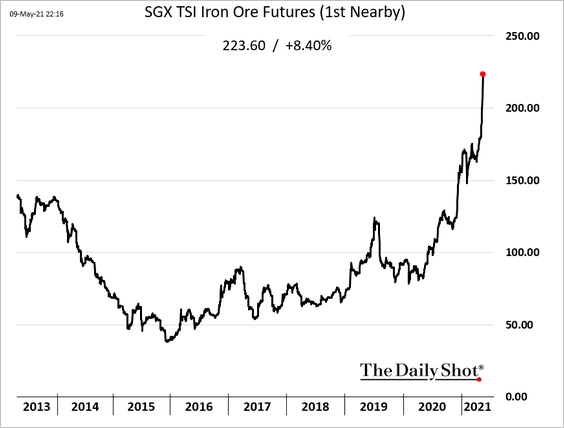
1. With the Fed’s taper out of the way, for now, industrial commodities continue to surge.
• Iron ore:
 Source: @markets Read full article
• Copper:
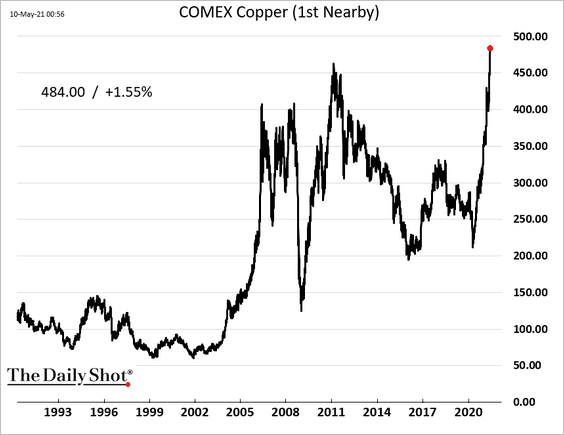
 Source: @WSJ Read full article
By the way, speculative positions in copper haven’t kept up with the rally.
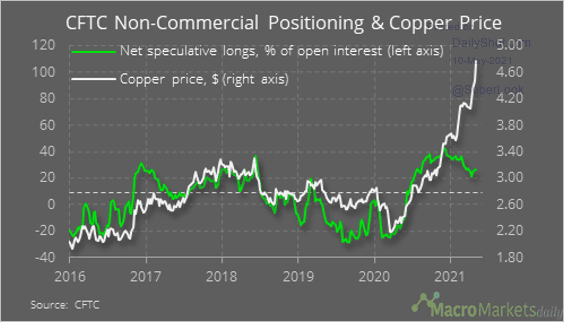 Source: @macro_daily
——————–
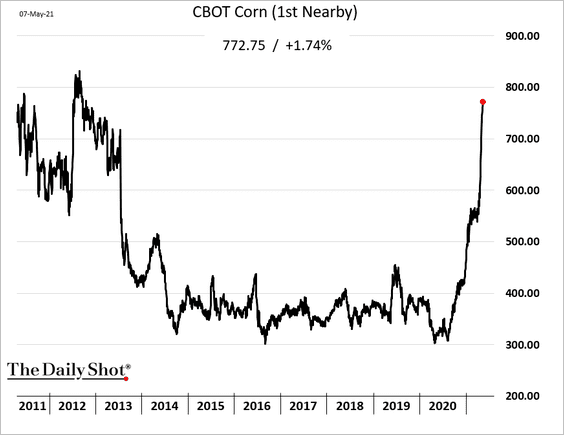
2. US corn prices have been soaring.
 Source: @WSJ Read full article
——————–
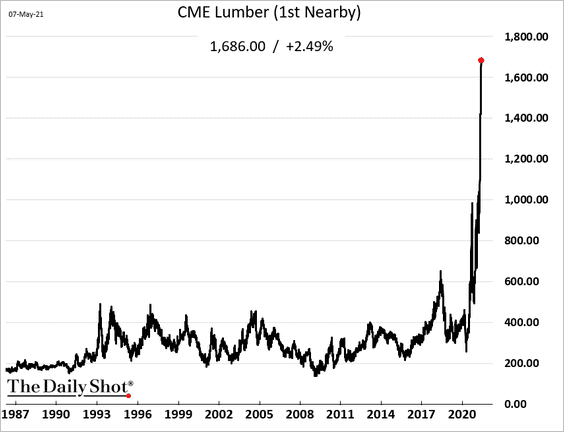
3. And here are US lumber futures …
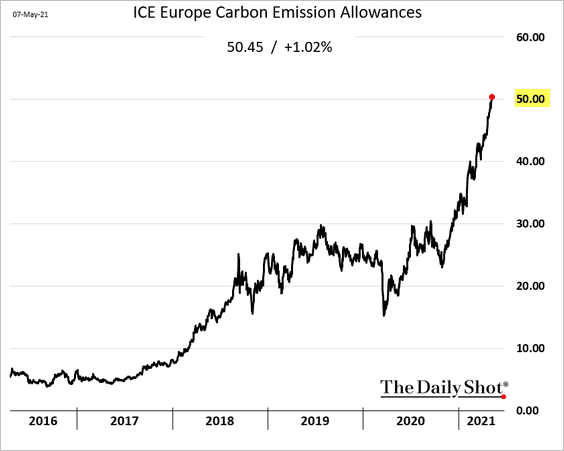
4. European emission allowances keep rallying.
Back to Index
Energy
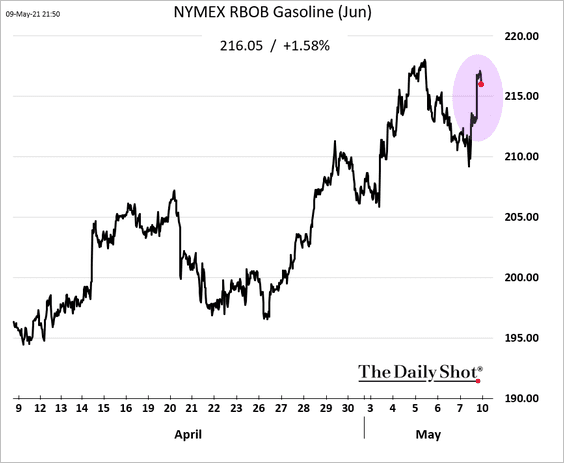
1. Gasoline prices are higher after Colonial Pipeline halts operations.
 Source: Platts Read full article
2. This chart shows US oil imports by country.
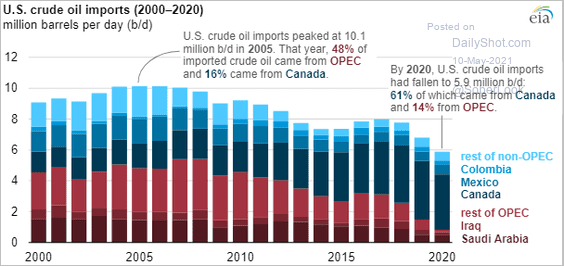 Source: @EIAgov
US net imports tumbled at the end of April.
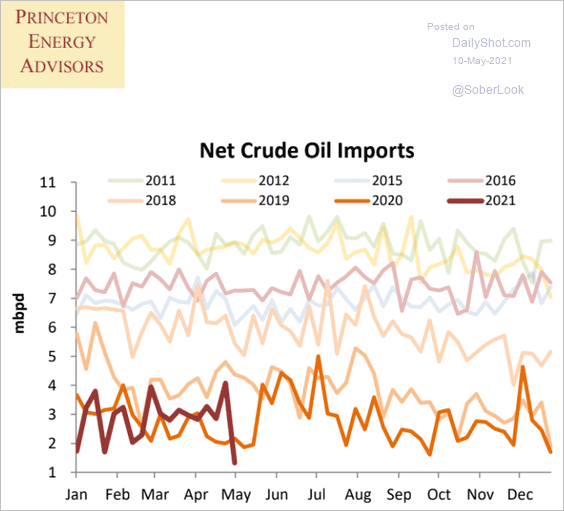 Source: Princeton Energy Advisors
——————–
3. Here is a forecast for the global energy mix.
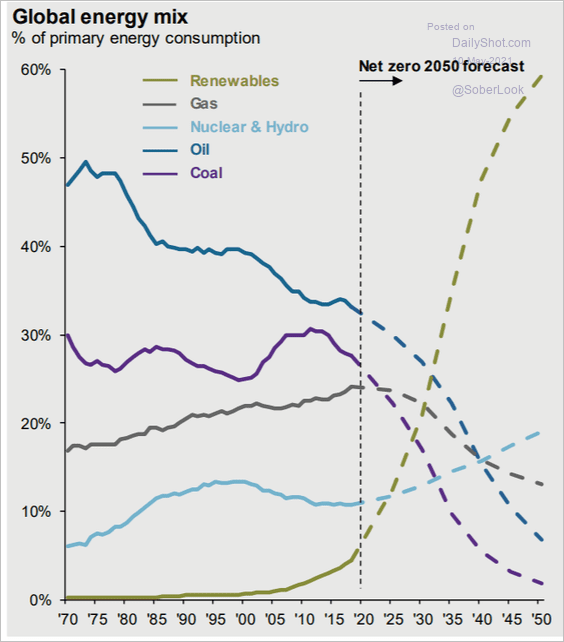 Source: J.P. Morgan Asset Management
Back to Index
Equities
1. The weak US employment report provided further tailwinds for stocks, including tech and cyclicals.
2. Value stocks continue to outperform.
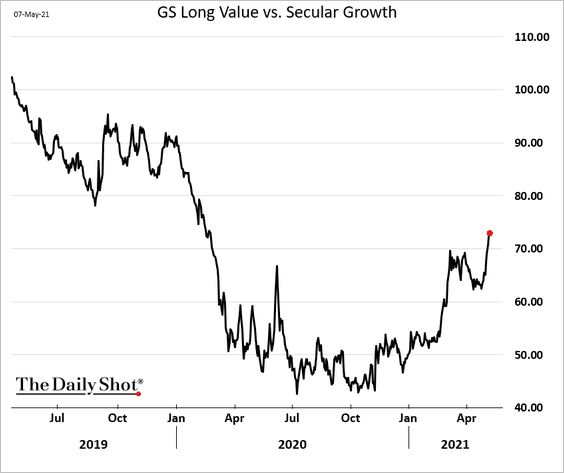
US value stocks have never performed this well relative to Treasuries and growth stocks, according to Arbor Data Science.
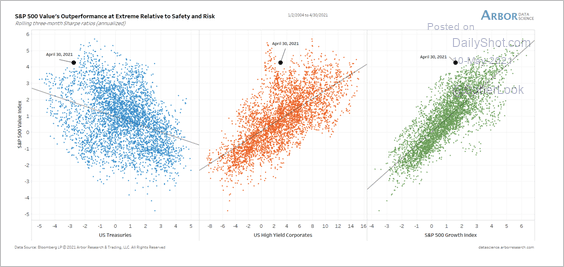 Source: Arbor Research & Trading
——————–
3. Investor demand for fixed-income is rebounding. Will we see a rotation out of equities?
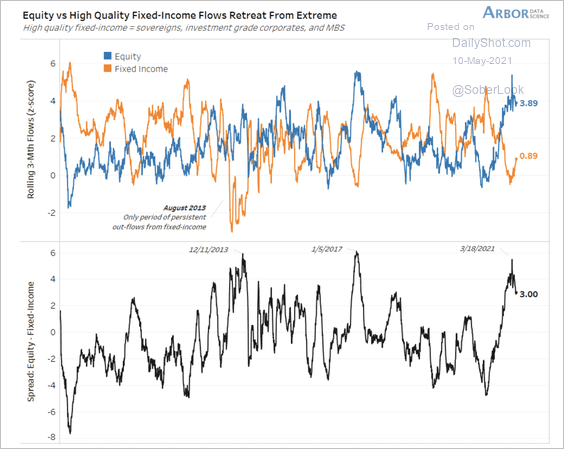 Source: Arbor Research & Trading
4. Stocks still appear attractive relative to Treasuries based on earnings yield.
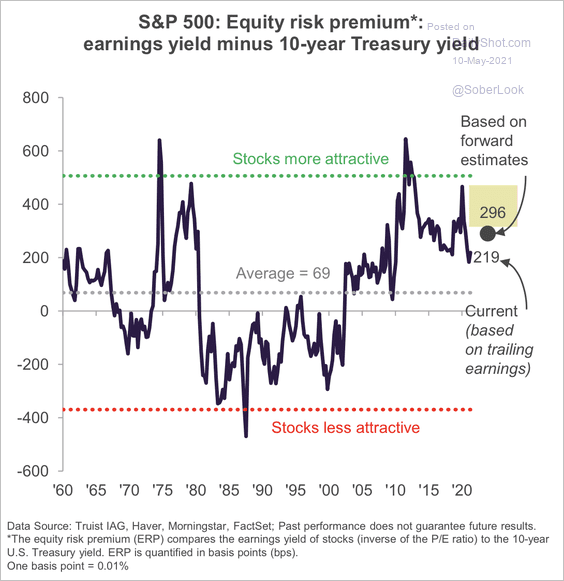 Source: Truist Advisory Services
5. Share buybacks are surging.
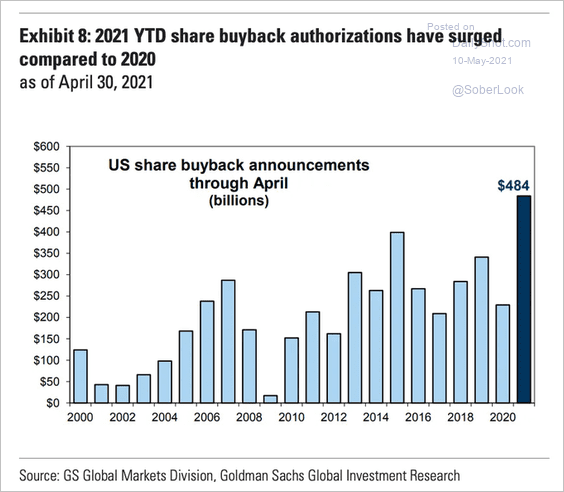 Source: Goldman Sachs, @WallStJesus
6. Industrial REITs have outperformed other real estate sectors over the past year.
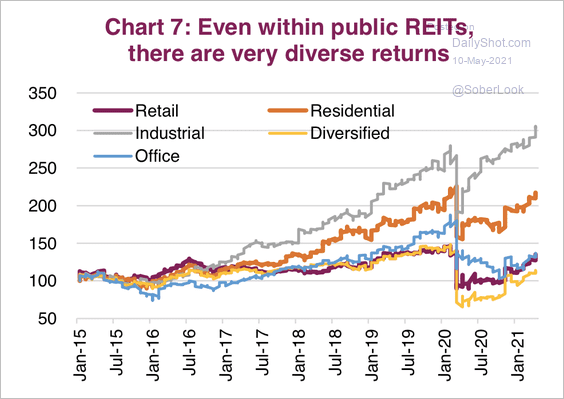 Source: Market Ethos, Richardson GMP
7. This chart shows the top five countries by equity market capitalization.
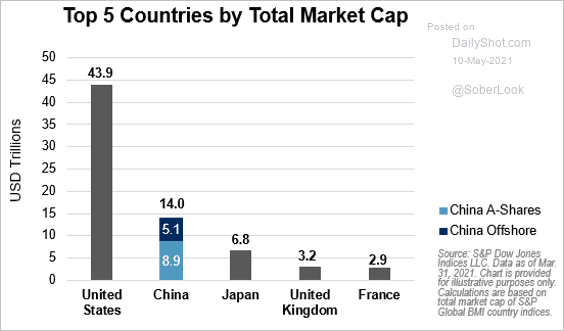 Source: S&P Global Market Intelligence
Back to Index
Credit
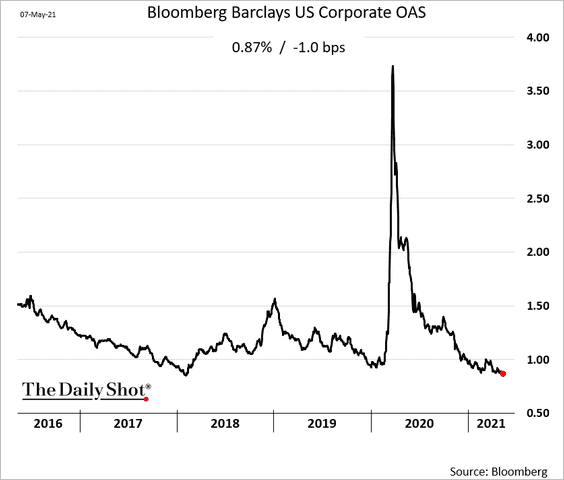
1. US investment-grade bond spreads hit the lowest level since 2018.
Real (inflation-adjusted) investment-grade bond yields continue to move deeper into negative territory.
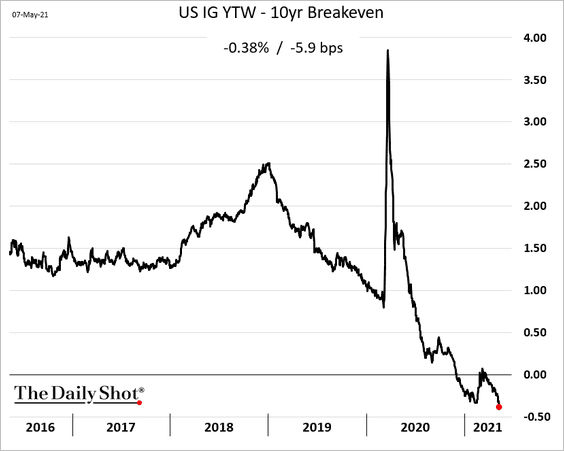 Source: @TheTerminal, Bloomberg Finance L.P.
——————–
2. This chart shows the average duration for high-yield and investment-grade bonds over time.
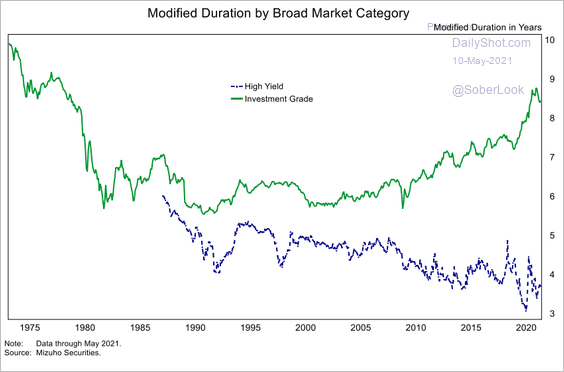 Source: Mizuho Securities USA
3. Next, we have net leverage trends for emerging vs. developed economies.
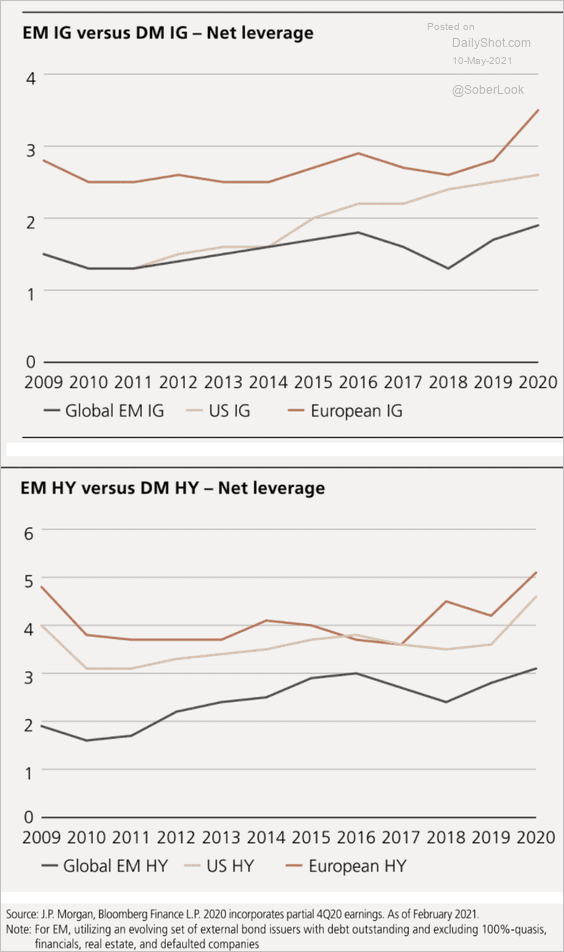 Source: UBS Asset Management
Back to Index
Rates
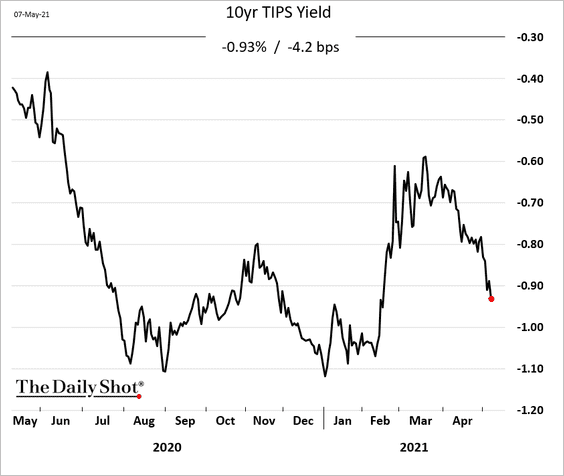
1. Real yields continue to fall amid demand for inflation-linked Treasuries (TIPS).
2. When should we expect the Fed to start tapering its QE purchases?
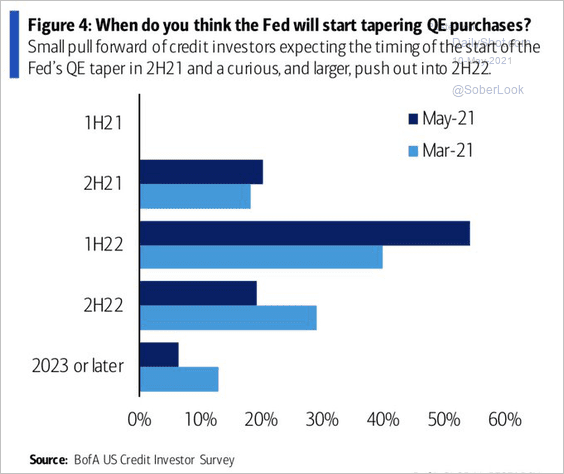 Source: BofA Global Research, @WallStJesus
Back to Index
Global Developments
1. This chart shows the average monthly performance of various currencies in a risk-on regime.
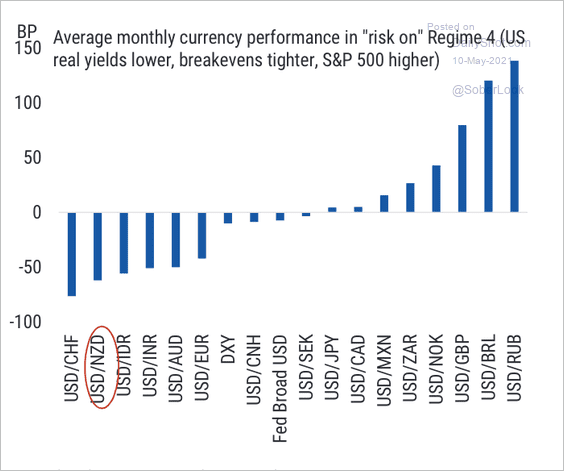 Source: Morgan Stanley Research
2. Here is the relationship between bond yields and aging populations.
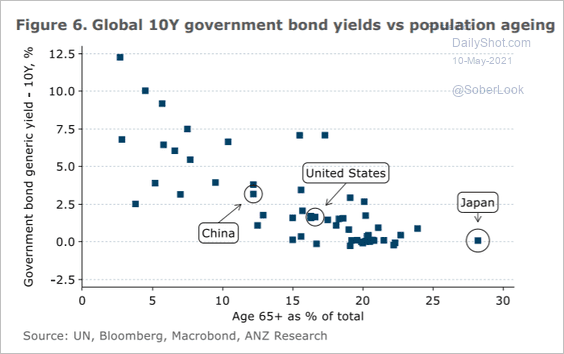 Source: ANZ Research
3. Inflation in the US and Europe has undershot the 2% threshold by a cumulative 6%-8% since the financial crisis.
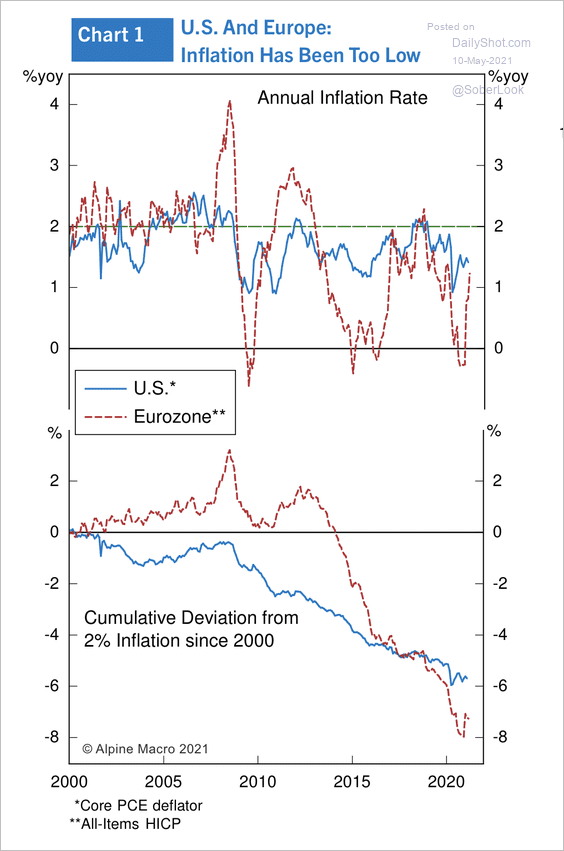 Source: Alpine Macro
——————–
Food for Thought
1. US car dealers’ inventories-to-sales ratio:
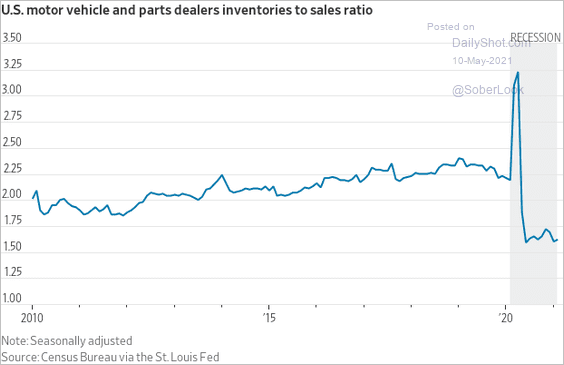 Source: @WSJ Read full article
2. Checking deposits by income group:
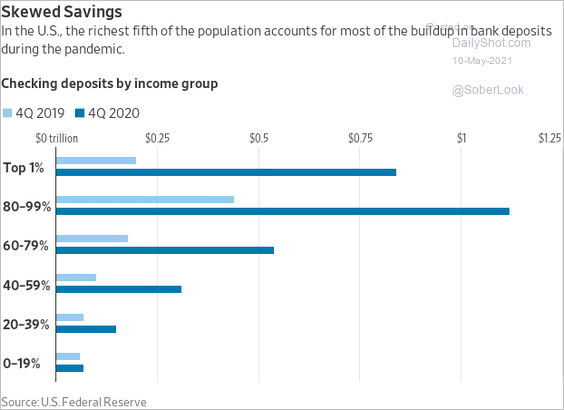 Source: @WSJ Read full article
3. Actual vs. reported COVID deaths:
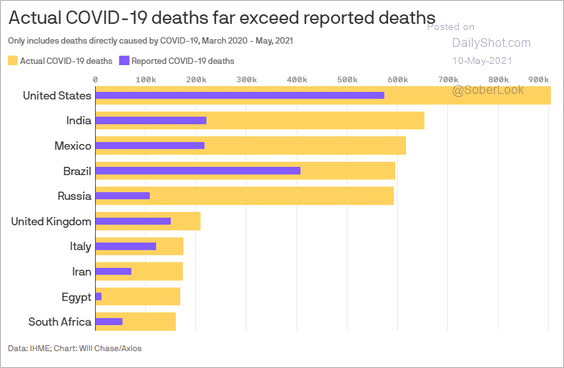 Source: @axios Read full article
4. Antibiotic discoveries …
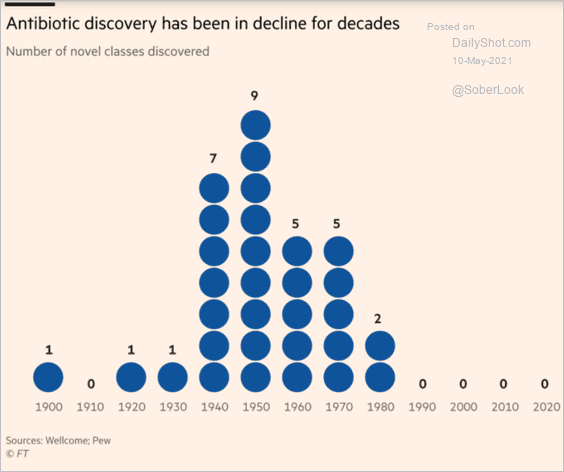 Source: @financialtimes Read full article
… and profitability:
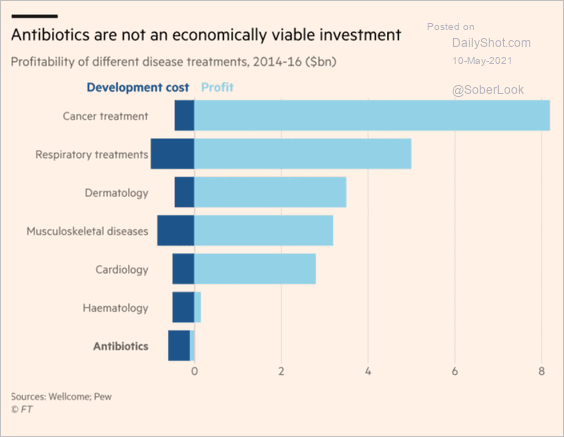 Source: @financialtimes Read full article
——————–
5. Presidents’ first solo news conference:
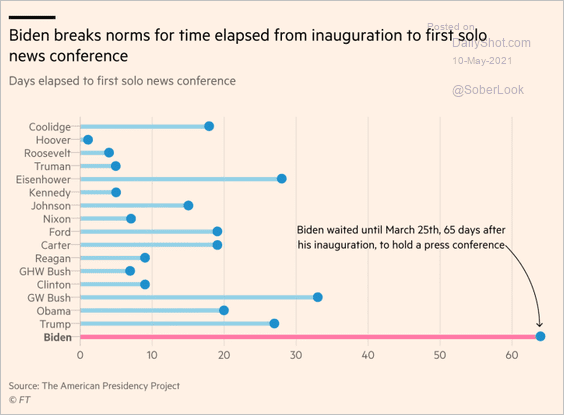 Source: @financialtimes Read full article
6. Firearms background checks:
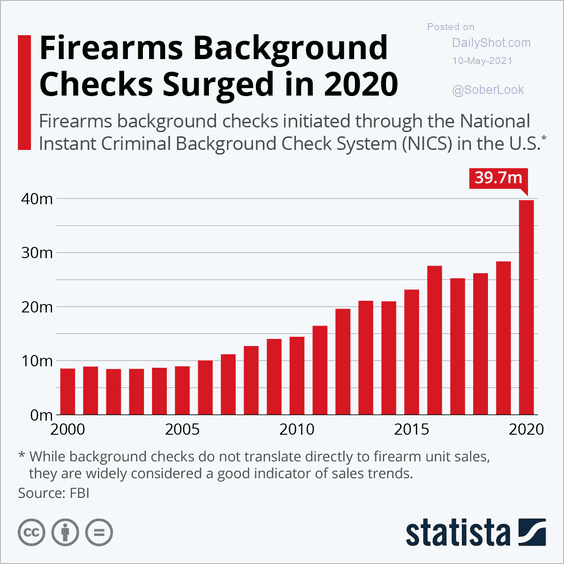 Source: Statista
7. US Latino-majority districts’ shift to GOP:
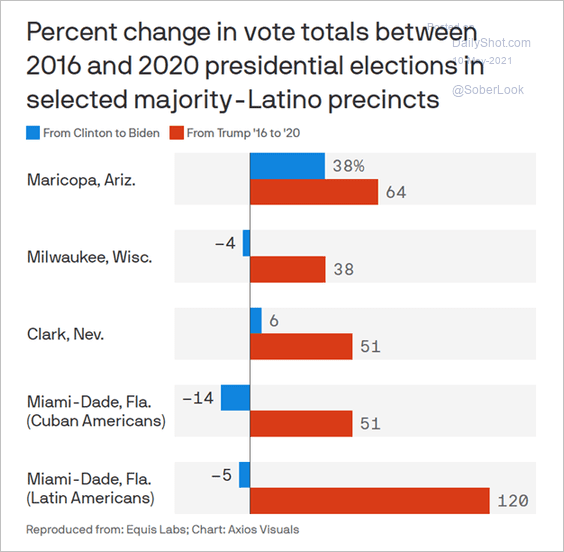 Source: @axios Read full article
8. Risk of gerrymandering:
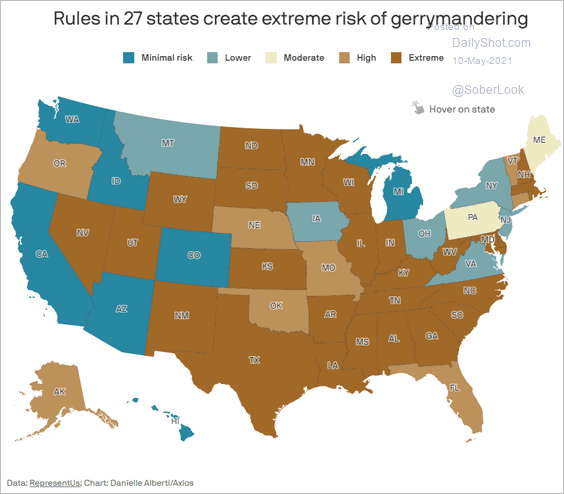 Source: @axios Read full article
9. Venomous animals in each state:
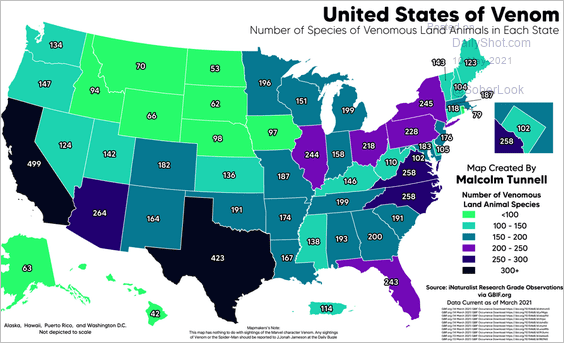 Source: r/dataisbeautiful
——————–
Back to Index