
The Daily Shot: 18-May-21
• The United States
• Canada
• The United Kingdom
• Europe
• Japan
• China
• Emerging Markets
• Cryptocurrency
• Commodities
• Energy
• Equities
• Rates
• Global Developments
• Food for Thought
The United States
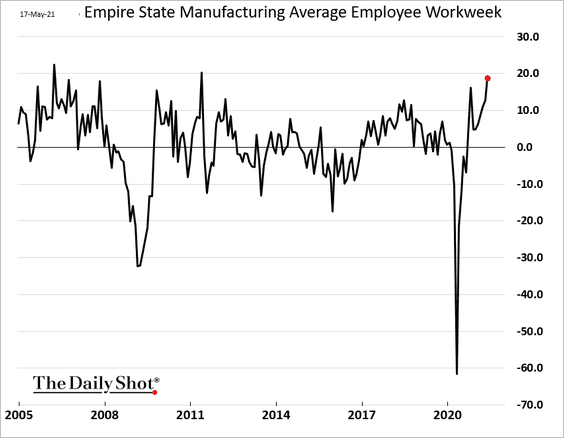
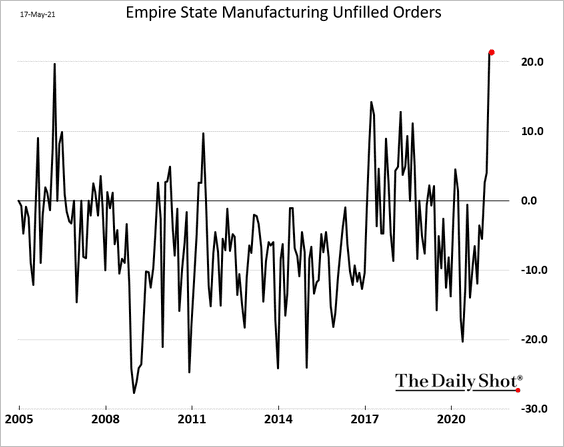
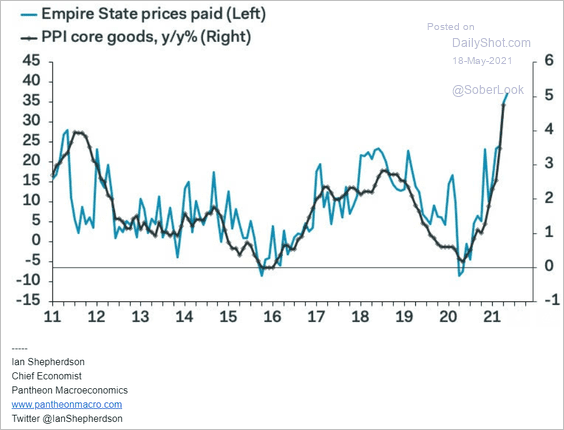
1. Empire State, the first regional manufacturing report of the month, shows robust factory activity in the NY region.
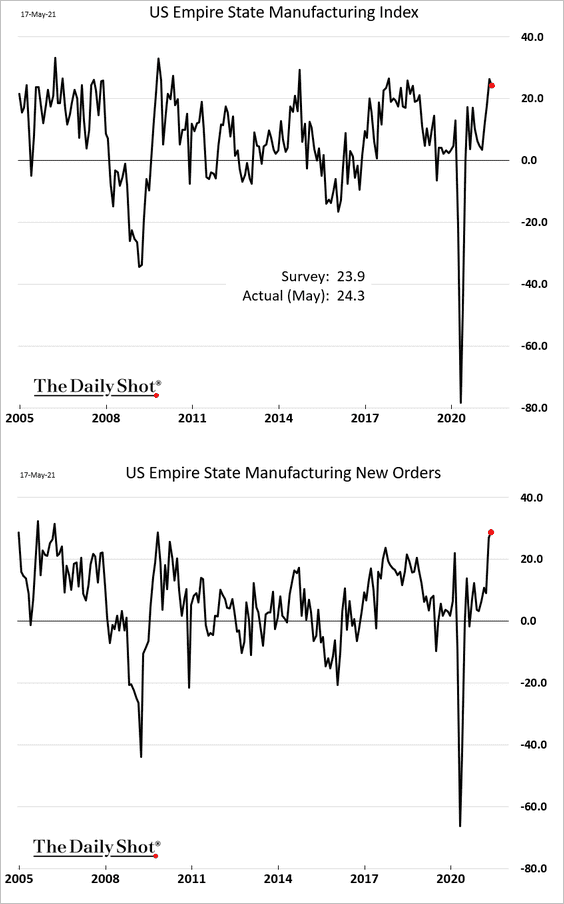
• Manufacturers are increasing employee hours.
• The backlog of orders remains elevated.
• And price pressures are intensifying.
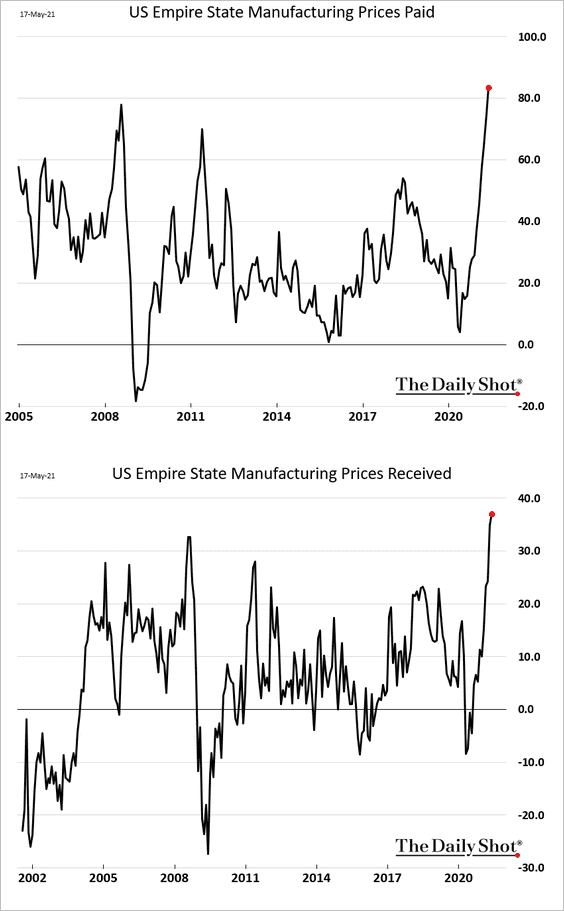
Here is a comparison to the US core goods PPI.
 Source: Pantheon Macroeconomics
——————–
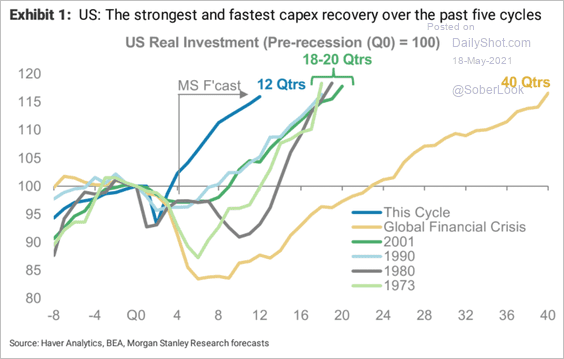
2. Morgan Stanley expects a rapid increase in CapEx over the coming years.
 Source: Morgan Stanley Research
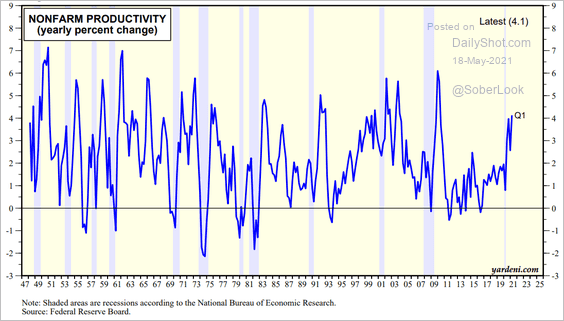
We should see further gains in productivity as a result of this recovery in business investment.
 Source: Yardeni Research
——————–
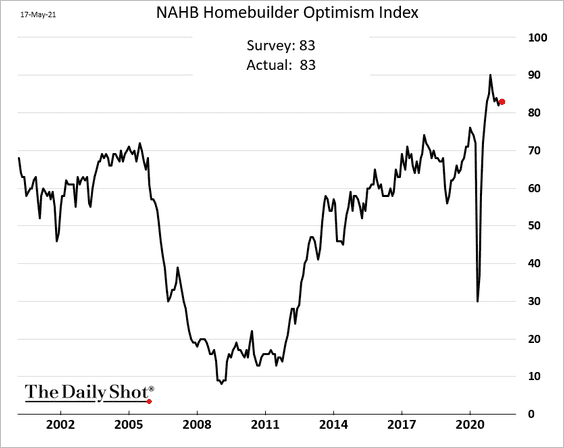
3. Next, we have some updates on housing.
• Homebuilders remain upbeat despite sharp increases in lumber prices.
• Is home price appreciation about to peak?
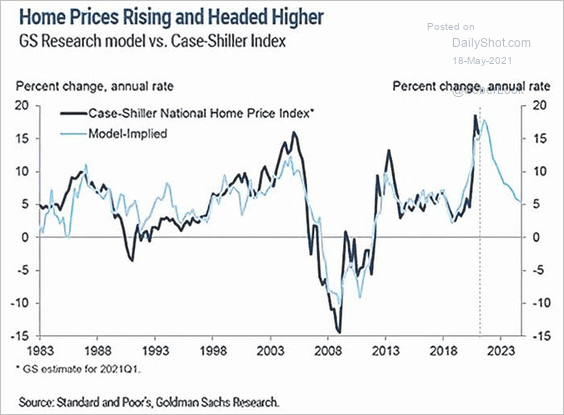 Source: @ISABELNET_SA, @GoldmanSachs
• This chart shows home price gains by price tier.
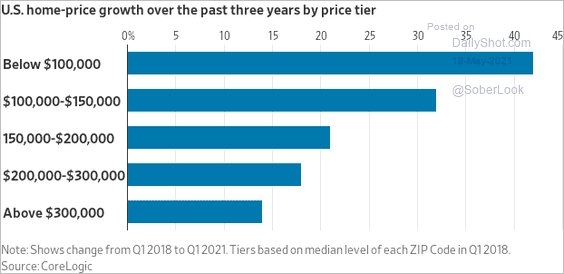 Source: @WSJ Read full article
• Inflation-adjusted home prices are near record highs.
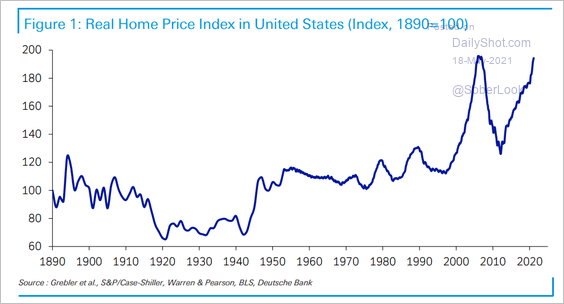 Source: Deutsche Bank Research
• The U. Michigan survey shows that consumers are increasingly negative on home buying conditions (due to high prices).
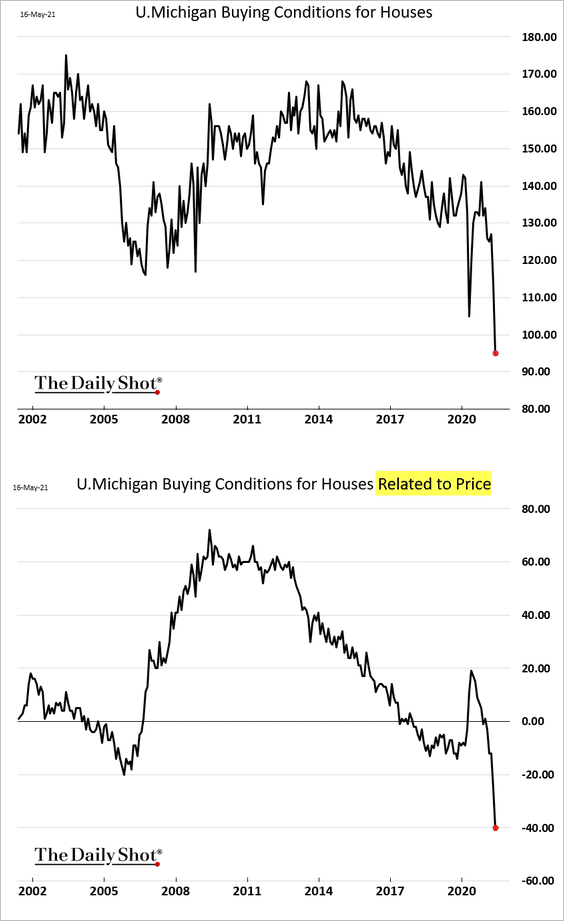
However, the latest Gallup survey suggests that consumers see home prices continuing to climb.
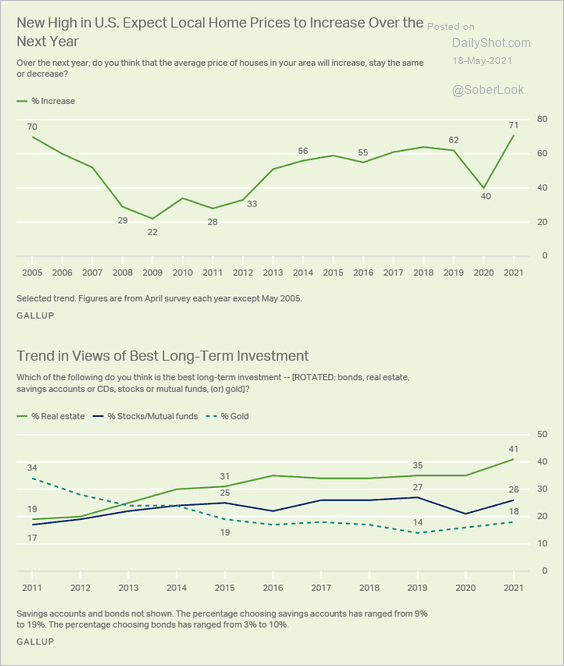 Source: Gallup Read full article
A national survey of consumers by the NY Fed is even more bullish on housing.
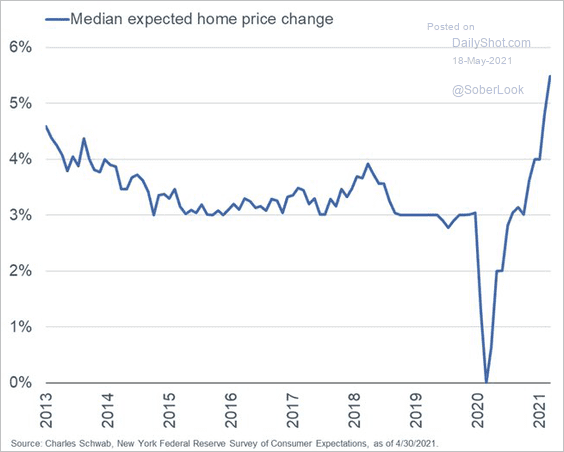 Source: @LizAnnSonders, @NewYorkFed
• Will rental evictions snap back to their historical average?
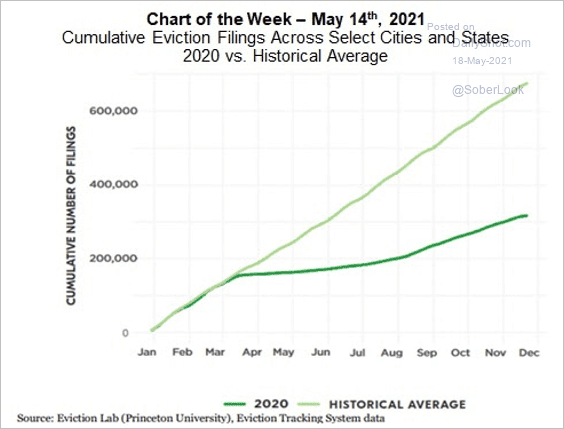 Source: Mortgage Bankers Association, Princeton University’s Eviction Lab
——————–
4. Now, let’s take a look at a couple of trends in the labor market.
• Continuing unemployment claims remain elevated.
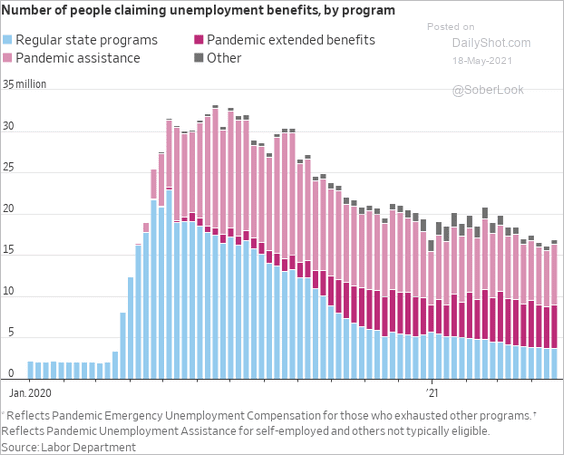 Source: @WSJ Read full article
• How many Americans are not in the labor force due to COVID?
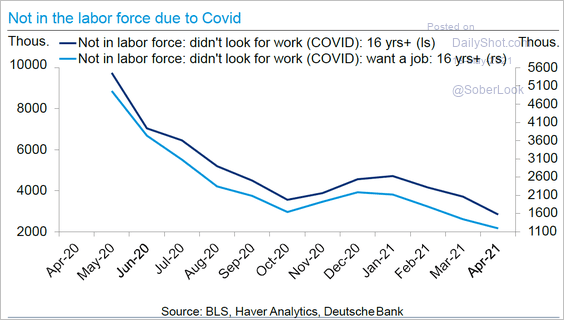 Source: Deutsche Bank Research
——————–
5. As inflation climbs, the real fed funds rate drops deep into negative territory. It’s an indication of extraordinary monetary accommodation.
 Source: @axios Read full article
Moreover, the economy could be growing at a double-digit rate (annualized) in the current quarter.
 Source: @GregDaco, @OxfordEconomics
But the Fed remains focused on the labor market, targeting “broad-based and inclusive” full employment.
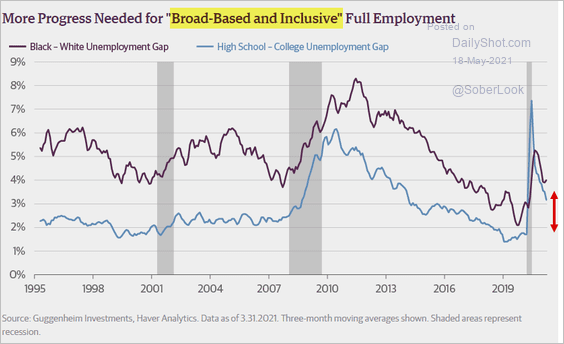 Source: Guggenheim Investment
——————–
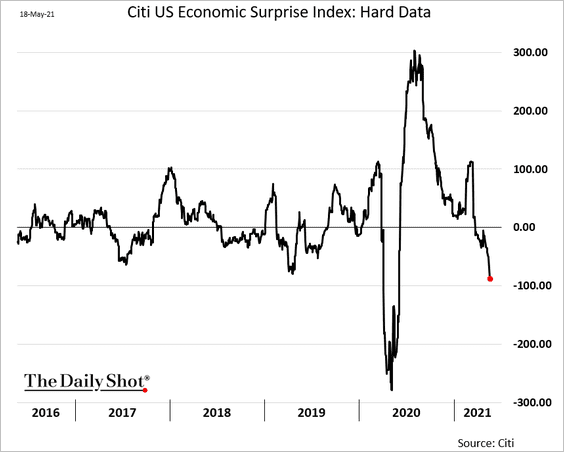
6. The hard-data component of the Citi Economic Surprise Index has been tumbling amid a string of disappointing results in April (employment, retail sales, etc.).
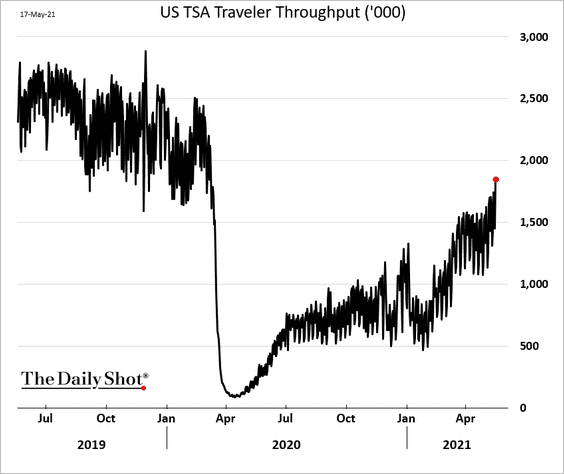
7. Mobility indices in large cities are gradually recovering but remain well below pre-COVID levels.
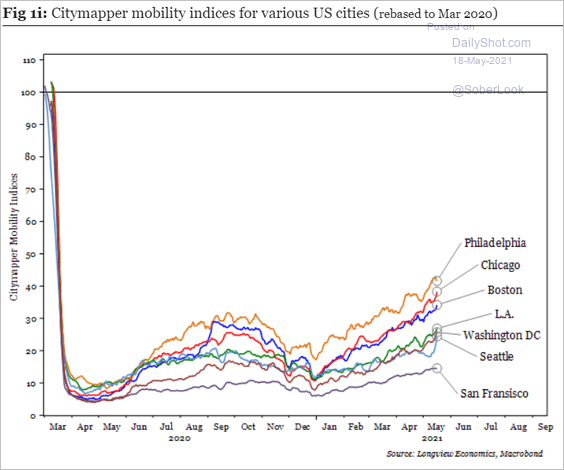 Source: Longview Economics
Airline travel continues to improve.
Back to Index
Canada
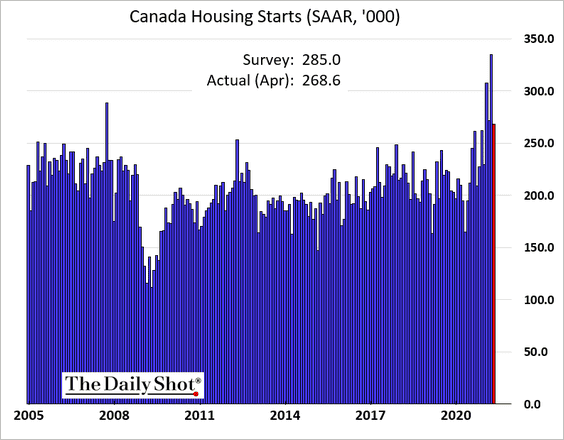
1. Canada’s housing sector went on spring break last month.
• Housing starts (strong but below forecasts):
• Existing home sales (a large decline):
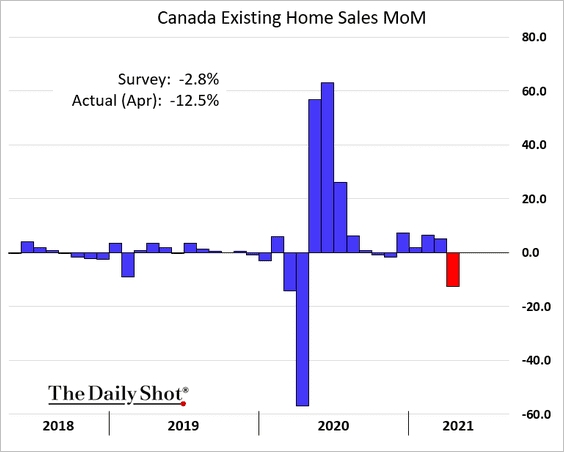
Worsening affordability may be taking its toll.
• The Desjardins affordability index:
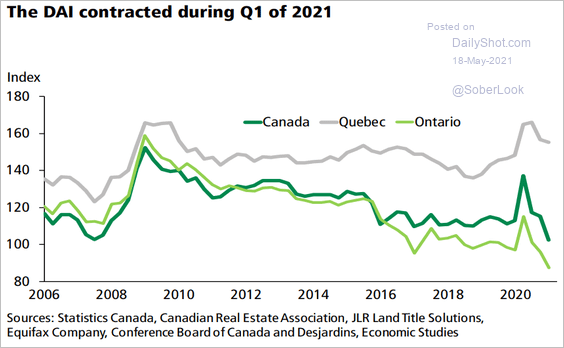 Source: Desjardins
• The ratio of housing prices to household income:
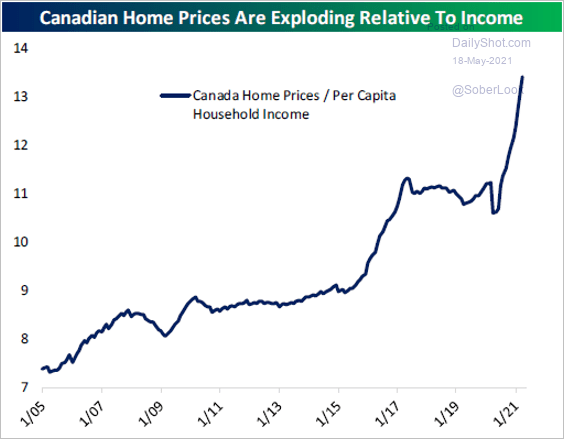 Source: @bespokeinvest Read full article
——————–
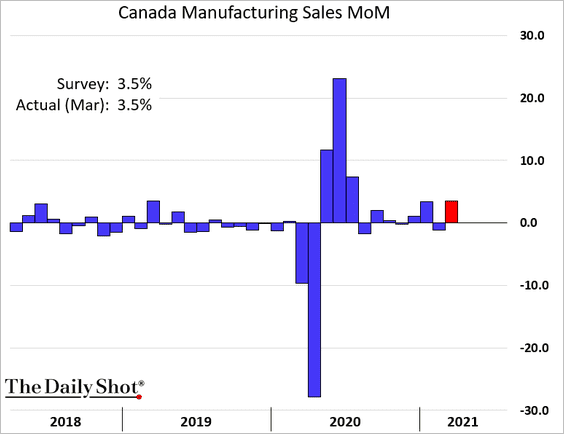
2. Factory sales rebounded in March.
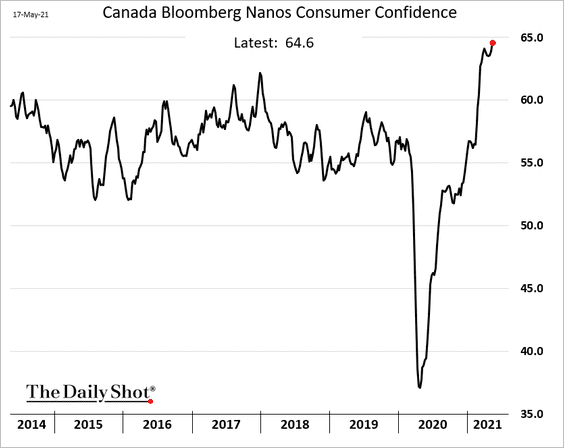
3. Consumer confidence is at multi-year highs.
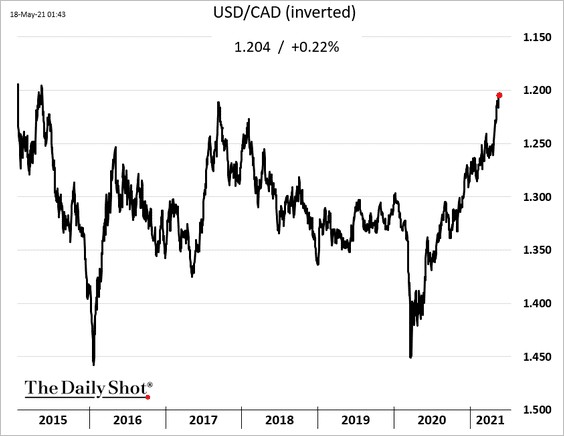
4. The loonie continues to rally vs. USD, approaching 1.2 for the first time since 2015.
Back to Index
The United Kingdom
1. COVID-related deaths have collapsed as a result of the successful vaccination campaign focused on older Britons.
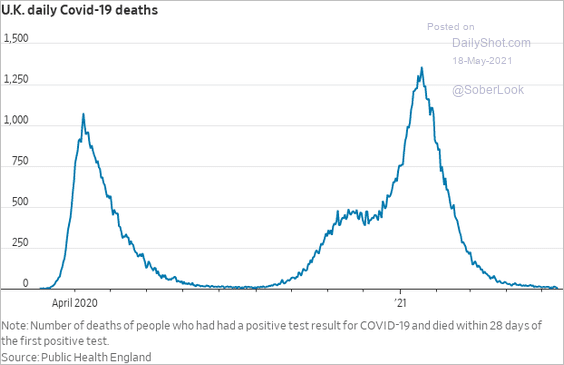 Source: @WSJ Read full article
But the ‘India variant’ has been spreading recently.
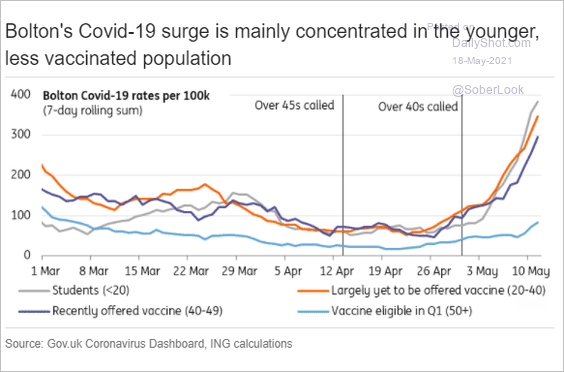 Source: ING
——————–
2. The housing supply imbalance points to higher prices ahead.
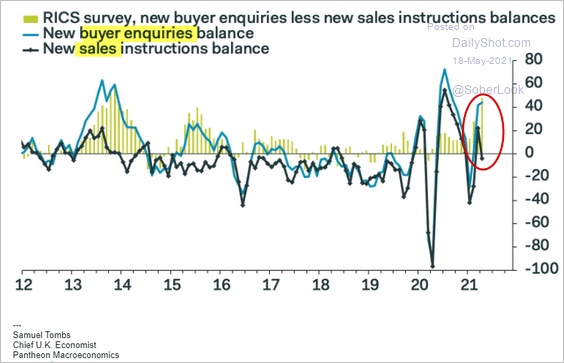 Source: Pantheon Macroeconomics
3. The job vacancy index has fully recovered.
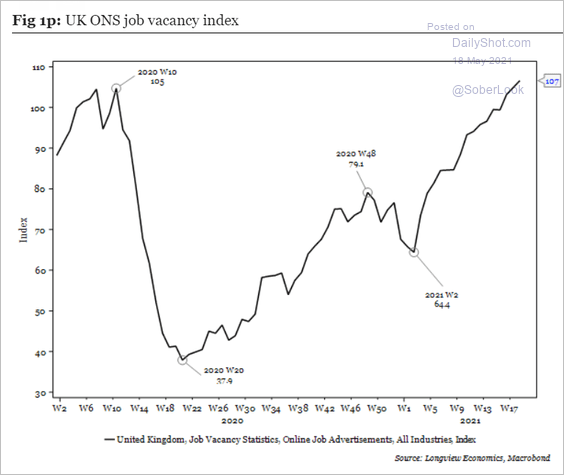 Source: Longview Economics
Back to Index
Europe
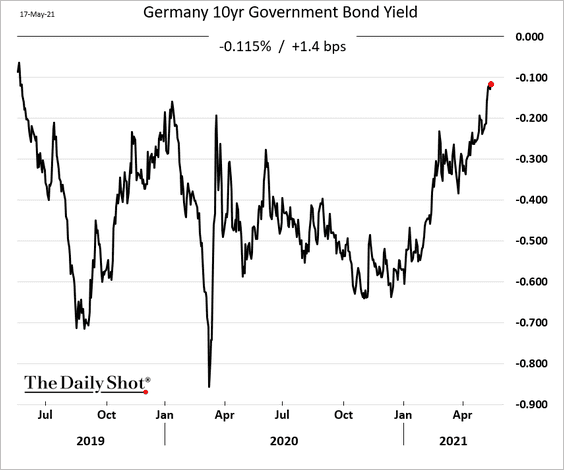
1. Bund yields continue to grind higher.
2. This chart shows the EC’s projections for the output gap.
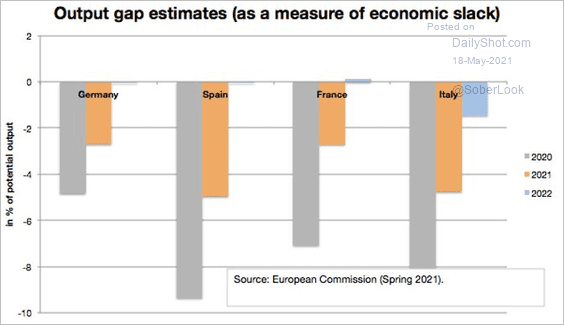 Source: @heimbergecon
3. EU’s lowest-paid women were hit the hardest by the COVID downturn.
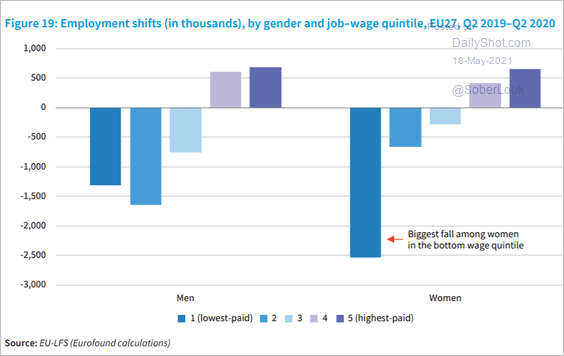 Source: Eurofound Read full article
4. Commodity price gains are pointing to higher PPI ahead.
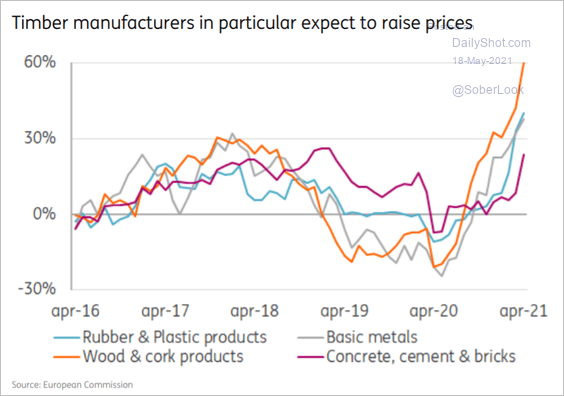 Source: ING
5. Finally, we have some data on platform (gig) work in the EU and the UK.
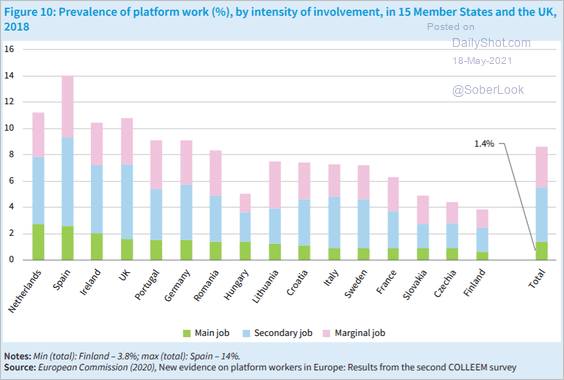 Source: Eurofound Read full article
Back to Index
Japan
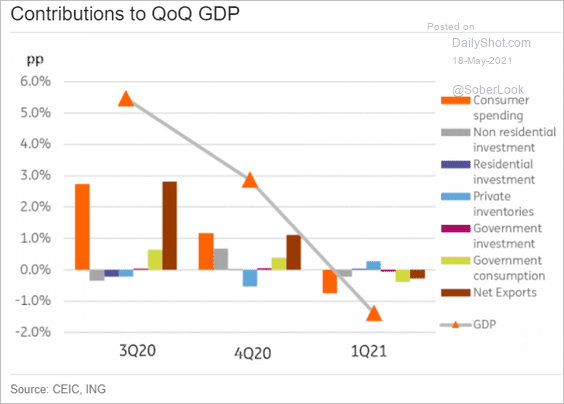
1. The Q1 GDP growth was softer than expected.
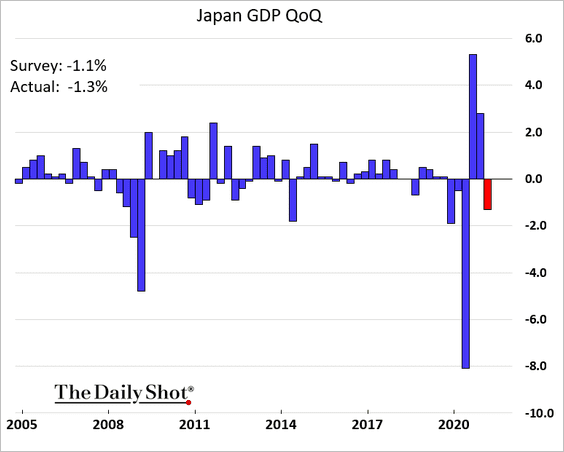
Business spending weakened.
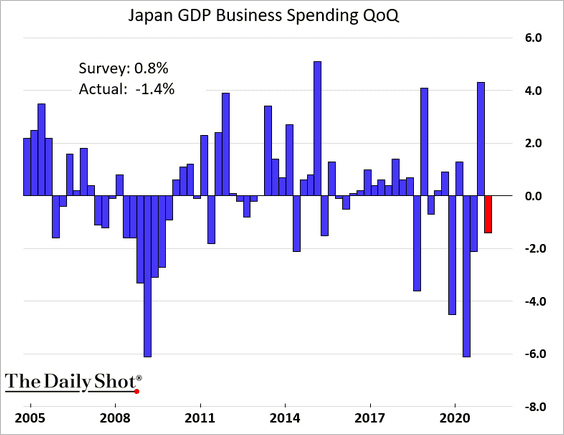
Here is the breakdown.
 Source: ING
——————–
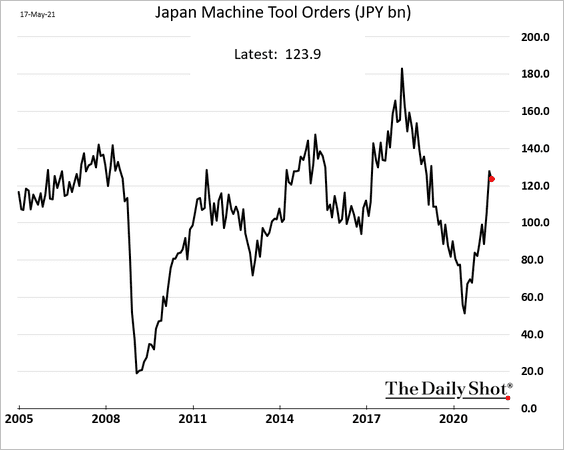
2. Machine tool orders are now well above pre-COVID levels.
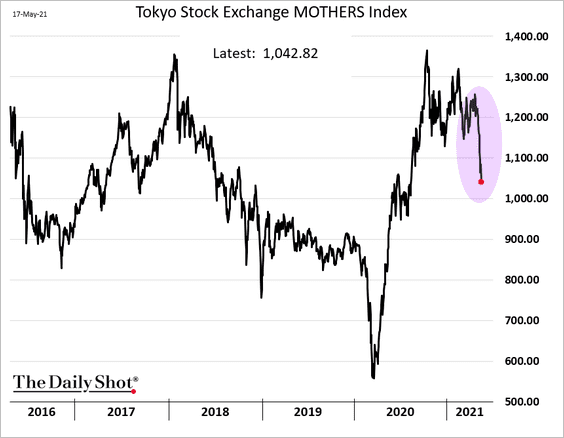
3. The Mothers index has sold off sharply.
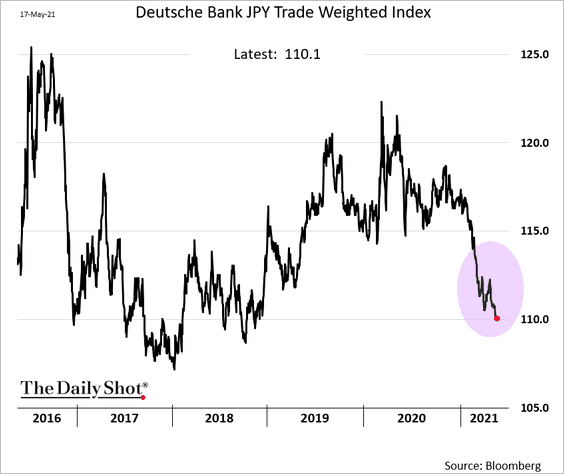
4. The trade-weighted yen continues to drift lower.
Back to Index
China
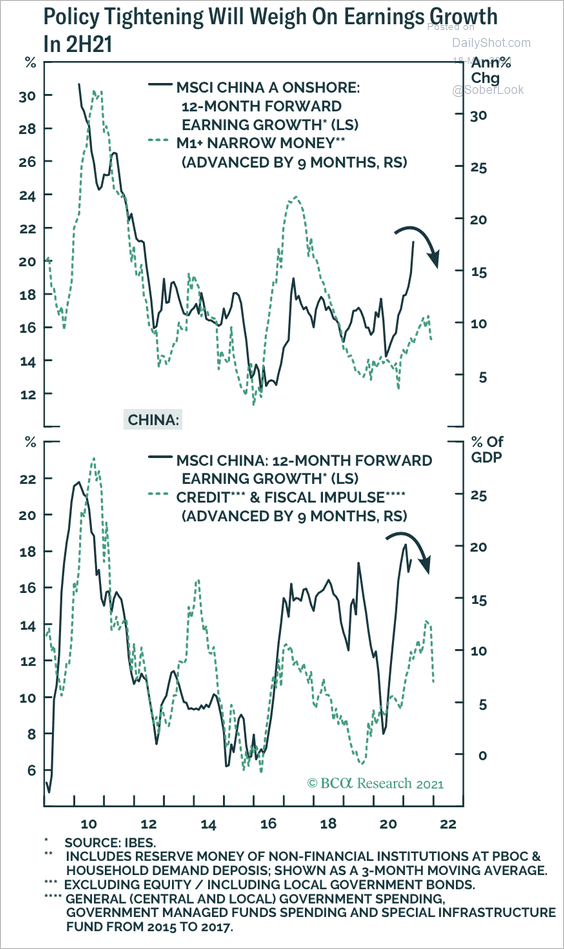
1. Companies will likely see lower earnings growth this year due to policy tightening, …
 Source: BCA Research
… while the rising renminbi could weigh on exporter profits.
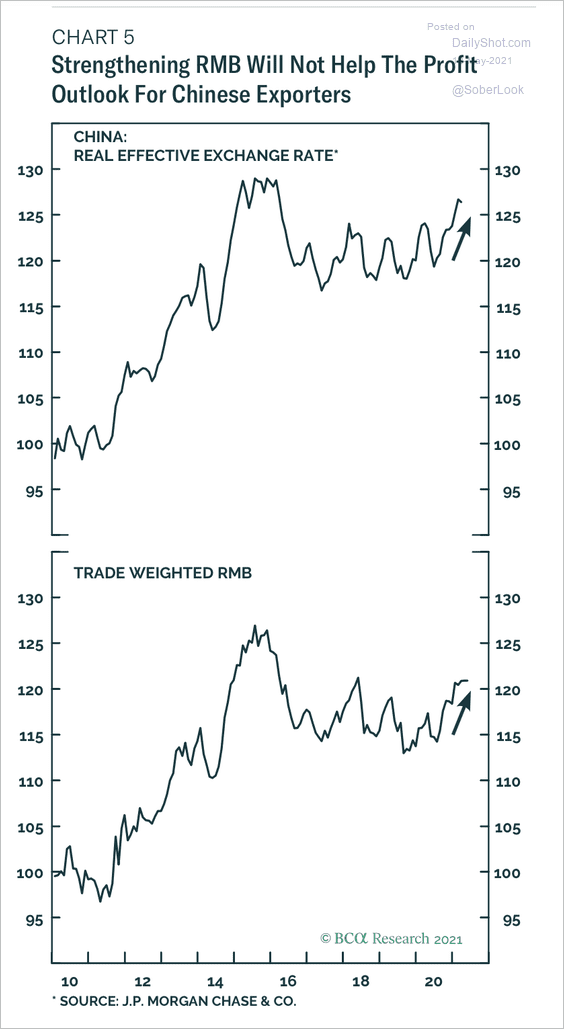 Source: BCA Research
——————–
2. China continues to dominate global solar panel production.
 Source: Statista
Back to Index
Emerging Markets
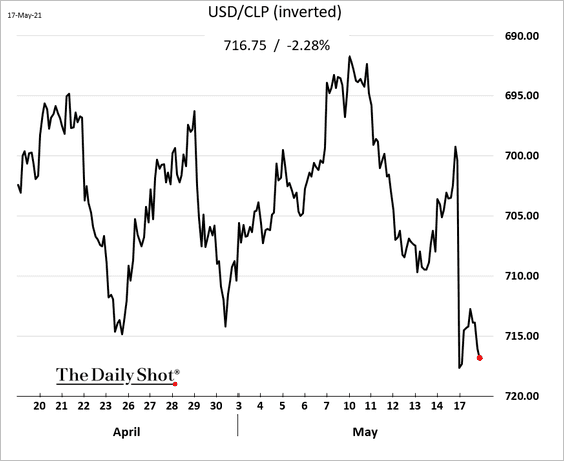
1. Chile elected a left-leaning assembly.
 Source: Reuters Read full article
Asset prices tumbled.
• The peso:
• The stock market:
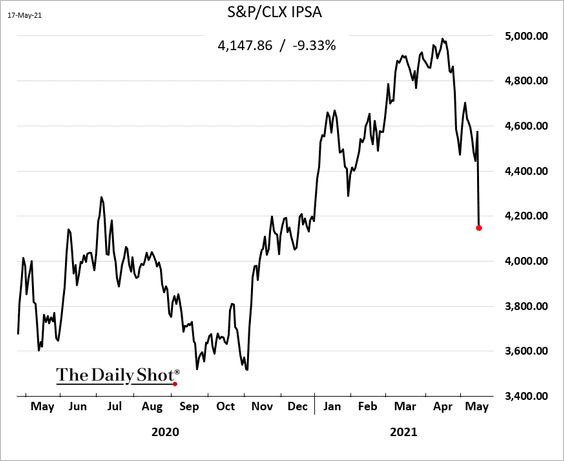
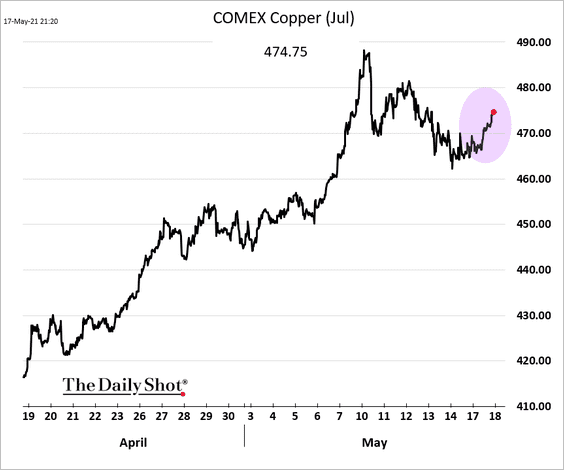
There are now potential headwinds for the mining industry.
 Source: @bpolitics Read full article
US copper futures gained in response.
——————–
2. Argentina’s foreign reserves appear to have stabilized, partially as a result of the recent rally in soy prices.
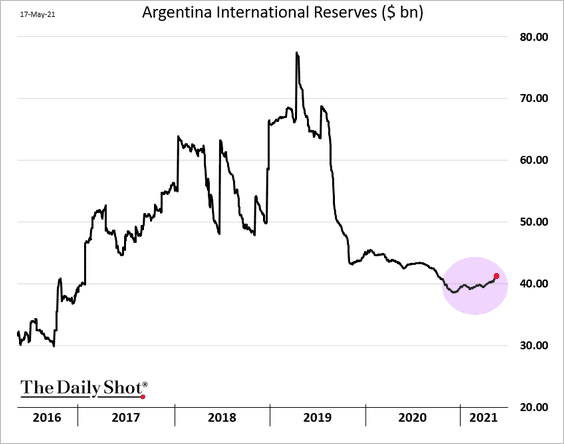 h/t @jongilbert9
3. Russia’s real incomes hit the lowest level in over a decade.
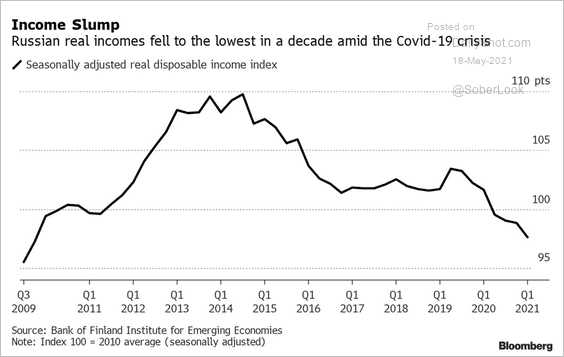 Source: @markets Read full article
4. This scatterplot shows EM core vs. headline CPI.
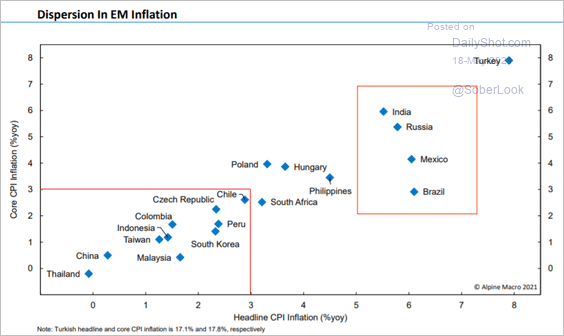 Source: Alpine Macro
5. Does the EM/DM growth divergence point to EM equity underperformance ahead?
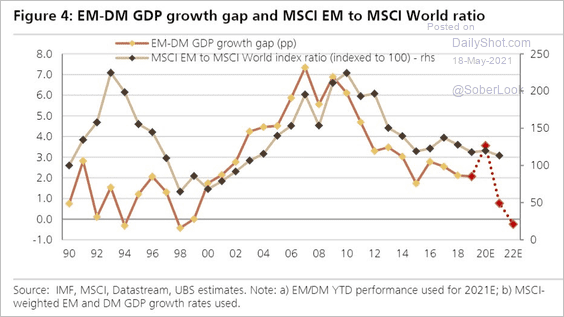 Source: UBS, @jsblokland
6. EM debt issuance increased in March.
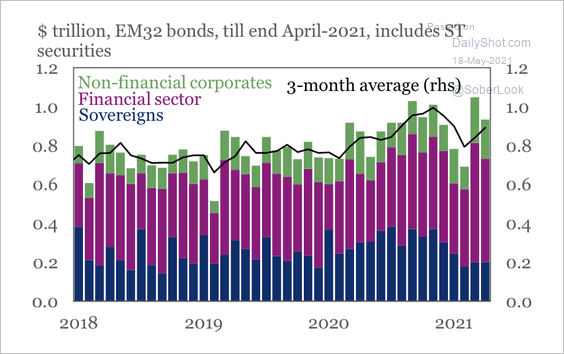 Source: IIF
7. The charts below show last year’s changes in public debt levels and unemployment in ASEAN.
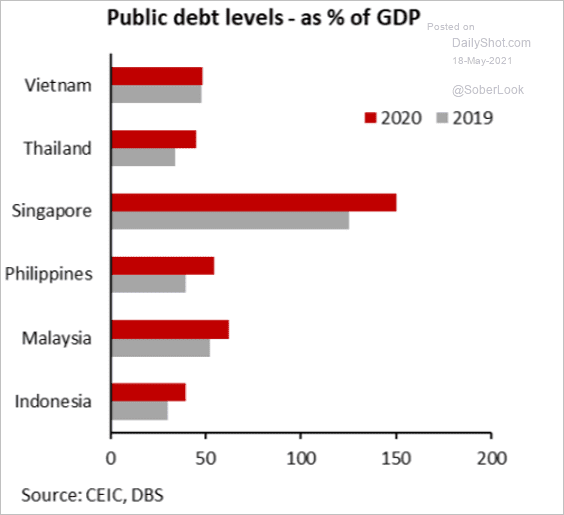 Source: DBS
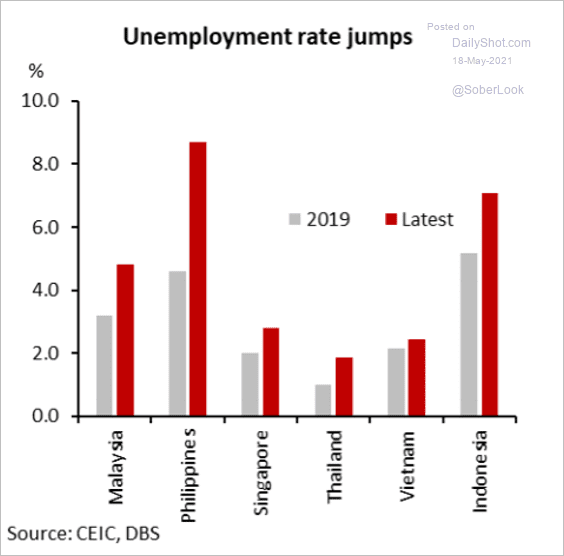 Source: DBS
Back to Index
Cryptocurrency
1. Here are the top cryptocurrencies by market cap.
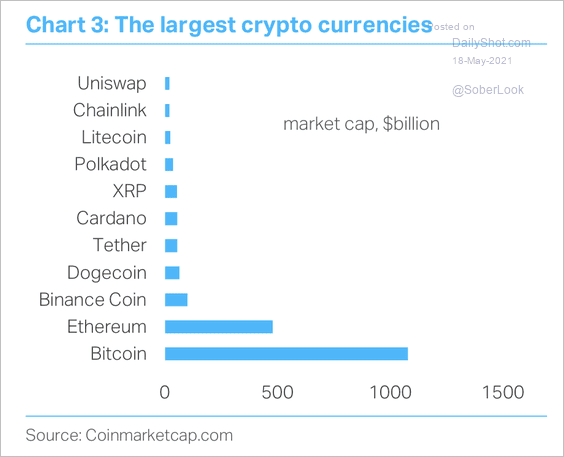 Source: TS Lombard
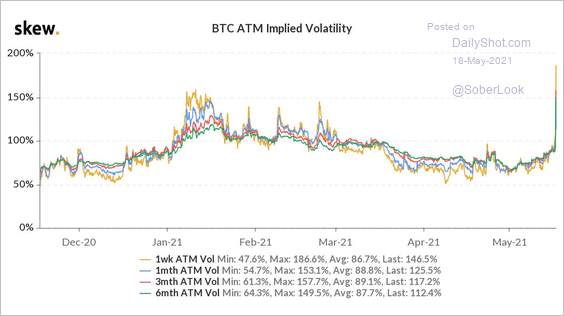
2. Bitcoin’s implied volatility spiked to the highest level in a year over the weekend.
 Source: @skewdotcom
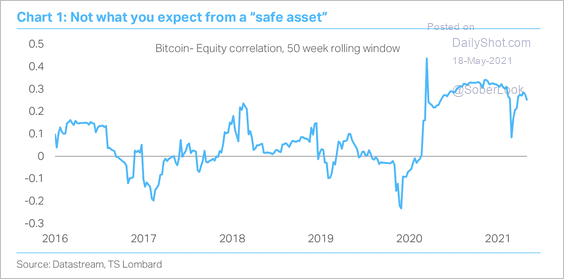
3. Bitcoin’s correlation to the S&P 500 has been elevated over the past year.
 Source: TS Lombard
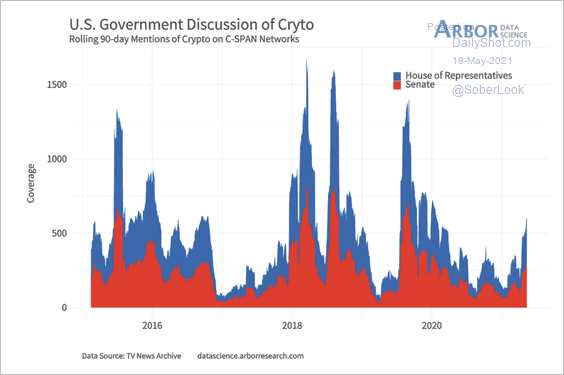
4. This chart shows how frequently US policymakers mention crypto.
 Source: Arbor Research & Trading
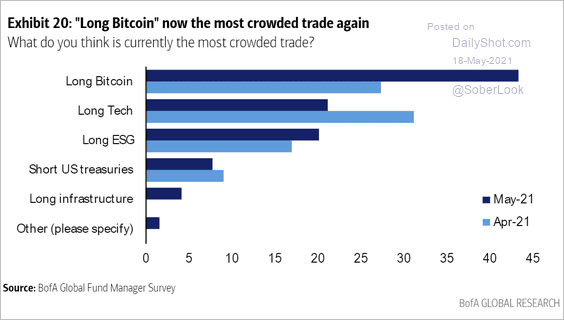
5. According to BofA’s Global Fund Manager Survey (FMS), bitcoin is now the most crowded trade.
 Source: BofA Global Research; @Callum_Thomas
6. Crypto scams surged since the start of the pandemic.
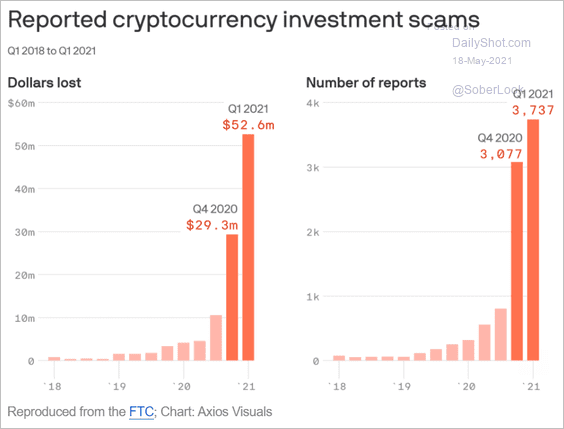 Source: @axios Read full article
Back to Index
Commodities
1. Rotation from bitcoin to gold (2 charts)?
 Source: barchart.com
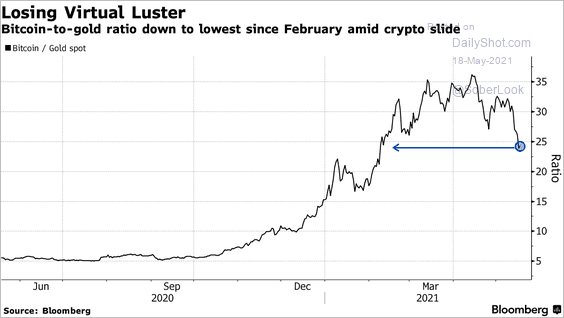 Source: @markets Read full article
——————–
2. Silver has been rallying.
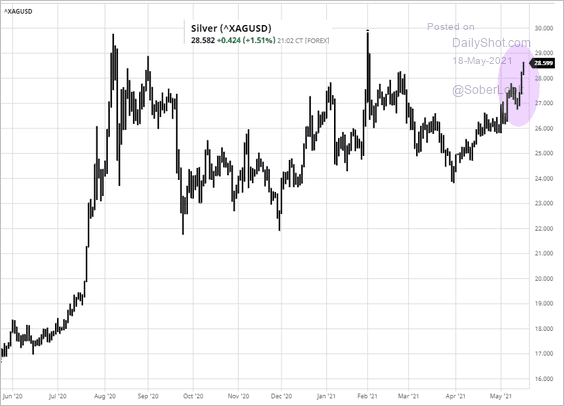 Source: barchart.com
3. Technicals suggest that the rally in corn and soybeans has reached an extreme (2 charts).
 Source: BCA Research
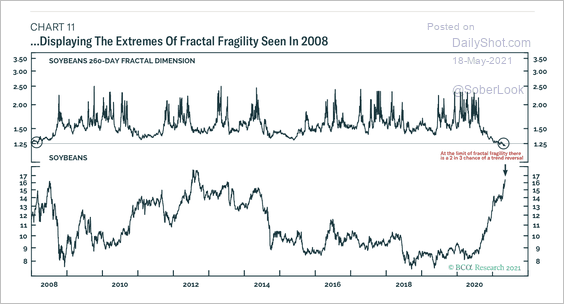 Source: BCA Research
——————–
4. North American lumber capacity hasn’t grown much in recent years.
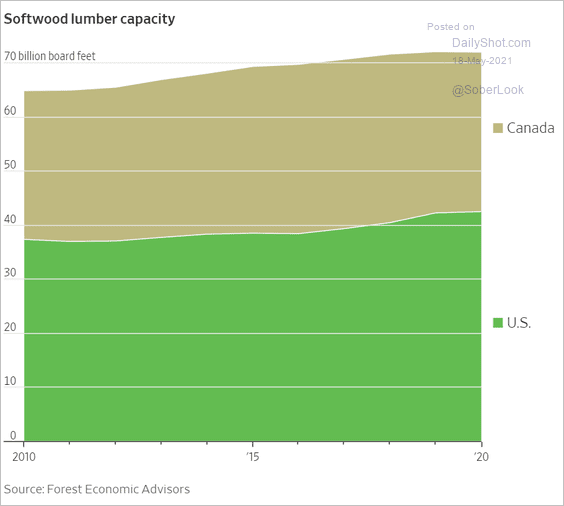 Source: @WSJ Read full article
Back to Index
Energy
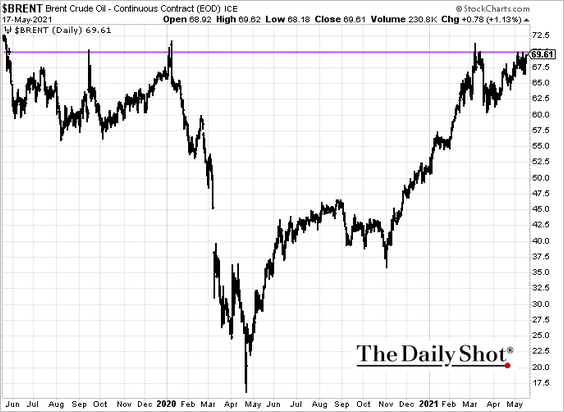
1. Brent is once again testing resistance at $70/bbl.
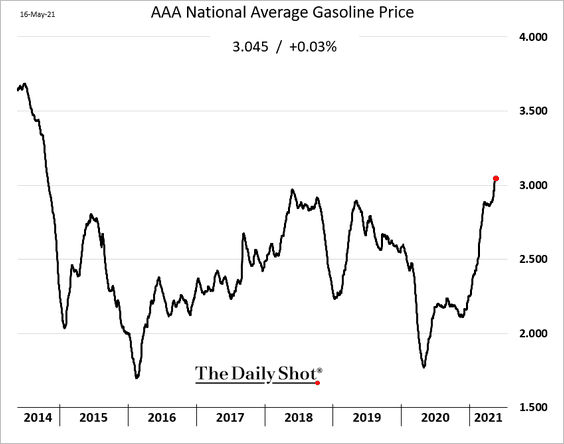
2. US retail gasoline prices remain elevated.
 Source: Reuters Read full article
Back to Index
Equities
1. The second year of a bull market tends to be choppier with positive but moderating returns, according to Truist Advisory Services.
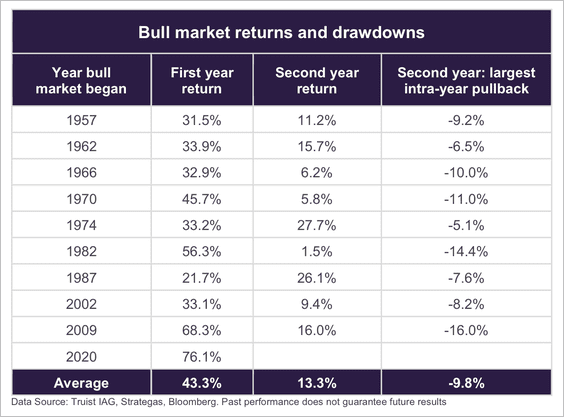 Source: Truist Advisory Services
2. The S&P 500 has not seen a 5% correction since last fall – one of the longest extensions over the past decade.
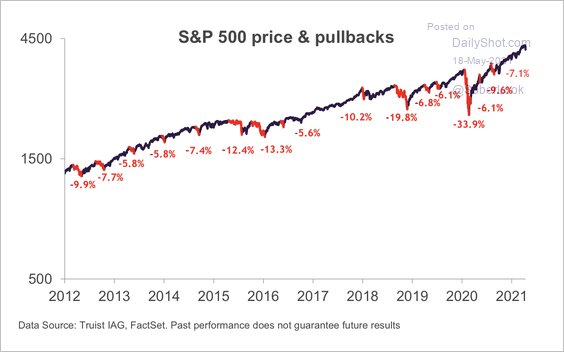 Source: Truist Advisory Services
3. The global stock/bond ratio remains stretched.
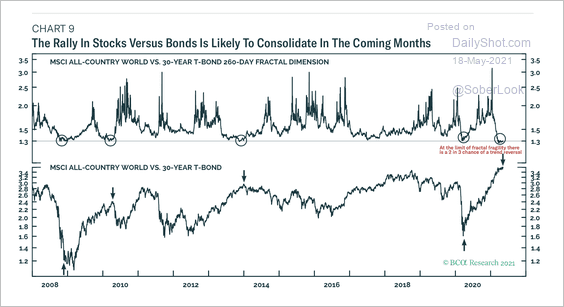 Source: BCA Research
4. Strong corporate sentiment during earnings calls tends to favor cyclical sectors.
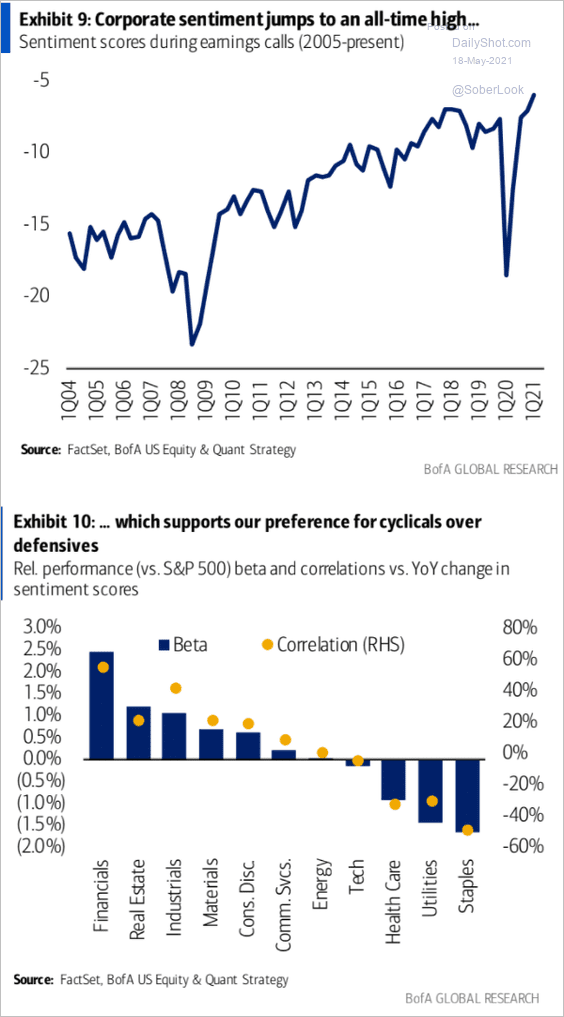 Source: BofA Global Research
5. Historically, when the put/call ratio increases, the market has already experienced a drawdown and tends to trade flat for about two weeks and positive one month later.
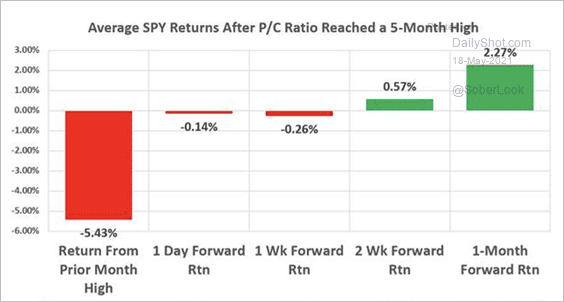 Source: Susquehanna Derivative Strategy
6. Short positioning in SPY (S&P 500 ETF) is near extreme lows.
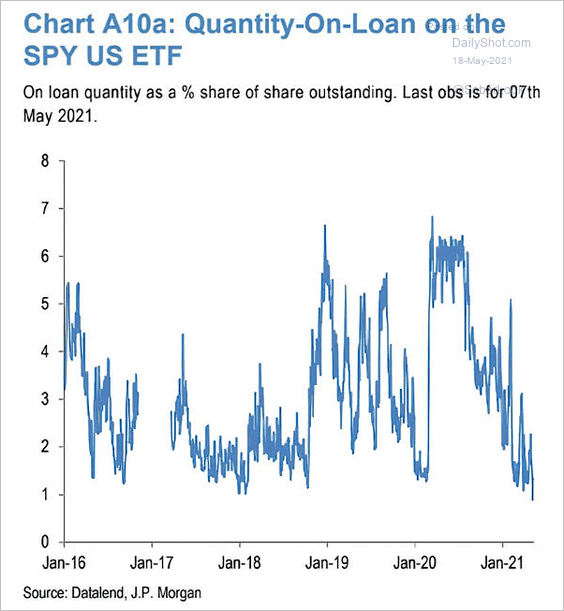 Source: @ISABELNET_SA, @jpmorgan
7. Share buyback activity has accelerated.
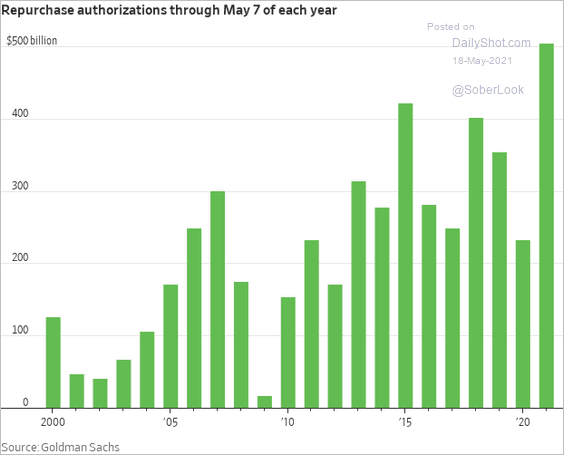 Source: @WSJ Read full article
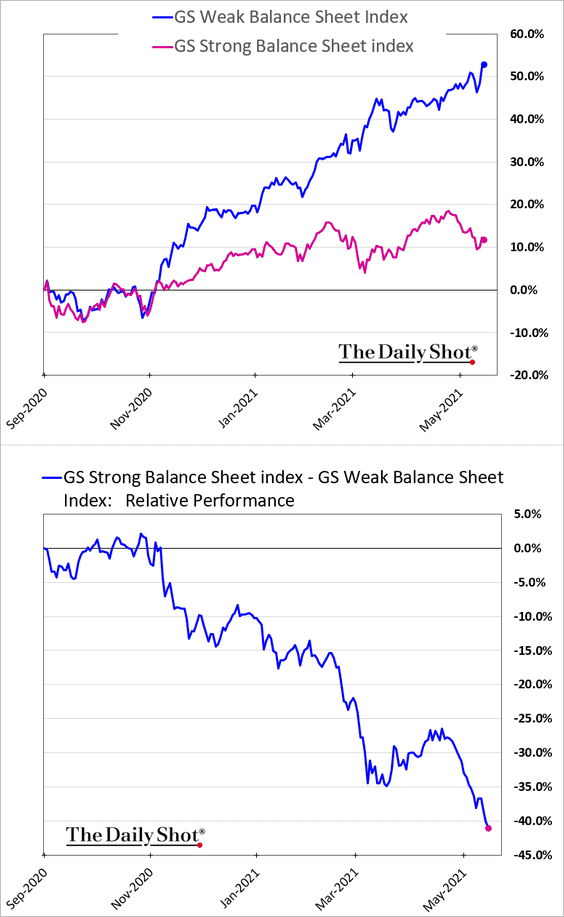
8. Companies with weak balance sheets (more leverage) are widening their outperformance vs. those with strong balance sheets.
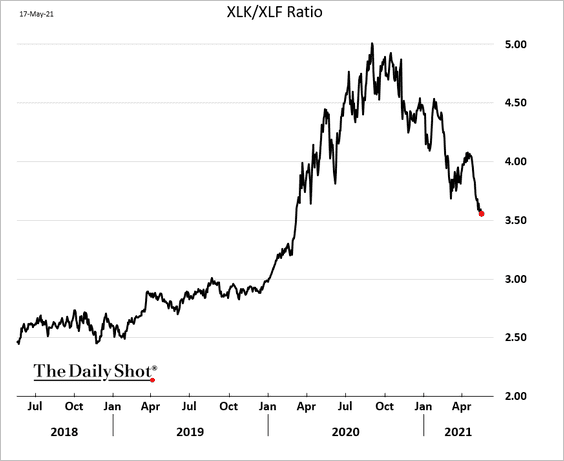
9. Fund managers have been dumping tech stocks.
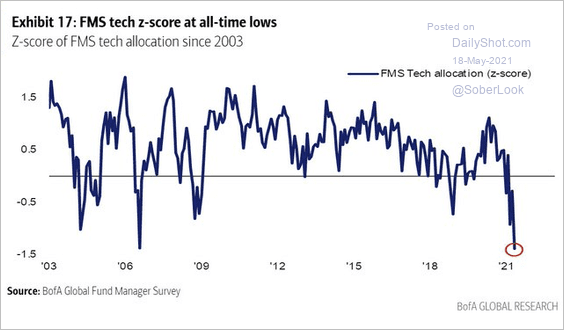 Source: BofA Global Research; @Callum_Thomas
Here is the S&P 500 tech/financials ratio.
——————–
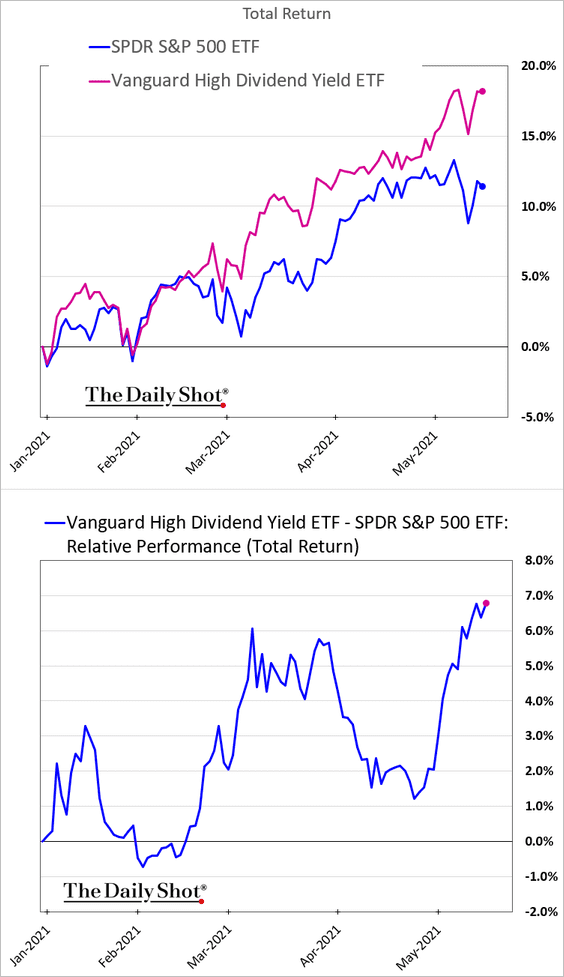
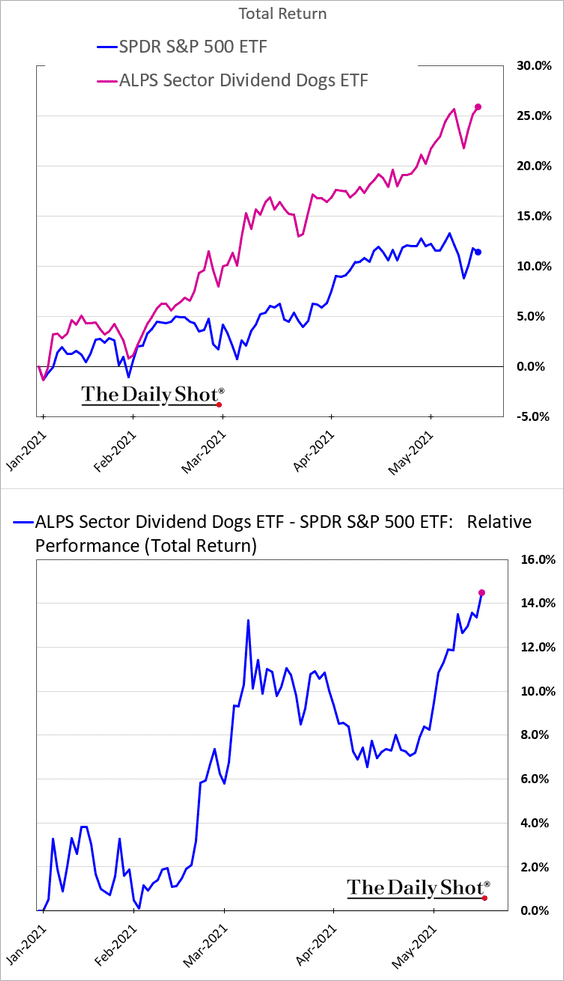
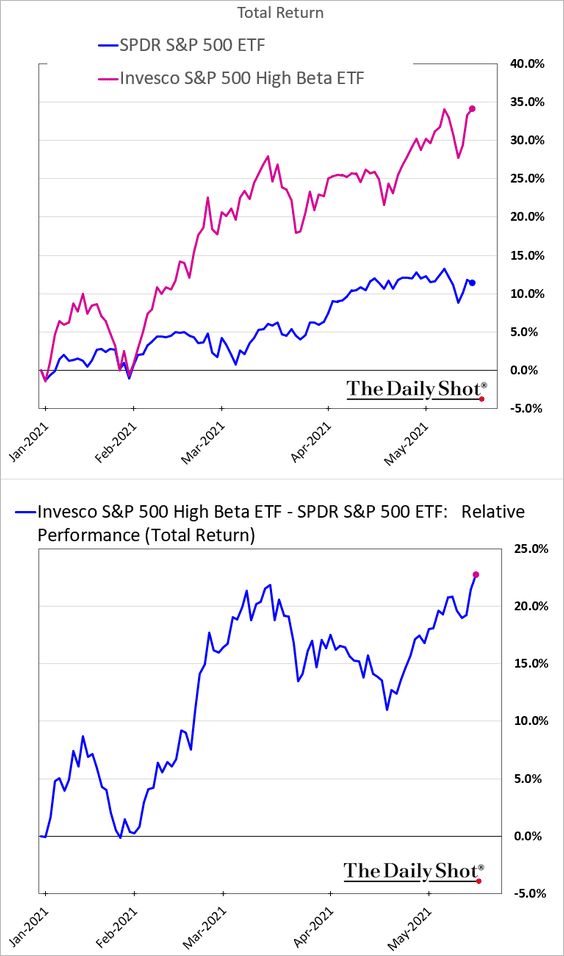
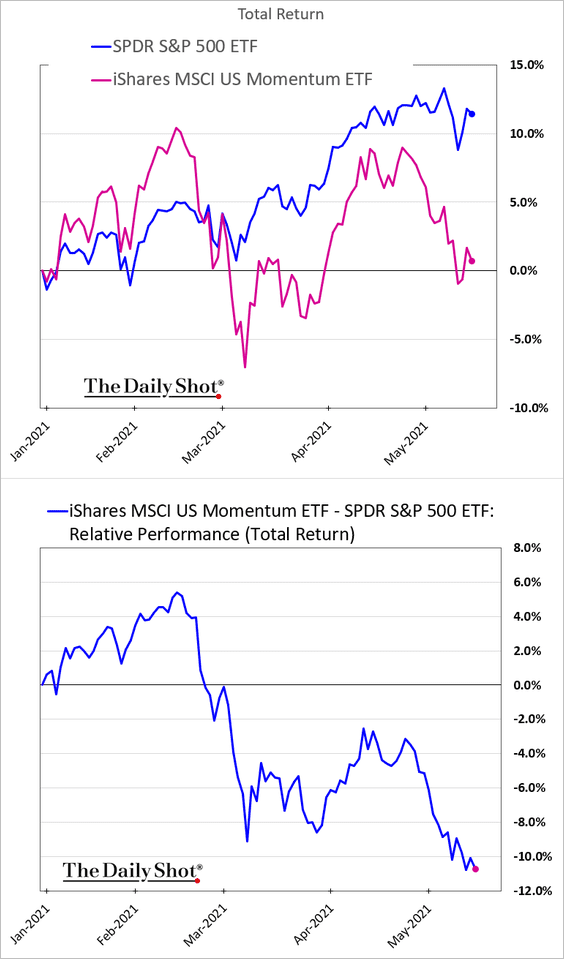
10. Next, we have some updates on equity factor performance.
• Growth stocks’ underperformance …
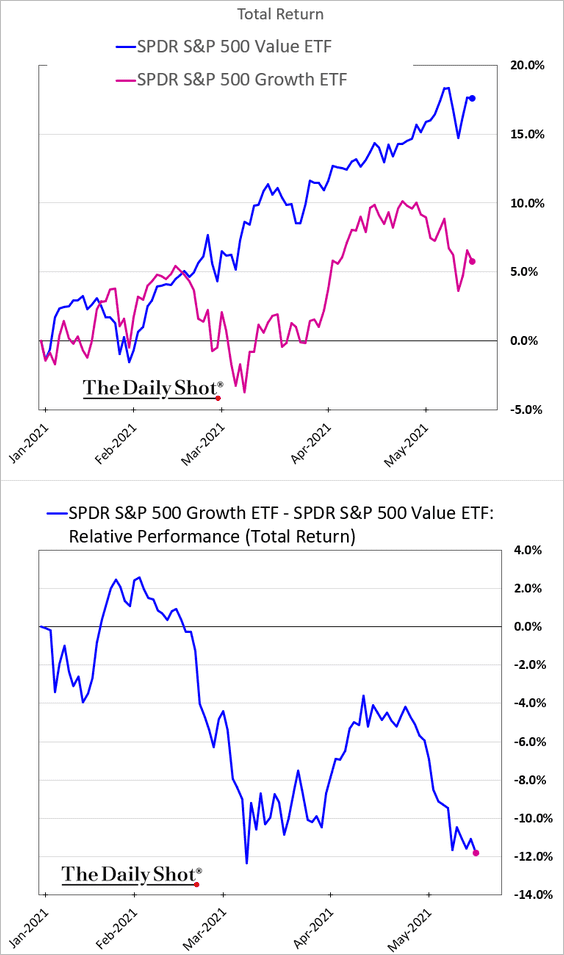
… hasn’t been limited to large companies. Here is the relative performance for mid – and small-cap stocks.
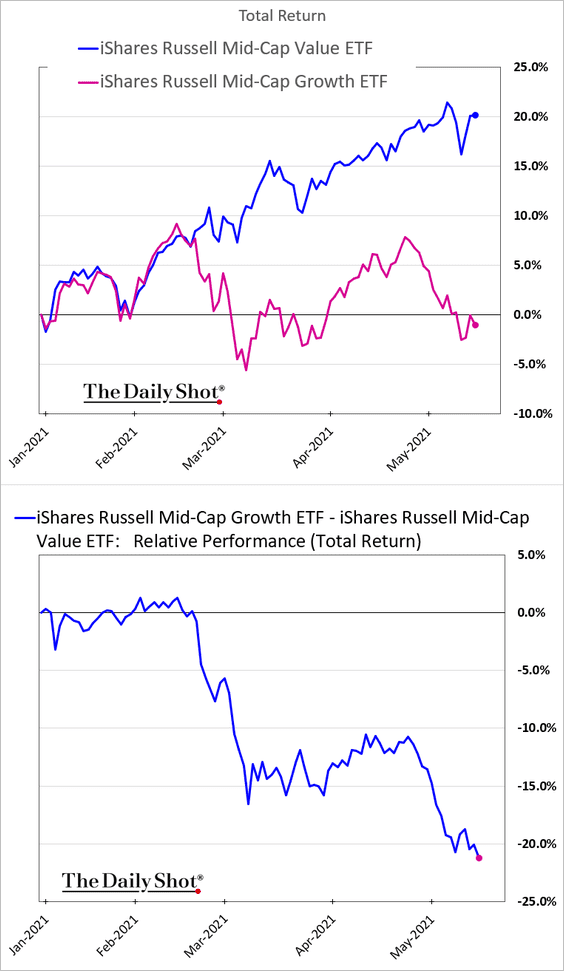
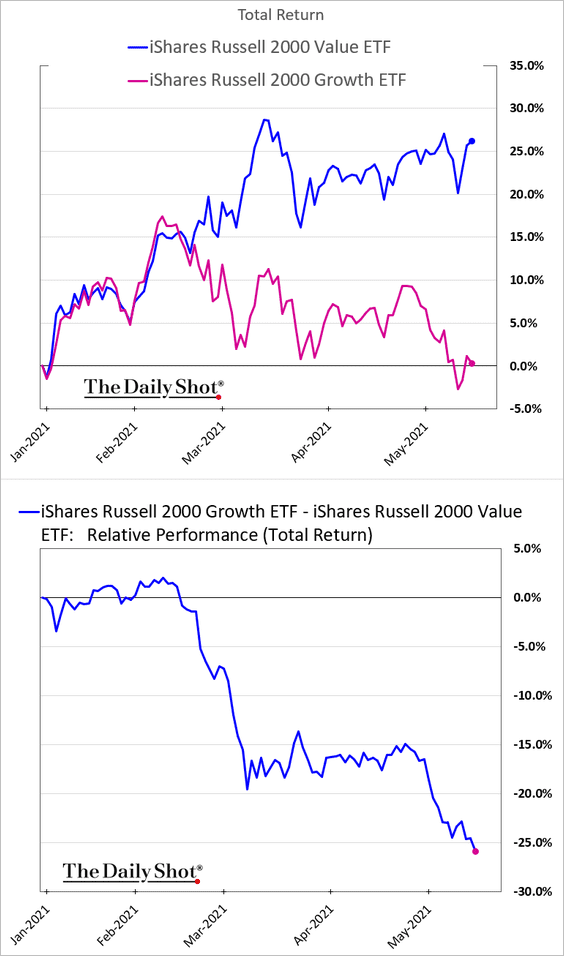
• High-dividend stocks continue to outperform.
• Here are two other factor trends.
– High-beta:
– Momentum:
——————–
11. The Reddit crowd tends to “rotate” between crypto and meme stocks. With bitcoin under pressure lately, meme stocks rebounded.
 Source: @markets Read full article
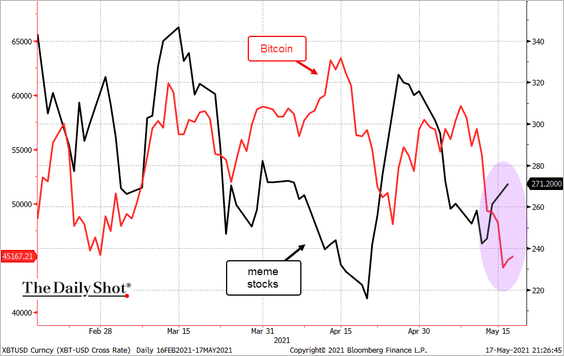 Source: @TheTerminal, Bloomberg Finance L.P.
Back to Index
Rates
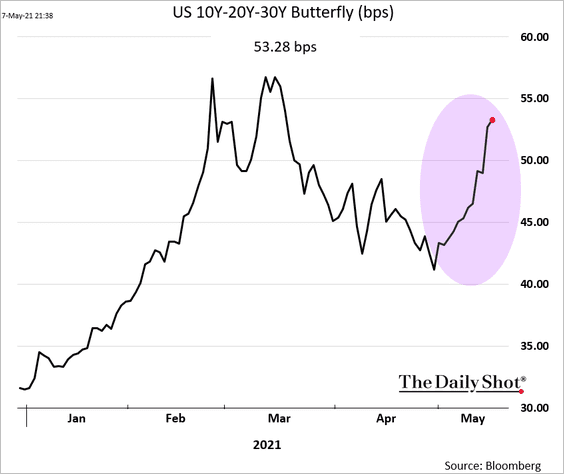
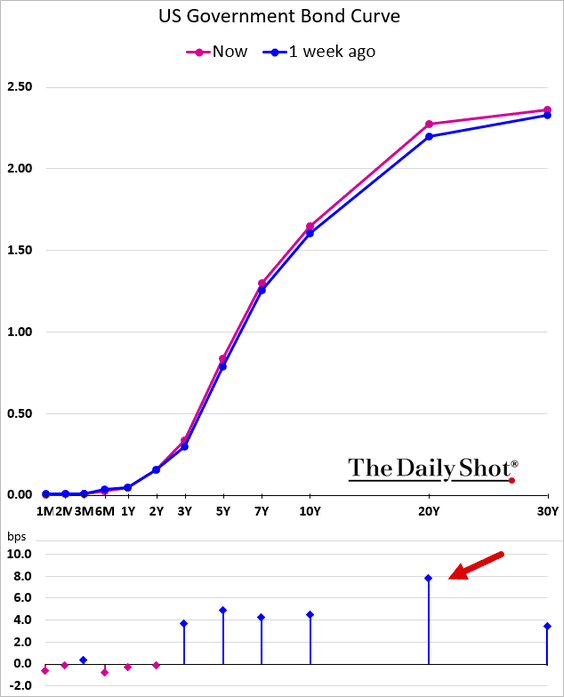
1. The 20yr Treasury is not getting much love (2 charts).
——————–
2. Here is the issuance of Treasuries vs. demand.
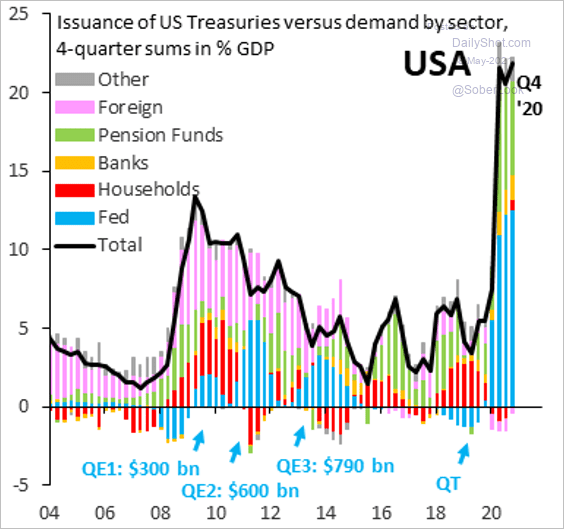 Source: @RobinBrooksIIF
3. The Fed’s mortgage-bond purchases are approaching $2 trillion.
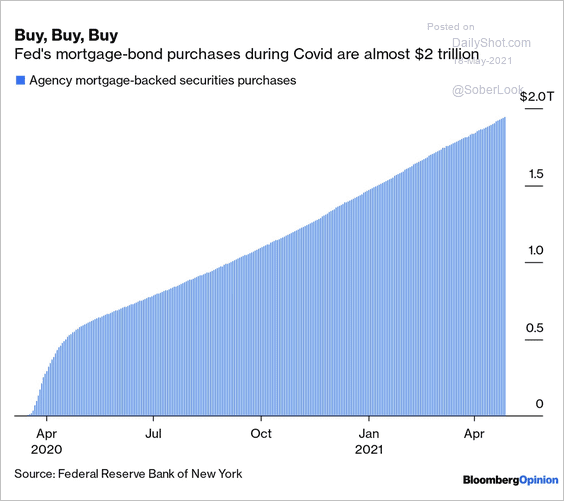 Source: Bloomberg Read full article
4. Macro indicators suggest that the Fed is significantly behind the curve.
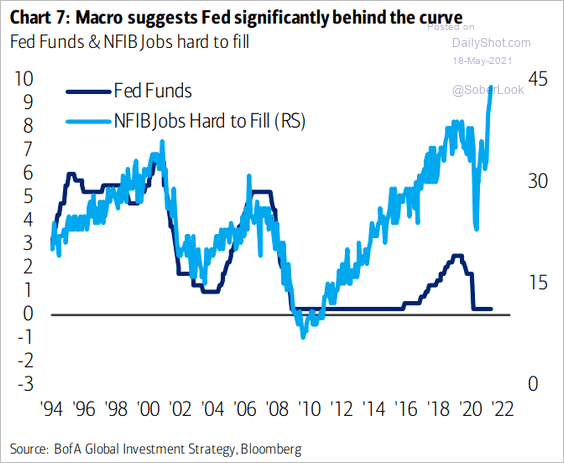 Source: BofA Global Research; @ISABELNET_SA
Back to Index
Global Developments
1. This chart shows the weekly changes in advanced economies’ bond yields.
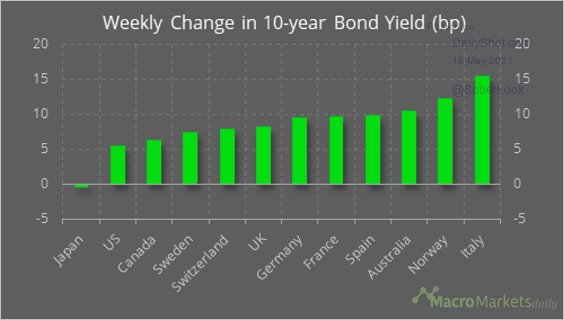 Source: @macro_daily
2. Seychelles’ COVID data call into question the efficacy of China’s Sinopharm vaccine.
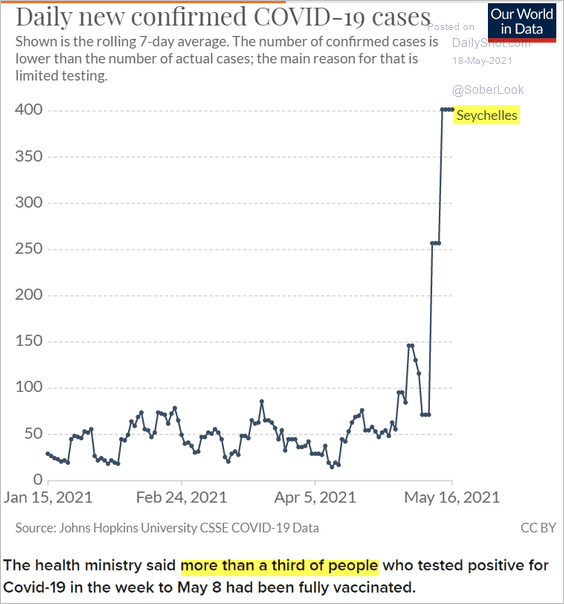 Source: CNBC Read full article
3. The dollar index (DXY) is back near 90.
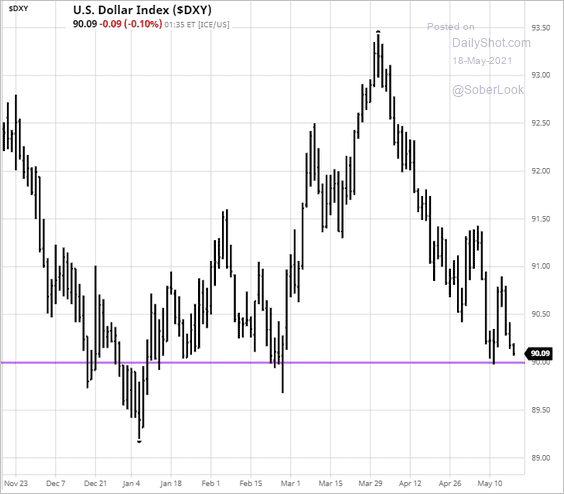 Source: barchart.com
4. Next, we have a couple of updates on trade.
• Trade as a share of GDP (2 charts);
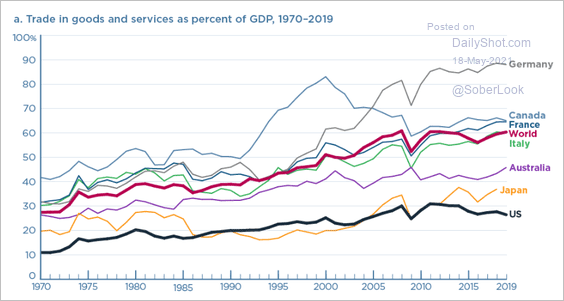 Source: PIIE Read full article
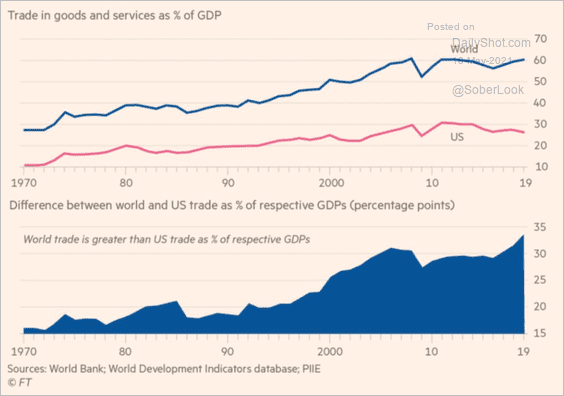 Source: @adam_tooze, @AdamPosen Read full article
• Trade agreements:
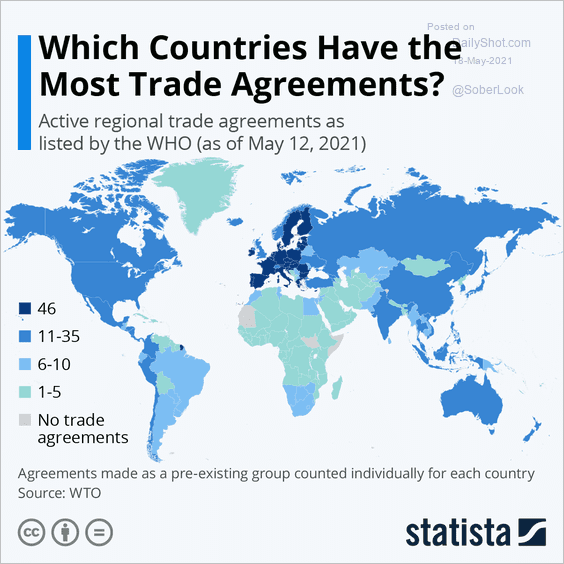 Source: Statista
——————–
Food for Thought
1. US federal taxes as a percentage of spending:
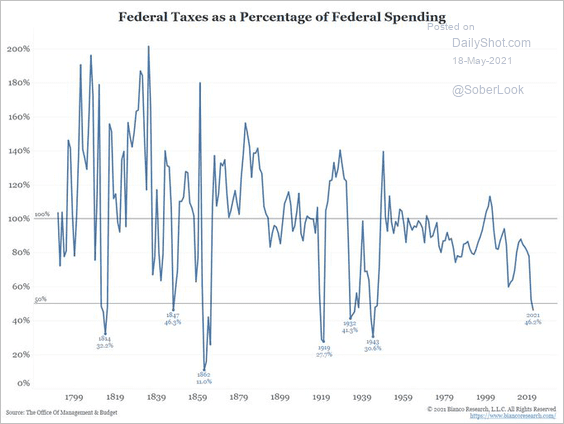 Source: @biancoresearch
2. Tax-to-GDP ratios:
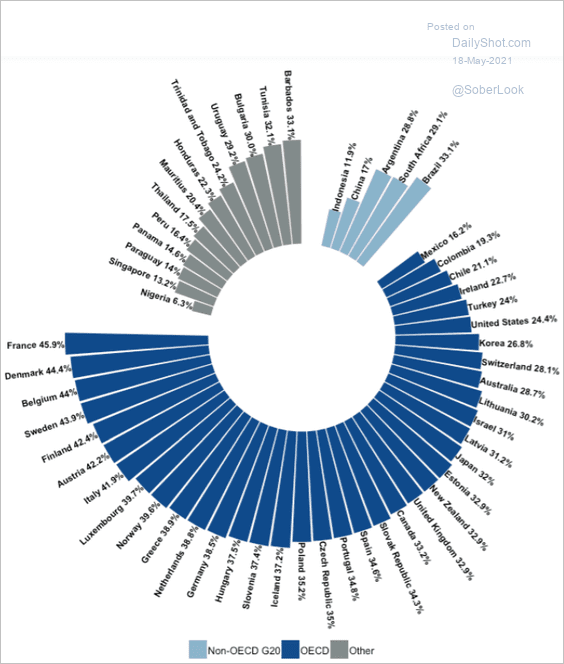 Source: OECD Read full article
3. US tax rates by income group:
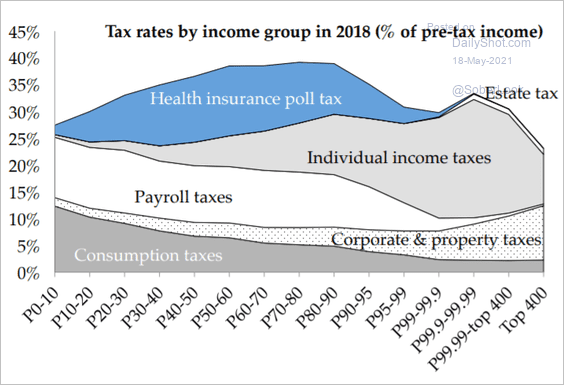 Source: Emmanuel Saez, Gabriel Zucman Read full article
4. Social media platforms (3 charts):
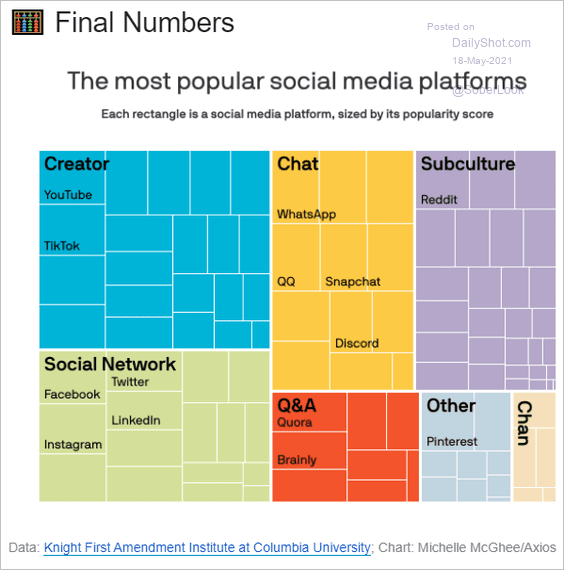 Source: @axios Read full article
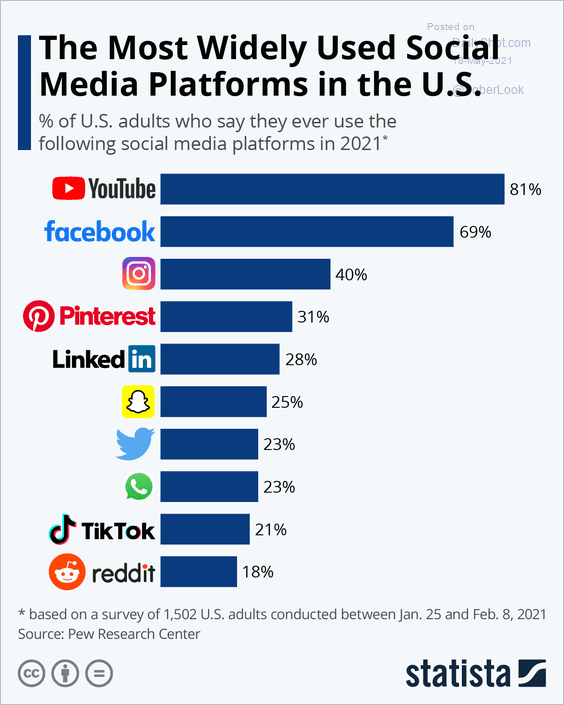 Source: Statista
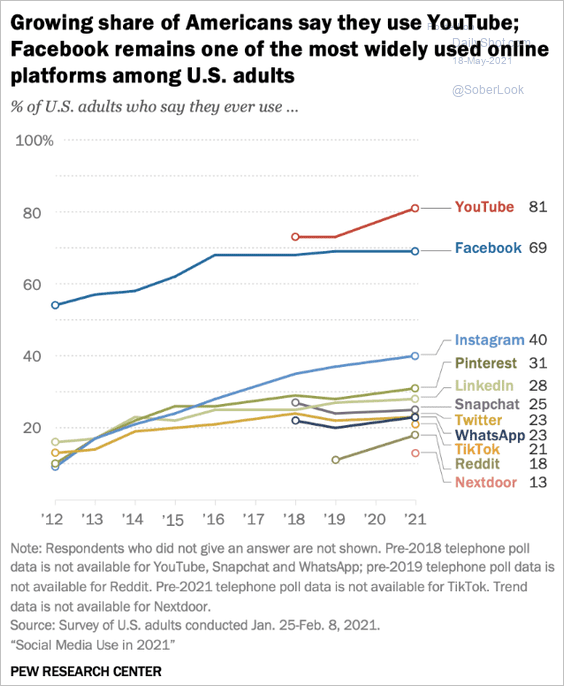 Source: Pew Research Center Read full article
——————–
5. Ransomware infection workflow diagram:
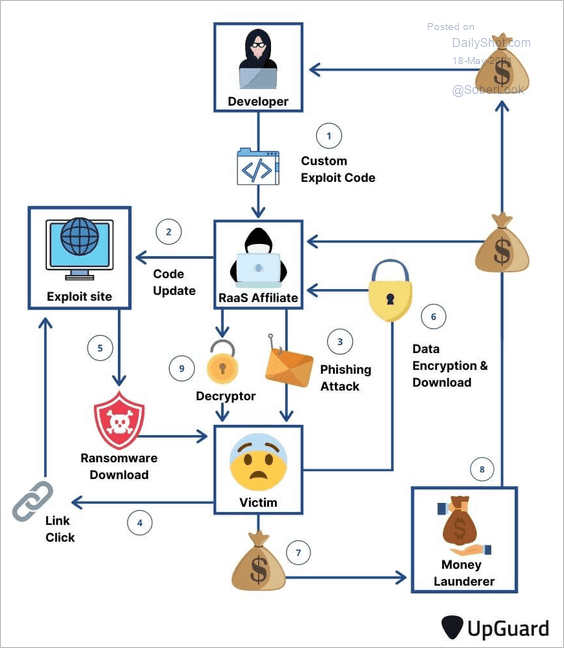 Source: UpGuard Read full article
6. Execution methods in the US:
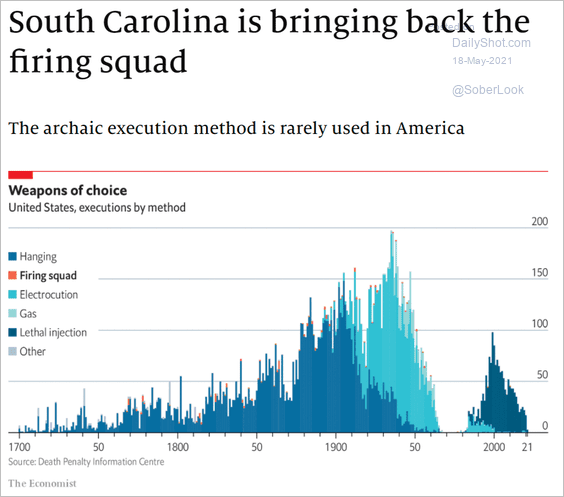 Source: The Economist Read full article
7. US 2024 GOP presidential nomination odds in the betting markets:
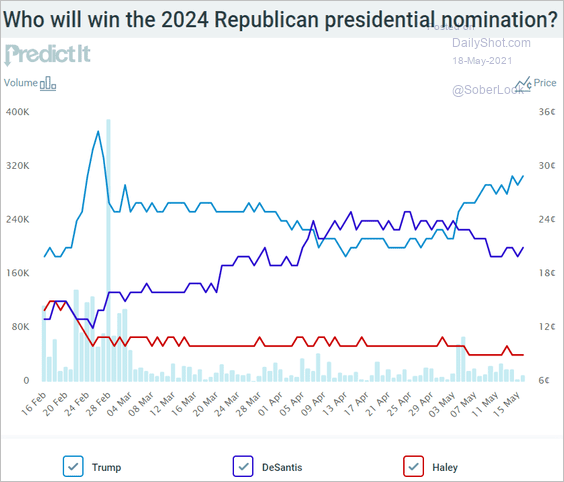 Source: @PredictIt
8. Monthly surface temperature anomalies:
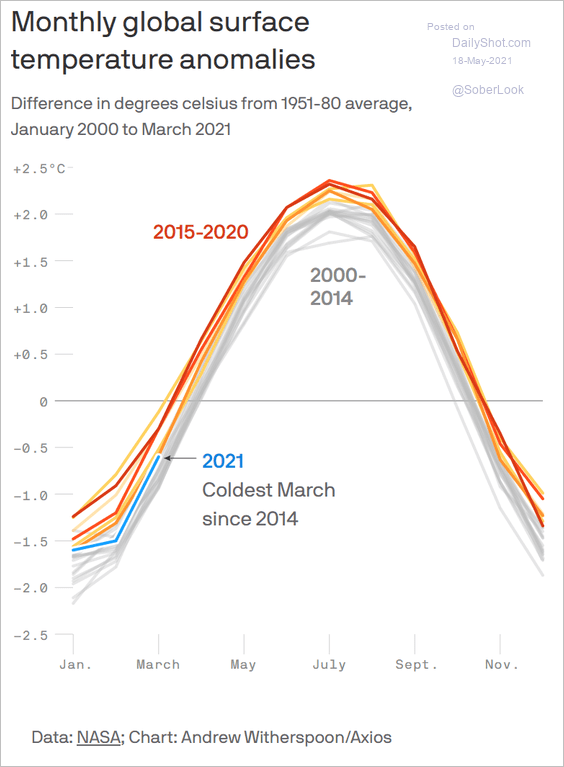 Source: @axios Read full article
9. Healthcare provider preferences:
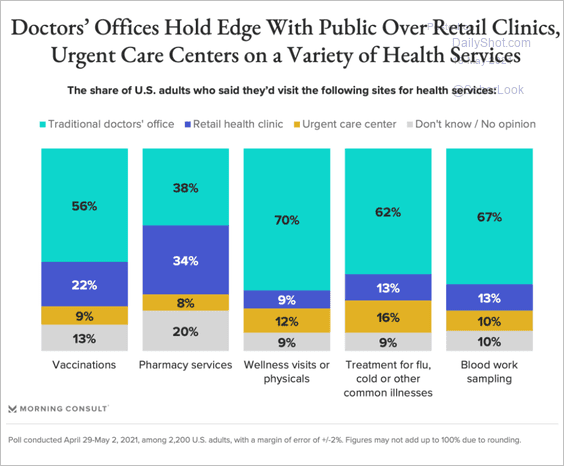 Source: Morning Consult Read full article
10. What constitutes growing up?
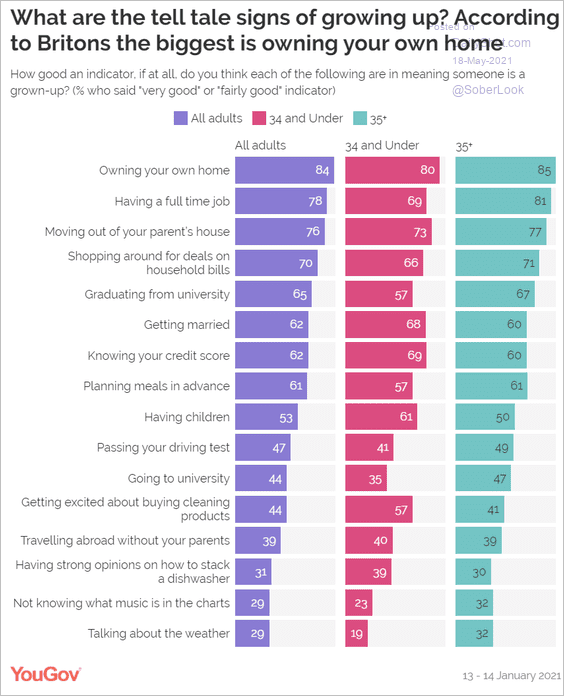 Source: YouGov Read full article
——————–
Back to Index