
The Daily Shot: 19-May-21
• The United States
• The United Kingdom
• The Eurozone
• Asia – Pacific
• China
• Emerging Markets
• Cryptocurrency
• Commodities
• Energy
• Equities
• Alternatives
• Rates
• Global Developments
• Food for Thought
The United States
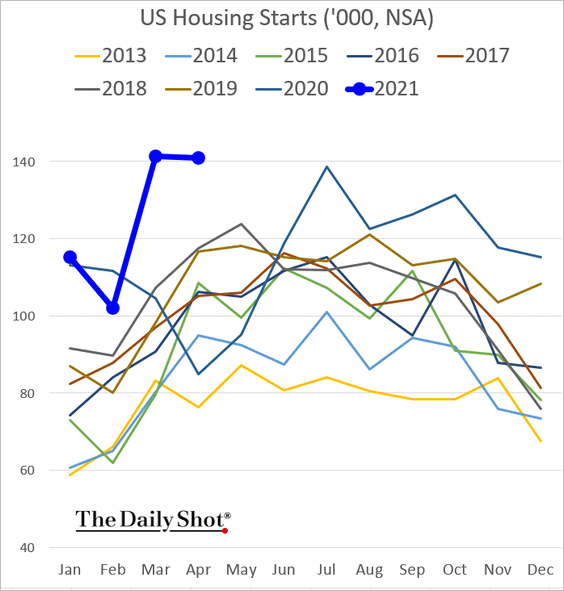
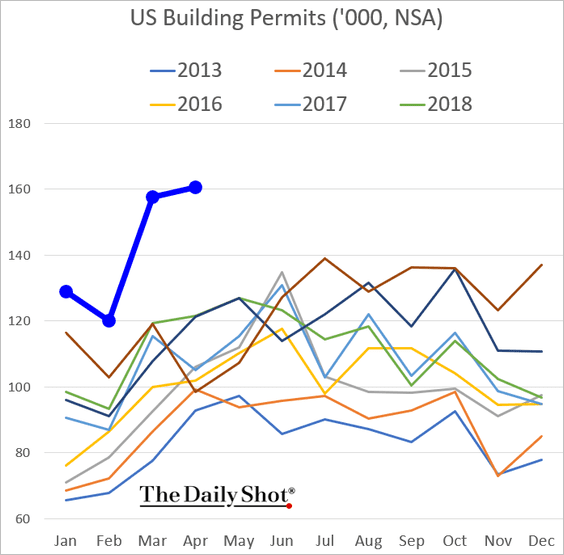
1. Residential construction paused in April amid headwinds from supply/labor bottlenecks and soaring lumber costs.
• Housing starts:
• Permits:
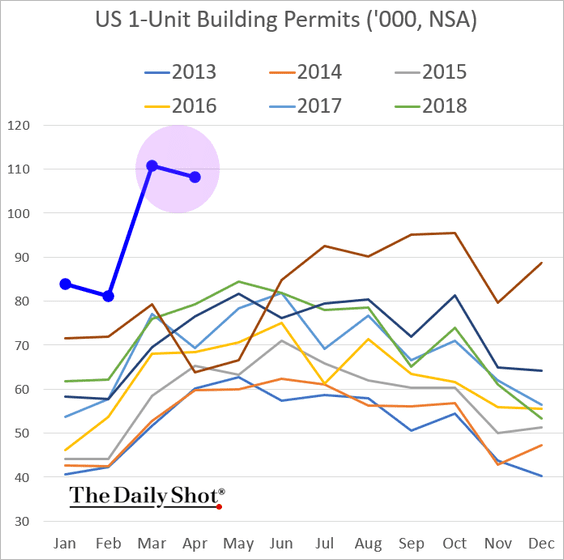
• Single-family construction slowed.
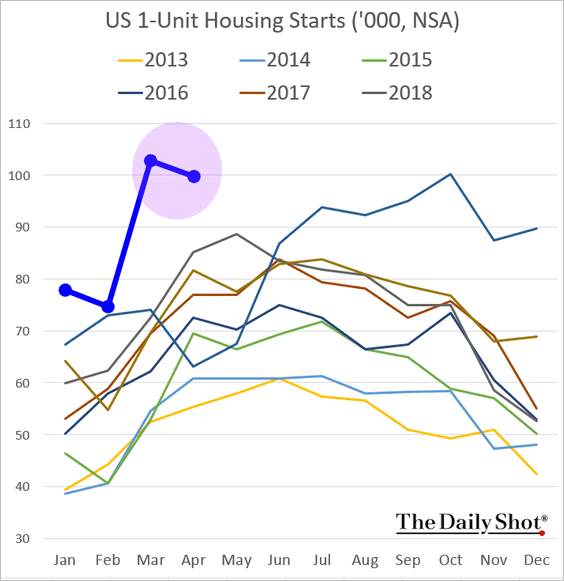
• Single-family starts are returning to their pre-COVID trend.
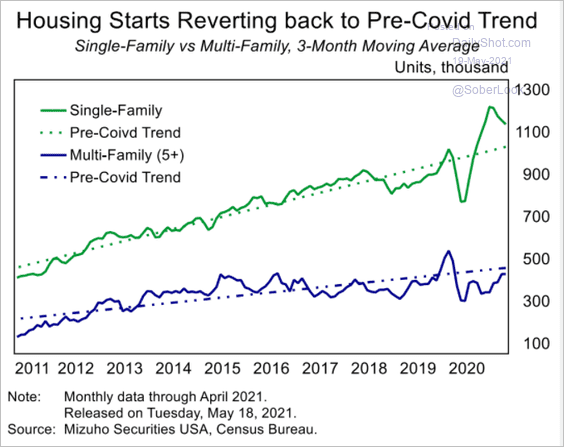 Source: Mizuho Securities USA
• Construction costs have surged.
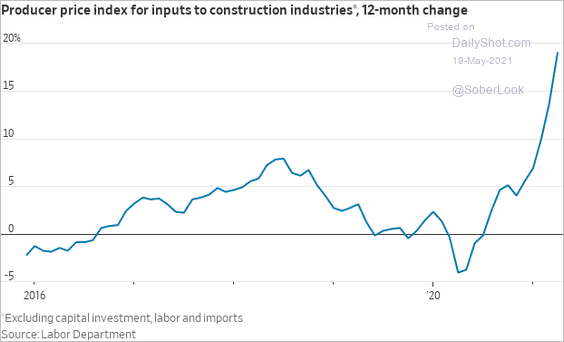 Source: @jeffsparshott
• The backlog of units authorized but not yet started keeps climbing.
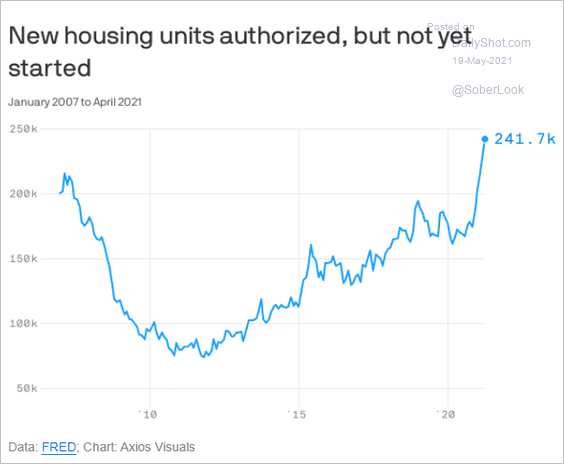 Source: @axios Read full article
——————–
2. The Citi Economic Surprise Index declined further after the disappointing housing starts report.
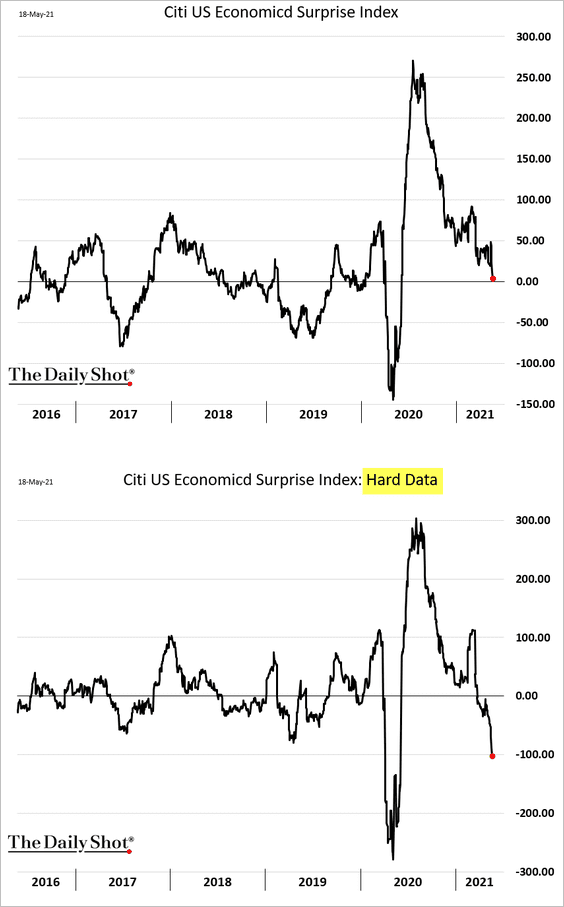 Source: Citi
3. Next, we have some updates on the labor market and wage trends.
• The first-quarter increase in the Employment Cost Index was too high relative to the prime-age employment-to-population ratio.
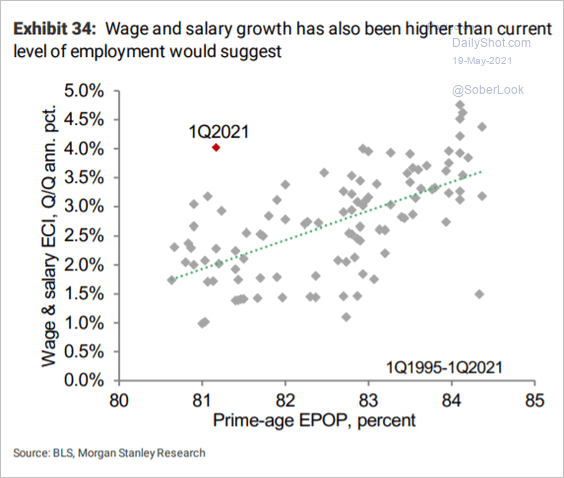 Source: Morgan Stanley Research
• For now, the Atlanta Fed’s wage tracker isn’t showing any acceleration in wage growth.
![]()
• There is still a long way to go to recoup jobs lost during the pandemic.
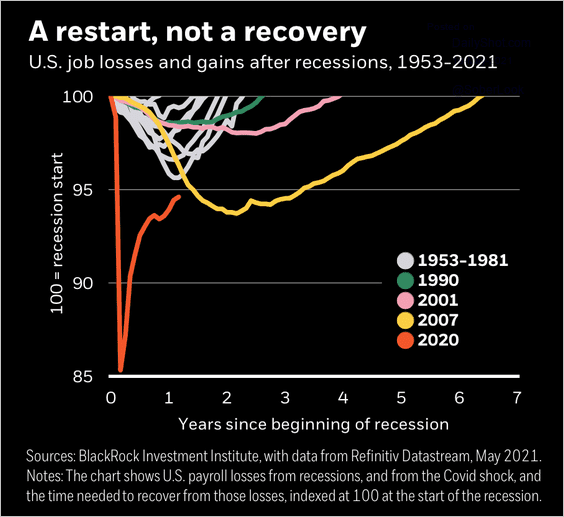 Source: BlackRock
• Here are the service sectors with the highest job losses.
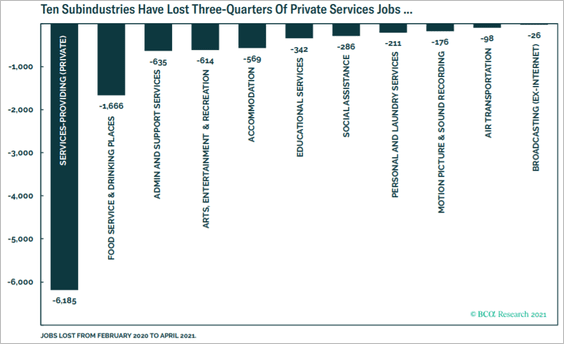 Source: BCA Research
This chart shows where service-sector employment stands relative to pre-COVID levels.
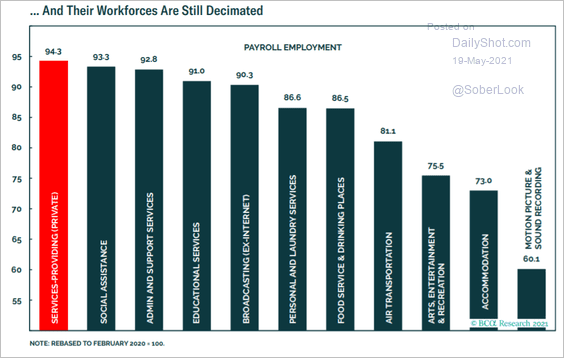 Source: BCA Research
• Labor force participation for older age groups has failed to recover even as the economy reopens.
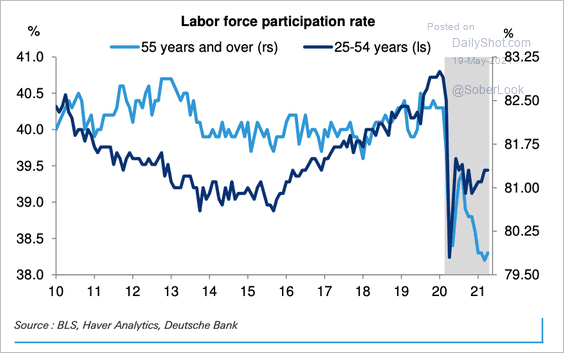 Source: Deutsche Bank Research
By the way, older age groups account for a majority of the rise in liquid assets over the past year.
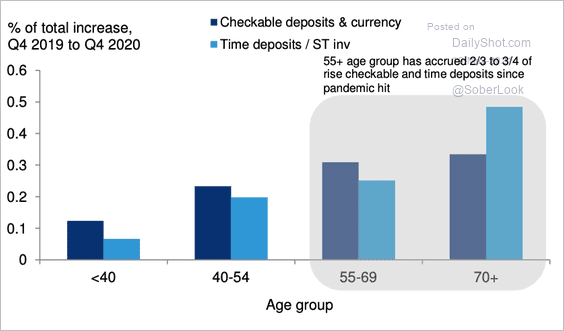 Source: Deutsche Bank Research
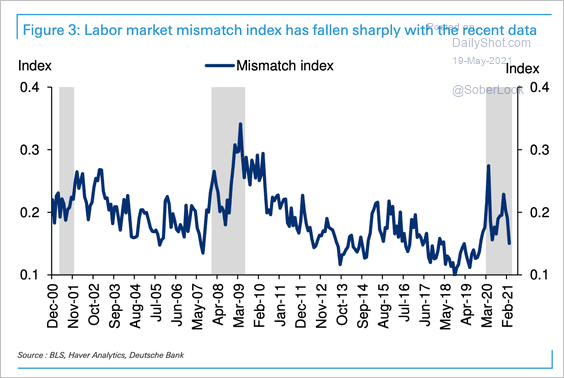
• The gap between unemployment and job openings has closed substantially across sectors over the past few months, according to Deutsche Bank (2 charts).
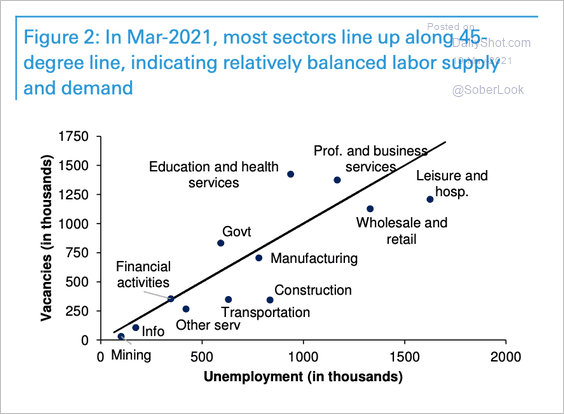 Source: Deutsche Bank Research
 Source: Deutsche Bank Research
• Job gains in April were driven by low-wage sectors.
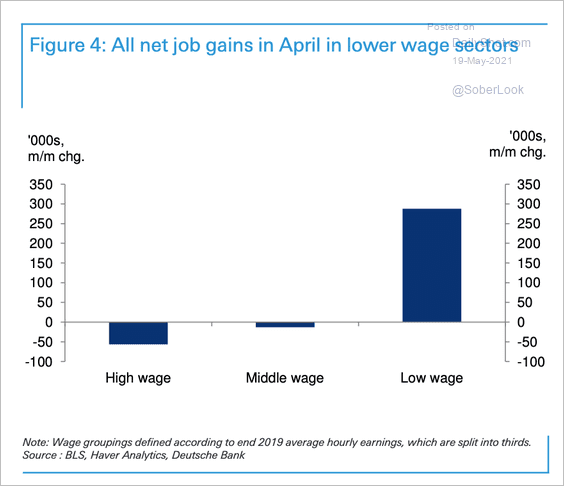 Source: Deutsche Bank Research
• Long-term unemployment continues to climb.
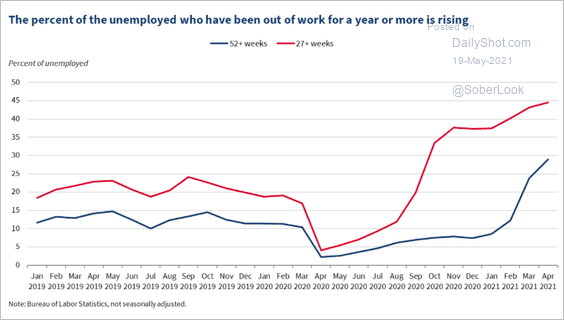 Source: Council of Economic Advisers Read full article
——————–
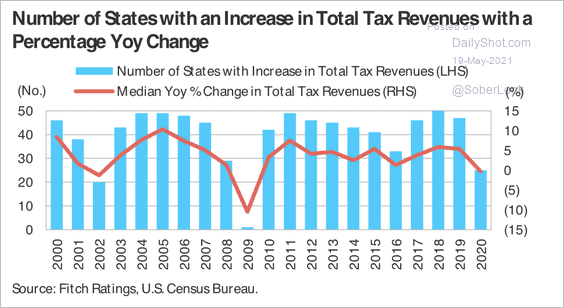
4. State tax revenue took a milder hit last year relative to the financial crisis (2 charts).
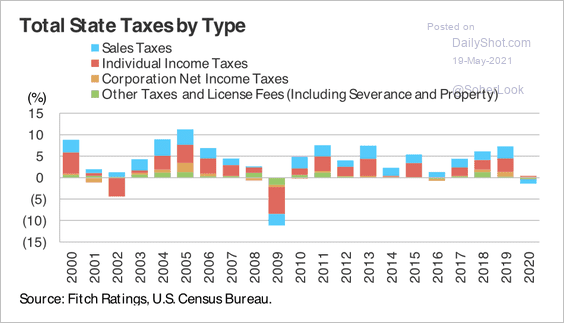 Source: Fitch Ratings
 Source: Fitch Ratings
Back to Index
The United Kingdom
1. UK employment has bottomed.
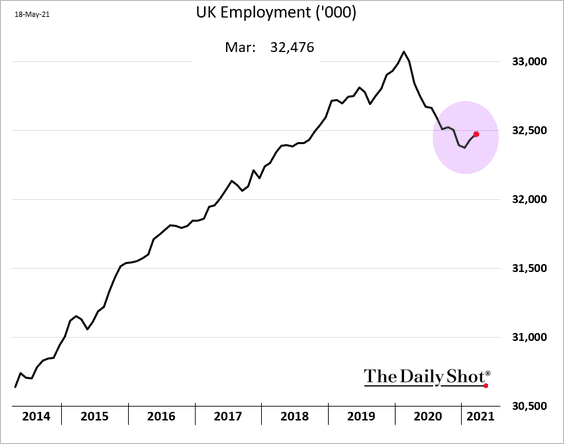
 Source: Pantheon Macroeconomics
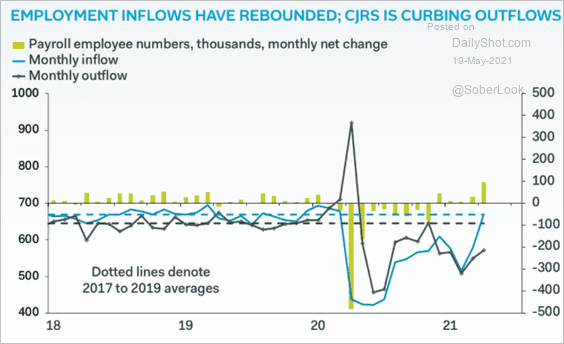
But the recovery remains uneven.
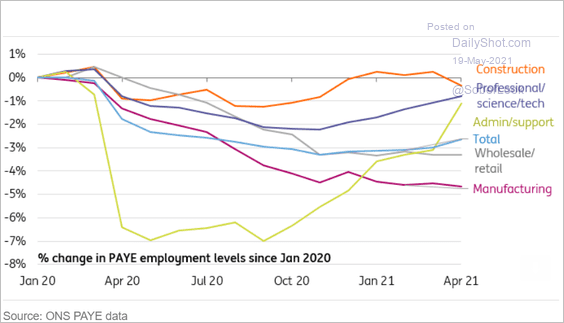 Source: ING
• Catering and hospitality job ads have fully recovered.
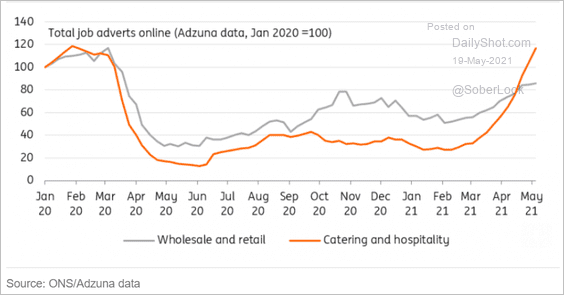 Source: ING
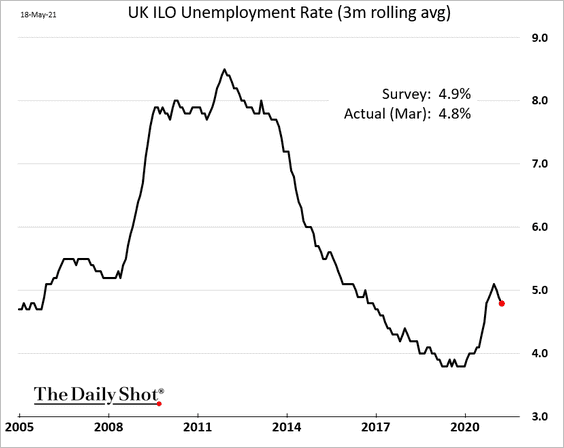
• Here is the unemployment rate.
——————–
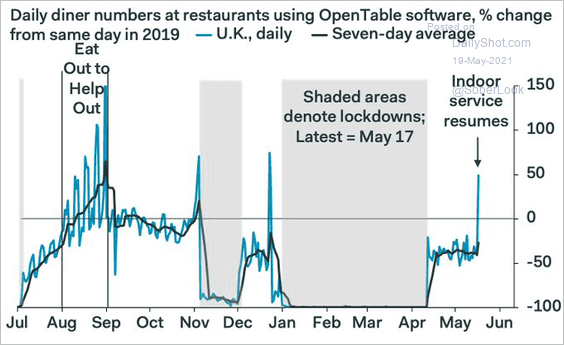
2. Restaurant diner numbers improved sharply.
 Source: @samueltombs
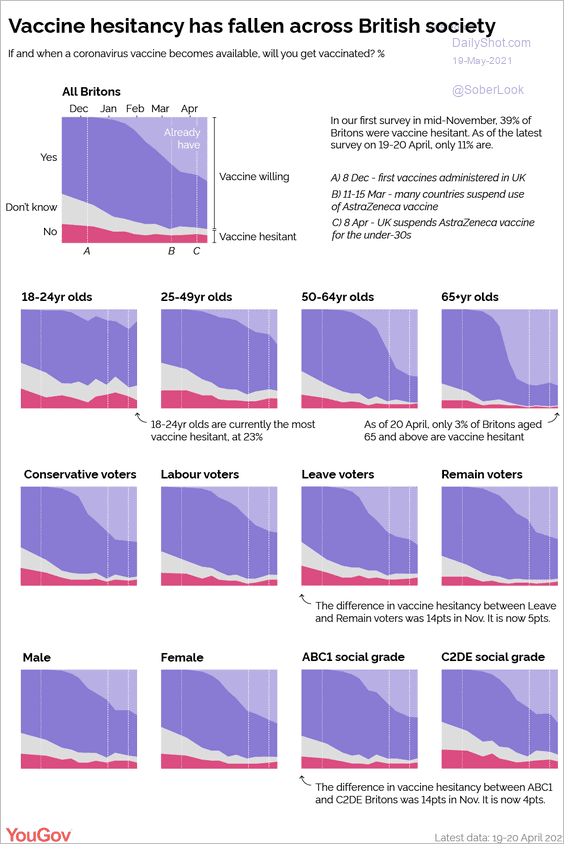
3. Vaccine hesitancy has been declining.
 Source: YouGov Read full article
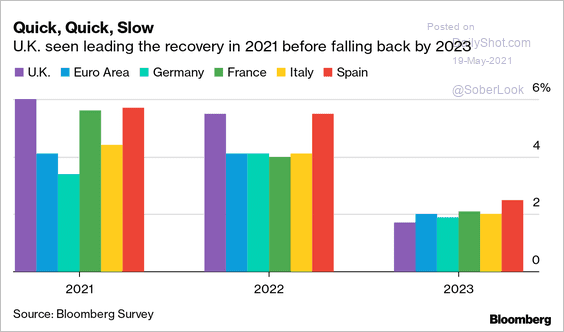
4. Here is a forecast for UK growth vs. the Eurozone.
 Source: @markets Read full article
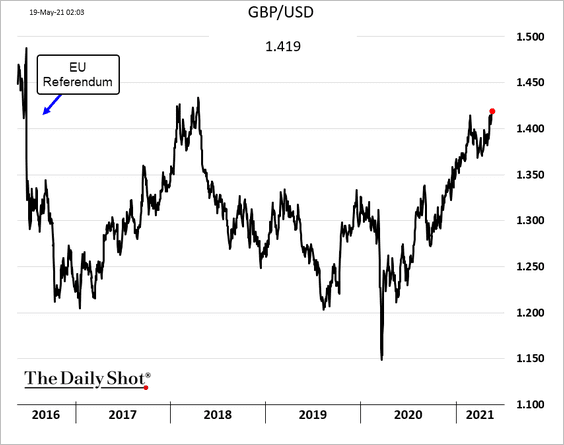
5. The pound continues to climb vs. USD.
Back to Index
The Eurozone
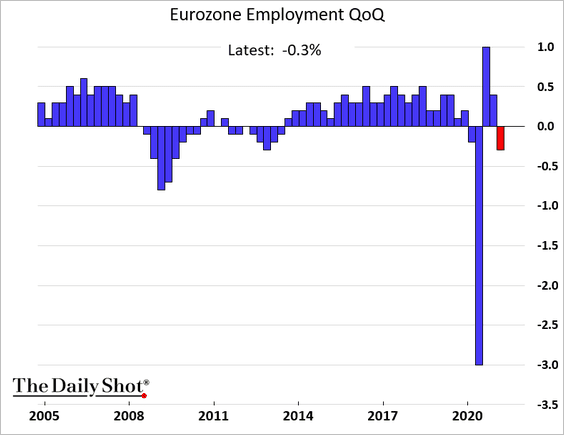
1. Employment declined in the first quarter.
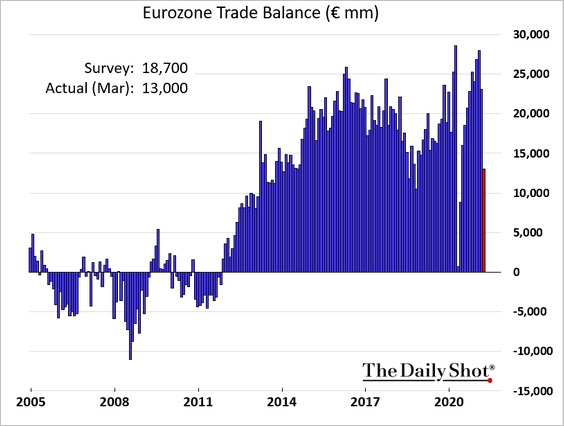
2. The euro-area trade surplus shrunk more than expected in March.
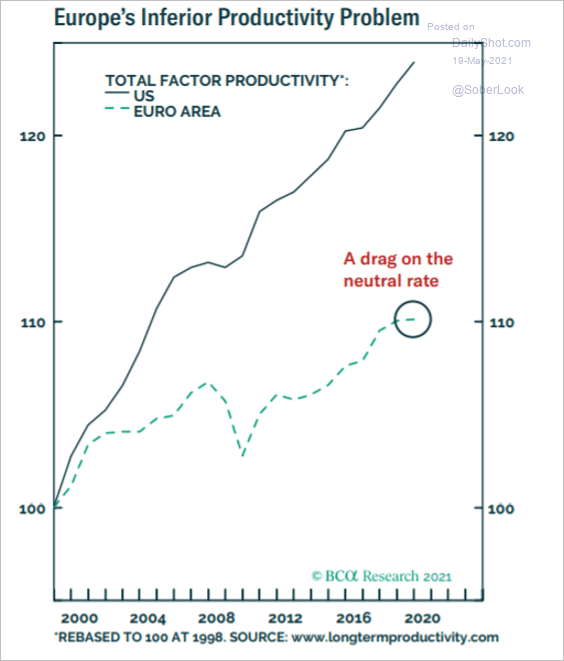
3. Weak productivity gains have been a drag on the neutral rate, limiting the ECB’s room to hike.
 Source: BCA Research
4. Corporate tax rates have been trending lower.
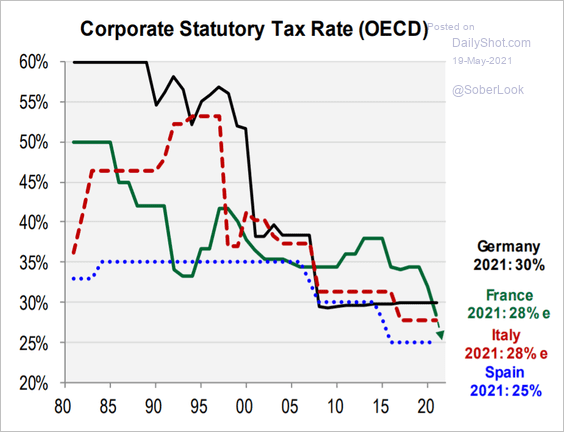 Source: Cornerstone Macro
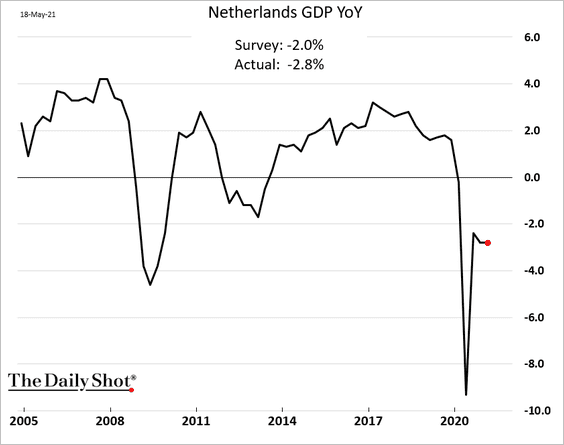
5. The Dutch GDP recovery has slowed.
6. This chart shows Germany’s carbon emissions target.
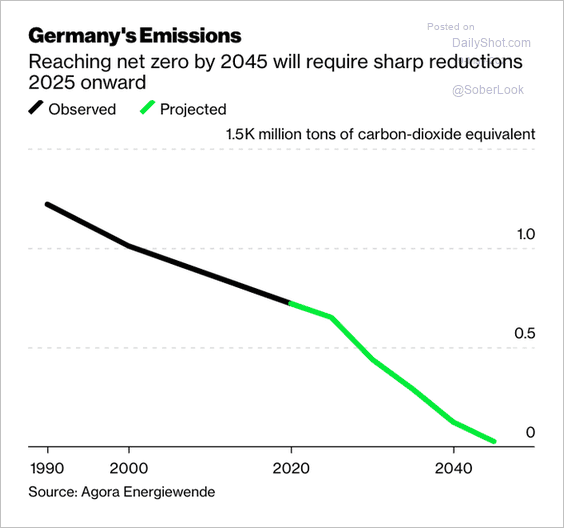 Source: @adam_tooze, @business Read full article
Back to Index
Asia – Pacific
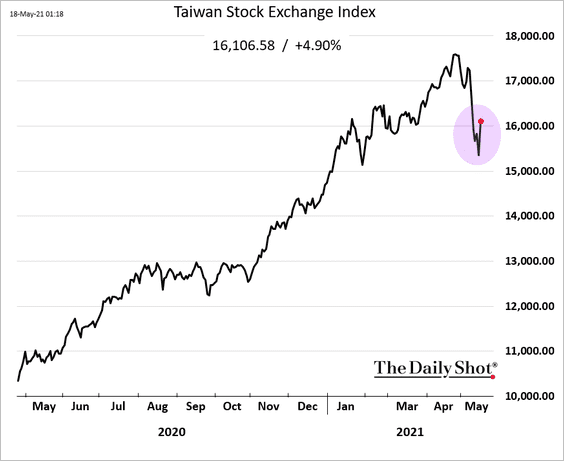
1. Taiwan’s stock market has stabilized.
2. Here is South Korea’s unemployment rate by age.
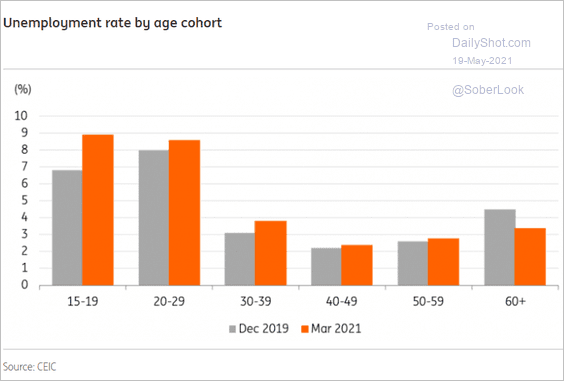 Source: ING
3. This chart shows each country’s tourism trade balance as a share of the GDP.
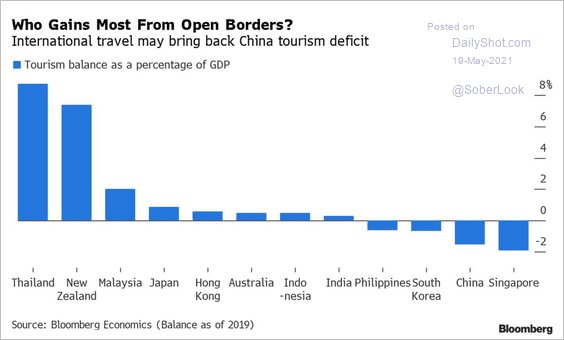 Source: Bloomberg Read full article
Back to Index
China
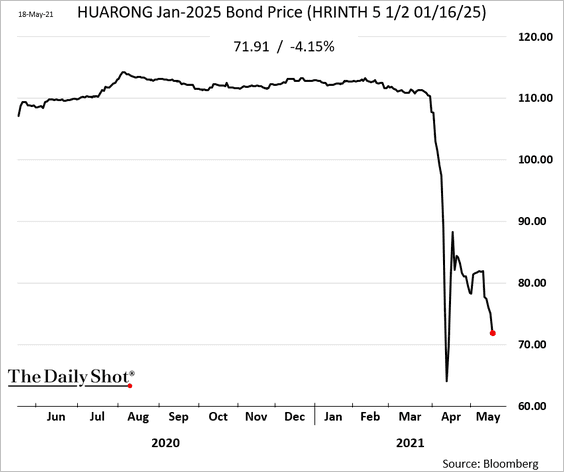
1. Huarong’s bonds remain under pressure amid persistent uncertainty.
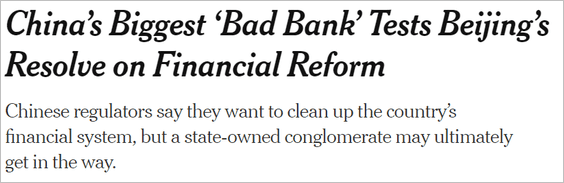 Source: The New York Times Read full article
——————–
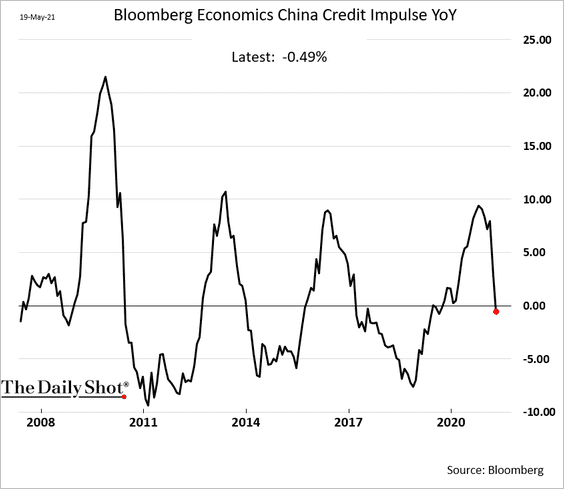
2. China’s credit impulse has weakened, which will be a drag on global commodity markets.
3. Loans to real estate developers have fallen.
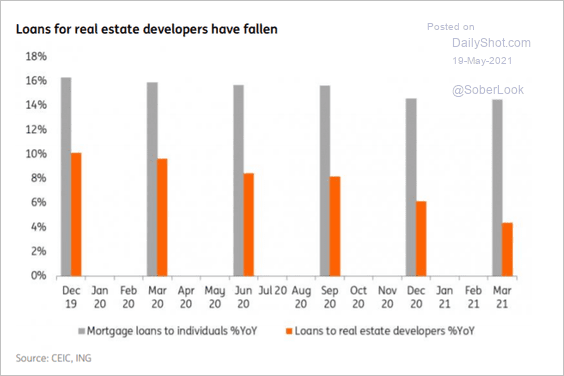 Source: ING
4. Chinese blockchain companies have underperformed over the past year.
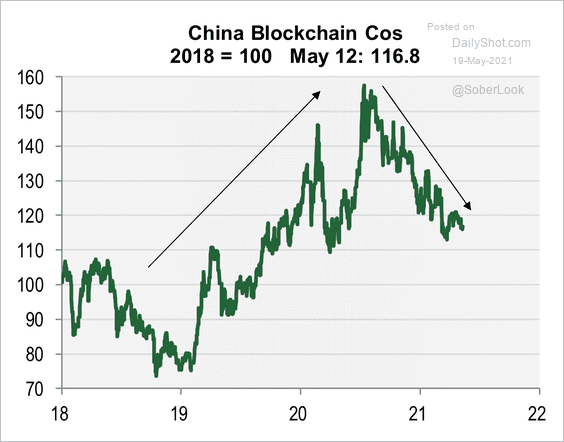 Source: Cornerstone Macro
5. China dominates cleantech industries.
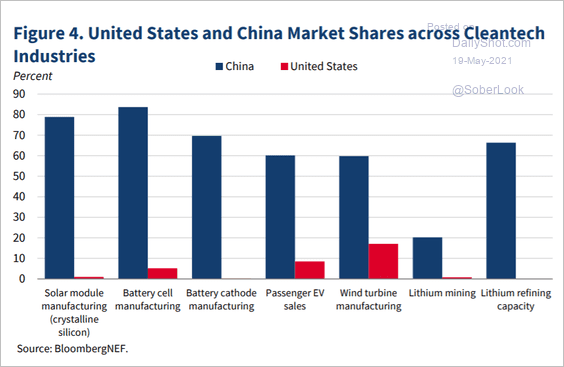 Source: Council of Economic Advisers Read full article
6. Here is a look at the US-China tariffs.
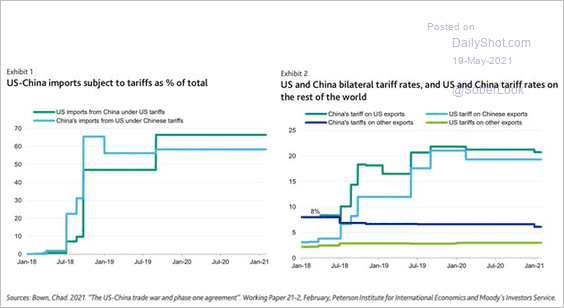 Source: @LizAnnSonders, @PIIE, @MoodysInvSvc
Back to Index
Emerging Markets
1. India’s COVID cases are moderating amid fresh lockdowns.
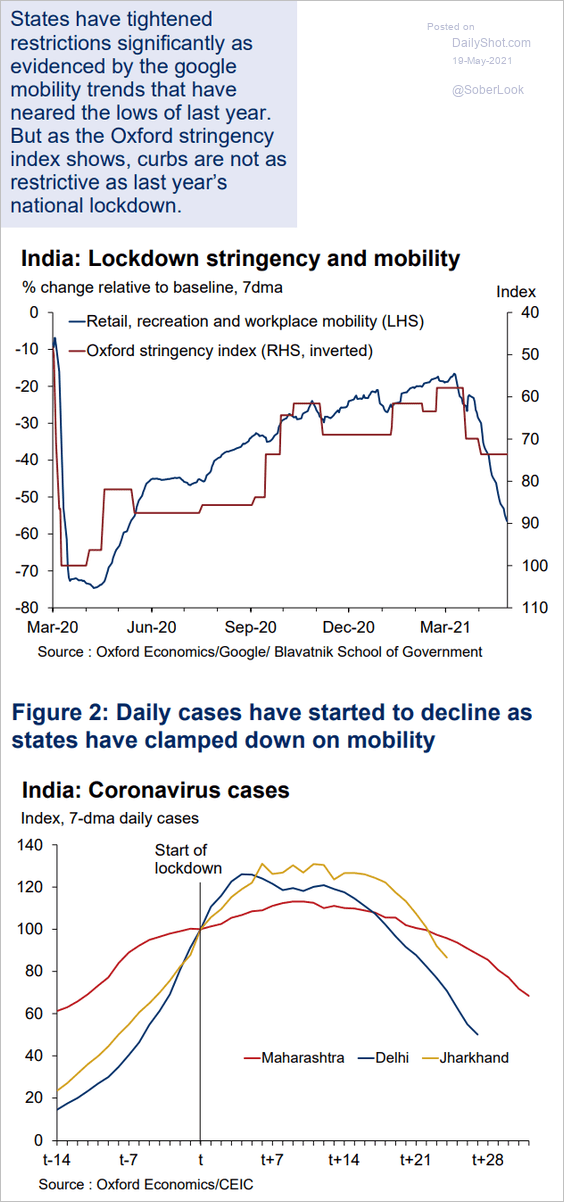 Source: Priyanka Kishore, Oxford Economics
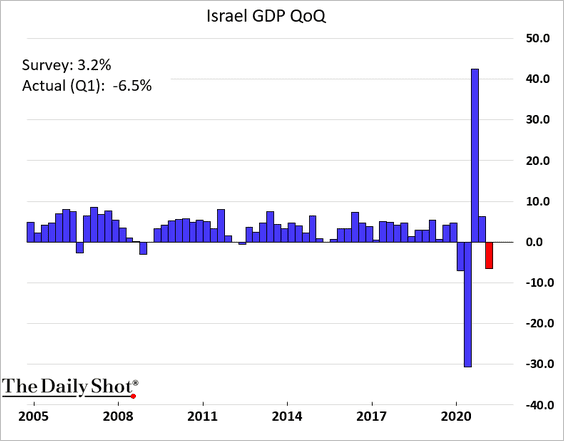
2. Israel’s GDP unexpectedly tumbled in the first quarter.
3. South Africa’s shares have been outperforming due to the massive rally in commodities.
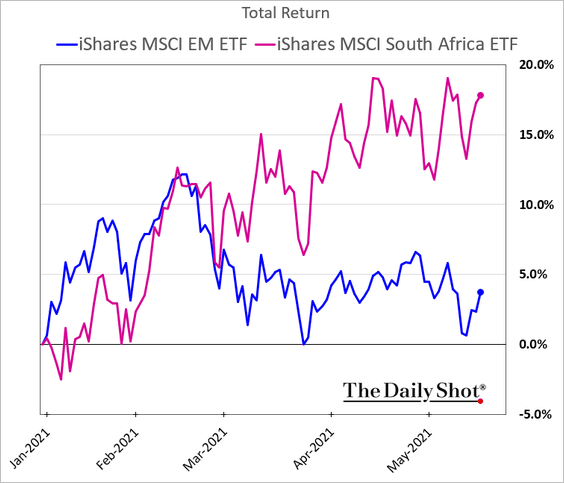 h/t @adengat
4. This chart shows the EU-Russia trade.
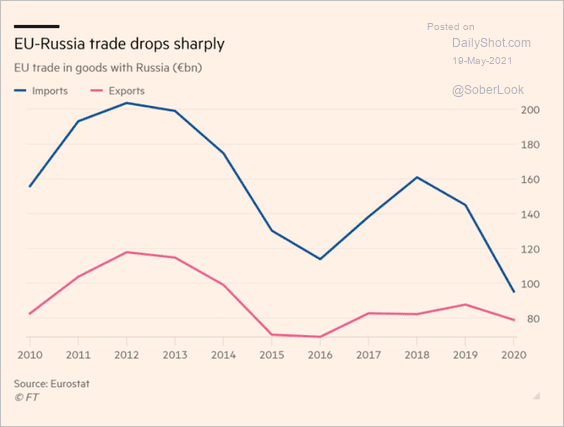 Source: @adam_tooze, @financialtimes, @IEA Read full article
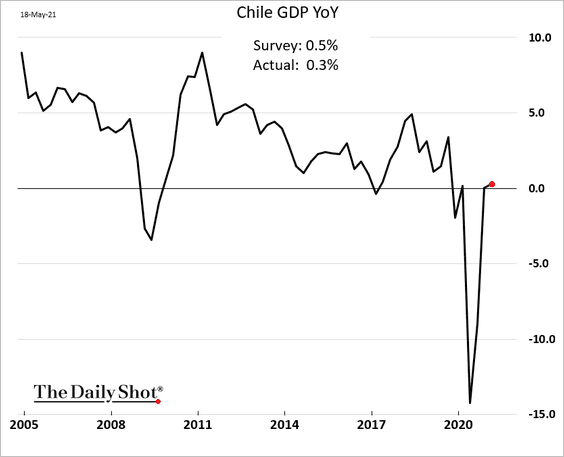
5. Chile is out of recession, but the rebound has lost momentum.
6. EM stock markets are less correlated with the US and among each other.
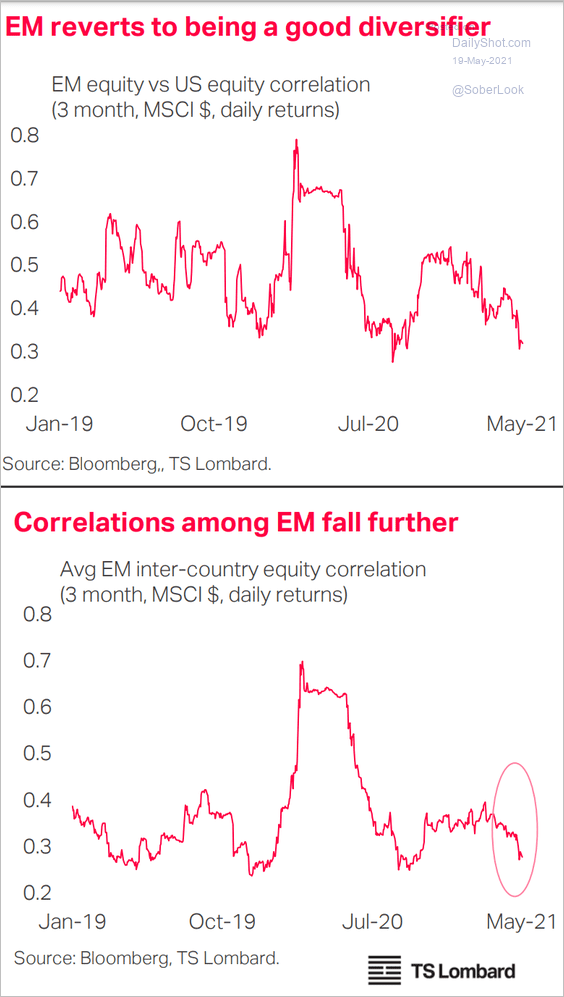 Source: TS Lombard
7. Which countries rely most on remittances?
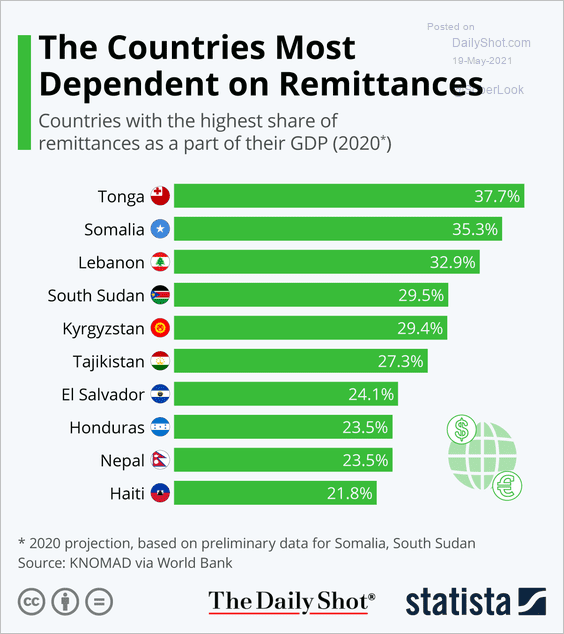 Source: Statista
Back to Index
Cryptocurrency
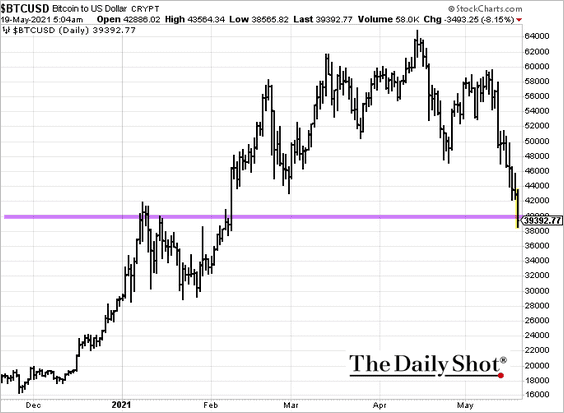
1. Cryptos are under pressure after regulatory action from Beijing.
 Source: Mint Read full article
• Bitcoin dipped below $40k.
• It was a tough day for Ethereum.
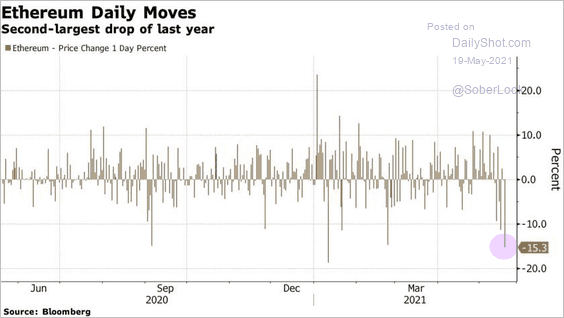 Source: @DiMartinoBooth, @business
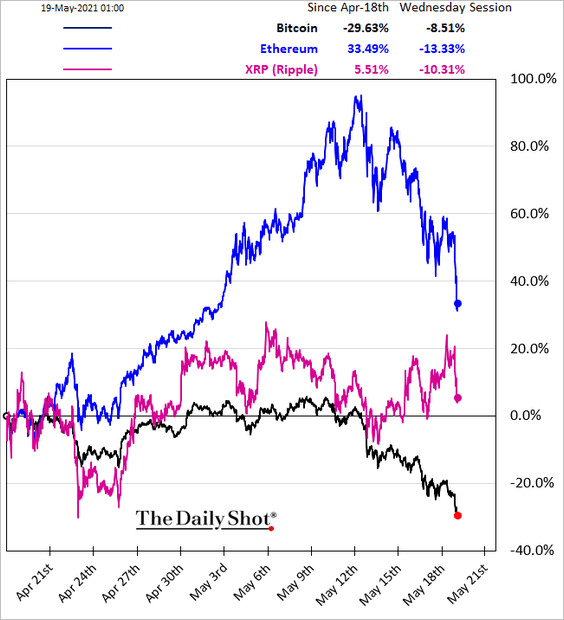
• Here is the relative performance.
——————–
2. The charts below confirm the crypto-gold rotation.
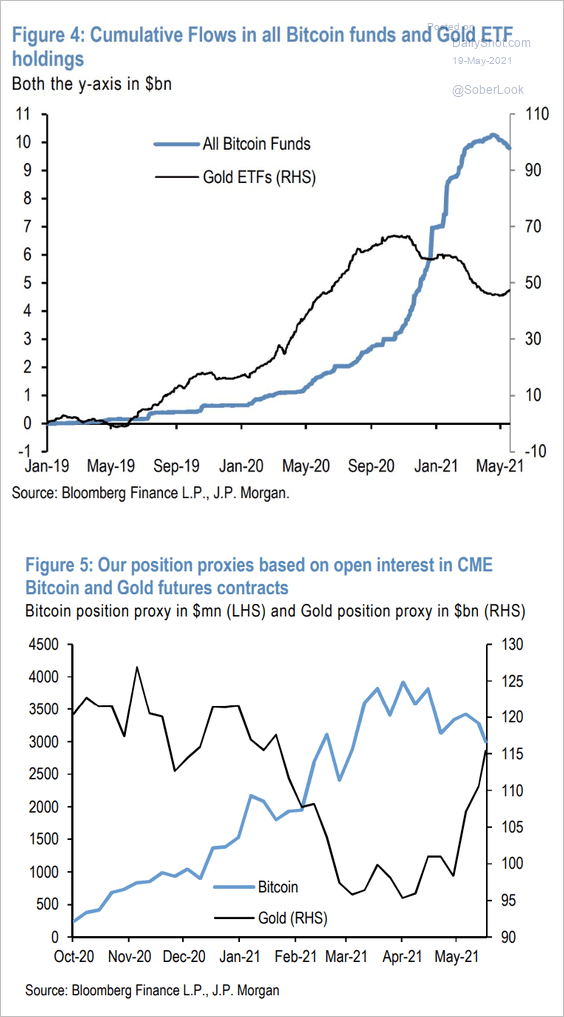 Source: JP Morgan, @SamRo
Back to Index
Commodities
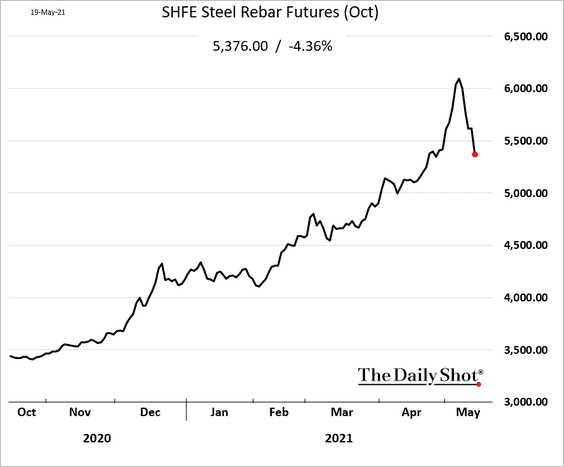
1. China’s steel futures are rolling over.
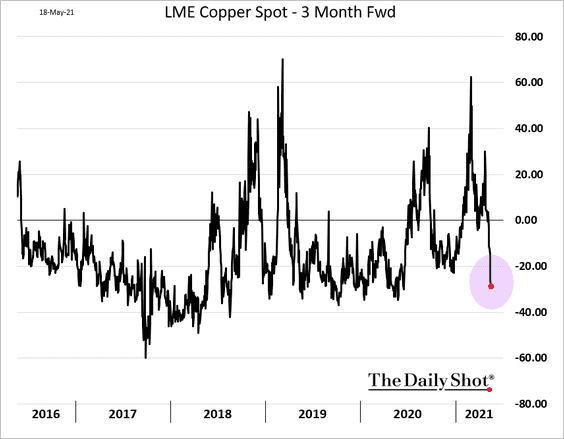
2. Spot copper is now trading at a discount to the three-month forward. It’s an indication of weakening demand pressures (see story).
Copper production has been ramping up.
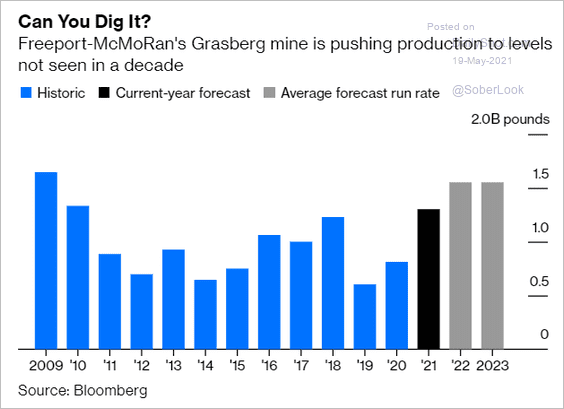 Source: @davidfickling, @bopinion Read full article
——————–
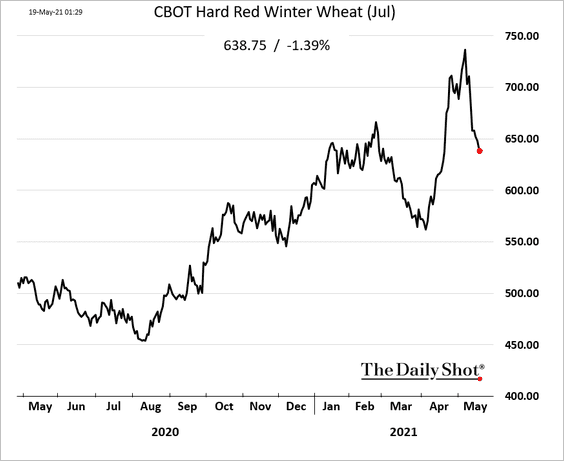
3. US wheat futures are well off the highs.
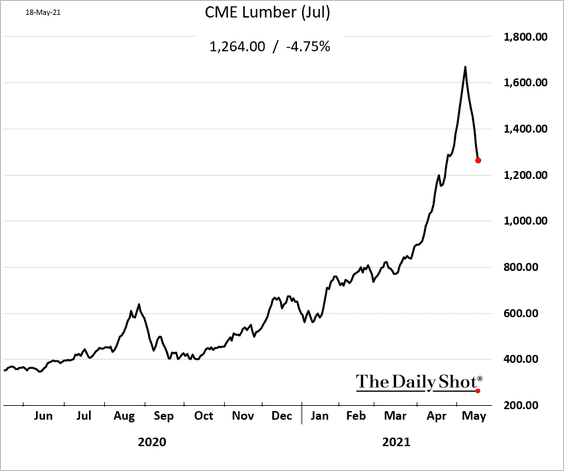
4. And lumber continues to tumble.
5. Commodity positioning remains stretched.
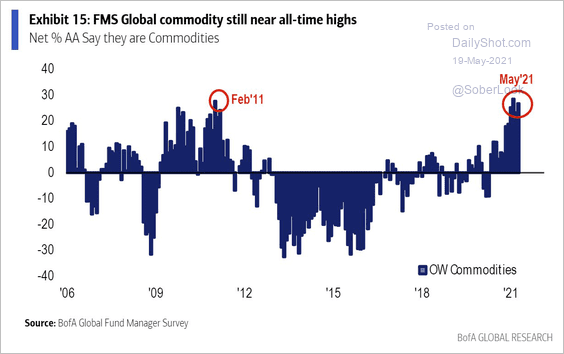 Source: BofA Global Research; @Callum_Thomas
Back to Index
Energy
1. Brent crude tested resistance at $70/bbl three times this month.
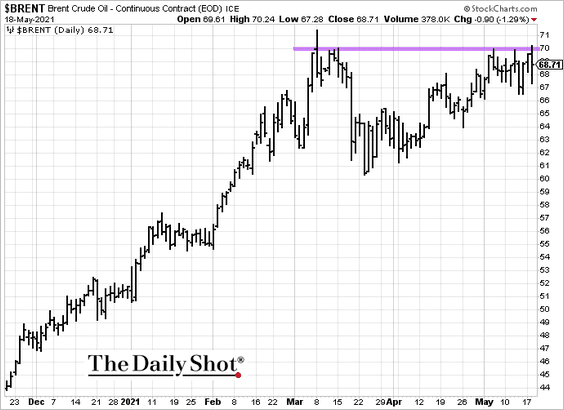 Source: barchart.com
2. Next, we have the cost curves for new oil projects.
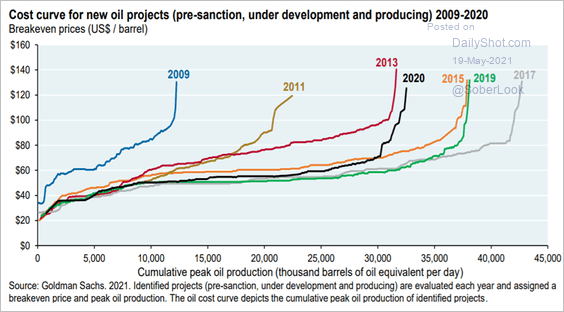 Source: J.P. Morgan Asset Management
3. This chart shows US energy consumption by end-use and fuel type.
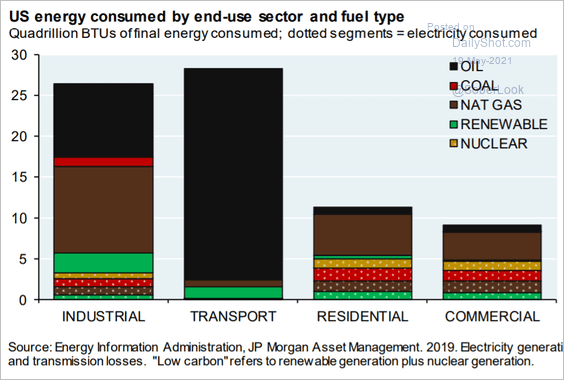 Source: J.P. Morgan Asset Management
Back to Index
Equities
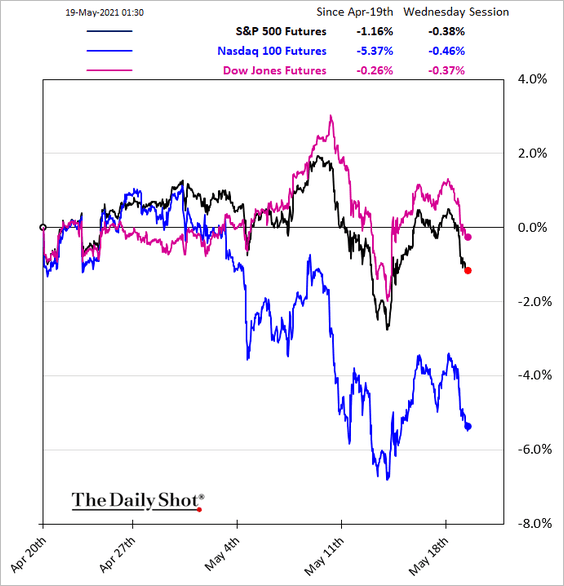
1. The Nasdaq 100 continues to lag.
2. Related to the above, the S&P 500 concentration has been moderating.
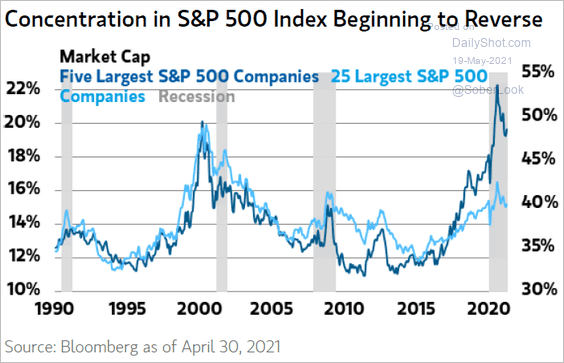 Source: @ISABELNET_SA, @MorganStanley
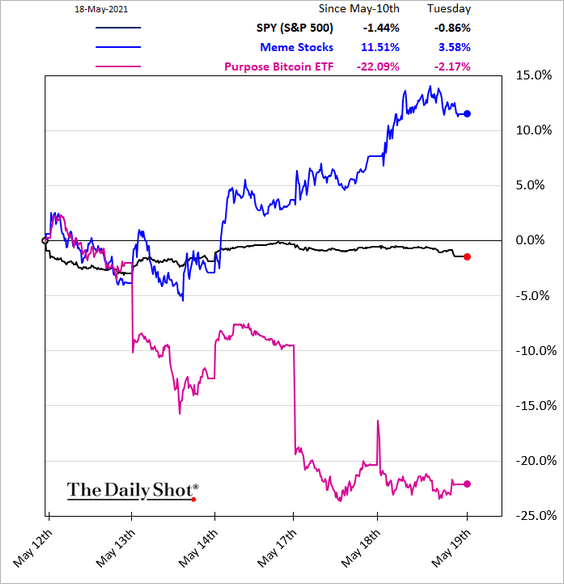
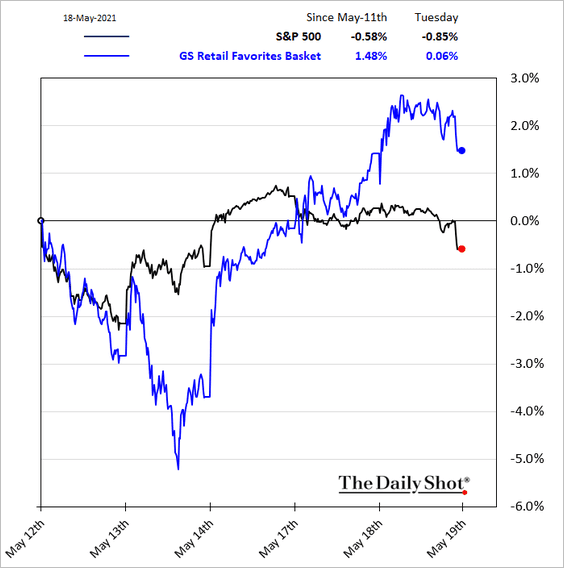
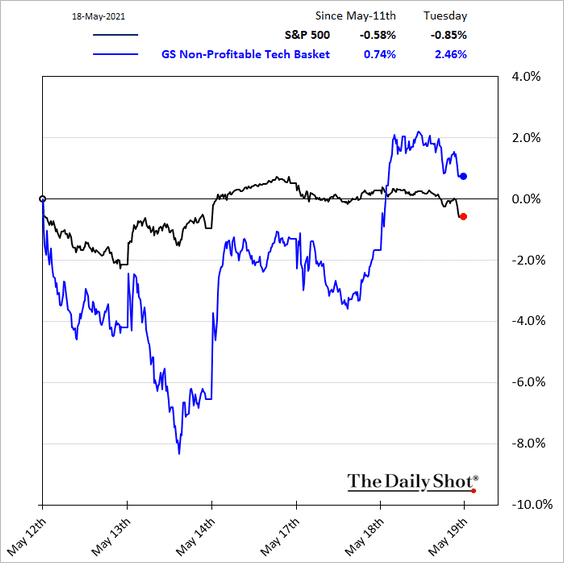
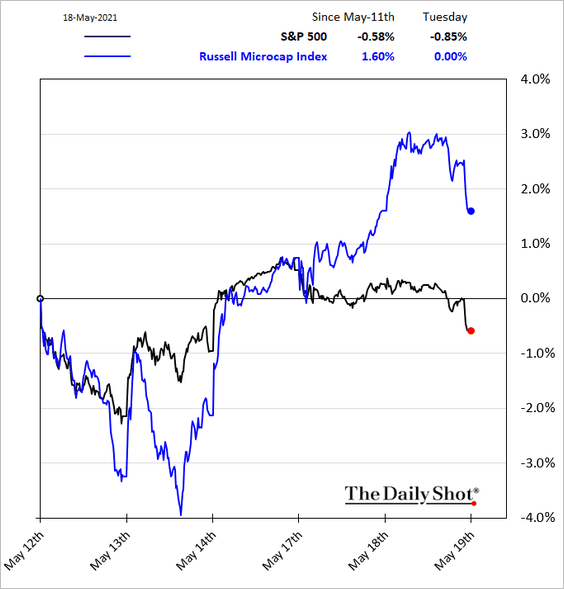
3. We continue to see the rotation out of crypto back into stocks favored by the Reddit crowd.
• Meme stocks vs. bitcoin:
• Retail favorites:
• Non-profitable tech:
• Microcaps:
——————–
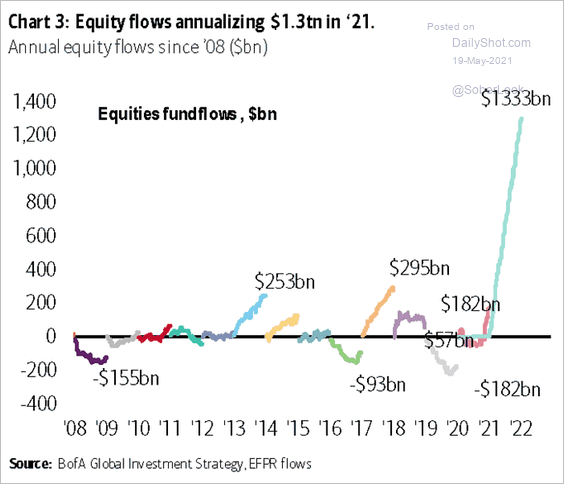
4. This year’s fund inflows have been impressive. Will we see a pullback?
 Source: @ISABELNET_SA, @BofAML
5. This chart shows equity issuance as a percent of US GDP.
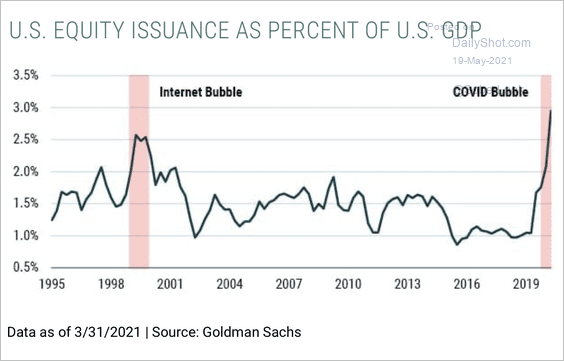 Source: @jessefelder Read full article
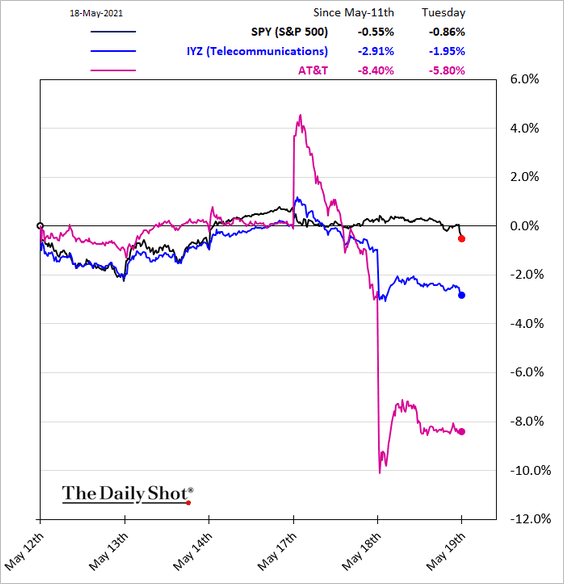
6. Telecoms came under pressure on Tuesday.
7. It’s been a good few months for bank shares.
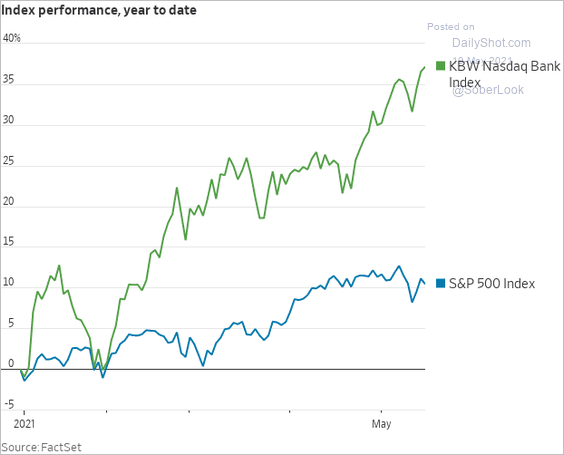 Source: @WSJ Read full article
8. The GOP ETF has been outperforming because of higher concentrations of cyclical sectors (see story).
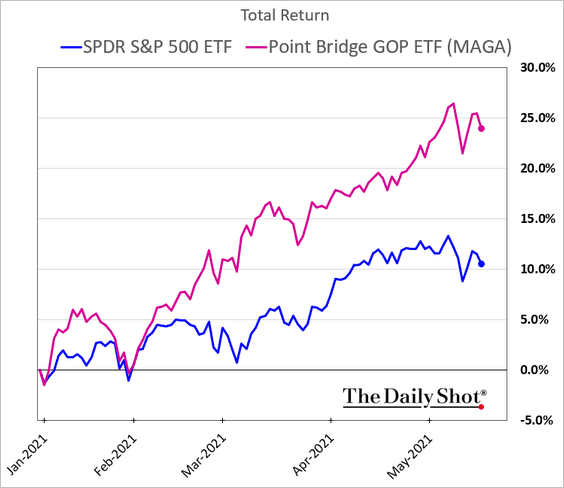 h/t @Tobin_Tweets, @business
9. Will value continue to outperform growth?
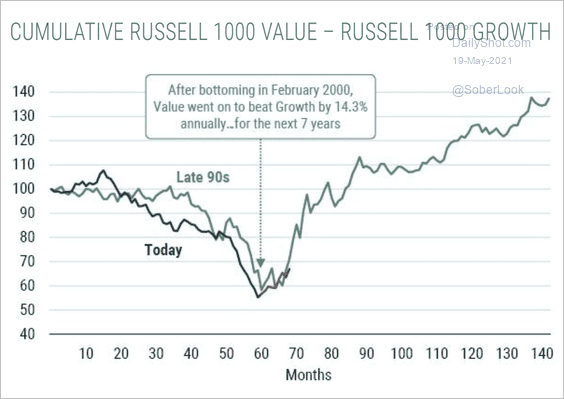 Source: @jessefelder, @verdadcap Read full article
10. Valuations remain a concern (2 charts).
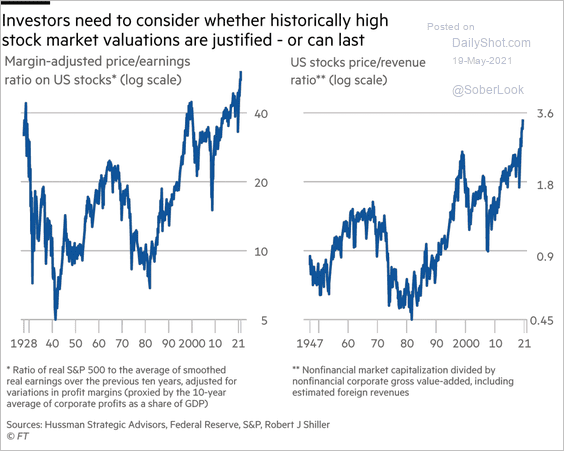 Source: @financialtimes Read full article
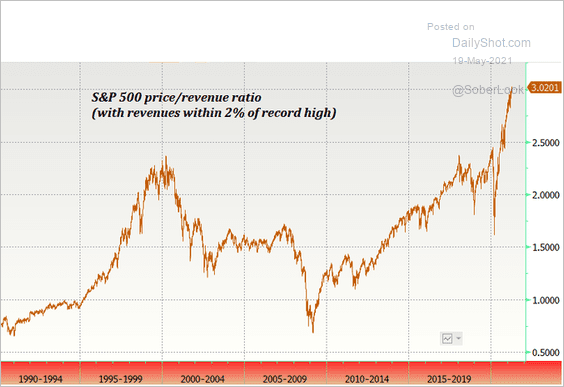 Source: @hussmanjp
——————–
11. Historically, a selloff occurs at the beginning of a tightening cycle but ultimately, equities trade higher.
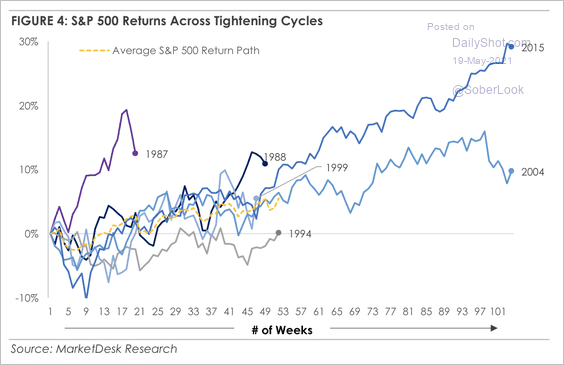 Source: MarketDesk Research
Back to Index
Alternatives
1. Roughly 70% of US buyouts have been priced above 11x EBITDA.
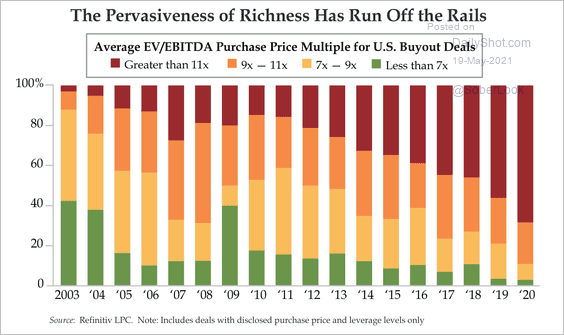 Source: Quill Intelligence
2. Global private equity deal activity came roaring back after the brief pandemic slump.
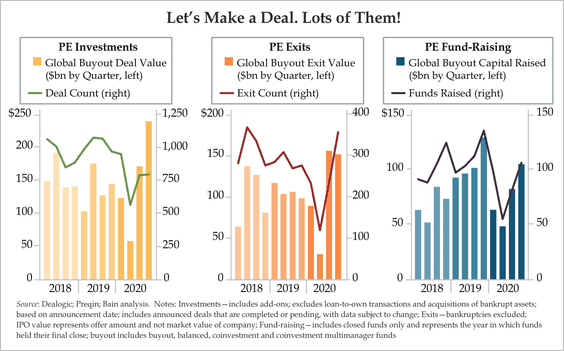 Source: Quill Intelligence
3. IPOs are dramatically surpassing secondary deals in European private equity exits.
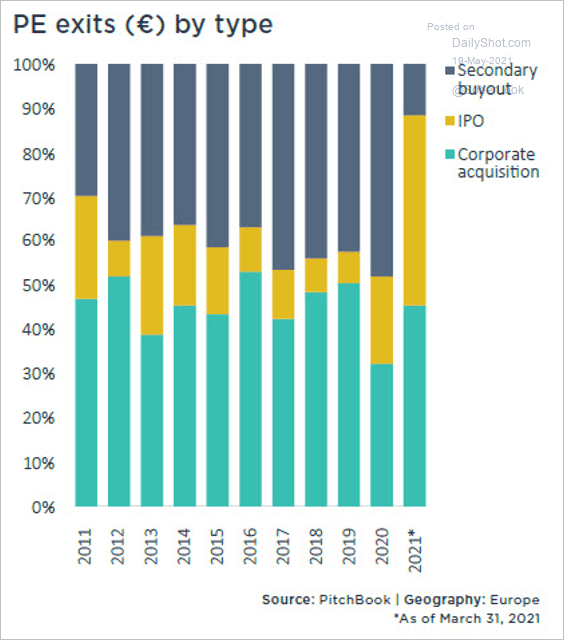 Source: PitchBook
4. Trailing 12-month returns are on the upswing for publicly traded private equity managers.
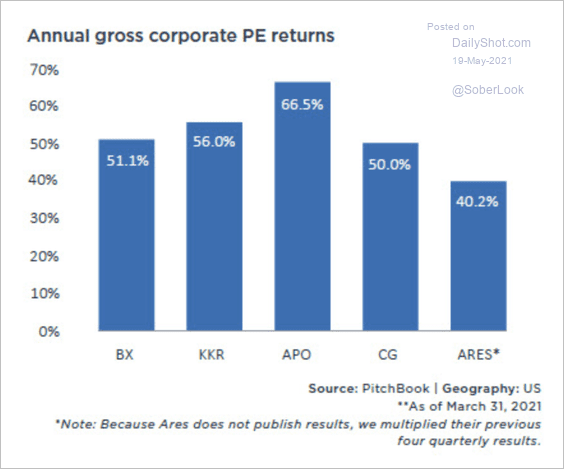 Source: PitchBook
5. Valuations continued to grow across all VC stages in the UK and Ireland despite Brexit uncertainties last year.
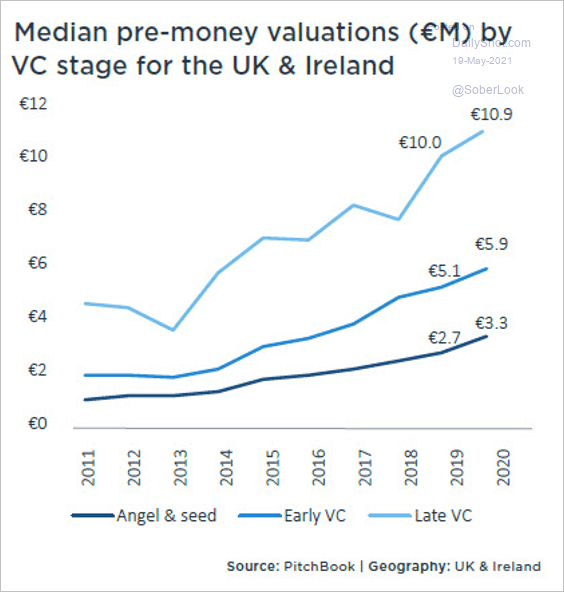 Source: PitchBook
6. Fintech VC deals are popular this year.
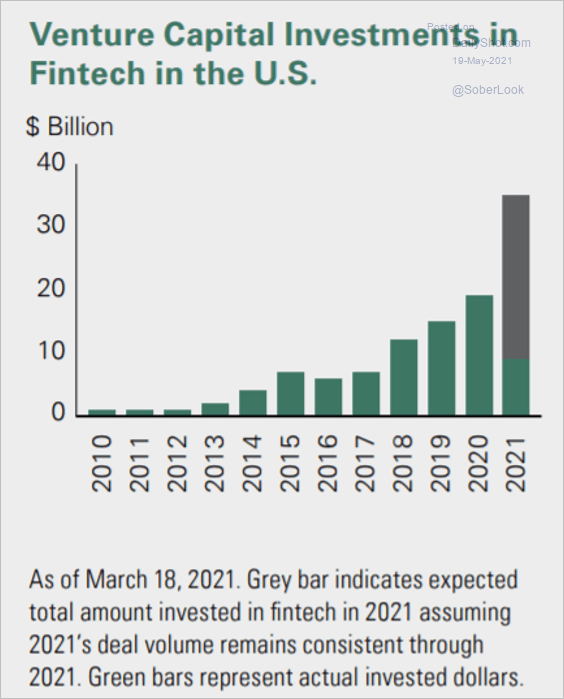 Source: https://www.bessemertrust.com/sites/default/files/2021-04/04_01_21_BT_QIP_Future_of_Money_UA_0.pdf Read full article
7. The number of global real estate funds under $500 million reached the lowest level since 2004 last year. However, activity for funds between $500 million and $5 billion held relatively steady year-over-year.
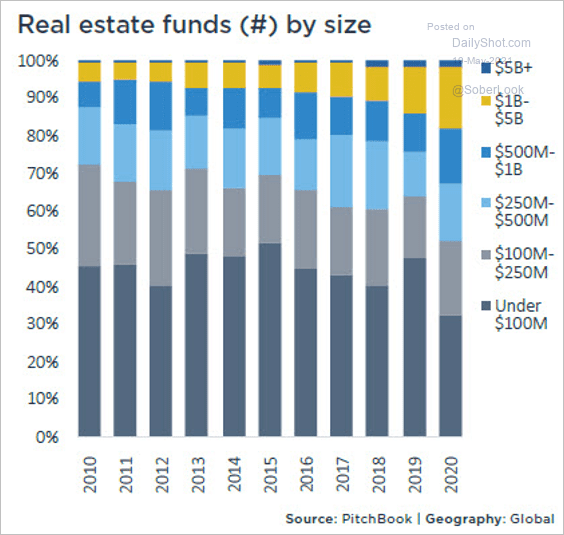 Source: PitchBook
8. There is plenty of available capital in private real-estate funds.
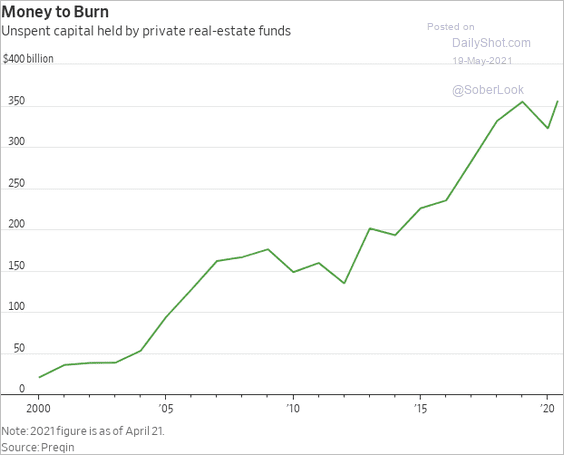 Source: @WSJ Read full article
Back to Index
Rates
1. The TIPS curve continues to steepen as shorter-maturity real yields move deeper into negative territory (2 charts).
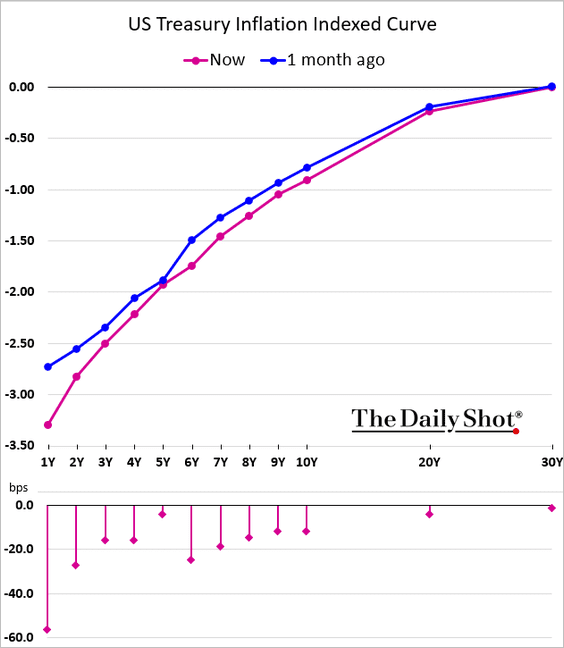
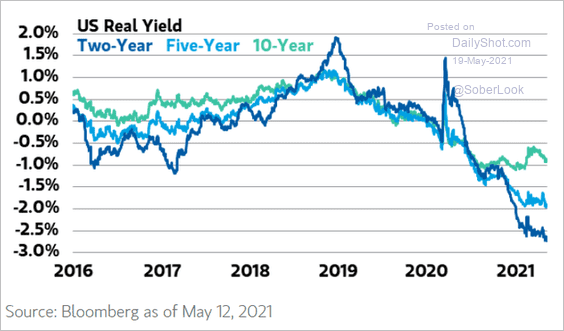 Source: @ISABELNET_SA, @MorganStanley
——————–
2. Long-term inflation expectations (5yr, 5yr forward) remain correlated with crude oil.
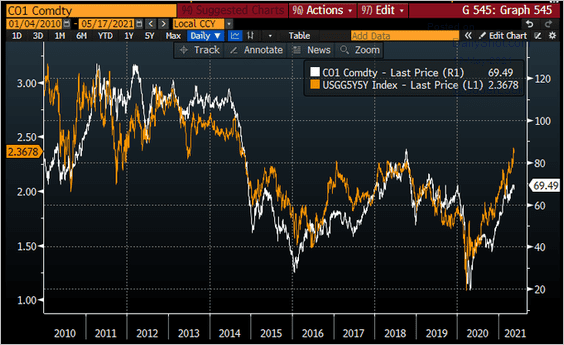 Source: @RobinBrooksIIF
3. Global safe-haven assets are increasingly dominated by Treasuries.
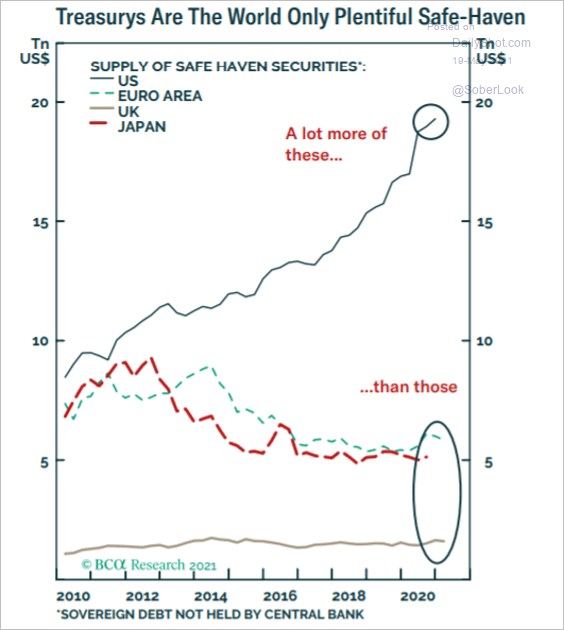 Source: BCA Research
4. Foreigners have been buying Treasury notes and bonds (see definition of TIC).
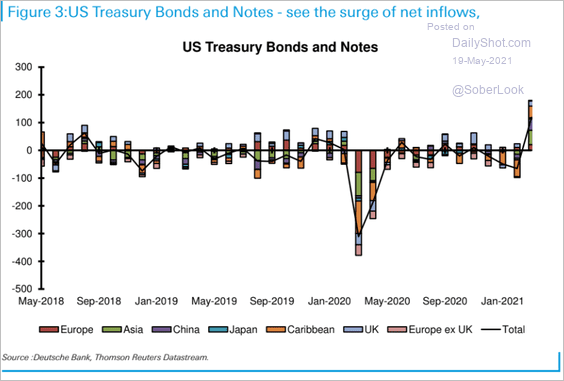 Source: Deutsche Bank Research
Back to Index
Global Developments
1. The Bloomberg US Dollar Index is at support.
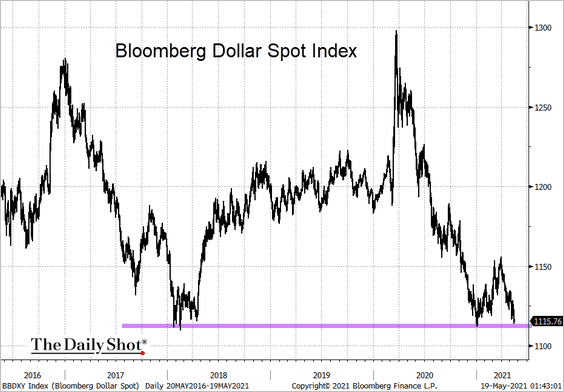 Source: @TheTerminal, Bloomberg Finance L.P.
The dollar still appears overvalued despite recent weakness.
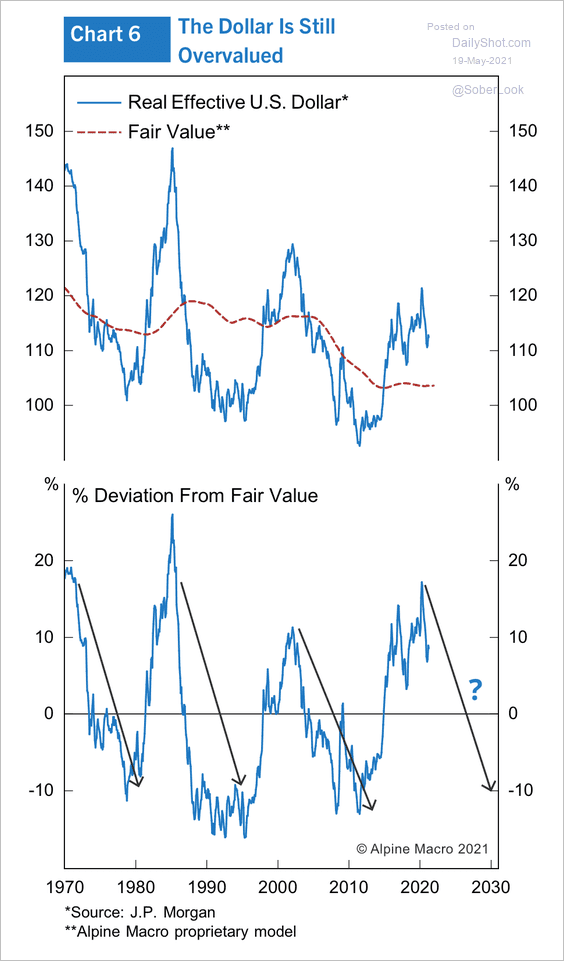 Source: Alpine Macro
——————–
2. Total global debt fell by $1.7 trillion to $289 trillion in Q1, which was the first decline in about two years, according to IIF.
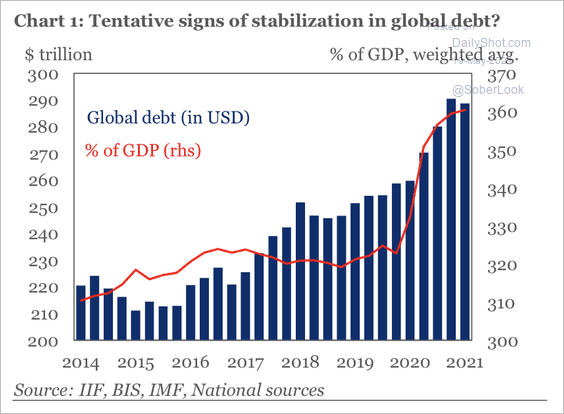 Source: IIF
3. The pace of global central bank balance sheet expansion peaked at the start of the year.
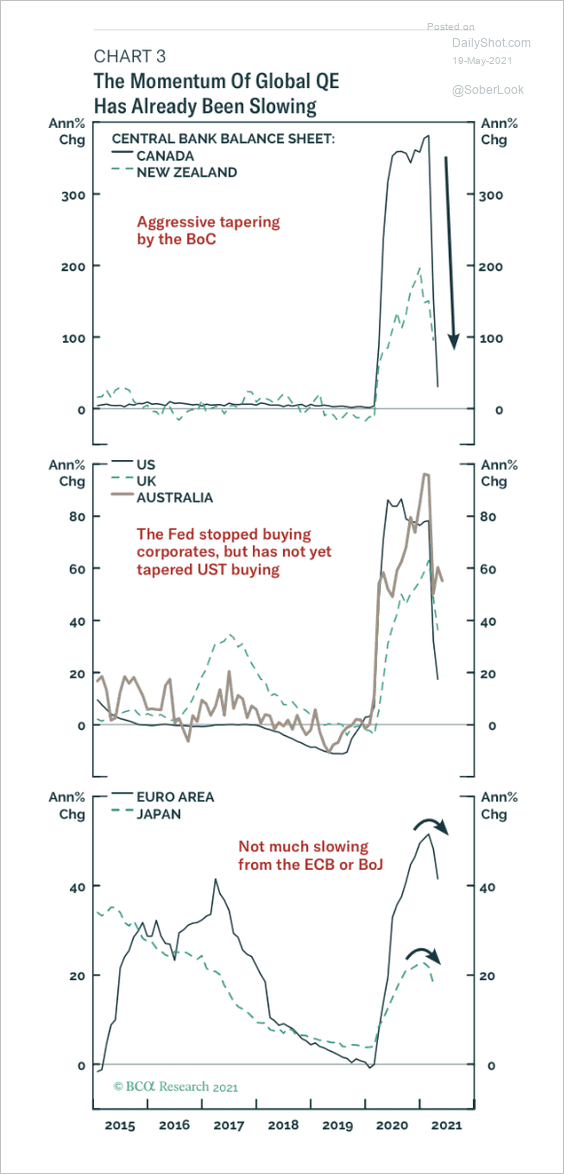 Source: BCA Research
4. What do global fund managers consider the biggest tail risk?
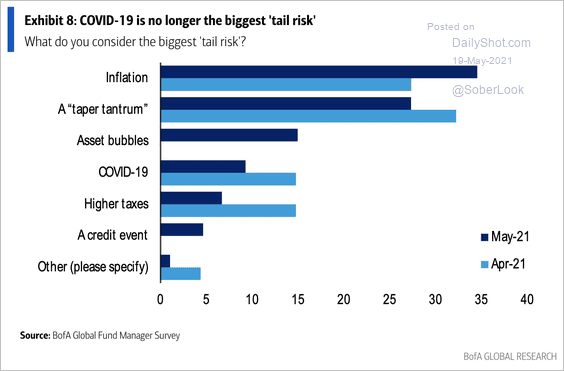 Source: BofA Global Research; @SamRo
5. Home price appreciation accelerated last year across OECD economies.
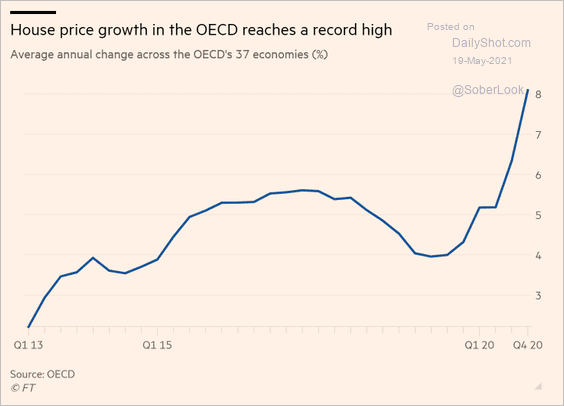 Source: @financialtimes Read full article
——————–
Back to Index
Food for Thought
1. Eviction rates and eviction filing rates (the big circle is PA):
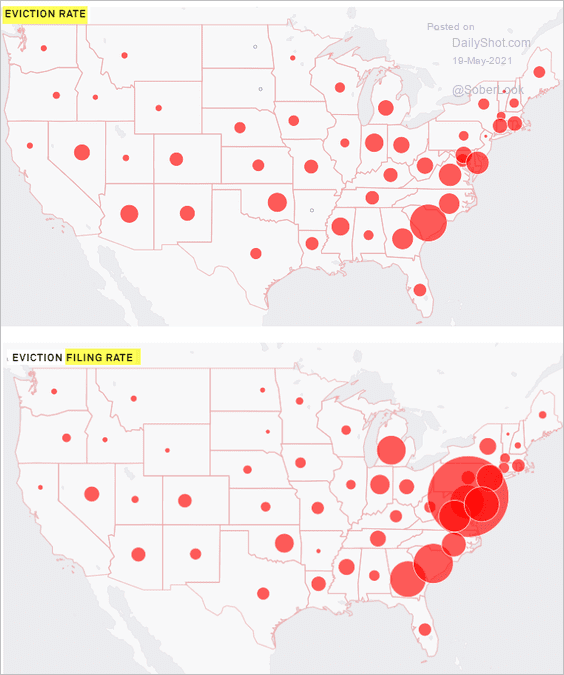 Source: Princeton University’s Eviction Lab
2. EV prices:
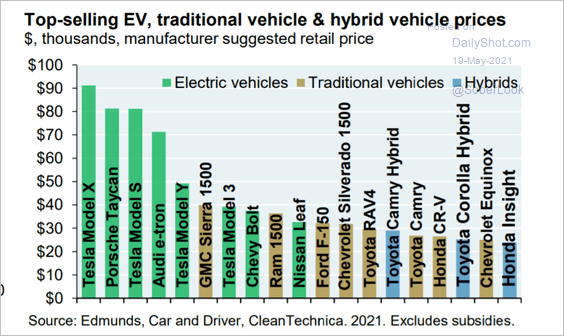 Source: J.P. Morgan Asset Management
3. Fast food franchise costs:
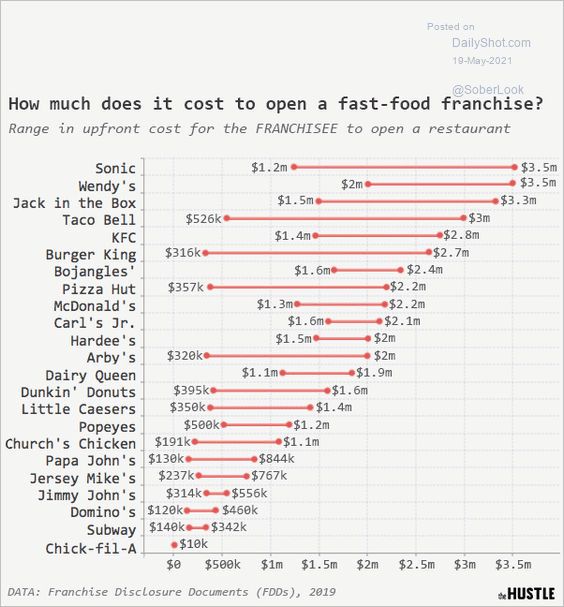 Source: The Hustle; h/t JJ Read full article
4. The Eurovision Song Contest:
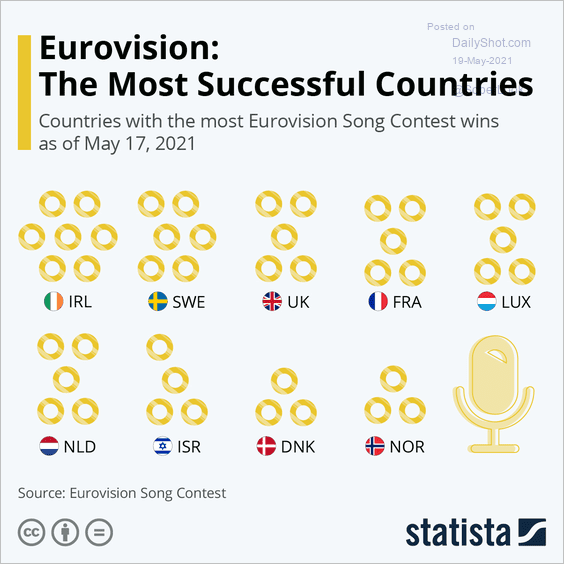 Source: Statista
5. Americans’ interest in watching Olympic sports:
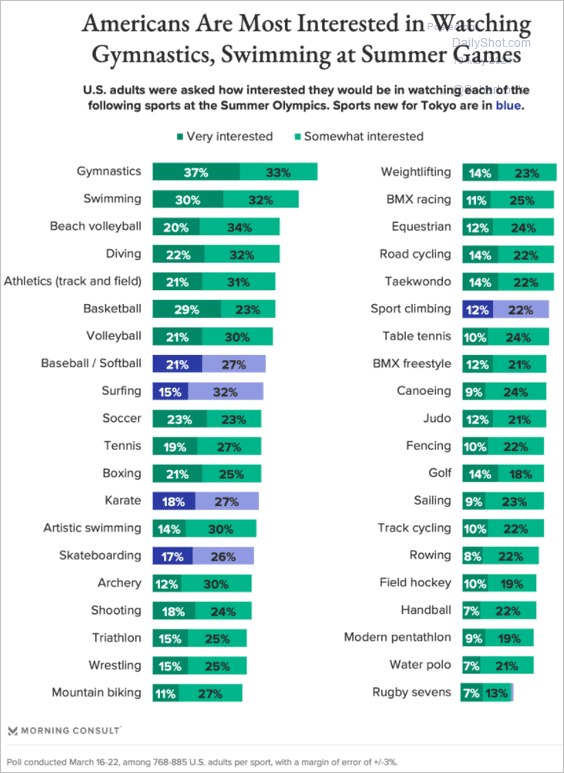 Source: Morning Consult Read full article
6. Greenhouse gas emissions from online retail:
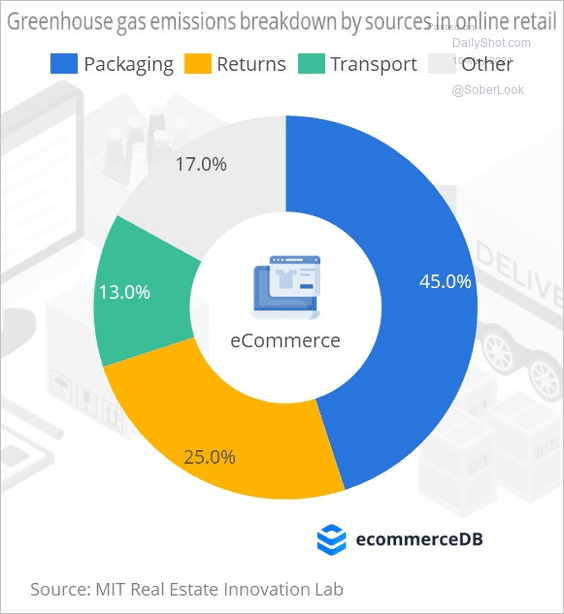 Source: eCommerce DB Read full article
7. Average age of US infrastructure:
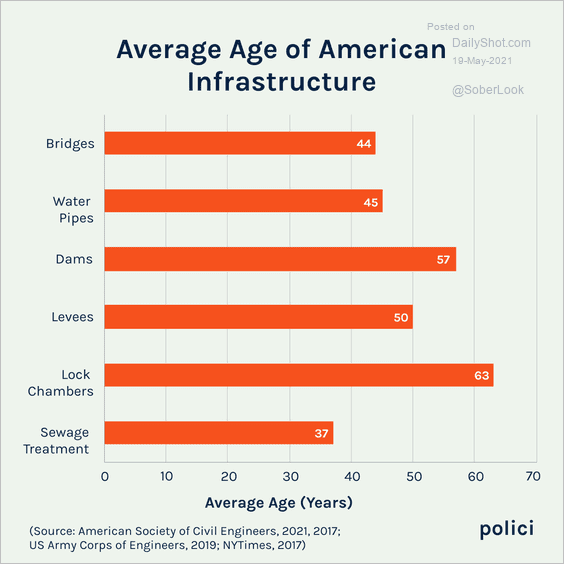 Source: polici Read full article
8. Comfort with public activities:
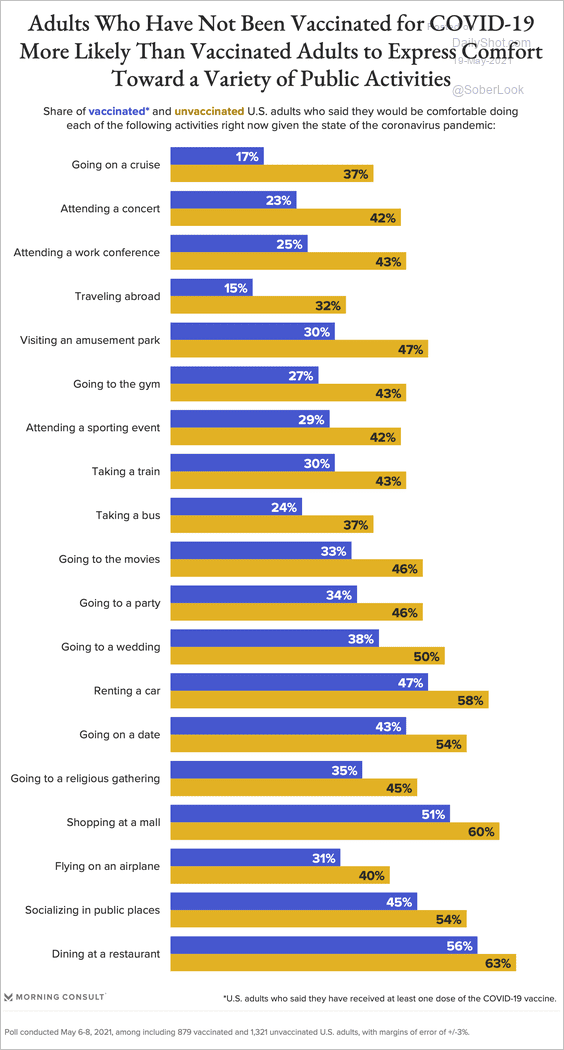 Source: Morning Consult Read full article
9. Vaccine hesitancy globally:
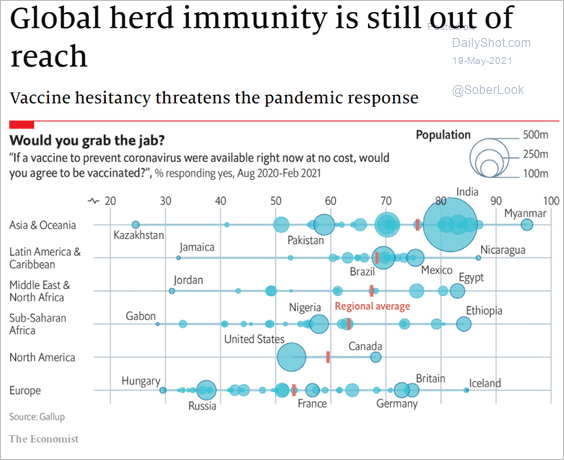 Source: The Economist Read full article
10. Vaccine misinformation:
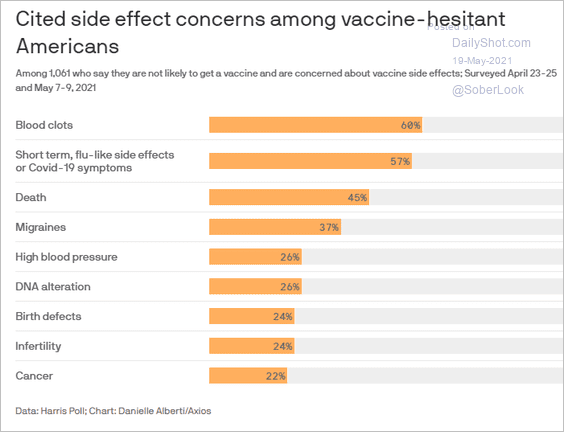 Source: @axios Read full article
11. Wine consumption by age in France:
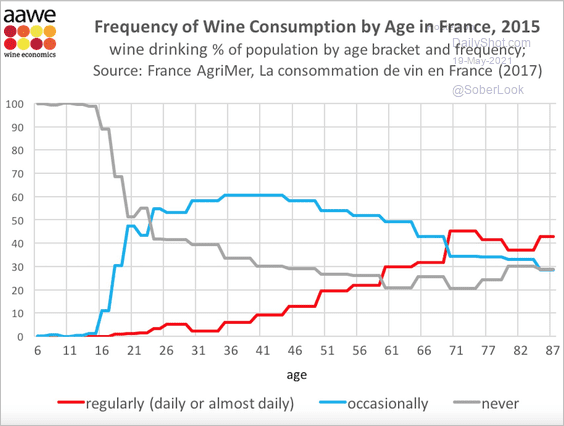 Source: @wineecon
——————–
Back to Index