
The Daily Shot: 01-Jun-21
• The United States
• Canada
• The Eurozone
• Japan
• Asia – Pacific
• China
• Emerging Markets
• Commodities
• Energy
• Equities
• Credit
• Rates
• Global Developments
• Food for Thought
The United States
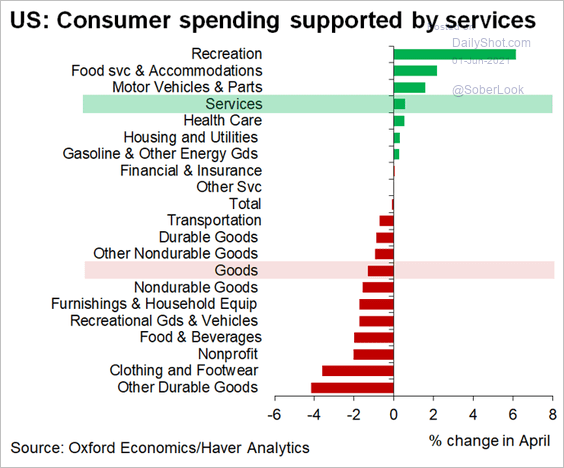
1. Consumer spending is back in line with the pre-COVID trend.
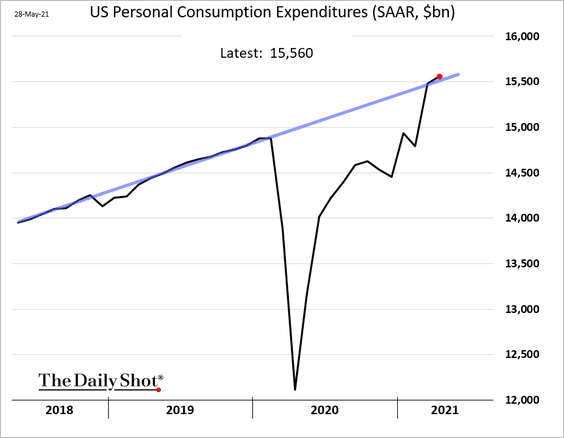
The April changes show some “reopening rotation” from goods to services.
 Source: @GregDaco
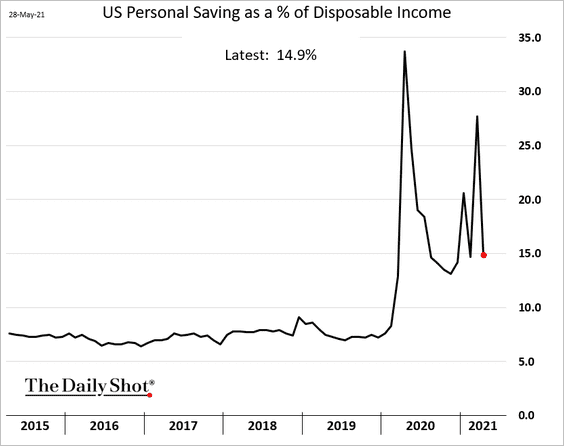
2. Personal income is off the March highs (stimulus checks) but remains well above the pre-crisis trend.
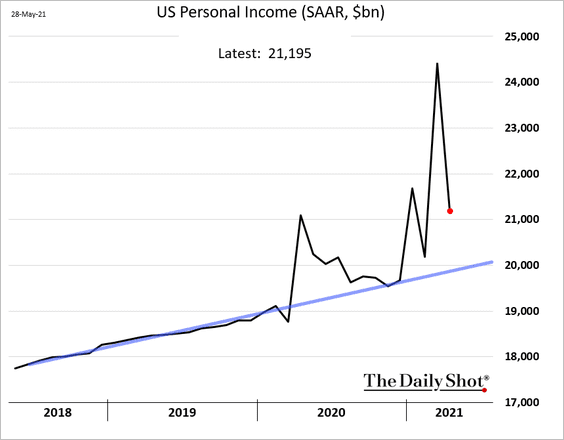
Savings as a share of disposable income remain elevated.
——————–
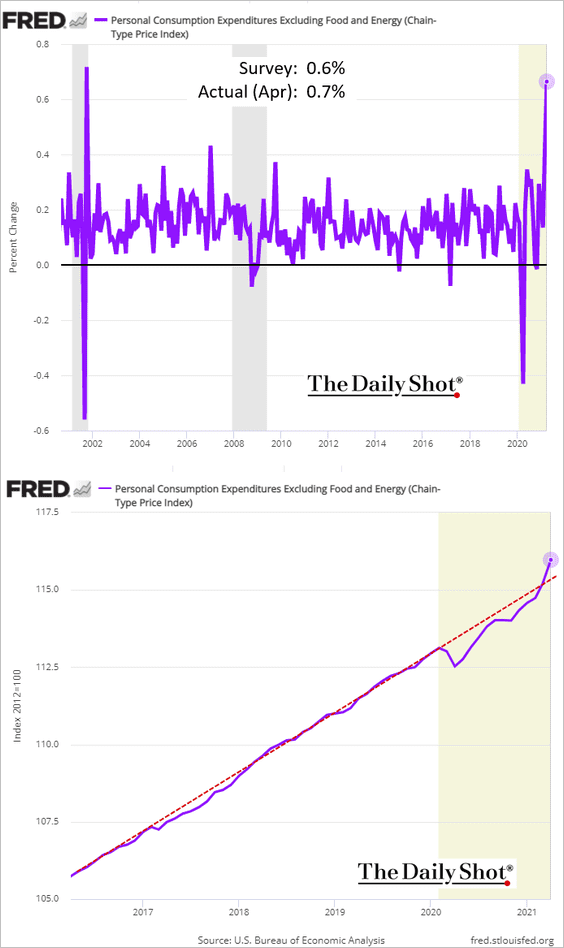
3. The core PCE inflation, the Fed’s preferred measure, increased by most in nearly two decades in April. But the index (second chart) is only slightly above the pre-COVID trend.
4. Initial jobless claims continue to trend lower.
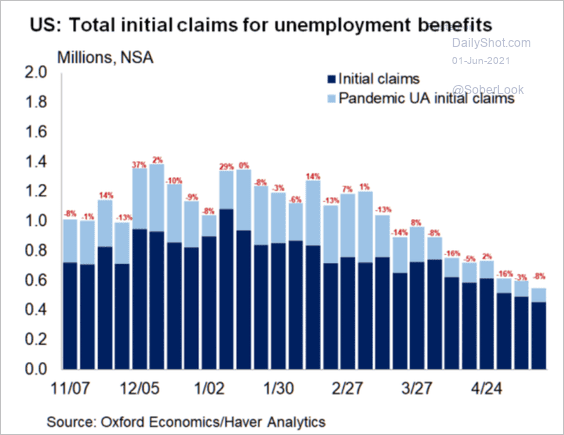 Source: Oxford Economics
With multiple states ending their emergency unemployment programs shortly, continuing claims will be shrinking rapidly.
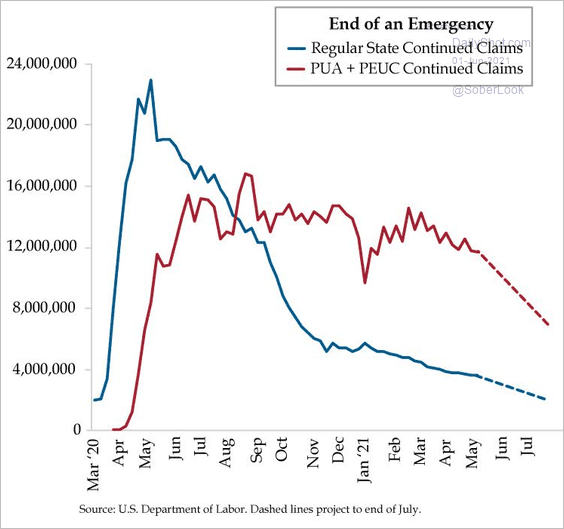 Source: The Daily Feather
——————–
5. Pending home sales weakened in April as buyers balk at sky-high prices (#4 here).
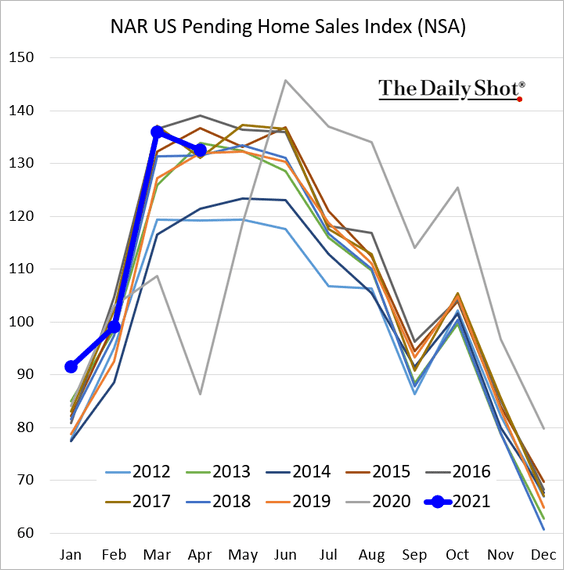
Here are a couple of other trends in the housing market.
• Second homes and investor properties mortgage applications:
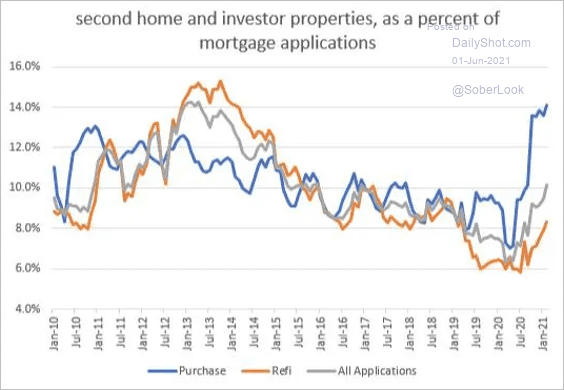 Source: @jessefelder, MBA, @FT Read full article
• New home sales by stage of construction:
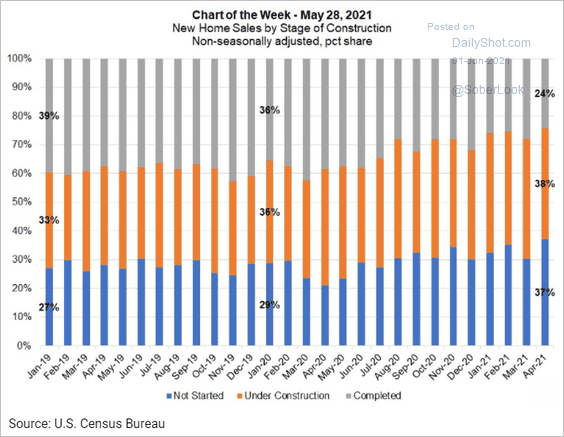 Source: Mortgage Bankers Association
——————–
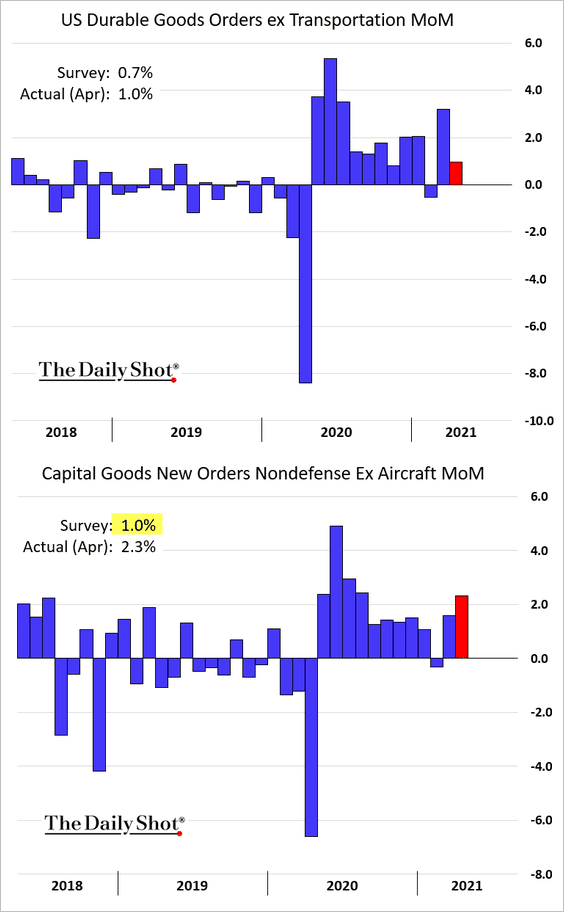
6. Excluding transportation, durable goods orders exceeded forecasts in April. Capital goods orders were particularly strong (second chart), pointing to improving business investment.
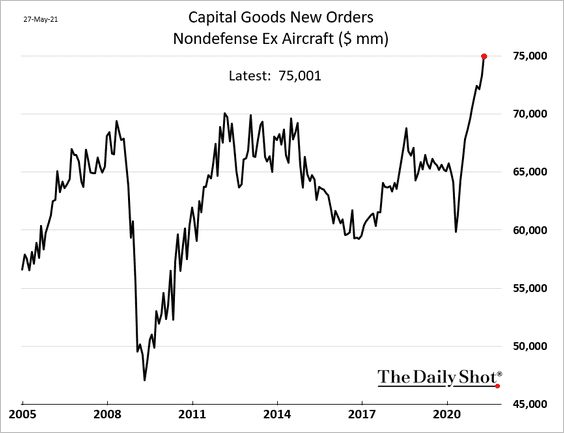
This chart shows US capital goods orders in dollar terms.
——————–
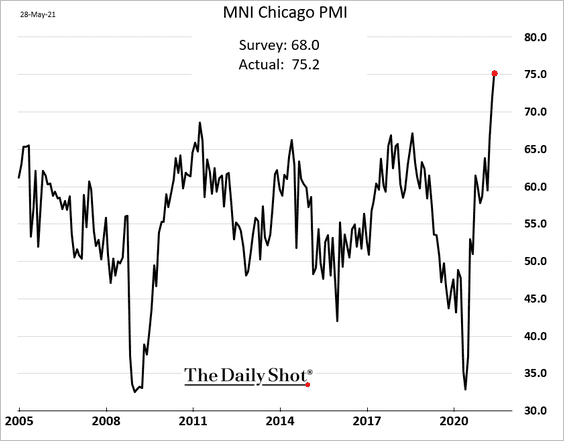
7. The May Chicago PMI measure hit a record high (well ahead of forecasts), signaling extraordinarily strong business activity in the Midwest region. May probably marked the peak for this index.
The Evercore ISI Company Surveys index is off the highs but remains elevated.
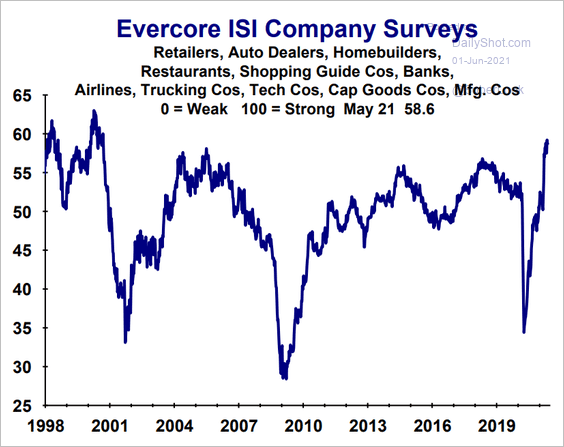 Source: Evercore ISI
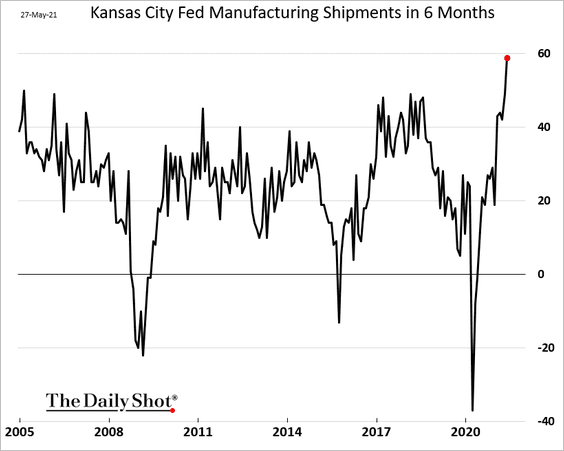
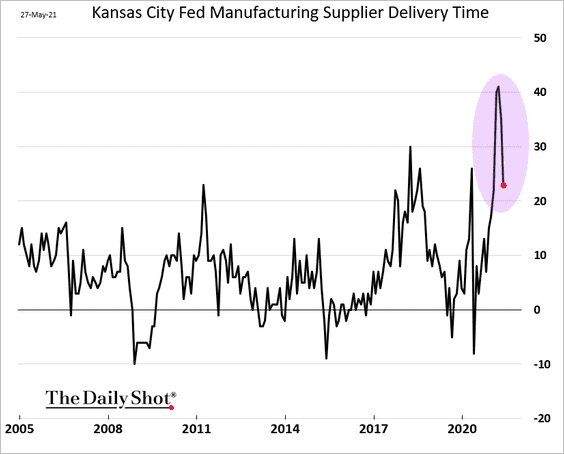
8. The Kansas City regional manufacturing index is also off the highs but still exceptionally robust.
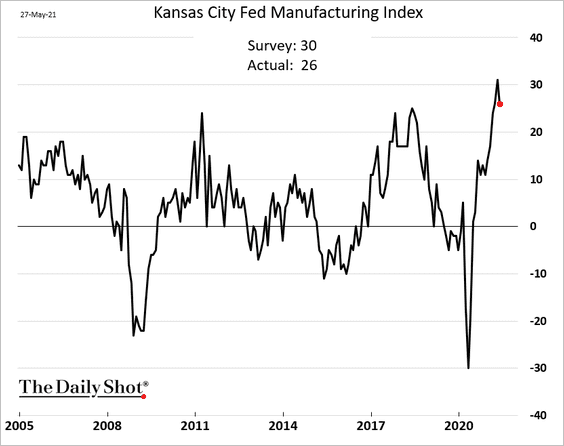
• Manufacturers are upbeat about the next six months.
• Price pressures continue to build.
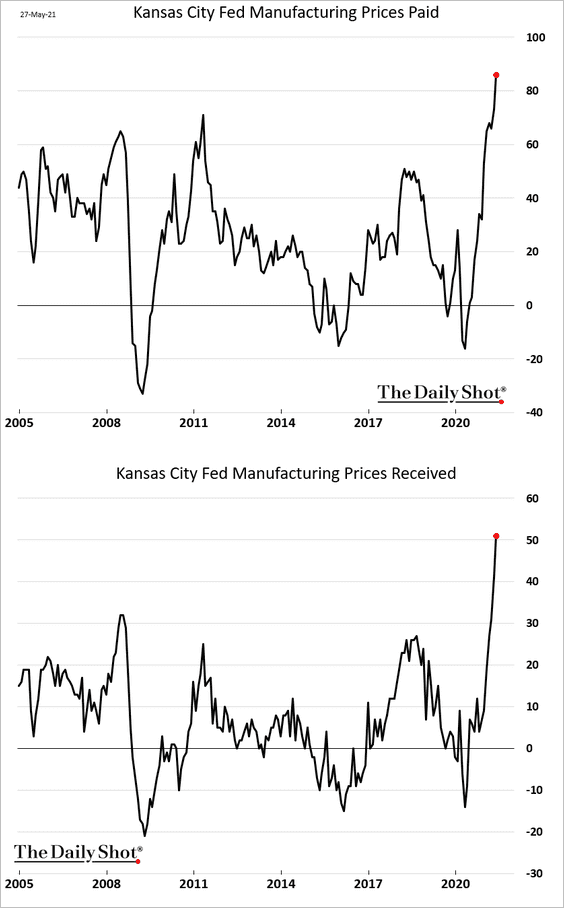
• But supplier bottlenecks seem to be easing.
——————–
9. Two-thirds of Americans think that the worst of the pandemic is “behind us.”
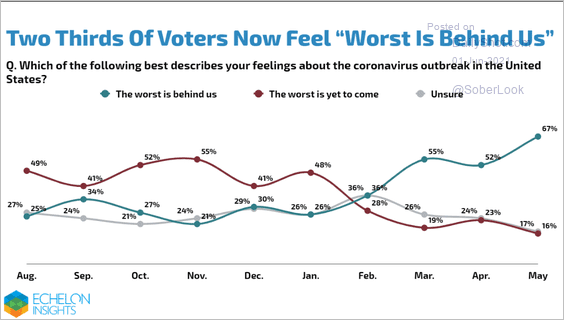 Source: Echelon Insights Read full article
Back to Index
Canada
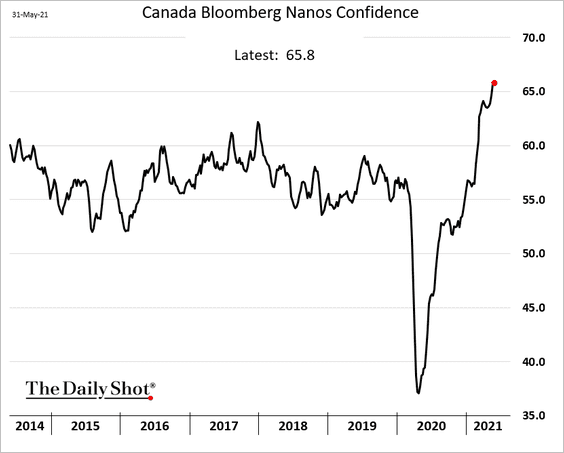
1. Consumer confidence is at multi-year highs.
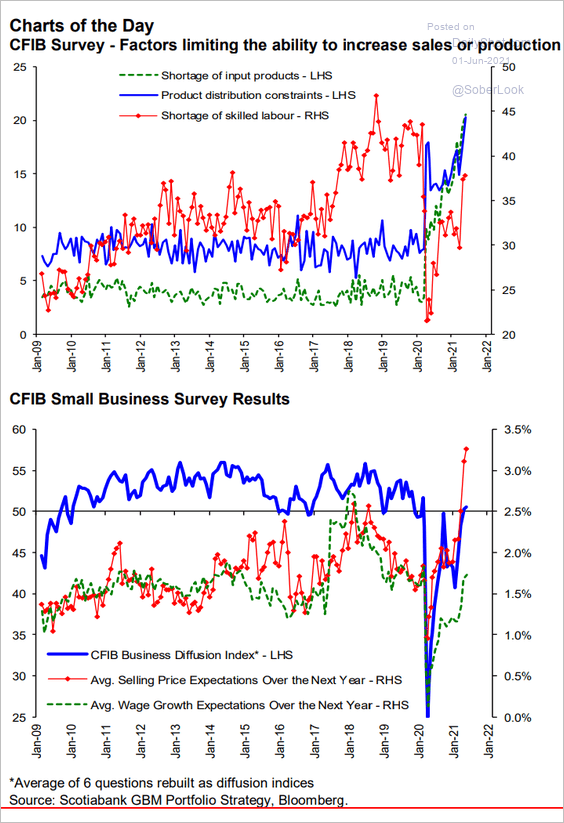
2. The CFIB index points to robust small/medium-size business activity.
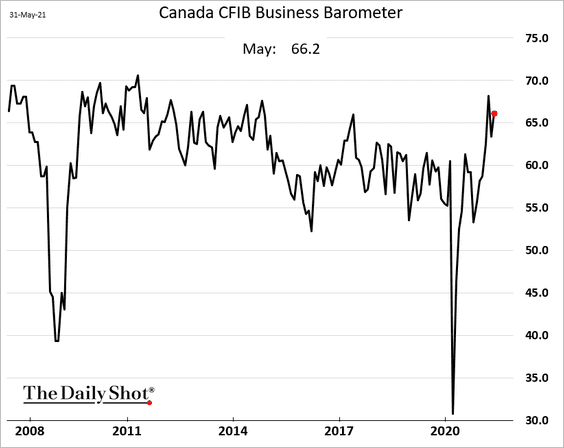
But businesses face logistics bottlenecks and some labor shortages. More firms will be boosting prices over the next year (second chart).
 Source: Hugo Ste-Marie, Portfolio & Quantitative Strategy Global Equity Research, Scotia Capital
——————–
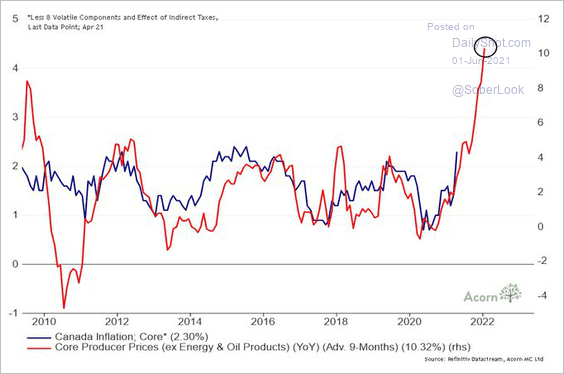
3. The PPI points to rapid increases in consumer prices ahead.
 Source: @RichardDias_CFA
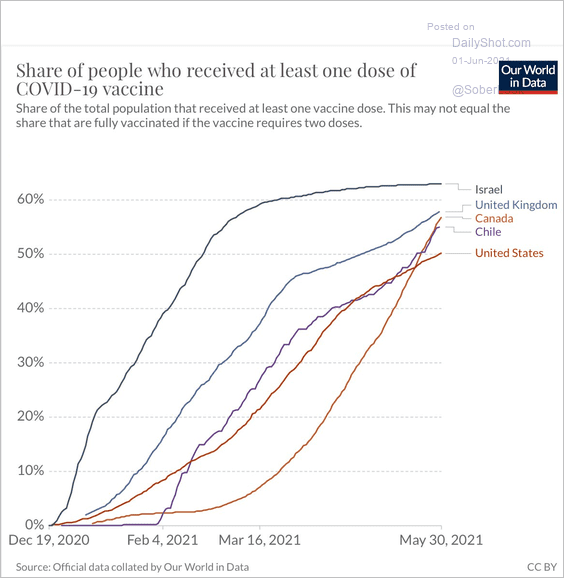
4. Canada’s vaccination program had a slow start but is now outpacing the US.
 Source: @Noahpinion, @EricTopol
Back to Index
The Eurozone
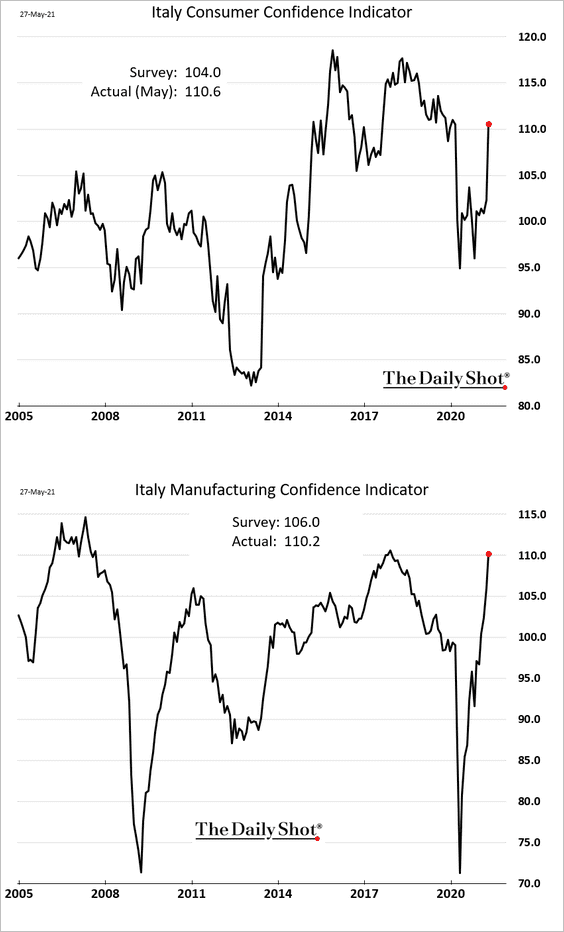
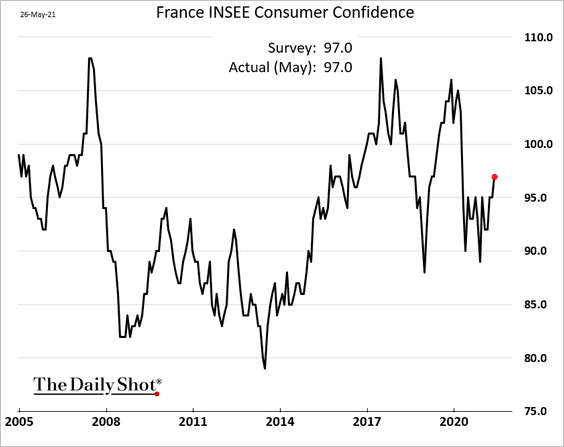
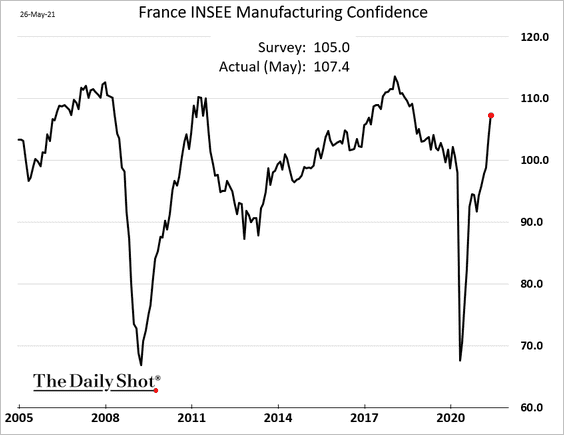
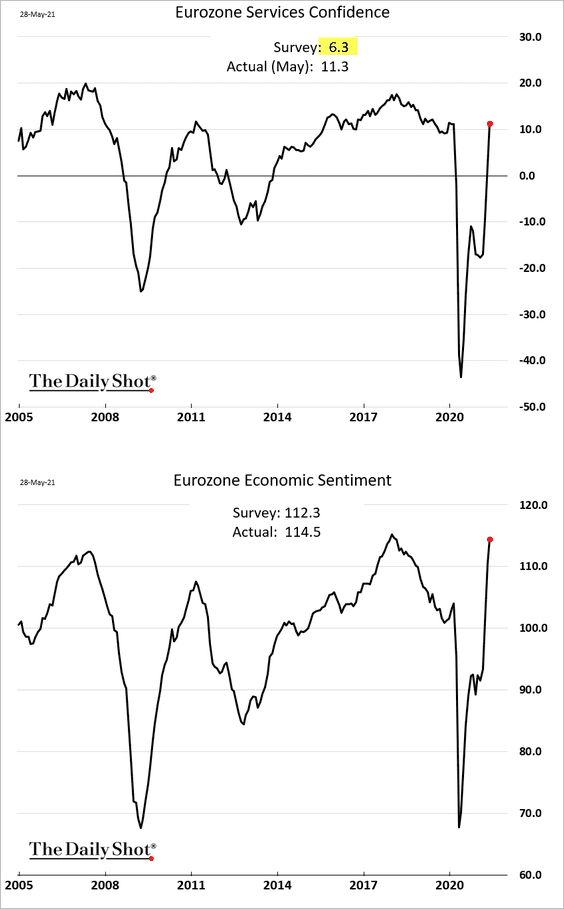
1. Sentiment indicators continue to improve, most topping expectations.
• Italy’s consumer and manufacturing confidence (surging):
• French consumer and manufacturing confidence:
• Germany’s consumer confidence (still weak):

• Euro-area service confidence (sharp rebound):
——————–
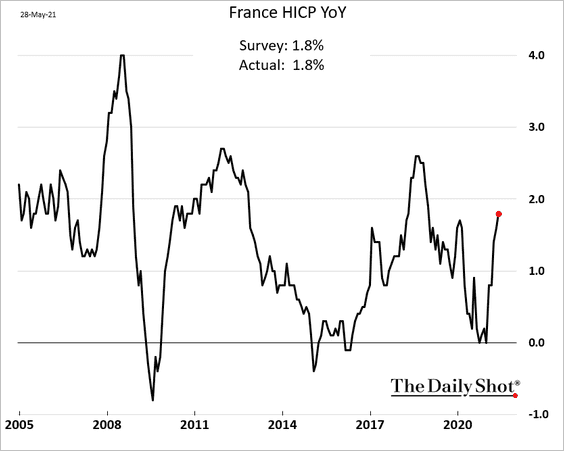
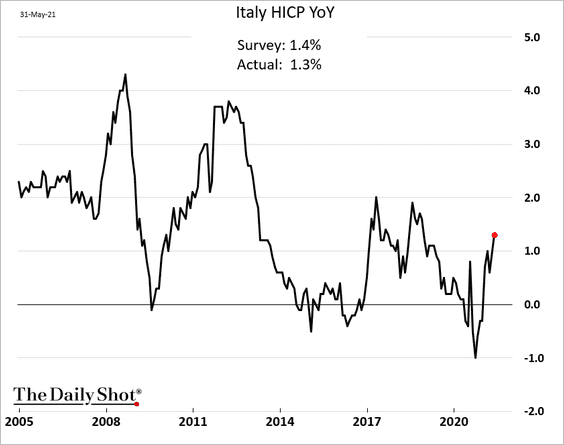
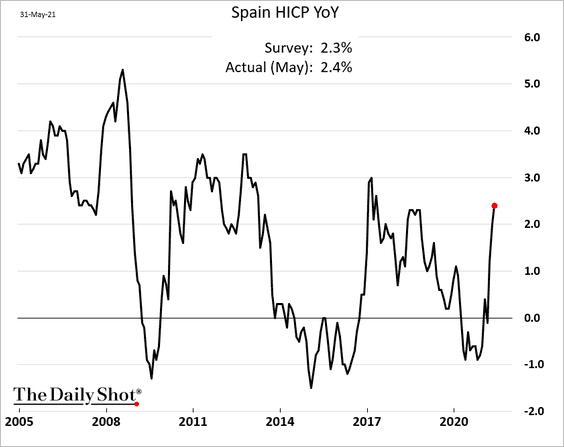
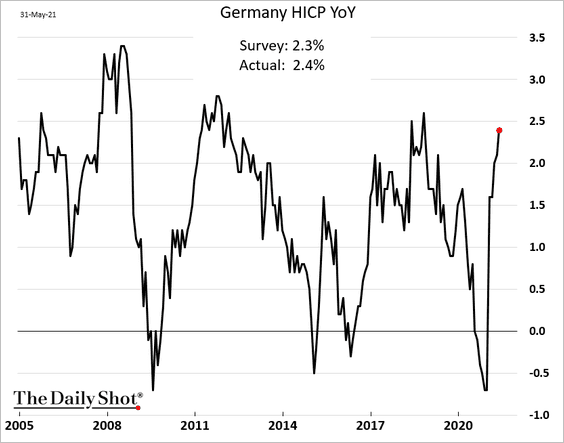
2. Consumer inflation has been firming up. Some of the year-over-year gains are due to base effects.
• France:
• Italy:
• Spain:
• Germany:
——————–
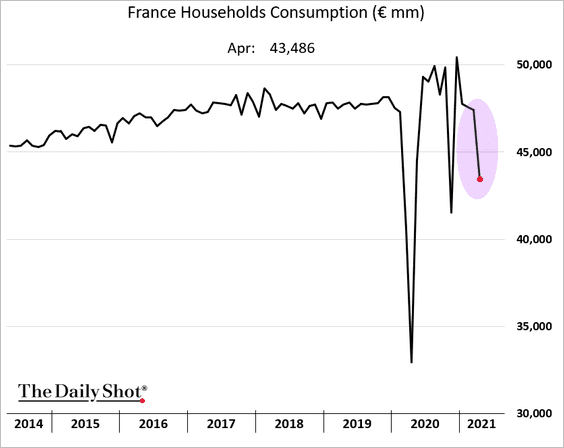
3. French household consumption tumbled in April.
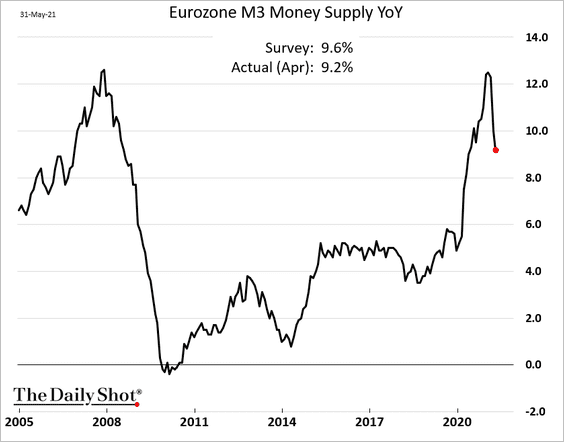
4. The broad money supply expansion slowed more than expected.
5. The Eurozone Citi Economic Surprise Index has diverged from the US equivalent.
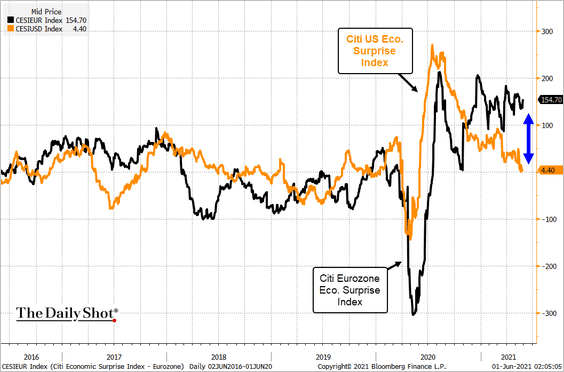 Source: @TheTerminal, Bloomberg Finance L.P.
Back to Index
Japan
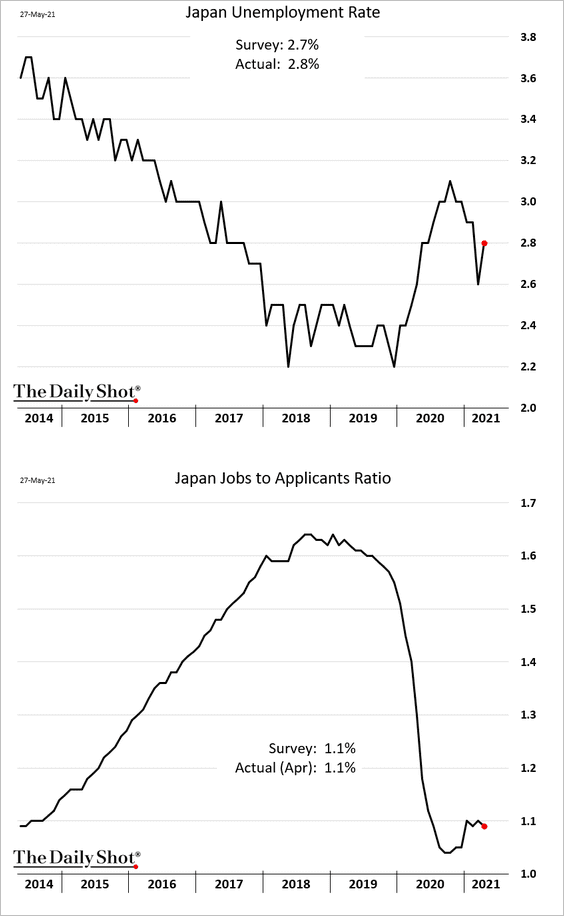
1. The labor market recovery stalled in April.
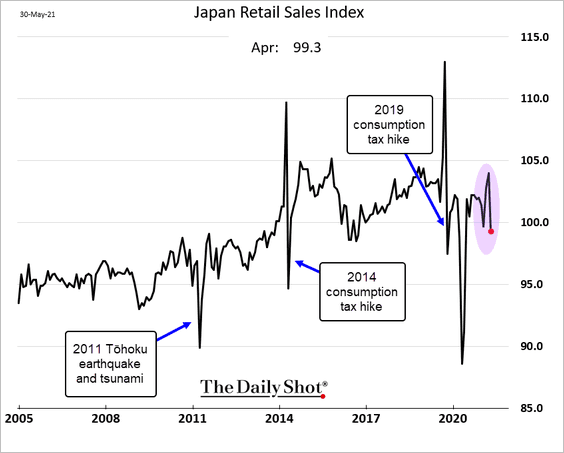
2. Retail sales tumbled.
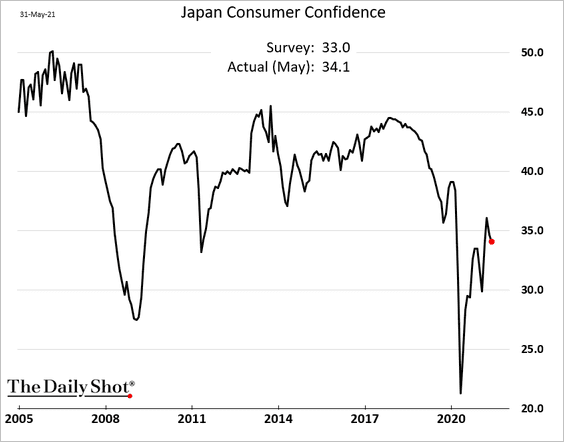
3. Consumer confidence is holding up.
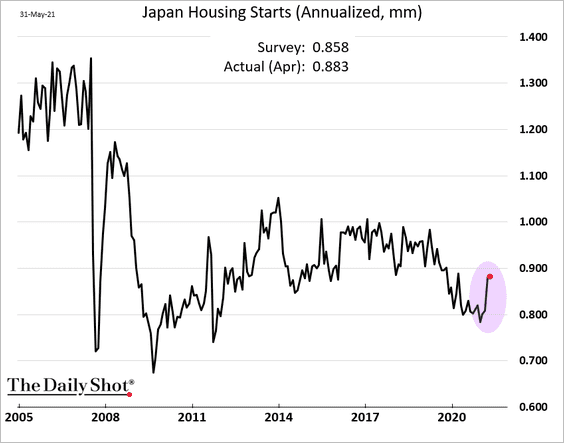
4. Housing starts are at pre-pandemic levels.
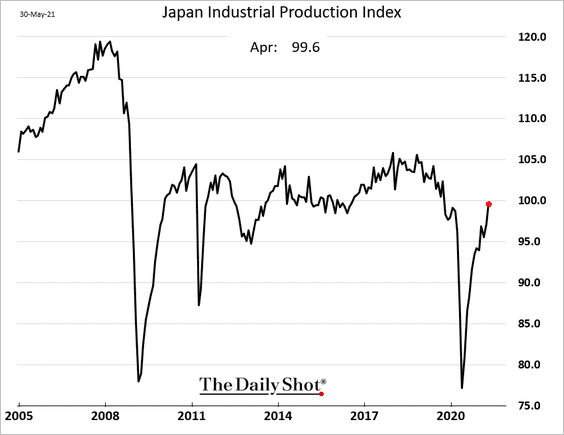
5. Industrial production is also at pre-COVID levels.
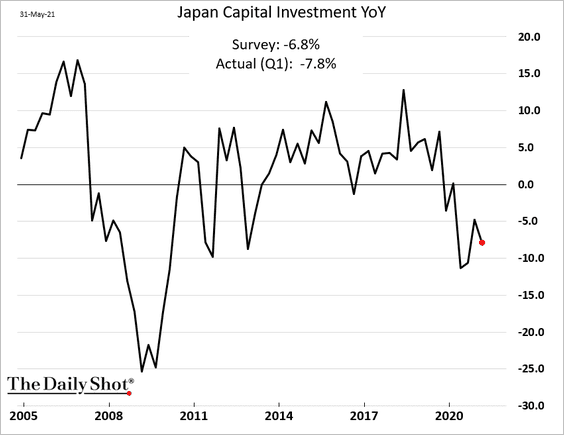
6. CapEx weakened more than expected in the first quarter.
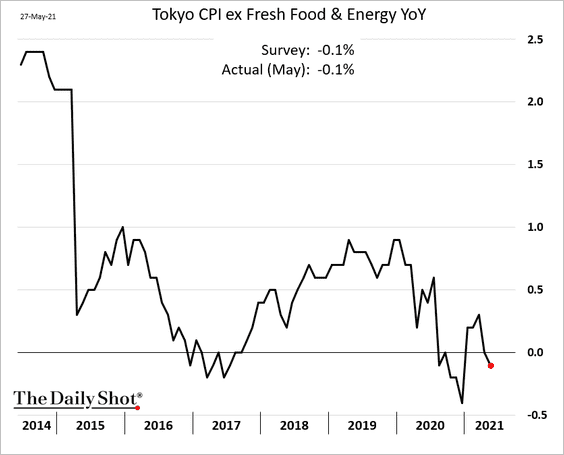
7. Tokyo core CPI is back in negative territory.
Back to Index
Asia – Pacific
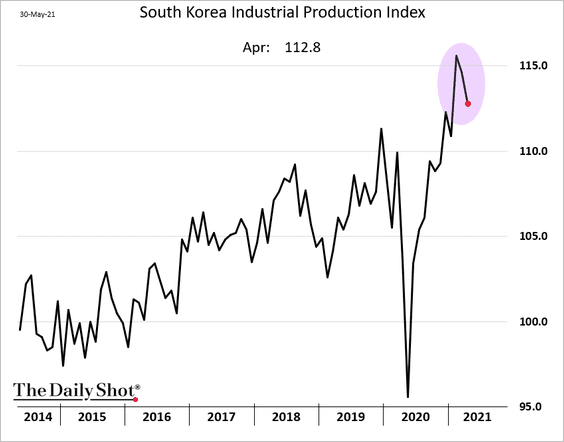
1. Let’s begin with South Korea.
• Industrial production is robust but off the highs.
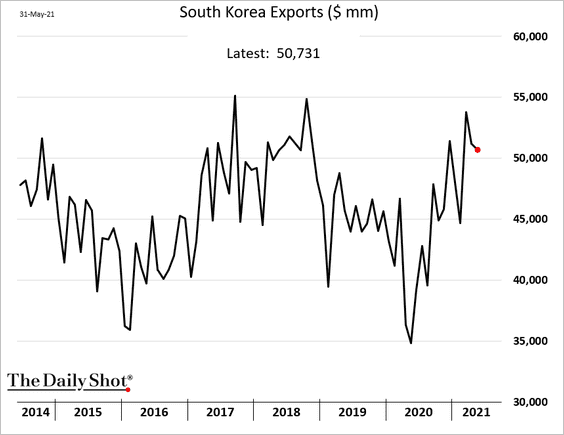
• Exports eased in April.
• The manufacturing PMI is off the highs but still shows expansion in May.
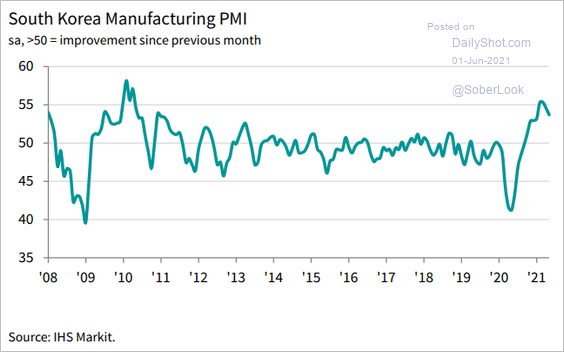 Source: IHS Markit
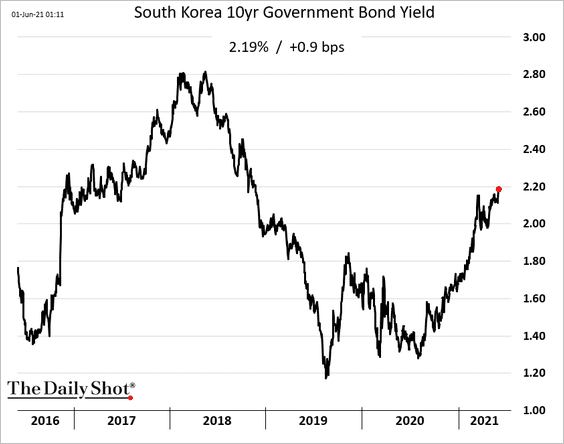
• Bond yields keep climbing.
——————–
2. Taiwan’s manufacturing growth remains near the highest level in a decade.
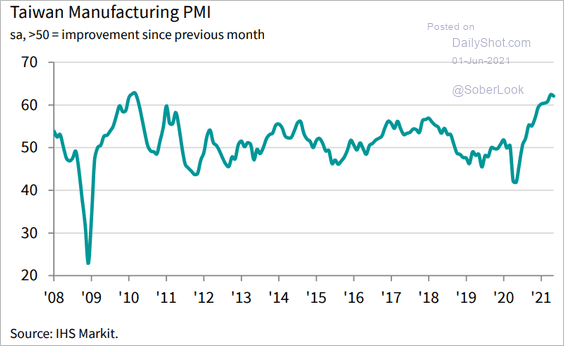 Source: IHS Markit
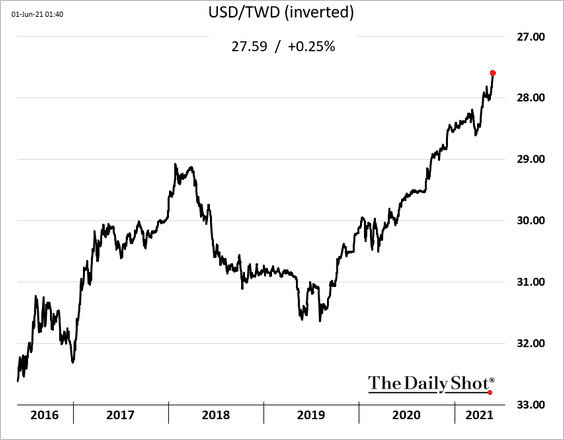
The Taiwan dollar continues to strengthen.
——————–
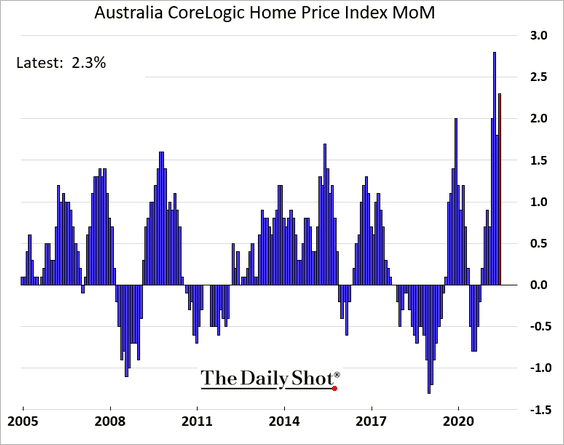
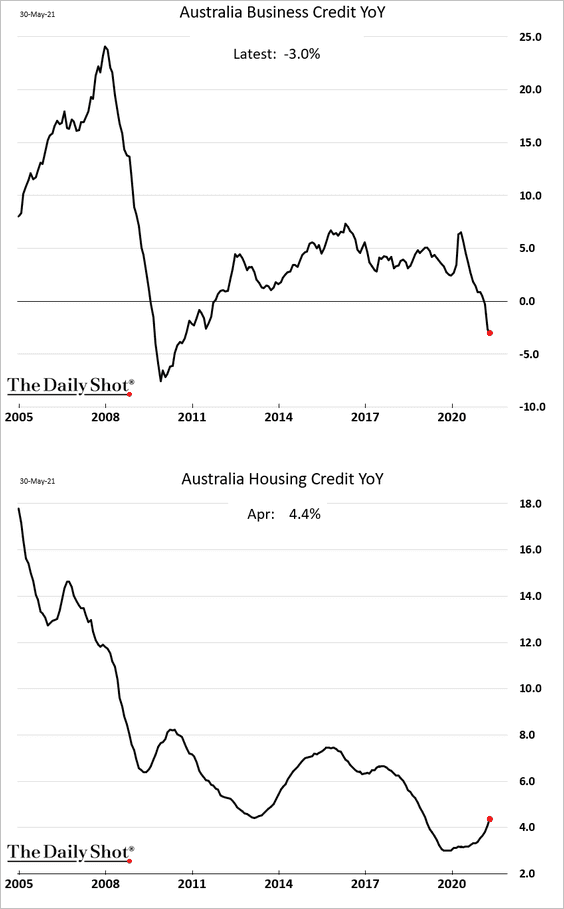
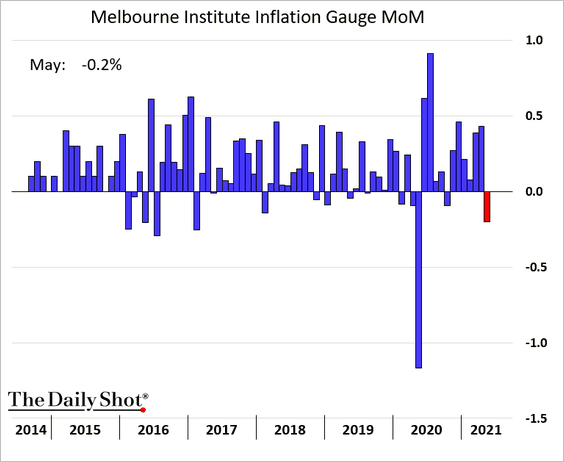
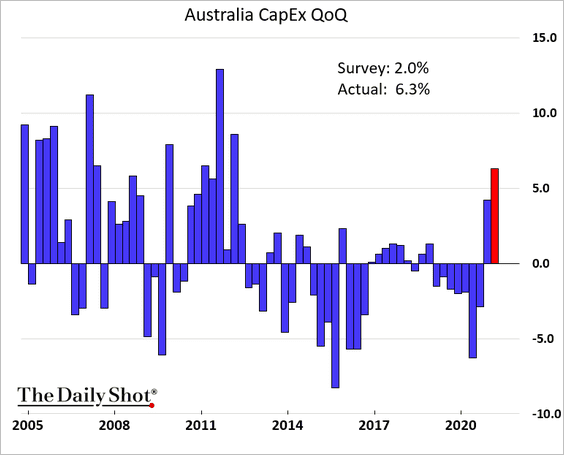
3. Next, we have some updates on Australia.
• Home price appreciation (very strong):
• Credit expansion (diverging trends):
• A pullback in inflation in May:
• Q1 CapEx (much stronger than expected):
——————–
4. Vaccinations are lagging in many Asian nations.
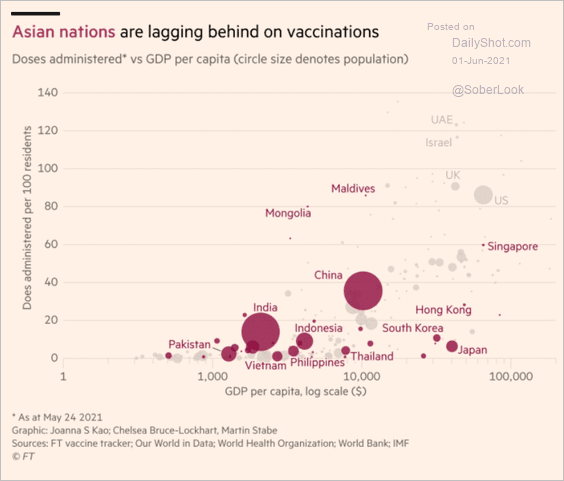 Source: @financialtimes Read full article
Back to Index
China
1. Beijing has lost patience with China’s strengthening currency.
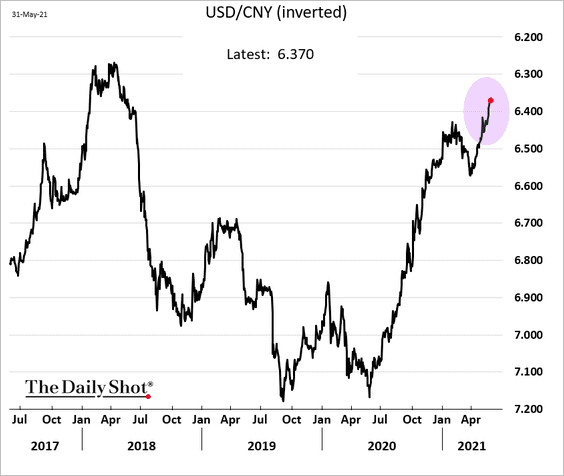
 Source: Reuters Read full article
——————–
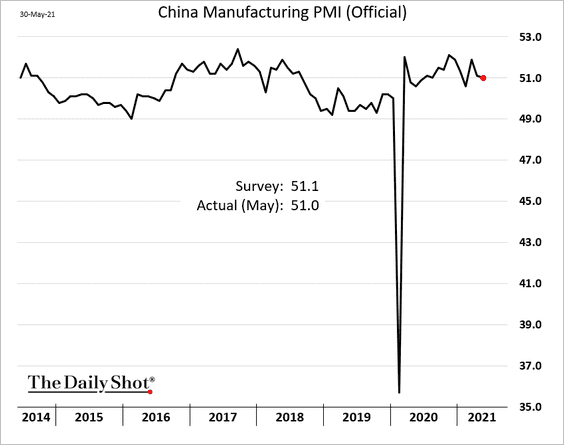
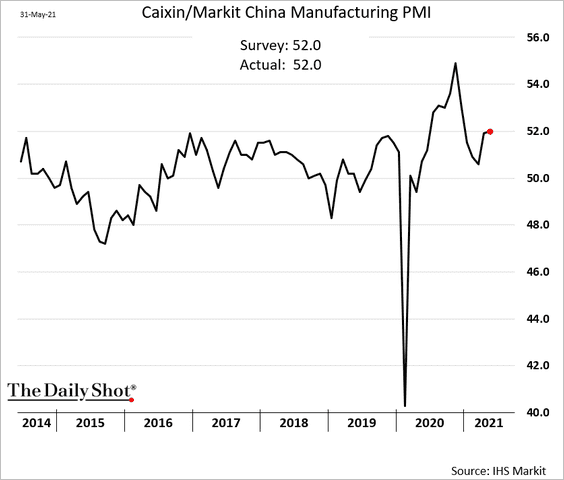
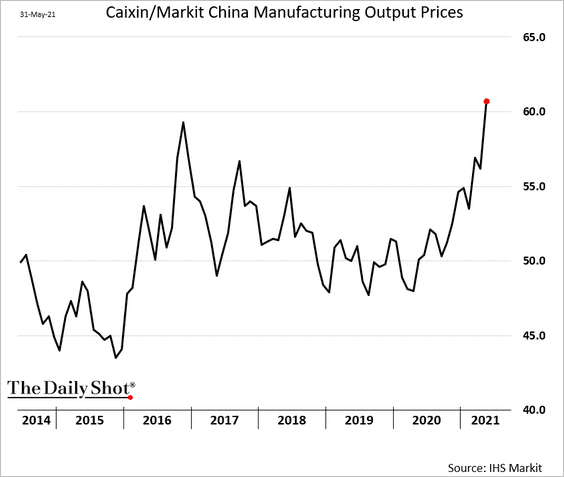
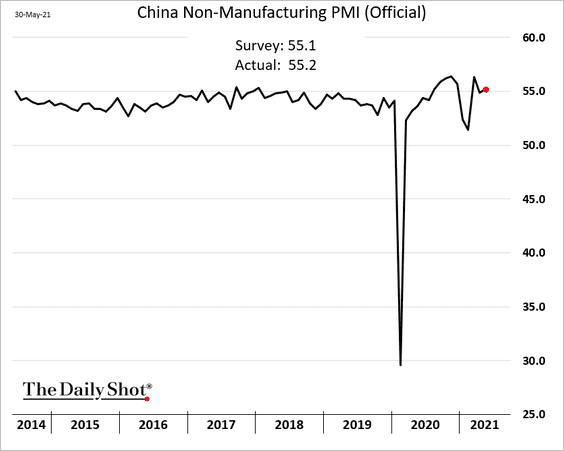
2. The May PMI manufacturing indicators were roughly in line with forecasts, showing modest expansion.
• Official manufacturing PMI:
• Markit PMI:
Manufacturers are boosting prices.
• Non-manufacturing activity remains robust.
——————–
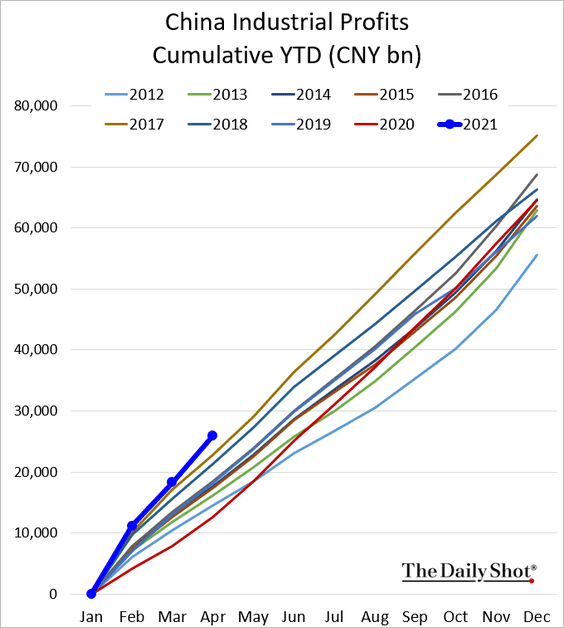
3. Industrial profits accelerated in April.
4. Huarong bonds have stabilized but are not rebounding.
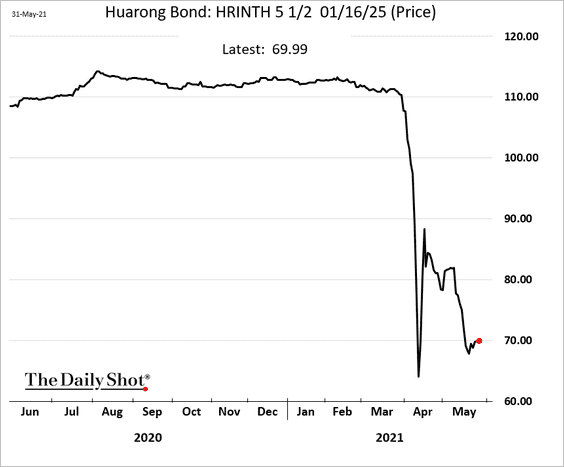
Huarong will need to refinance a massive amount of debt in November.
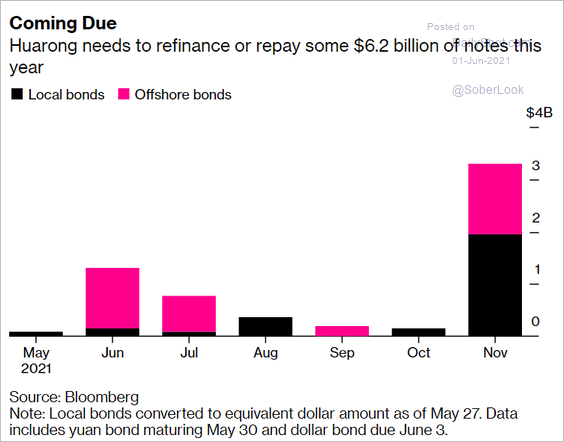 Source: Bloomberg Read full article
——————–
5. The amount of onshore bonds sold by LGFVs tumbled in April.
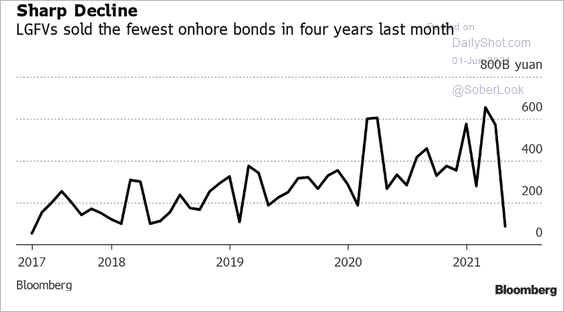 Source: @iverunoutofname Read full article
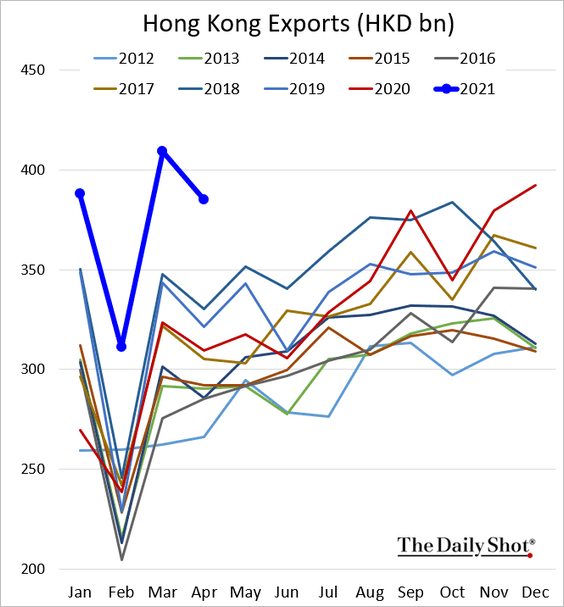
6. Hong Kong’s exports remain robust.
Back to Index
Emerging Markets
1. Let’s run through Asia’s manufacturing PMIs.
• India’s manufacturing growth stalled in May as the pandemic took its toll.
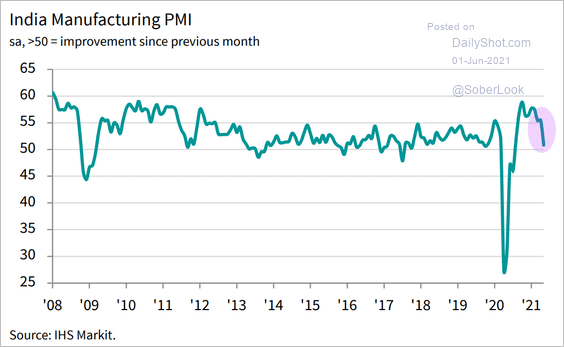 Source: IHS Markit
• Malaysia (growth slowed):
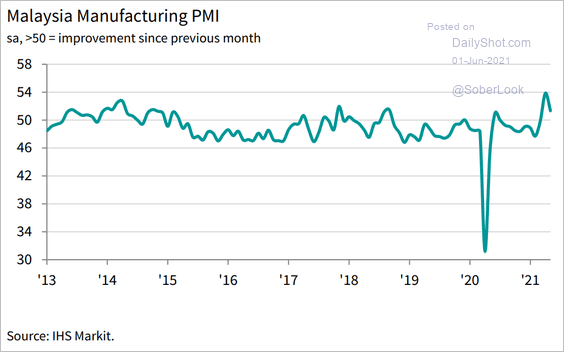 Source: IHS Markit
• The Philippines (no growth but stable activity):
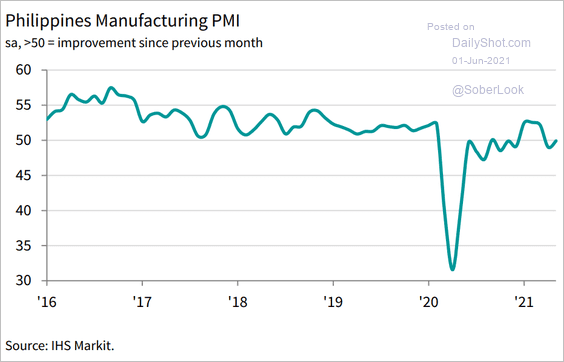 Source: IHS Markit
• Thailand (sharp deterioration):
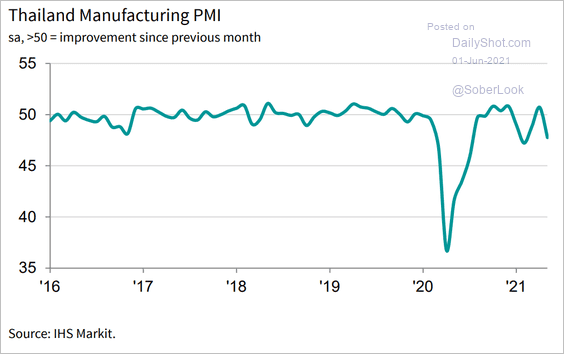 Source: IHS Markit
• Vietnam (growth slowed):
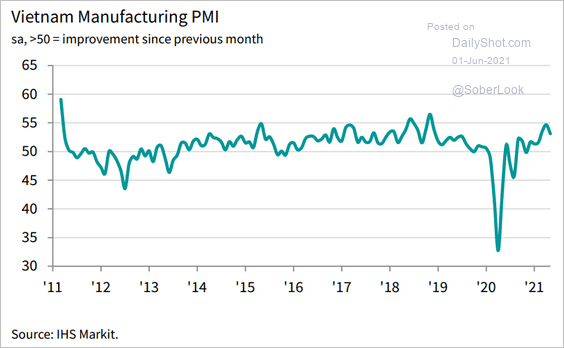 Source: IHS Markit
——————–
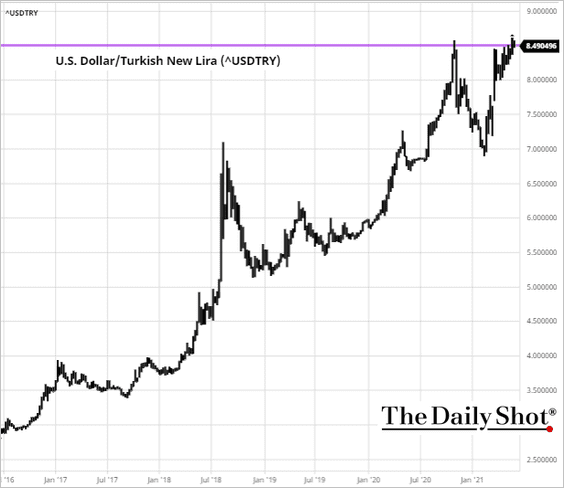
2. The Turkish lira is trading near record lows.
 Source: Reuters Read full article
 Source: barchart.com
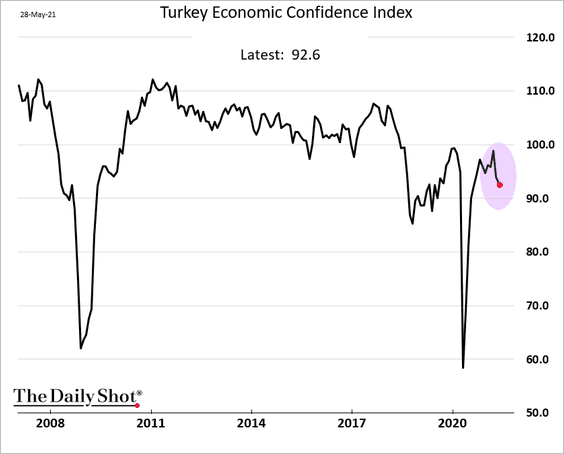
Turkey’s economic confidence has worsened.
——————–
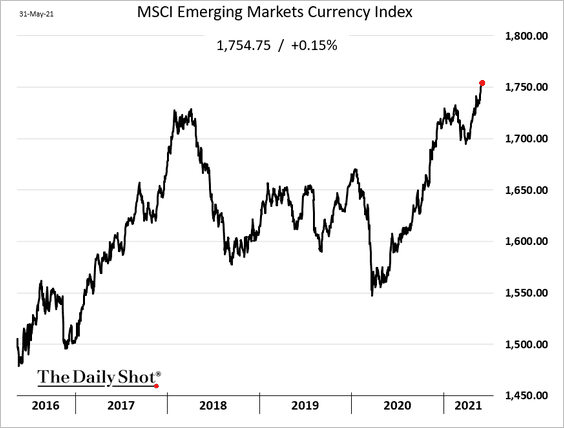
3. The MSCI EM Currency Index continues to grind higher (now at record).
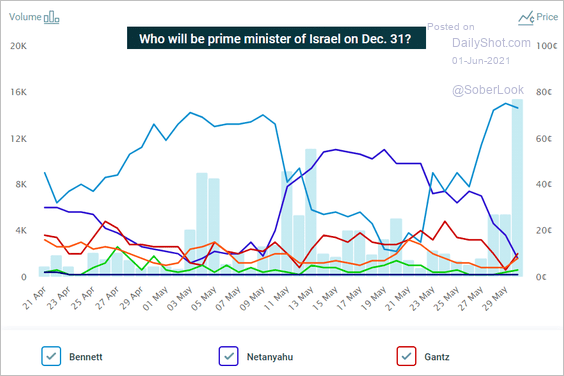
4. Benjamin Netanyahu’s odds of holding on to power have collapsed in the betting markets.
 Source: @PredictIt
 Source: @WSJ Read full article
Back to Index
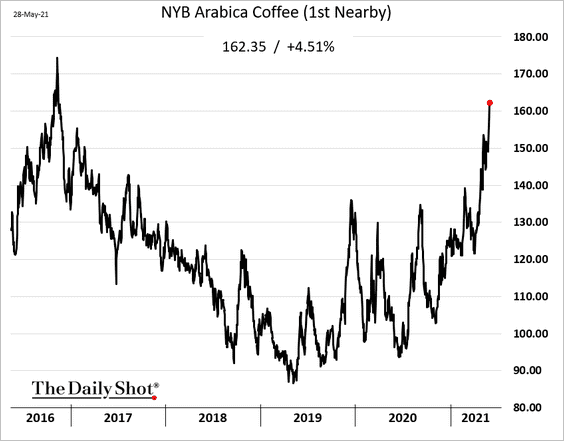
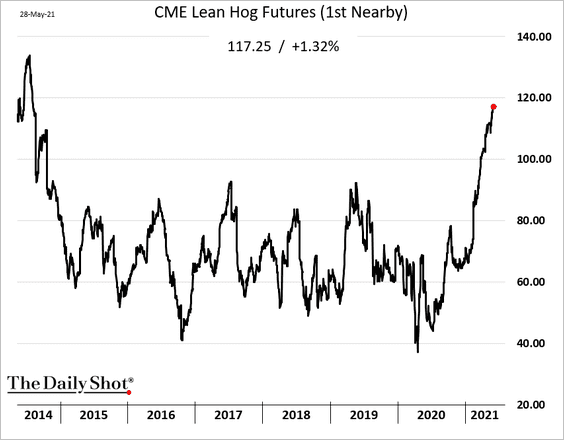
Commodities
Get ready to pay more for coffee and bacon.
Back to Index
Energy
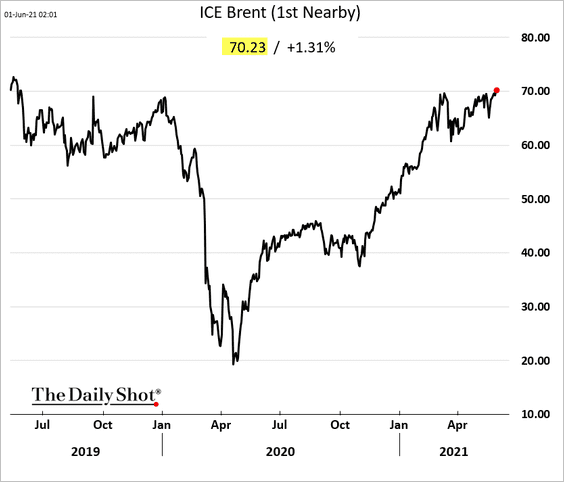
1. Brent is trading above $70/bbl.
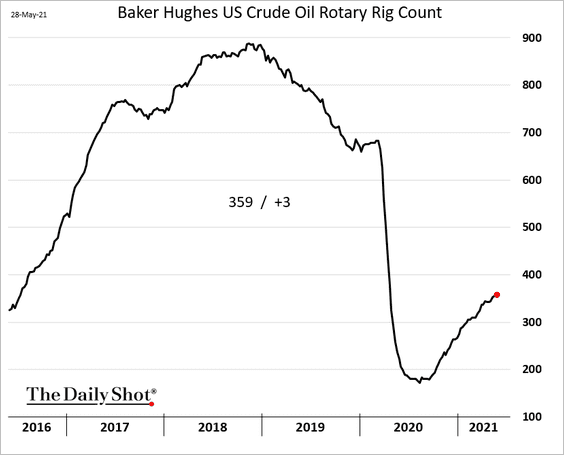
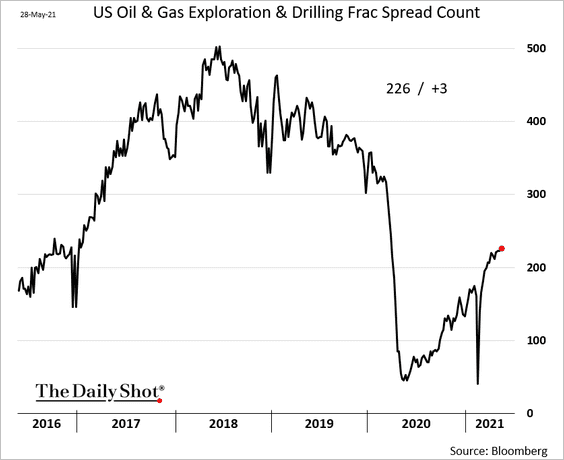
2. US rig count and frac spreads are grinding higher.
——————–
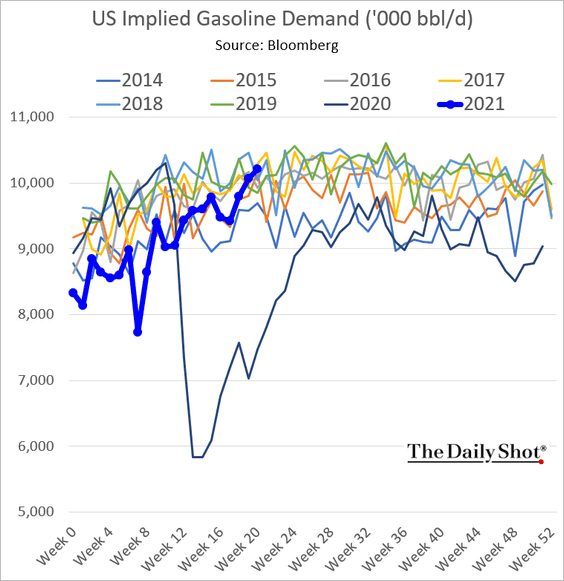
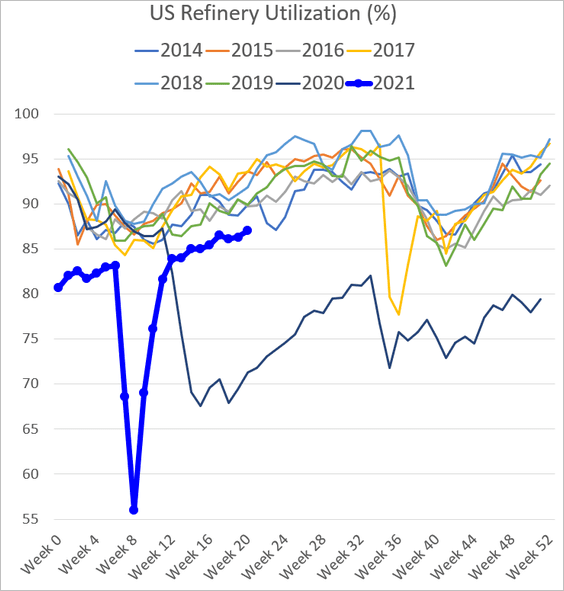
3. US gasoline demand is nearing multi-year highs, and refinery utilization continues to improve.
——————–
4. Who are the world’s biggest coal exporters?
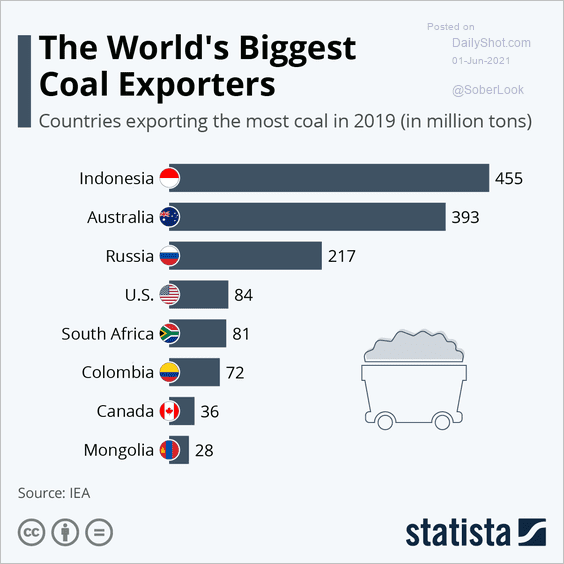 Source: Statista Read full article
Back to Index
Equities
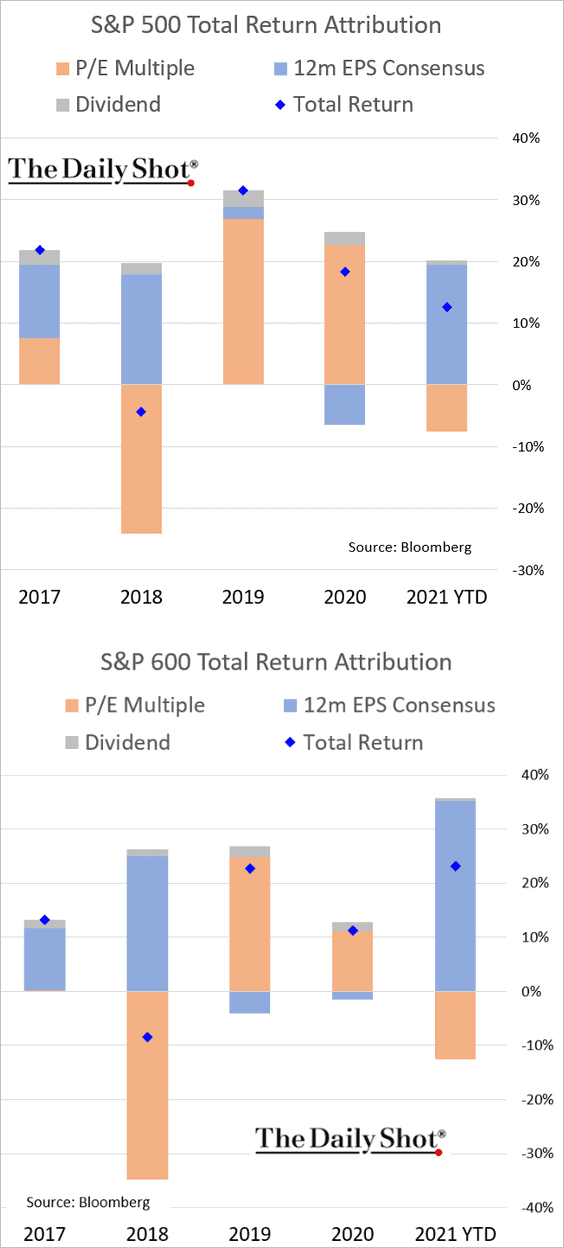
1. Let’s start with the updated year-to-date return attribution for the S&P 500 and S&P 600 (small caps).
2. Do high returns on equity justify US valuation premiums vs. the rest of the world?
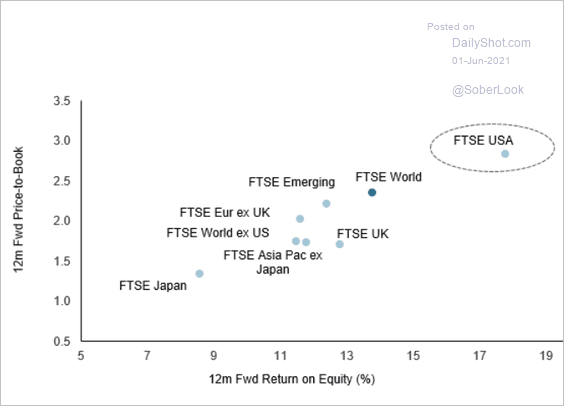 Source: FTSE Russell Read full article
3. Here are the drivers of returns during different market phases.
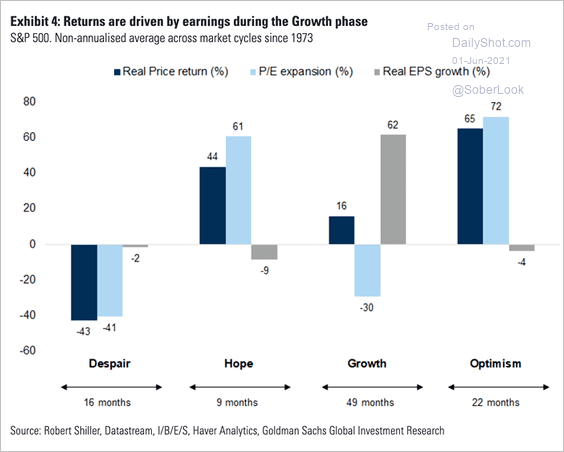 Source: @ISABELNET_SA, @GoldmanSachs
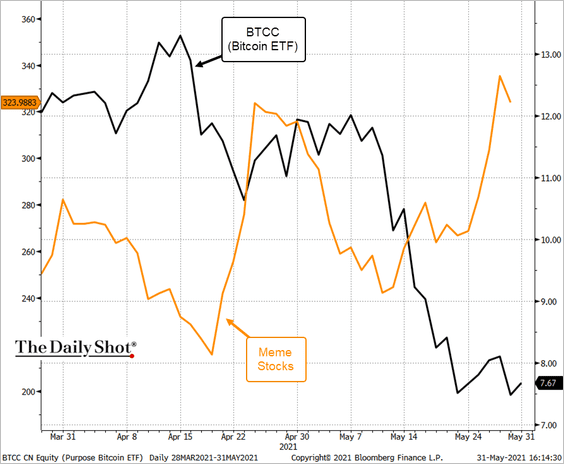
4. The Reddit crowd was back chasing their favorite stocks last week.

The trend may reverse if cryptos rebound.
——————–
5. There are a lot of bets against the ARK ETF family.
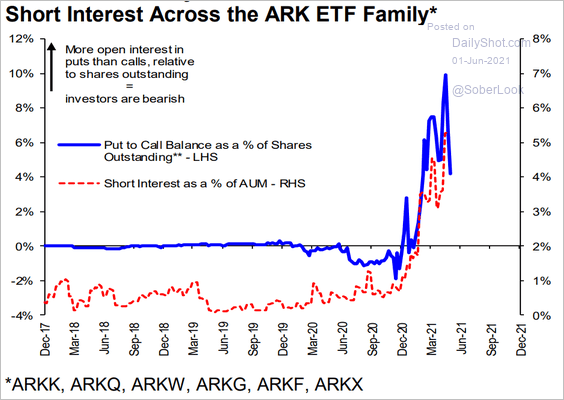 Source: Hugo Ste-Marie, Portfolio & Quantitative Strategy Global Equity Research, Scotia Capital
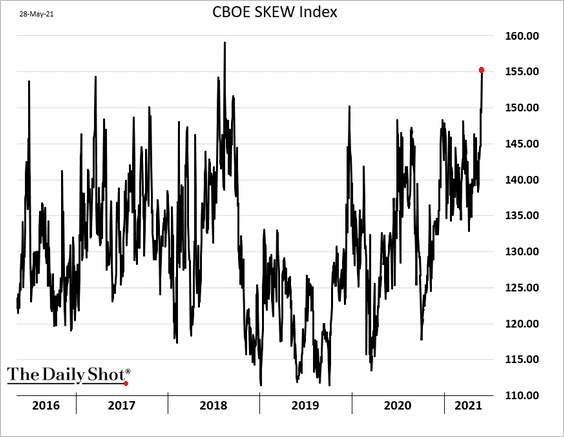
6. The CBOE’s skew indicator points to a growing demand for downside protection.
Back to Index
Credit
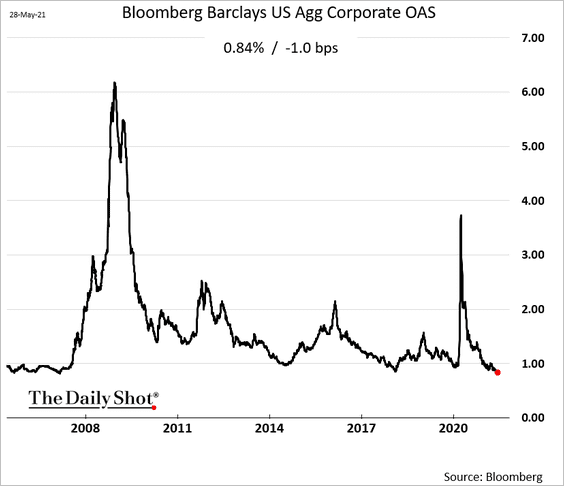
US investment-grade bond spreads are the tightest since 2007.
Back to Index
Rates
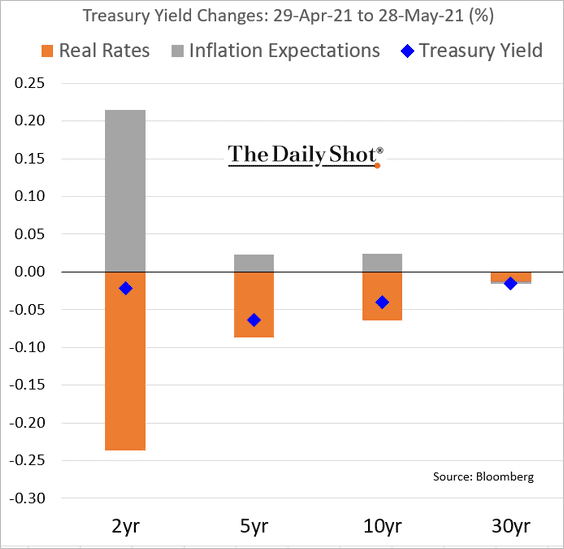
1. Real rates moved lower in May.
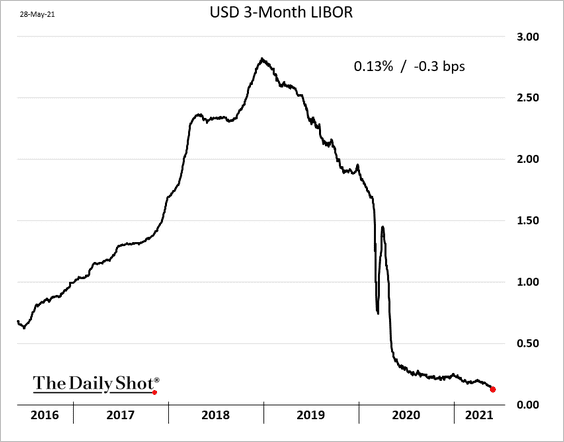
2. The 3-month LIBOR hit a record low.
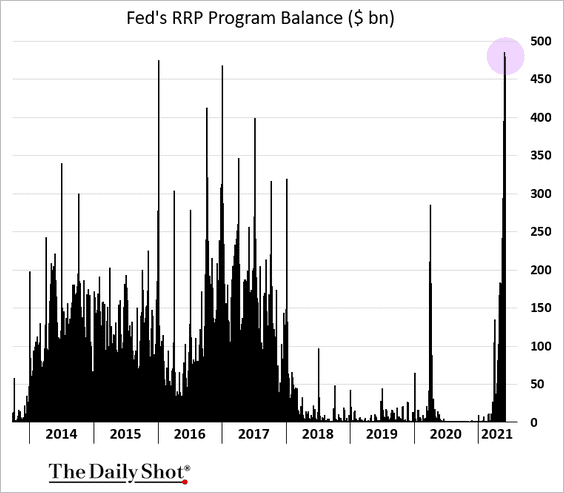
3. The Fed has taken in nearly half a trillion worth of deposits via RRP. This is providing some offset to the Treasury’s cutting its cash balances at the Fed.
Back to Index
Global Developments
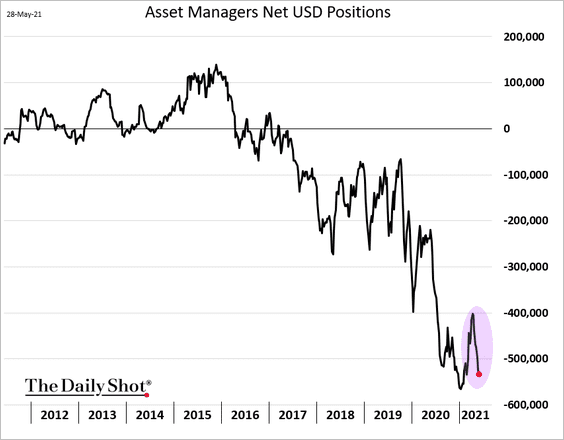
1. Asset managers are once again boosting their bets against the US dollar.
2. Higher US CPI relative to the rest of the world typically coincides with a weaker dollar (2 charts).
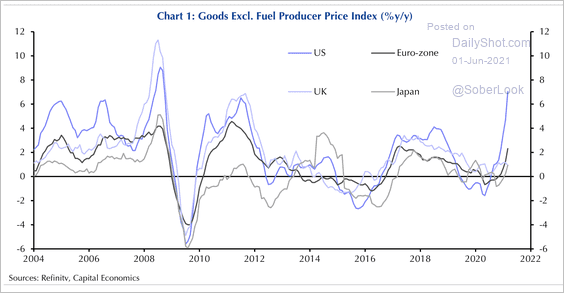 Source: Capital Economics
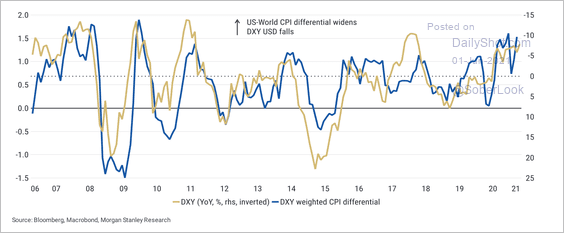 Source: Morgan Stanley Research
——————–
Food for Thought
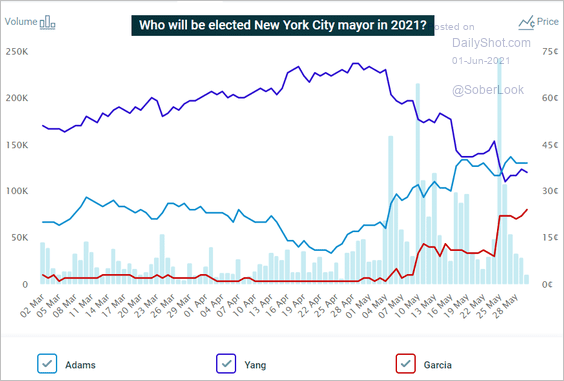
1. New York City mayoral election odds in the betting markets:
 Source: @PredictIt
2. Vaccination by community type:
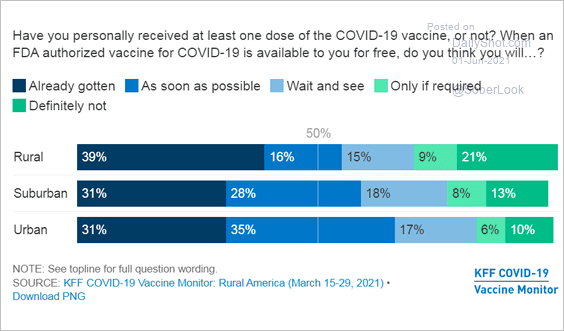 Source: KFF Read full article
3. US disability insurance recipients (year-over-year):
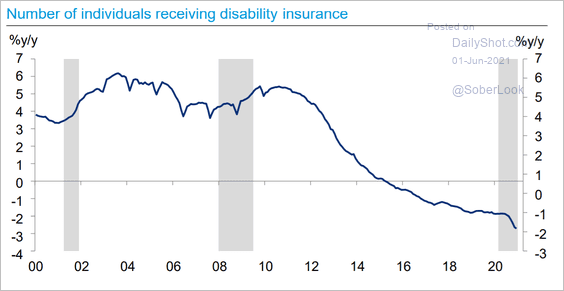 Source: Deutsche Bank Research
4. Trends in social science research publications:
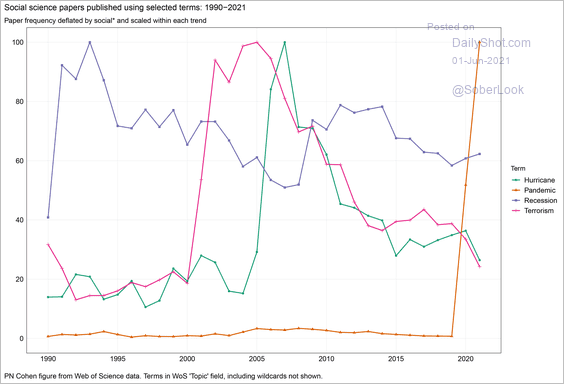 Source: @familyunequal
5. Solar panel production:
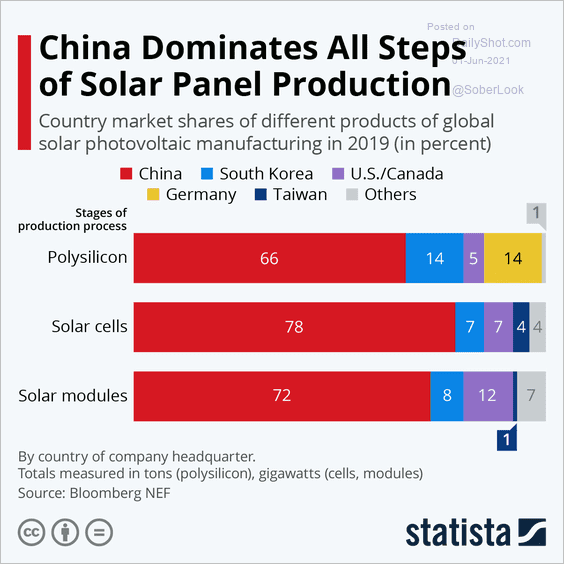 Source: Statista
6. The population in Israel and the occupied territories:
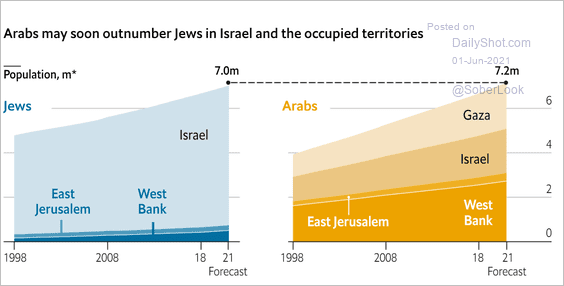 Source: The Economist Read full article
7. Prioritizing privacy legislation in the US:
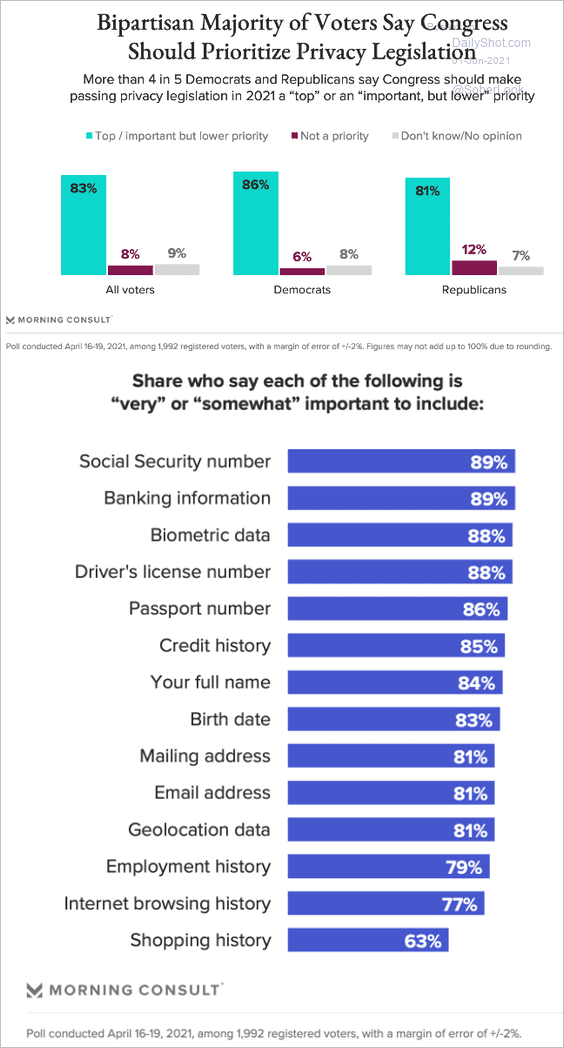 Source: Morning Consult Read full article
8. Amazon’s acquisitions over time:
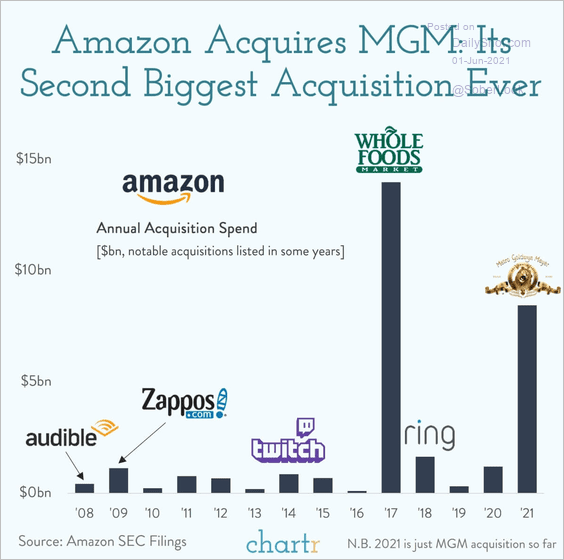 Source: @chartrdaily Read full article
9. The most popular fictional character from each state:
 Source: Matt Shirley/Sean Noyce, Playboy Further reading
——————–
Back to Index