
The Daily Shot: 02-Jun-21
• The United States
• Canada
• The United Kingdom
• The Eurozone
• Europe
• Asia – Pacific
• China
• Emerging Markets
• Commodities
• Energy
• Equities
• Credit
• Rates
• Food for Thought
The United States
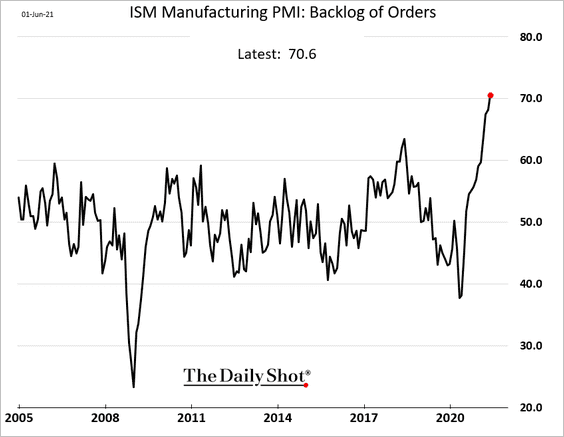
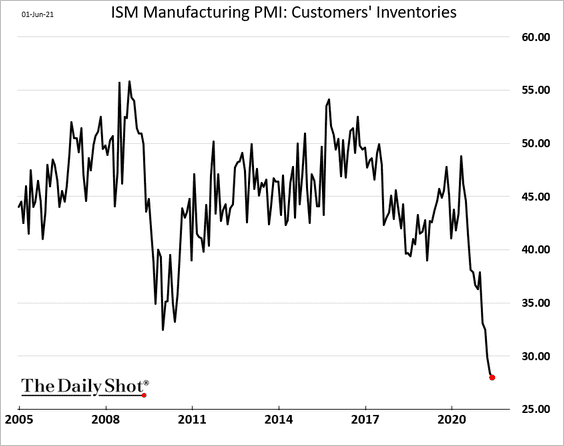
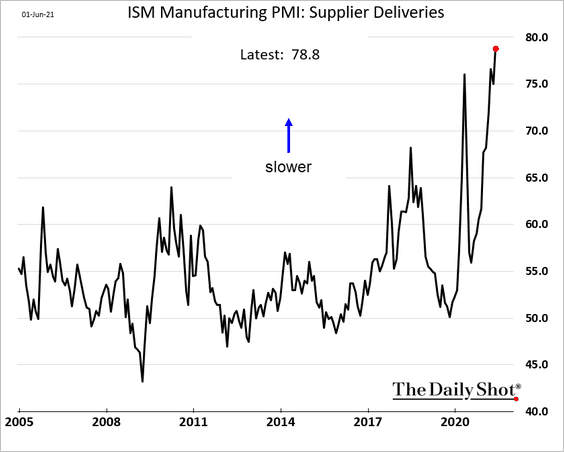
1. The ISM Manufacturing PMI continues to show rapid expansion in US factory activity.
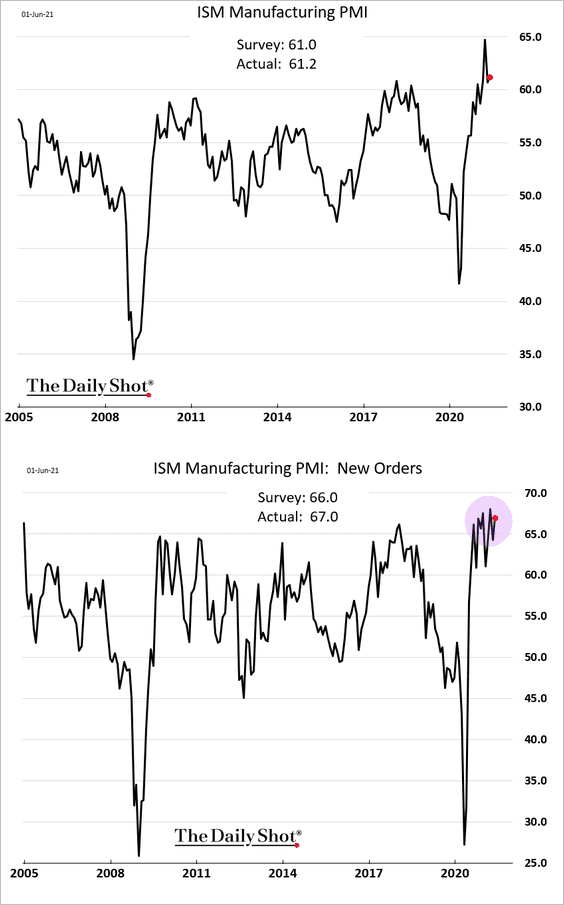
• US manufacturers are struggling to keep up …
… as customers’ inventories shrink.
• Factories face two headwinds.
– worsening supply-chain bottlenecks:
– worker shortages (creating a drag on hiring):
 Source: MarketWatch Read full article
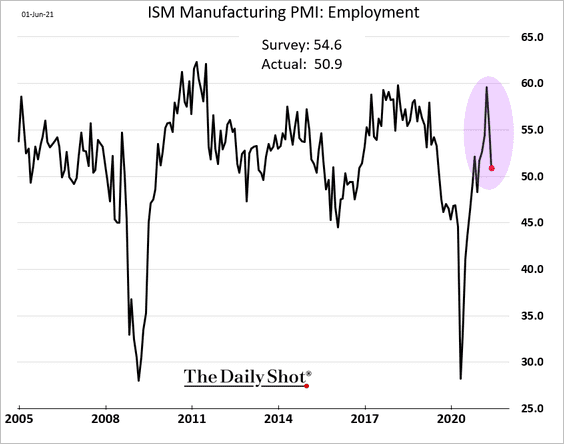
• As a result, production growth has been moderating.
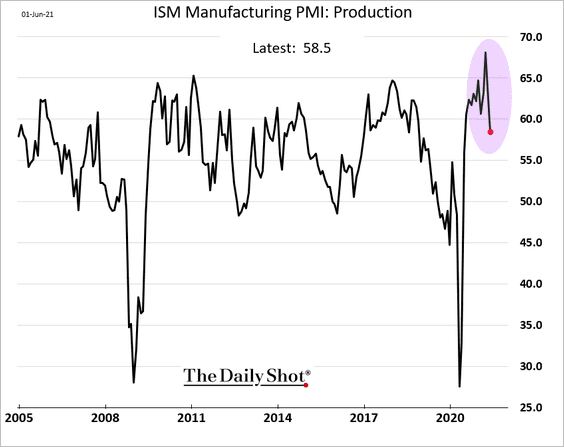
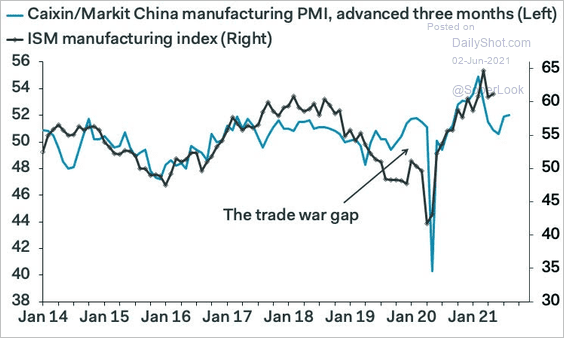
• Subdued manufacturing growth in China points to downside risks for the ISM Manufacturing PMI.
 Source: Pantheon Macroeconomics
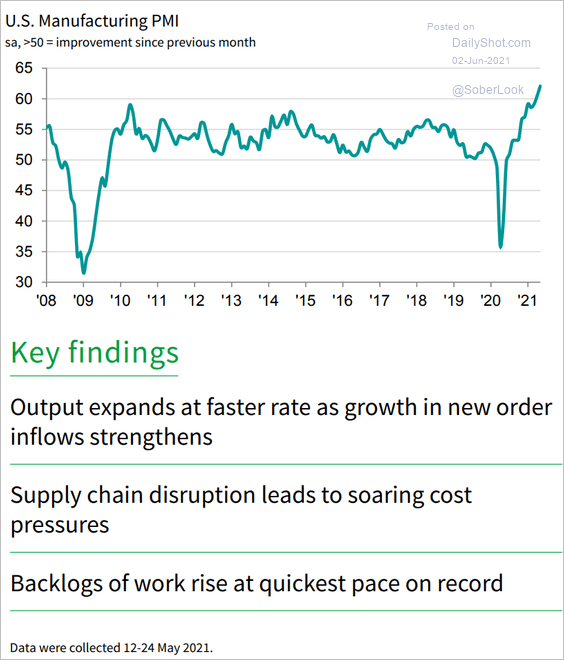
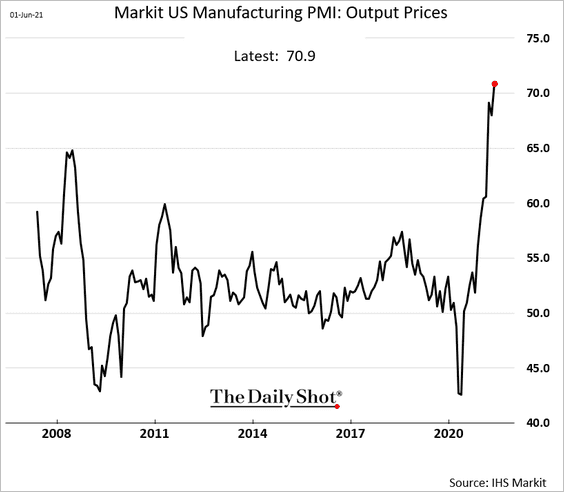
2. A similar manufacturing indicator from IHS Markit also shows tremendous growth, …
 Source: IHS Markit
… with manufacturers rapidly boosting output prices.
——————–
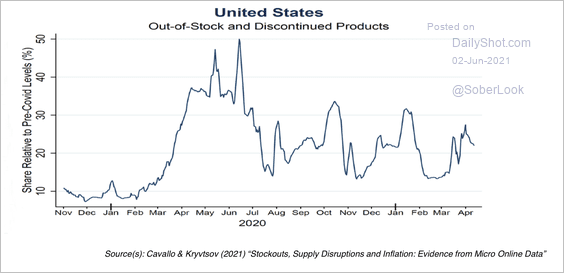
2. Out-of-stock or discontinued items remain about 20% higher than pre-pandemic levels. This is due to many sectors experiencing shortages of materials and labor.
 Source: III Capital Management
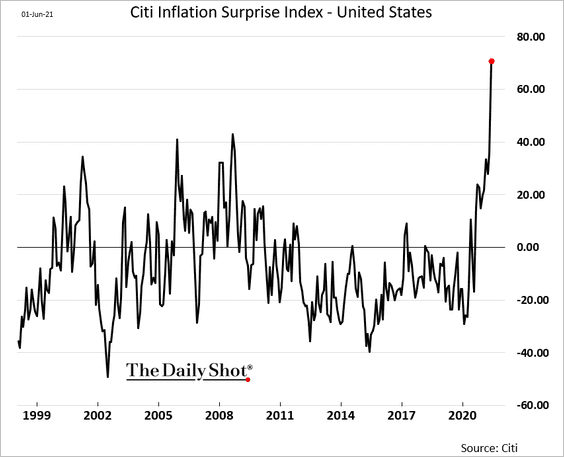
3. Next, we have some updates on inflation.
• Economists were surprised by the intensity of the pandemic recovery price gains. The Citi Inflation Surprise Index hit a record high.
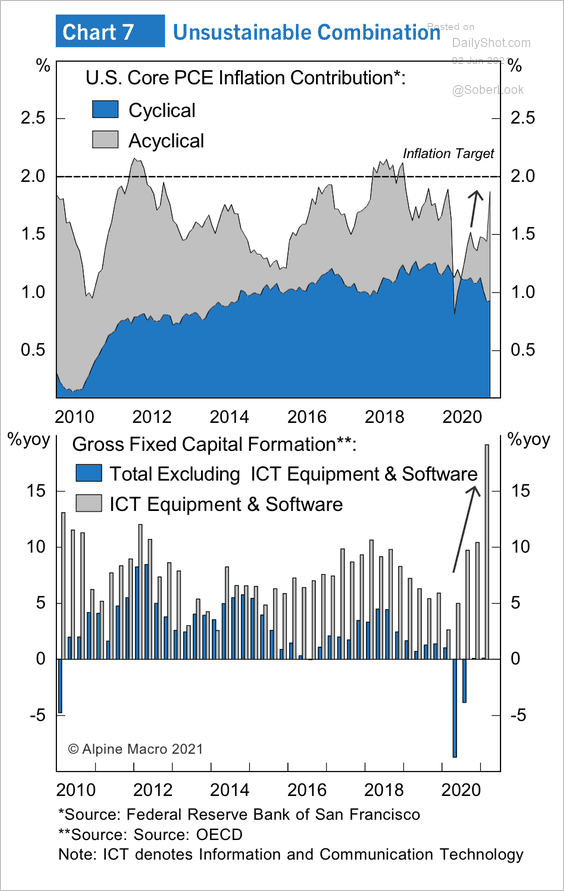
• The component of core PCE inflation that does not correlate with the business cycle is rising sharply.
 Source: Alpine Macro
• US inflation spiked after WW-II but subsided within a couple of years. Should we expect a similar pattern in the current cycle?
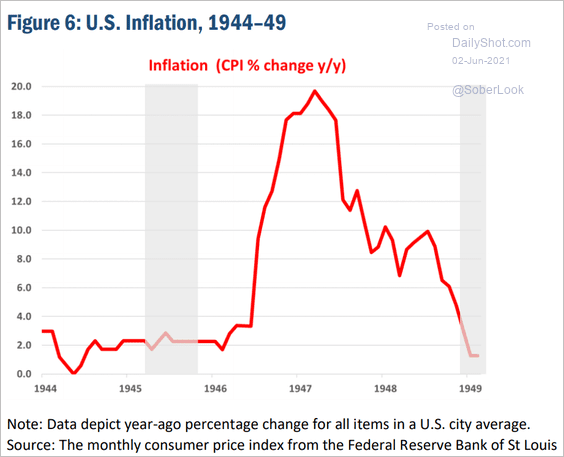 Source: Atlanta Fed
• A majority of inflation gains in the April CPI report came from flexible prices, not sticky prices, which tend to move more slowly.
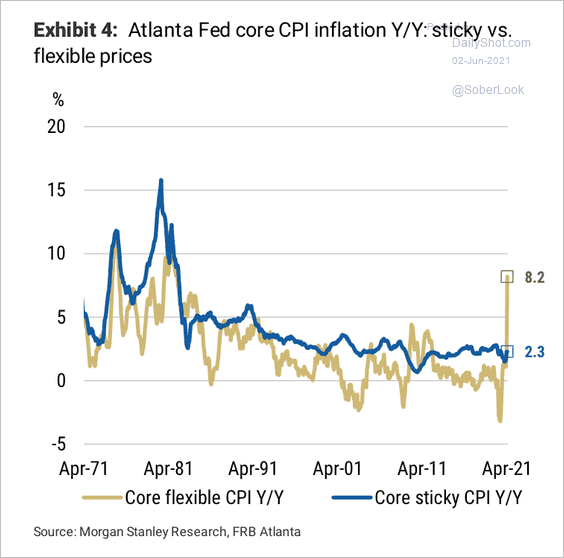 Source: Morgan Stanley Research
• The Fed has been taking comfort in inflation expectations being “well-anchored.”
– Consumer inflation expectations (short-term vs. long-term):
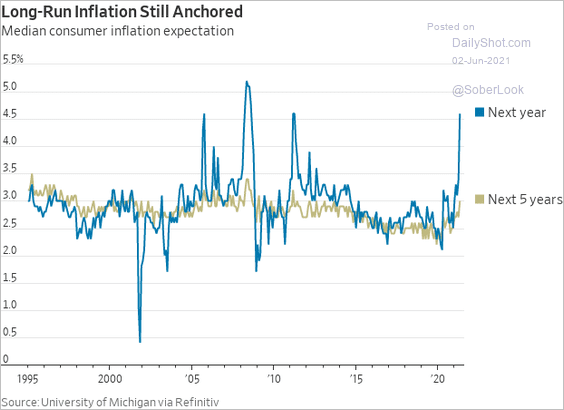 Source: @WSJ Read full article
– Market-based inflation expectations (short-term vs. long-term):
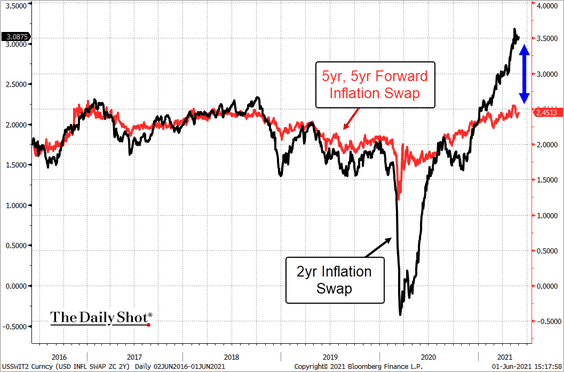 Source: @TheTerminal, Bloomberg Finance L.P.
——————–
4. Small business data from Homebase point to an ongoing recovery in the labor market.
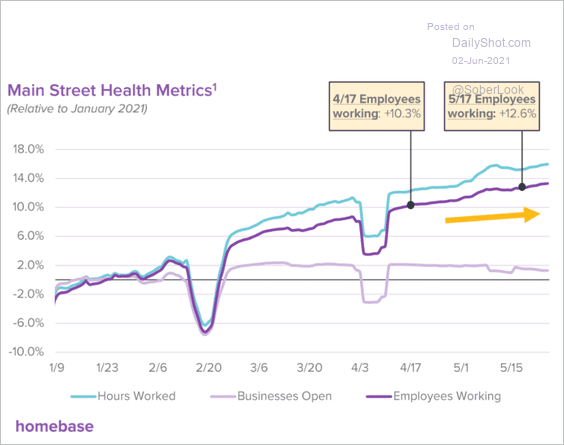 Source: Homebase
5. High-frequency indicators continue to improve.
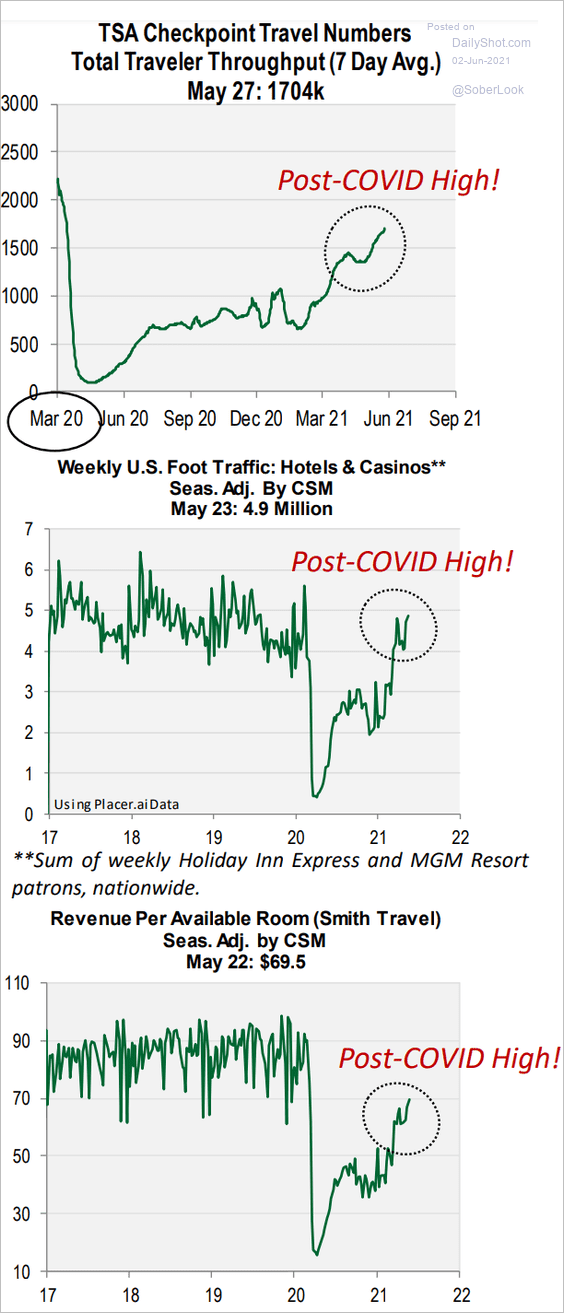 Source: Cornerstone Macro
Back to Index
Canada
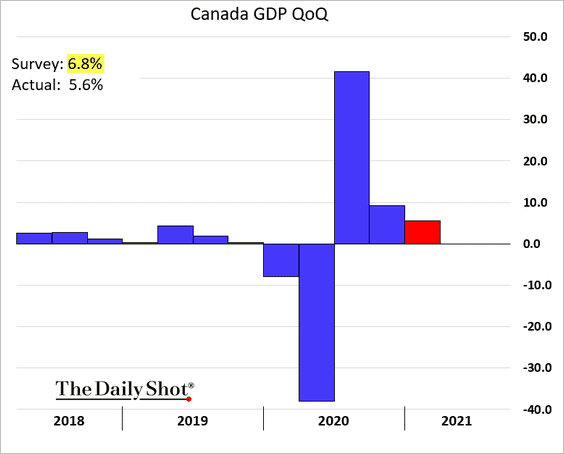
1. Economic activity expanded quickly in March, …
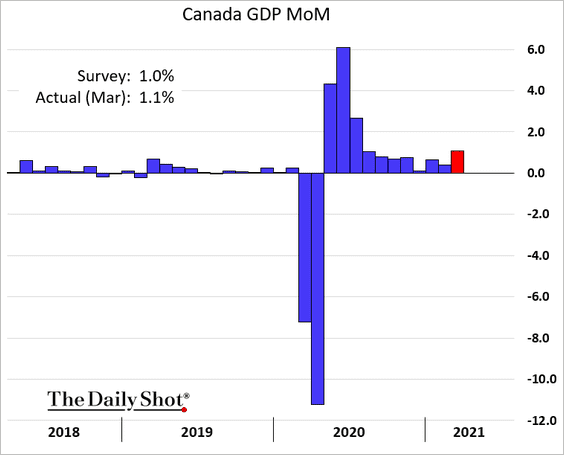
… but the GDP growth for Q1 was disappointing (vs. expectations).
——————–
2. Factory activity remains robust, but Canada’s manufacturers face the same issues as US peers.
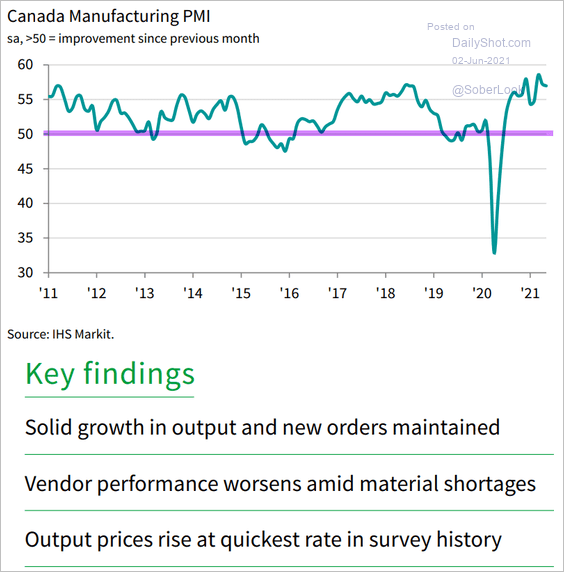 Source: IHS Markit
3. Unlike the US, Canada did not experience a spike in mortgage delinquencies during the pandemic.
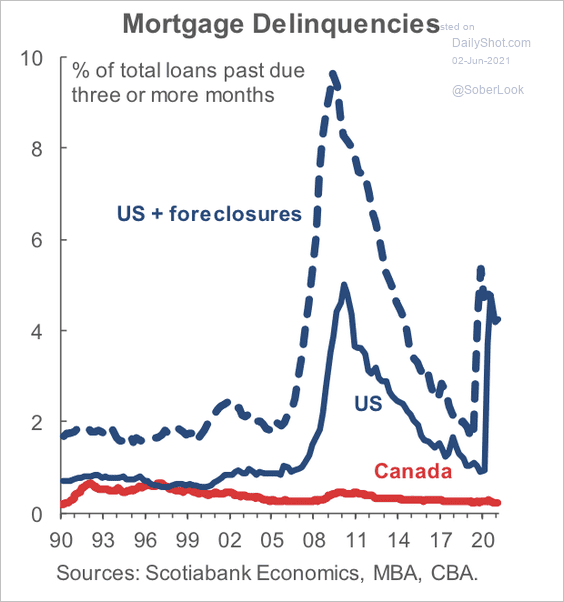 Source: Scotiabank Economics
4. Mortgage spreads have been somewhat stable over the past year.
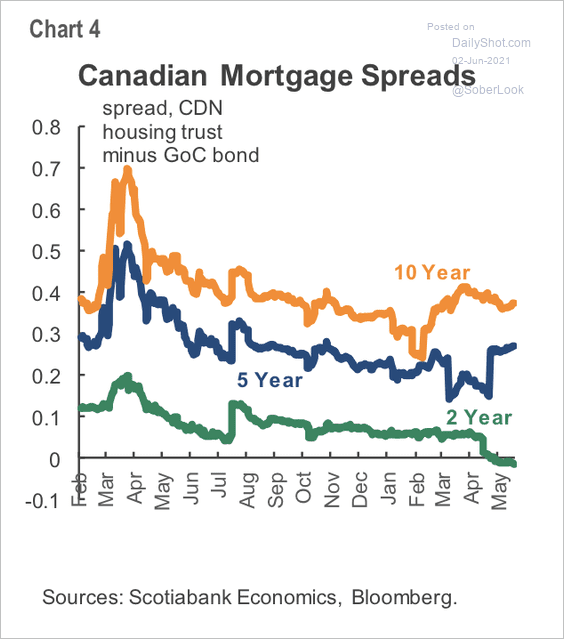 Source: Scotiabank Economics
5. Home prices are still exploding relative to incomes.
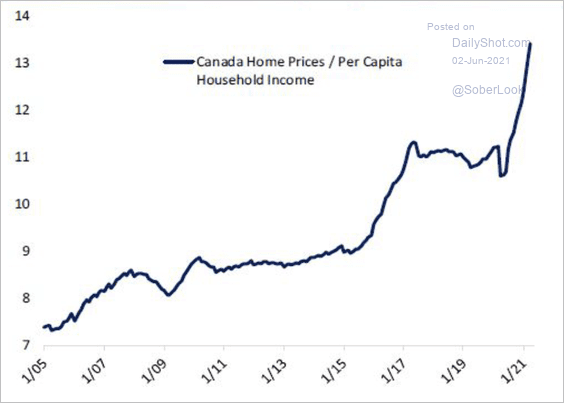 Source: Bespoke Investments
Back to Index
The United Kingdom
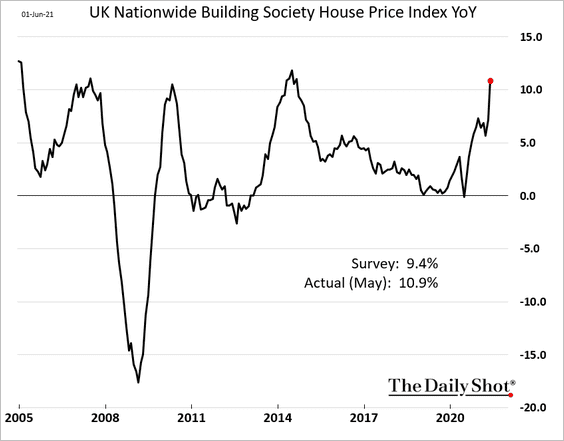
1. Home prices were up over 10% in May (relative to May of 2020).
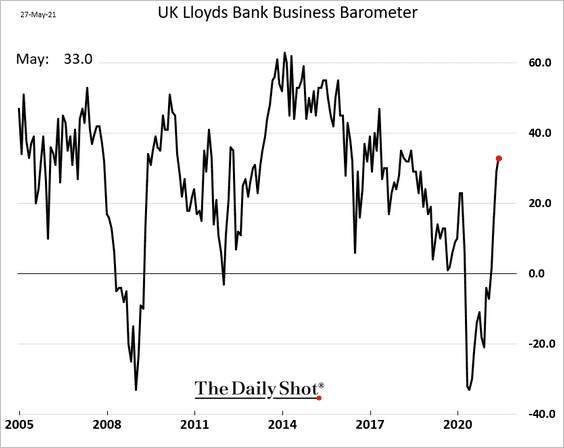
2. Business sentiment continues to rebound and is now well above pre-COVID levels.
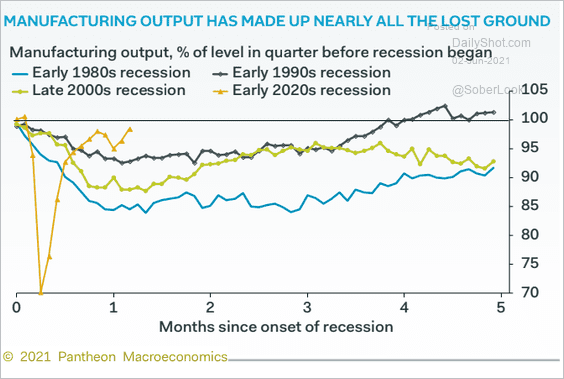
3. Manufacturing output has almost fully recovered.
 Source: Pantheon Macroeconomics
4. Factory activity grew rapidly in May, …
 Source: IHS Markit
… and output price hikes point to a sharp rise in the PPI.
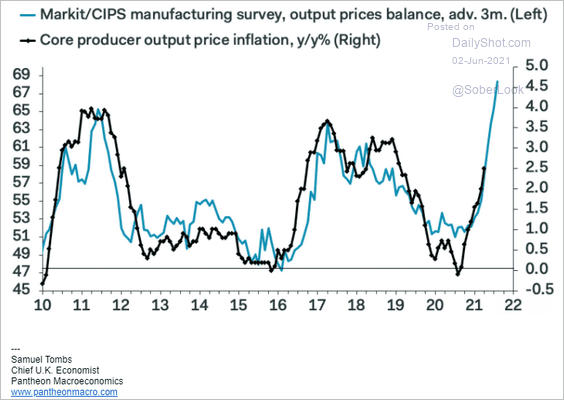 Source: Pantheon Macroeconomics
——————–
5. Public transportation costs have risen massively over the past decade.
![]() Source: Statista
Source: Statista
Back to Index
The Eurozone
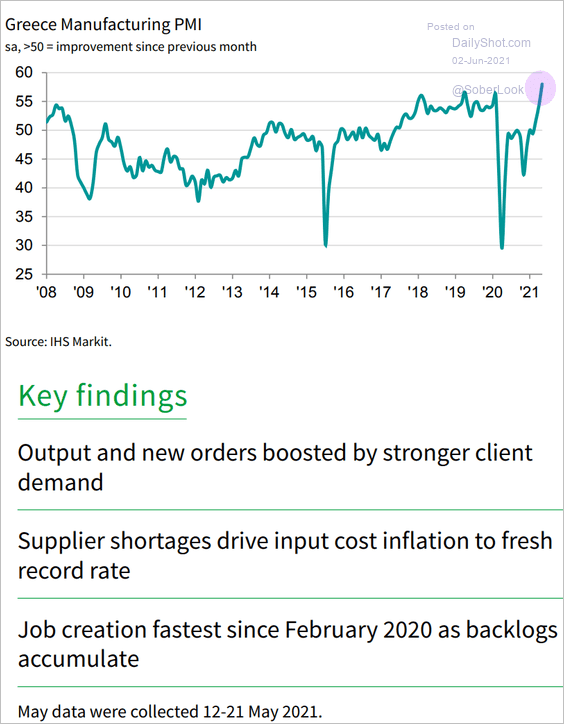
1. Manufacturing growth has been exceptional, but supply-chain bottlenecks have intensified.
• Spain:
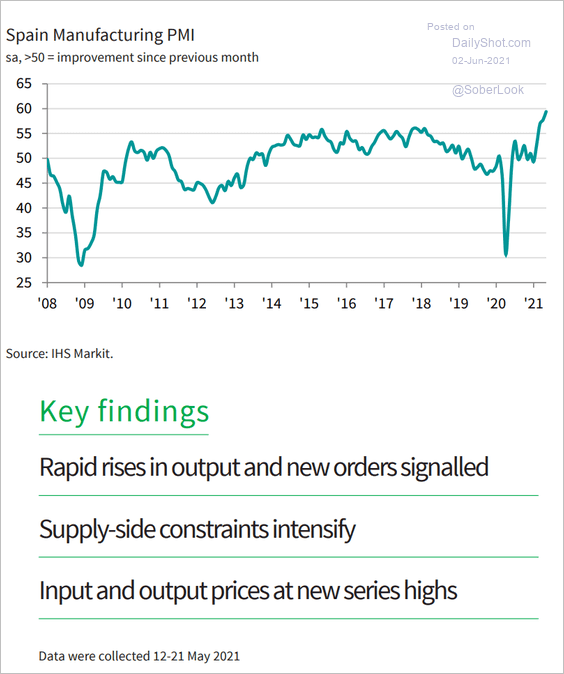 Source: IHS Markit
• Italy:
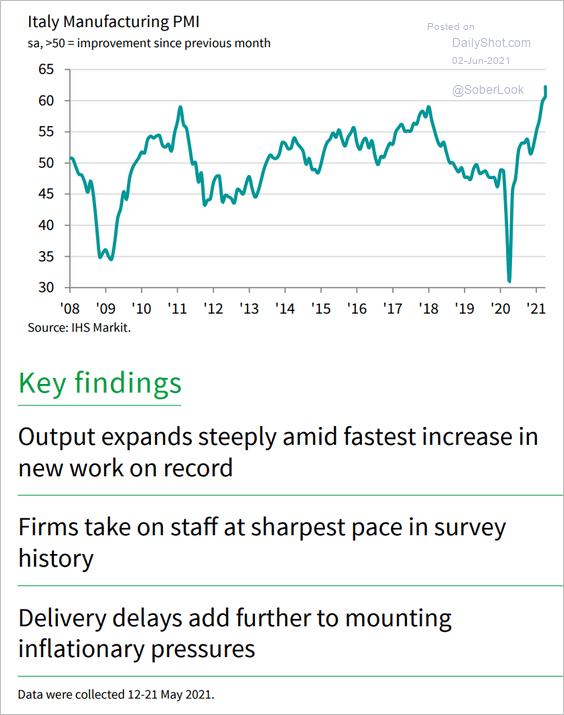 Source: IHS Markit
• The Eurozone:
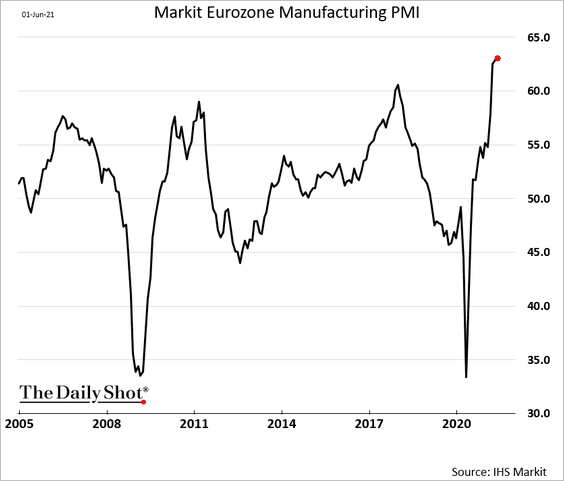
Given slower growth in China, the euro area’s factory activity expansion is about to peak.
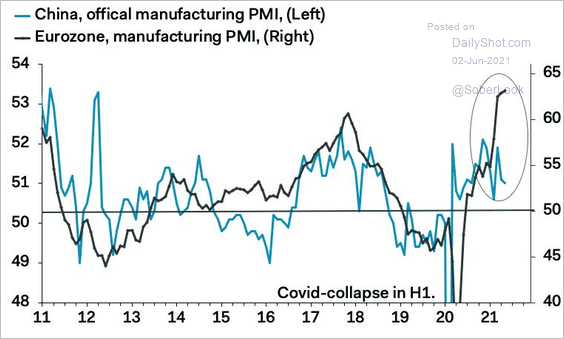 Source: Pantheon Macroeconomics
——————–
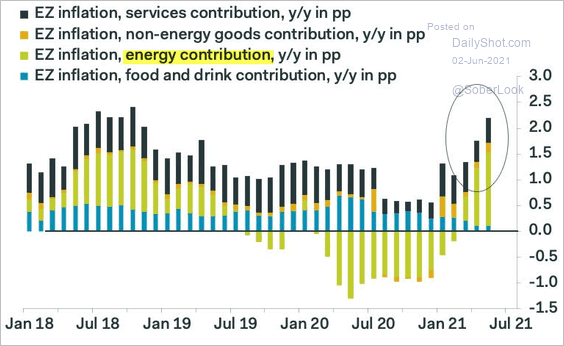
2. The Eurozone’s core CPI is still below 1%.
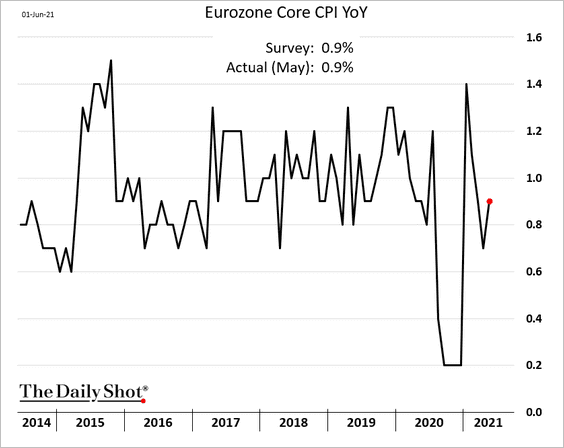
• Energy drove most of the year-over-year increases in the headline CPI.
 Source: Pantheon Macroeconomics
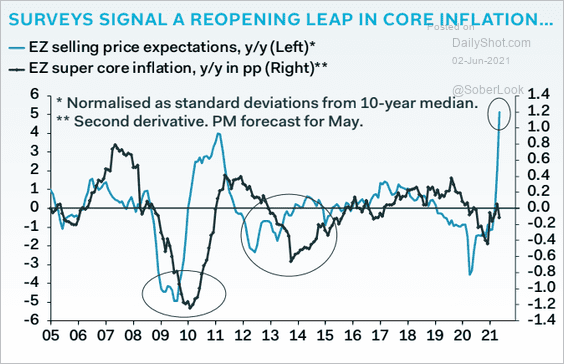
• Businesses expect sharp gains in output prices, which points to higher consumer inflation ahead.
 Source: Pantheon Macroeconomics
——————–
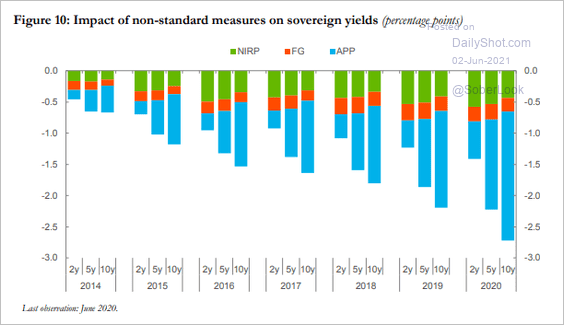
3. The ECB estimates that negative rates, the central bank’s forward guidance, and QE depressed bond yields by more than 250 bps.
 Source: @fwred
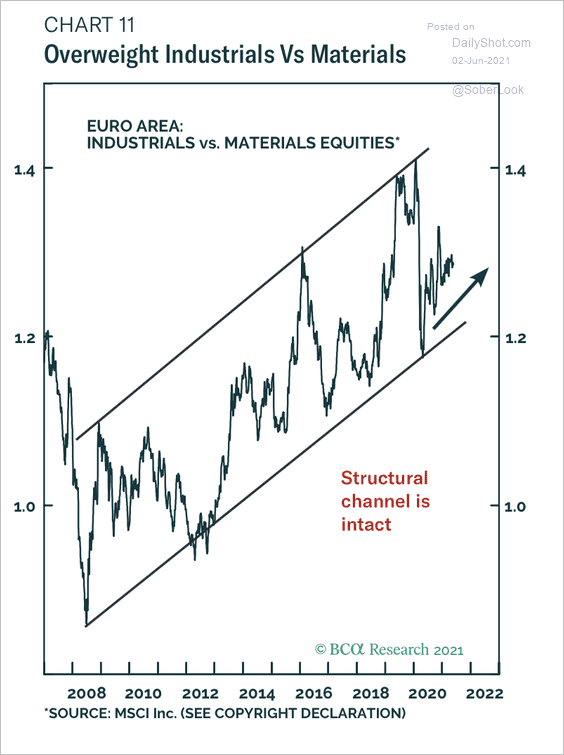
4. European industrial stocks have been outperforming materials since the financial crisis low.
 Source: BCA Research
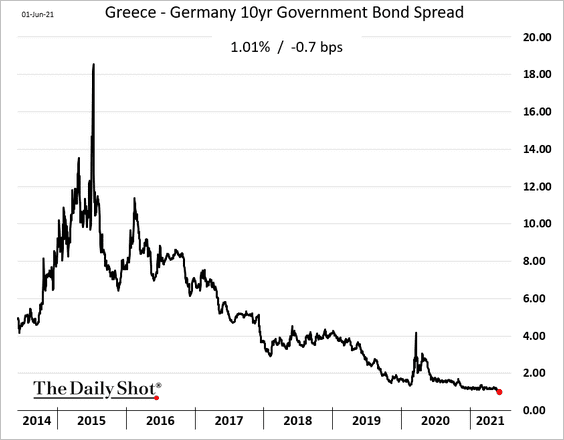
5. Greek bond spreads over Germany hit a record low.
Back to Index
Europe
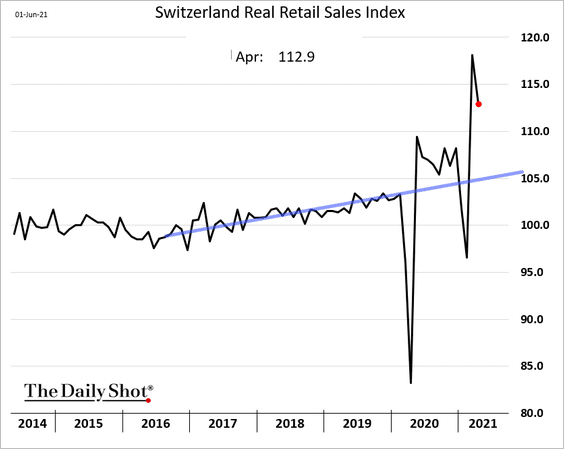
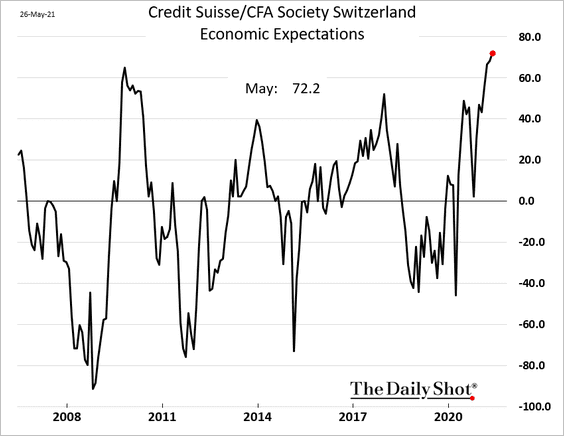
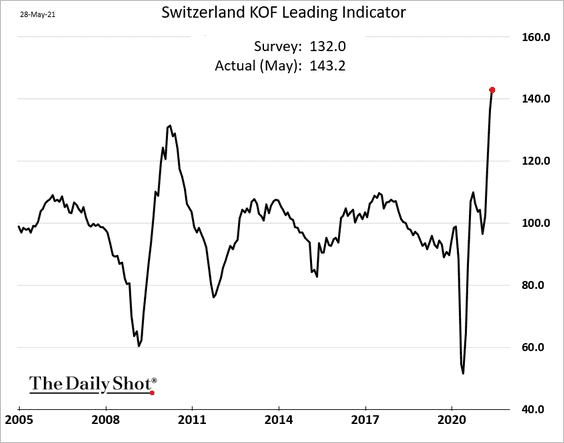
1. The Swiss economy is roaring back.
• Retail sales:
• Economic expectations:
• The leading index:
——————–
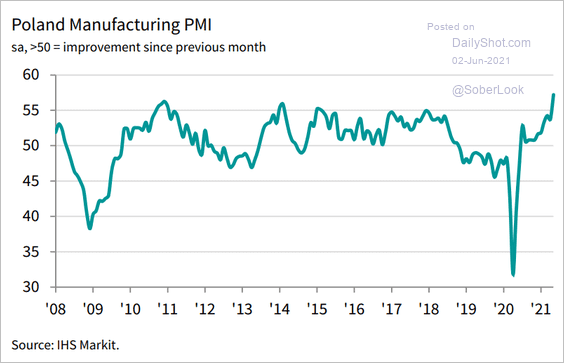
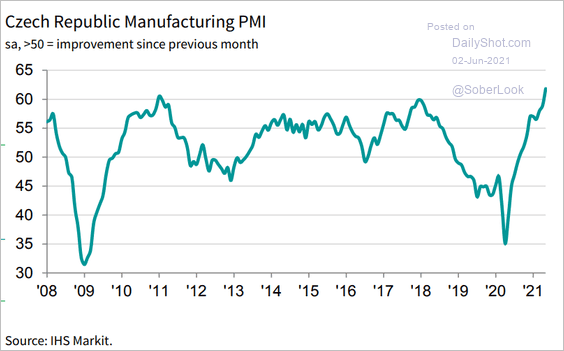
2. Central Europe’s factory activity is surging.
• Poland:
 Source: IHS Markit
• The Czech Republic:
 Source: IHS Markit
——————–
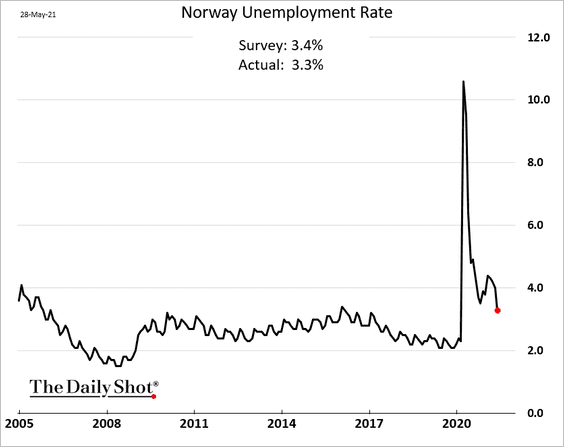
3. Norway’s unemployment rate continues to moderate.
Is USD/NOK set for another down cycle?
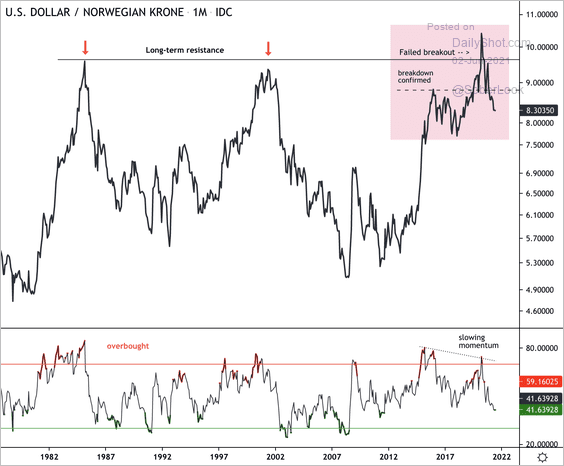 Source: Dantes Outlook
——————–
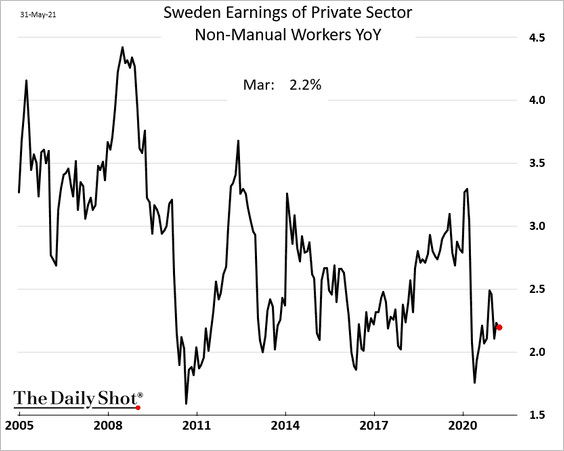
4. Sweden’s wage growth has not rebounded to pre-COVID levels.
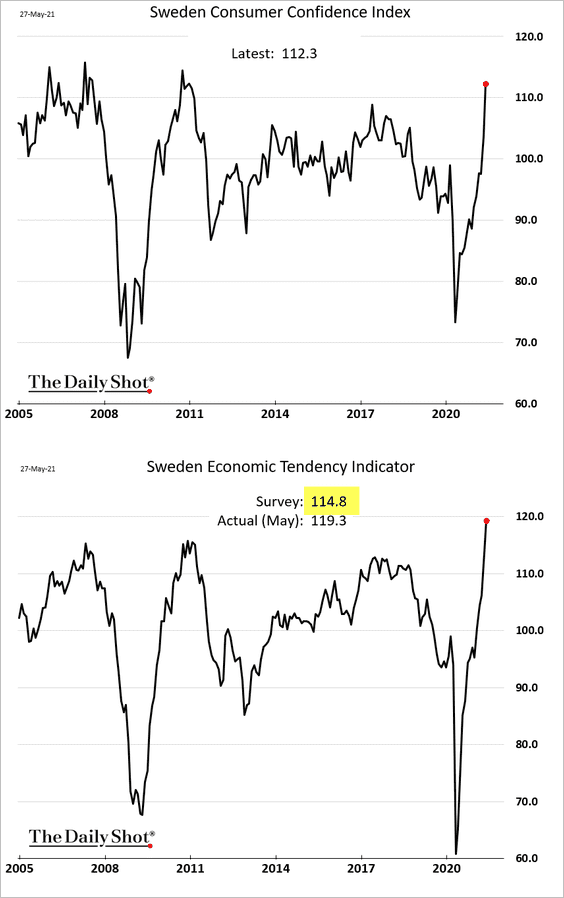
But consumer sentiment is soaring.
——————–
5. This chart shows electricity prices vs. wind and solar penetration.
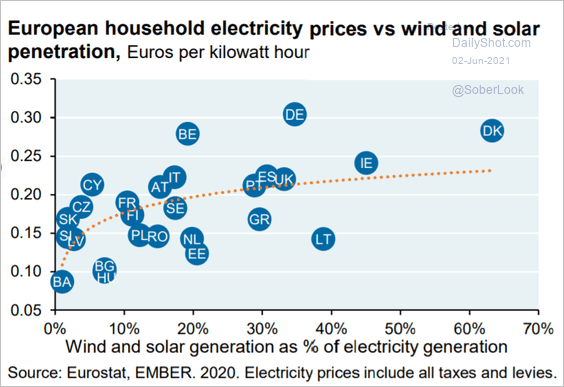 Source: J.P. Morgan Asset Management
6. Equity derivatives activity (used to leverage equity positions) has been on the rise.
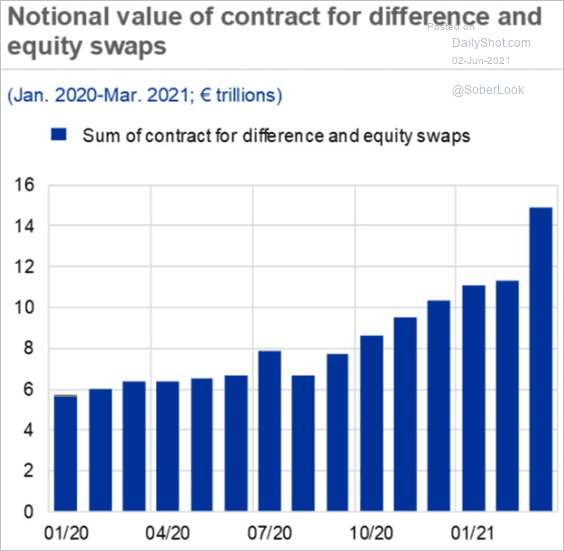 Source: ECB, Bloomberg Read full article
Back to Index
Asia – Pacific
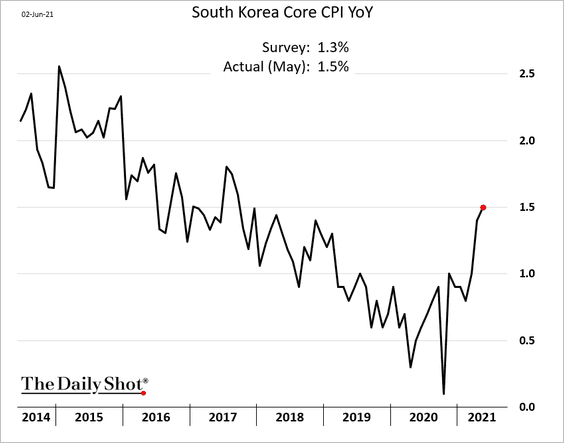
1. South Korea’s inflation was firmer than expected in May.
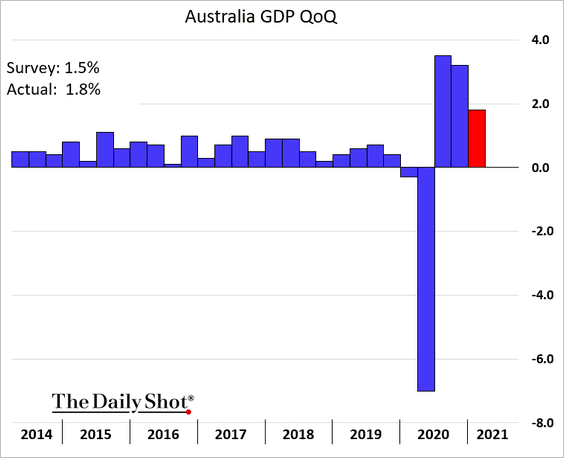
2. Australia’s first-quarter GDP growth exceeded economists’ forecasts.
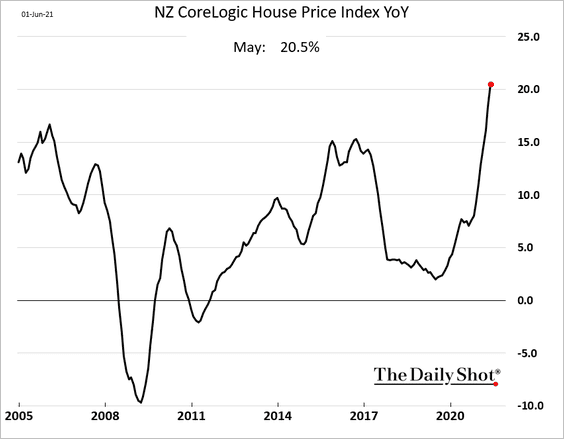
3. New Zealand’s home price appreciation topped 20% in May.
Back to Index
China
1. Smaller growth stocks (ChiNext) have been outperforming large caps.
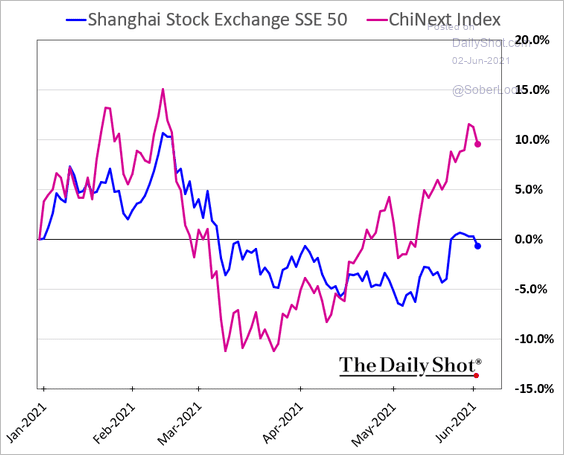 h/t John Liu
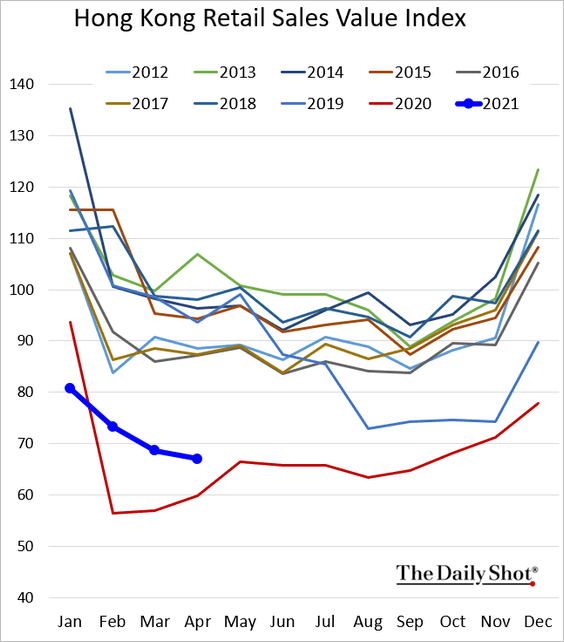
2. Hong Kong’s retail sales remain depressed – well below forecasts.
Back to Index
Emerging Markets
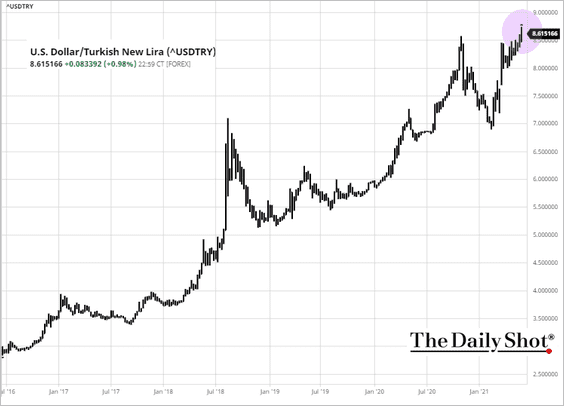
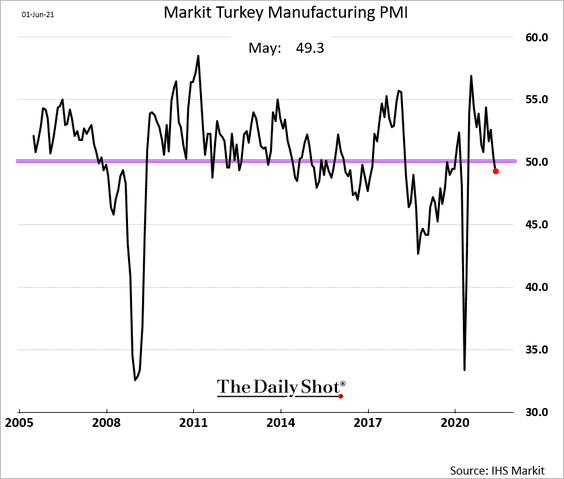
1. The Turkish lira hit a record low.
 Source: @markets Read full article
 Source: barchart.com
Turkey’s manufacturing activity contracted in May.
——————–
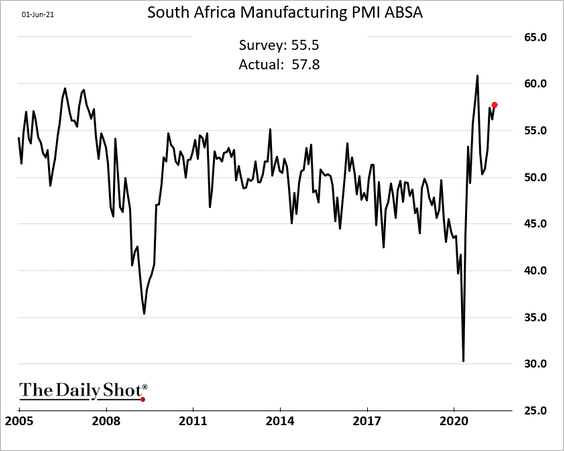
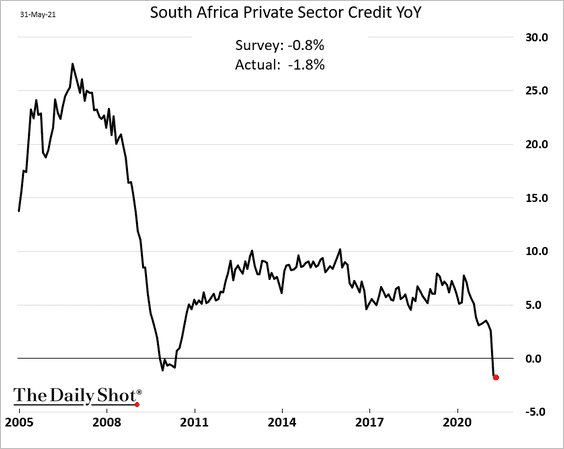
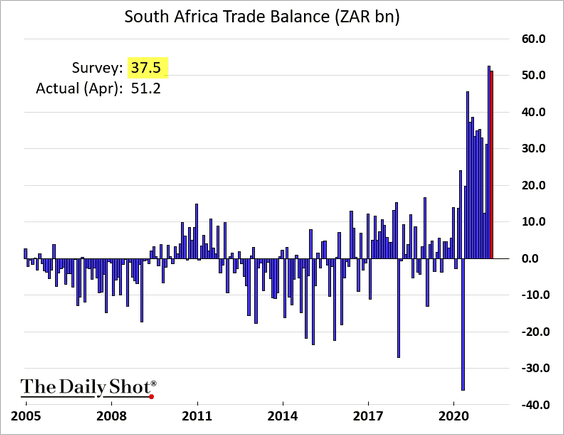
2. Here are some updates on South Africa.
• Manufacturing PMI (stronger than expected):
• Credit growth:
• Trade surplus (well above forecasts):
——————–
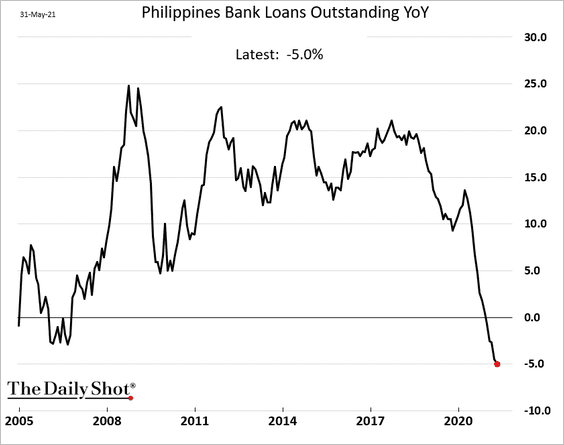
3. Philippine private-sector credit continues to contract.
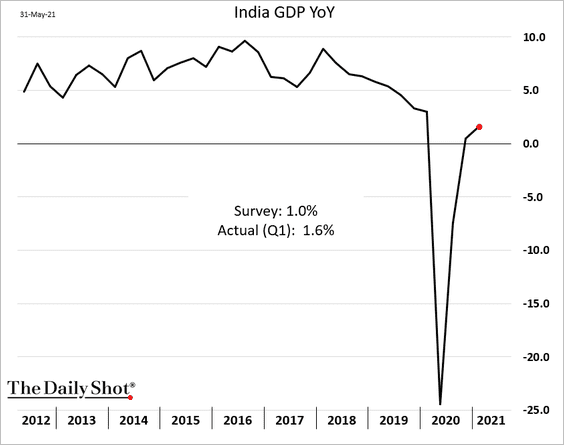
4. India pulled out of recession in Q1.
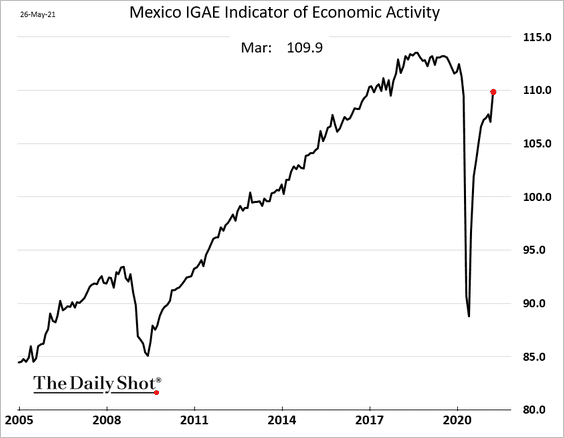
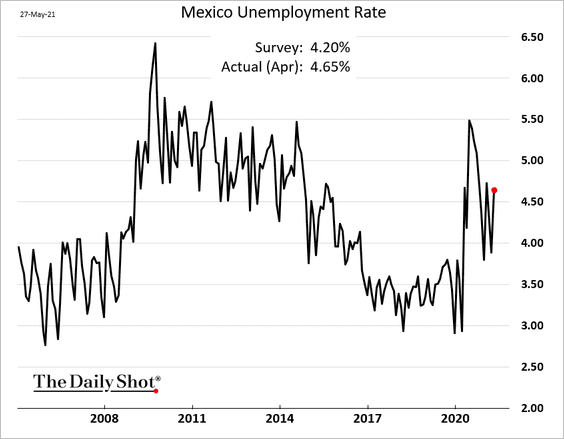
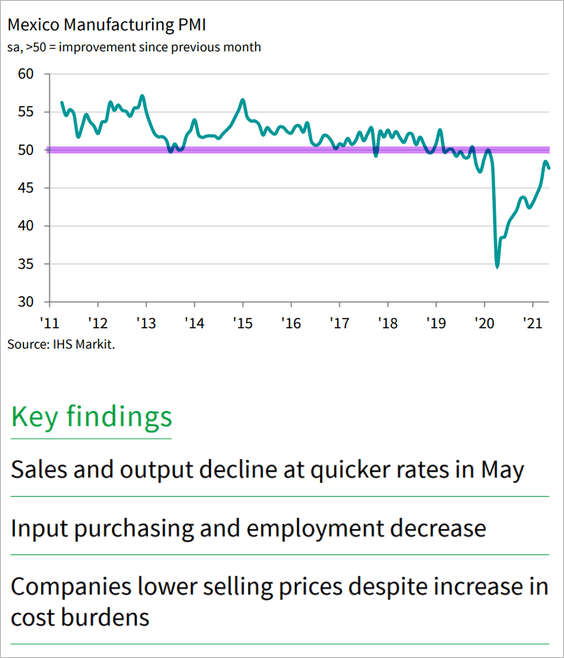
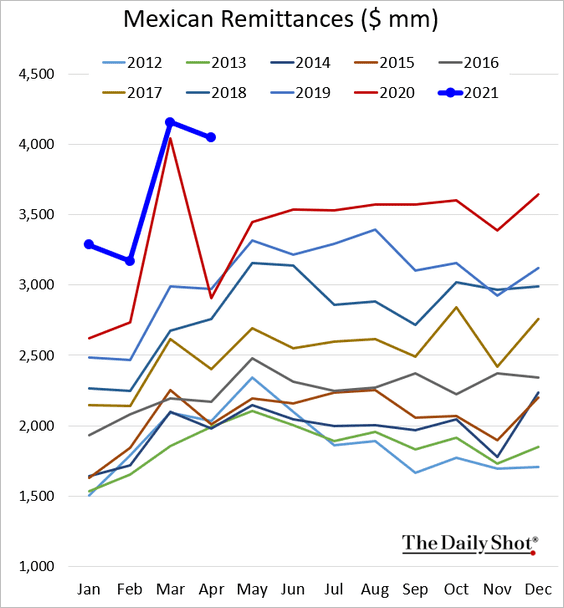
5. Next, we have some updates on Mexico.
• Economic activity (through March):
• The unemployment rate (higher than expected):
• Manufacturing activity (still in contraction territory):
• Remittances (a record high for this time of the year):
——————–
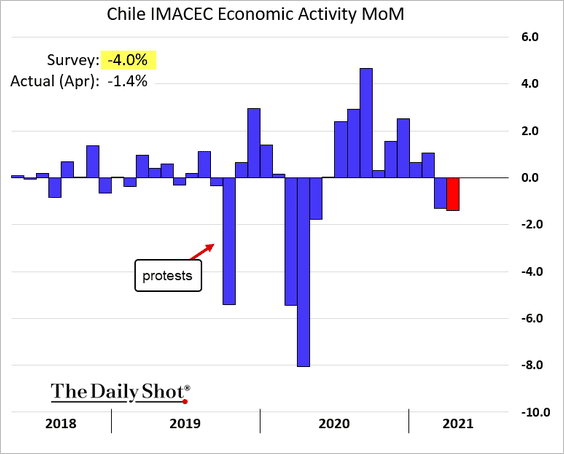
6. Chile’s economic activity contracted less than expected in April.
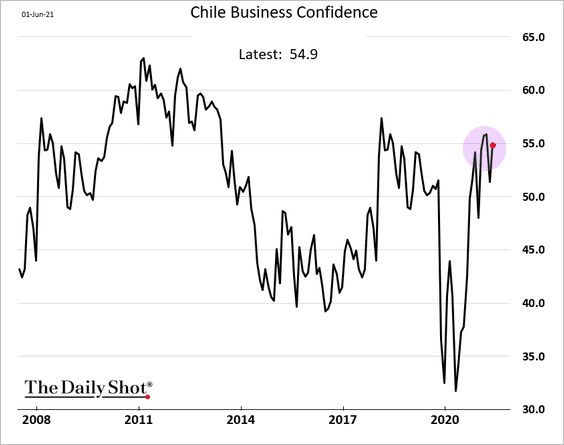
Business confidence remains robust.
——————–
7. Colombia’s manufacturing sector is struggling.
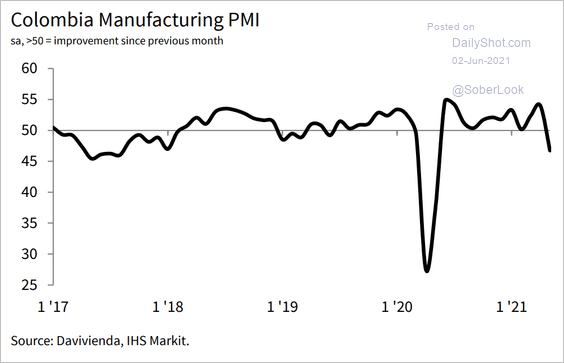 Source: IHS Markit
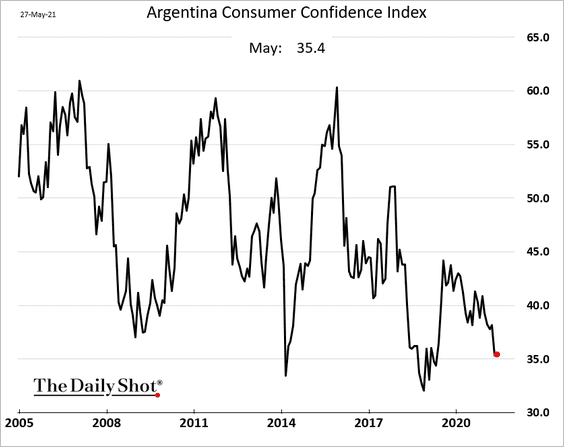
8. Here is Argentina’s consumer confidence.
9. How long will it take to return to pre-COVID GDP per capita levels?
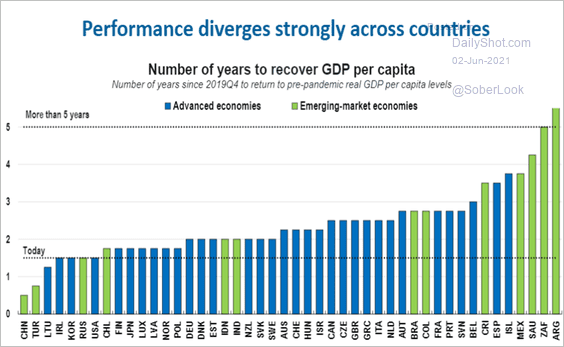 Source: OECD Read full article
Back to Index
Commodities
Here is the May performance across select commodities.
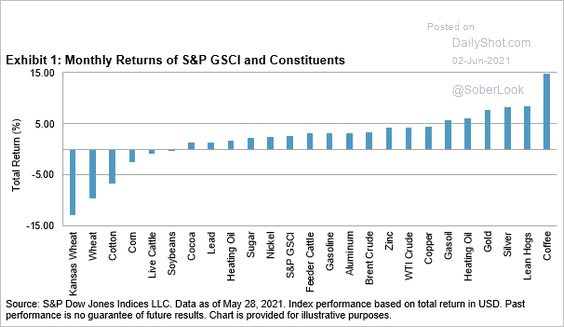 Source: Fiona Boal, S&P Global Market Intelligence
Back to Index
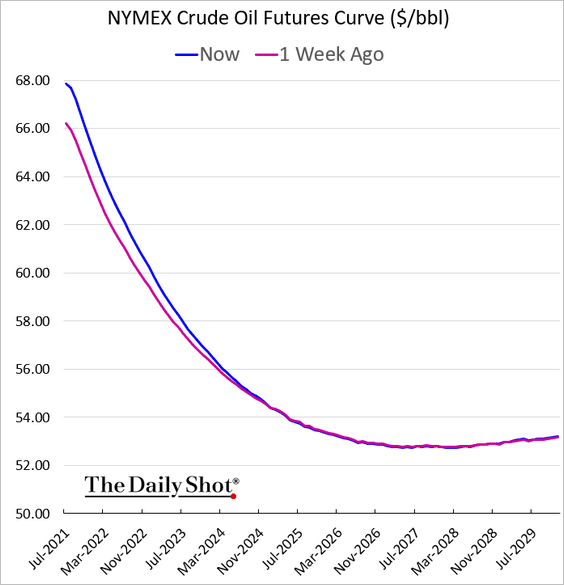
Energy
1. The WTI crude curve backwardation keeps increasing as US inventories tighten.
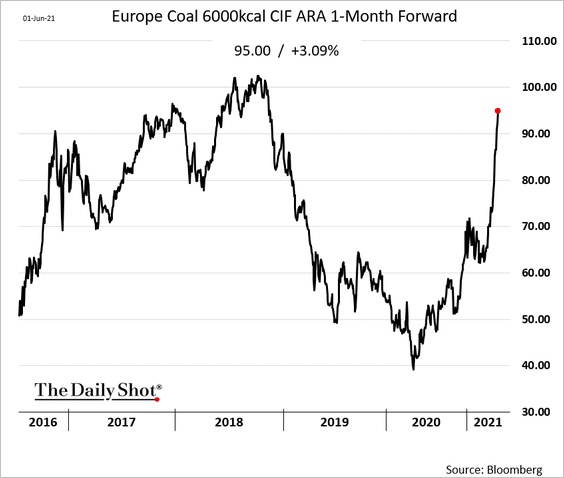
2. European coal prices have been surging.
Back to Index
Equities
1. Let’s start with the May returns across sectors and factors.
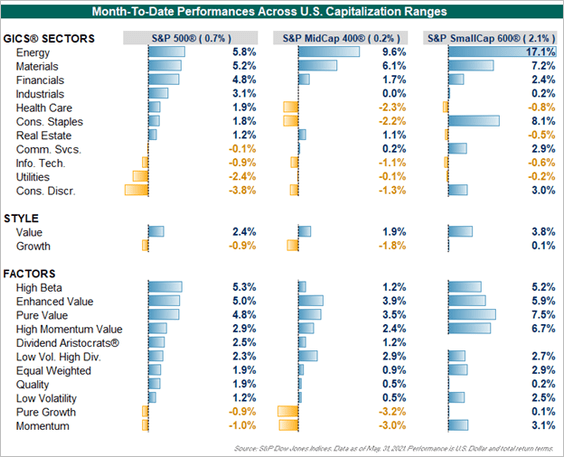 Source: S&P Global Market Intelligence
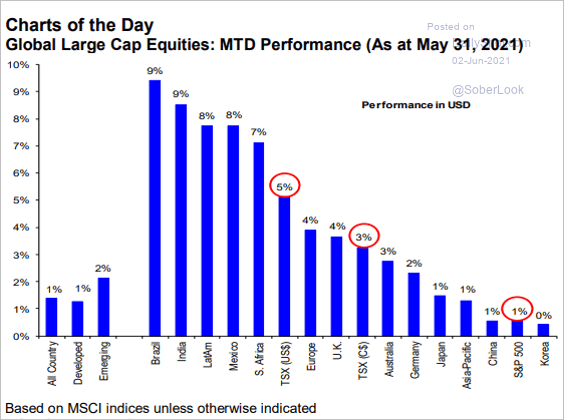
And here is how markets performed globally.
 Source: Hugo Ste-Marie, Portfolio & Quantitative Strategy Global Equity Research, Scotia Capital
——————–
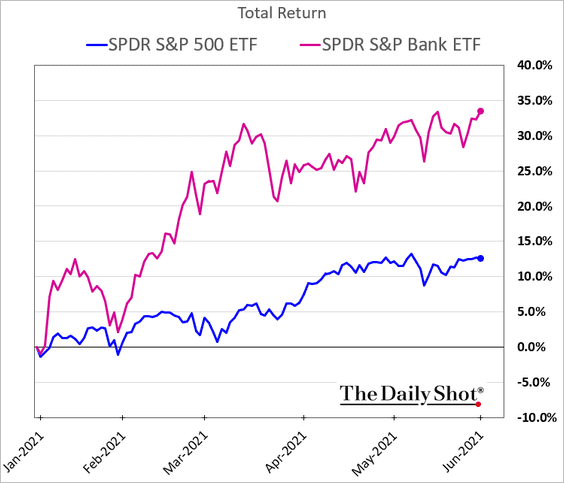
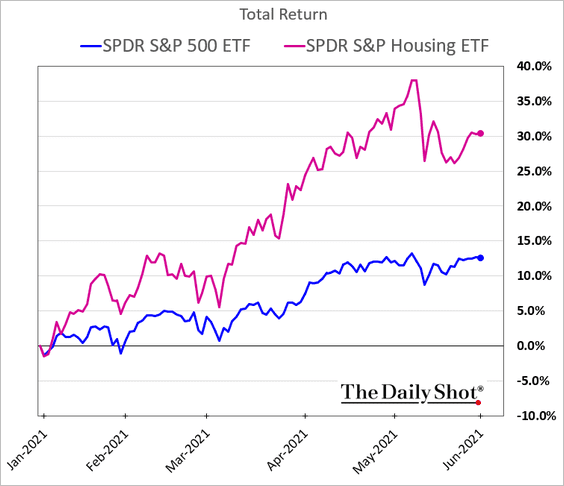
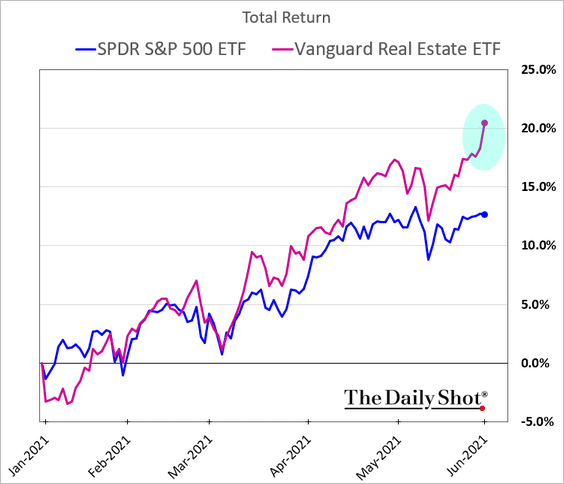
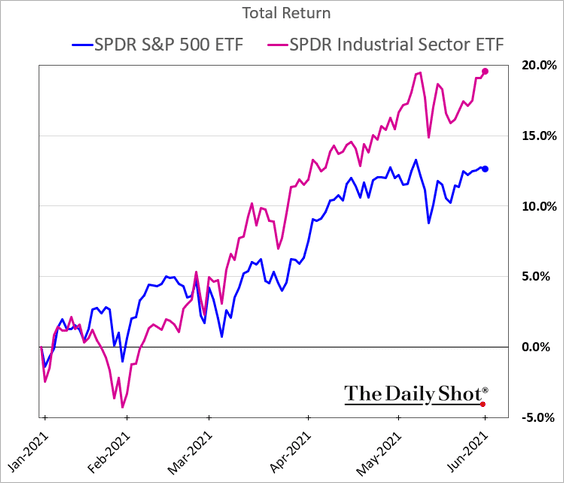
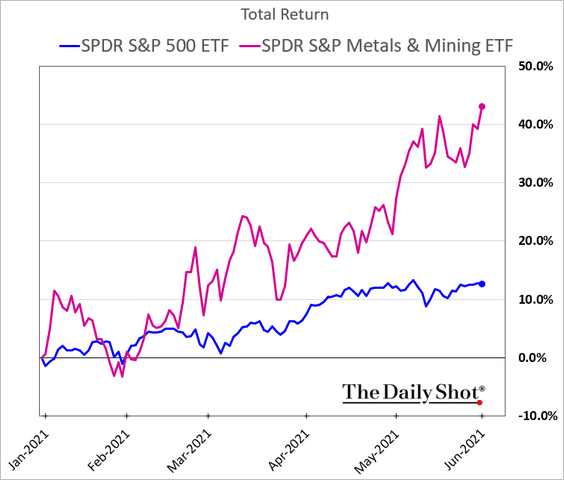
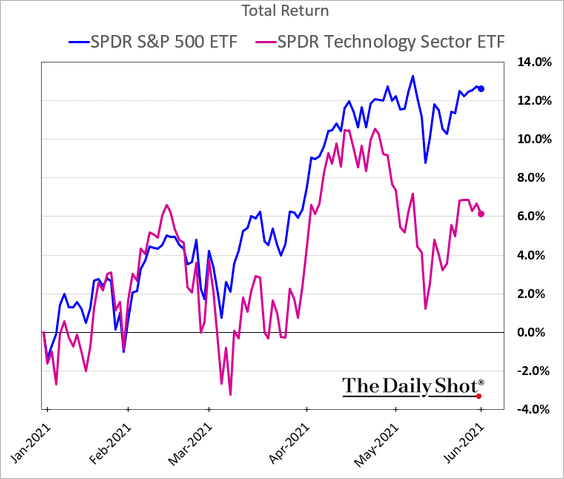
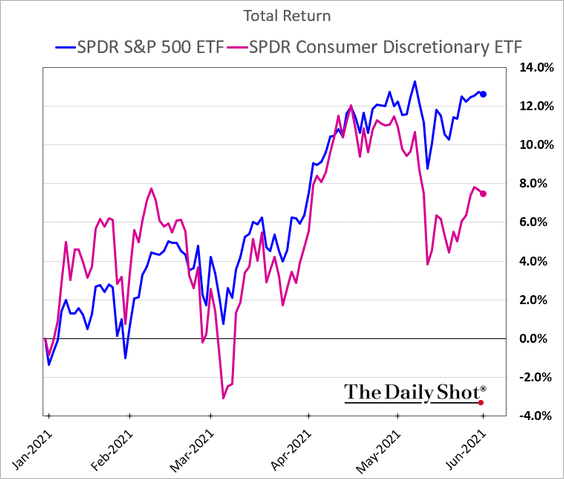
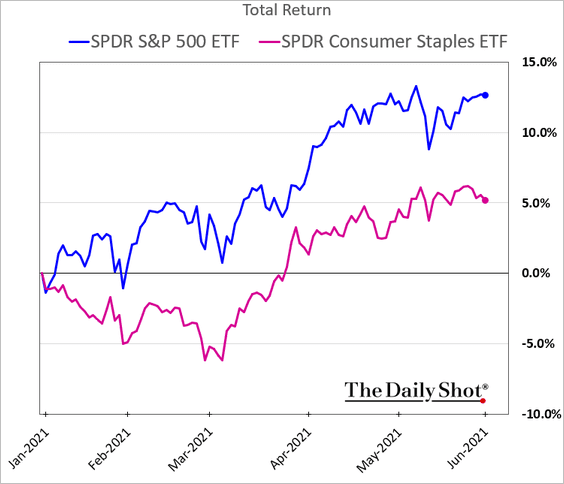
2. Next, let’s take a look at year-to-date sector performance.
• Banks:
• Housing:
• REITs:
• Industrials:
• Transportation:
![]()
• Metals & Mining:
• Tech:
• Consumer discretionary:
• Consumer staples:
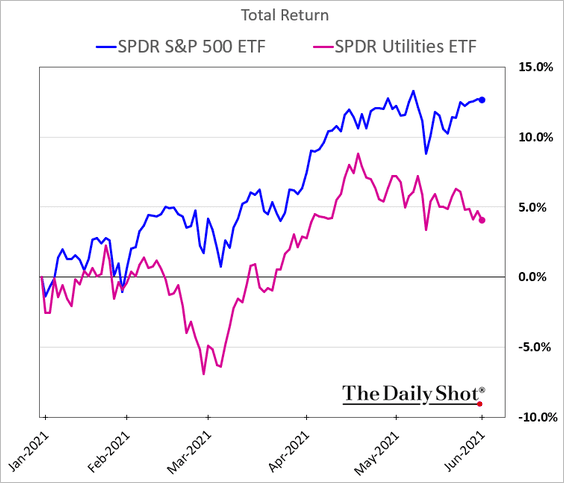
• Utilities:
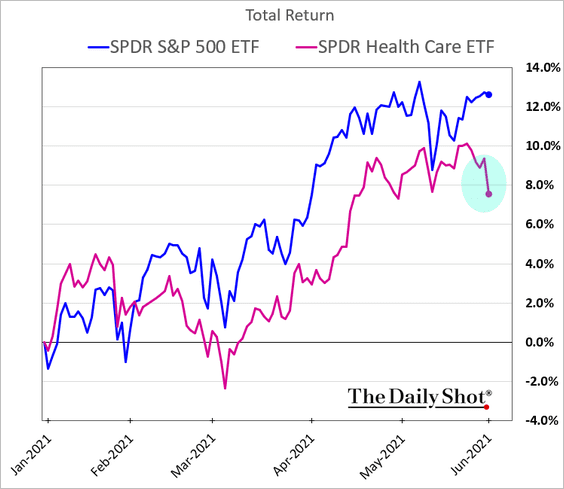
• Healthcare:
——————–
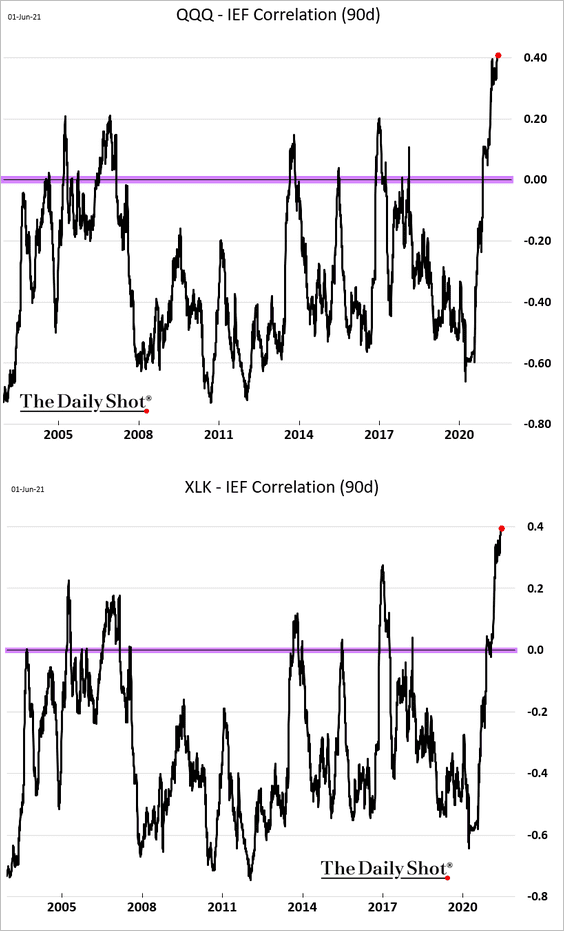
3. Stock-bond correlations remain elevated, especially for growth shares.
4. Many SPACs will be forced to buy overpriced companies before hitting their deadlines (to return cash to investors).
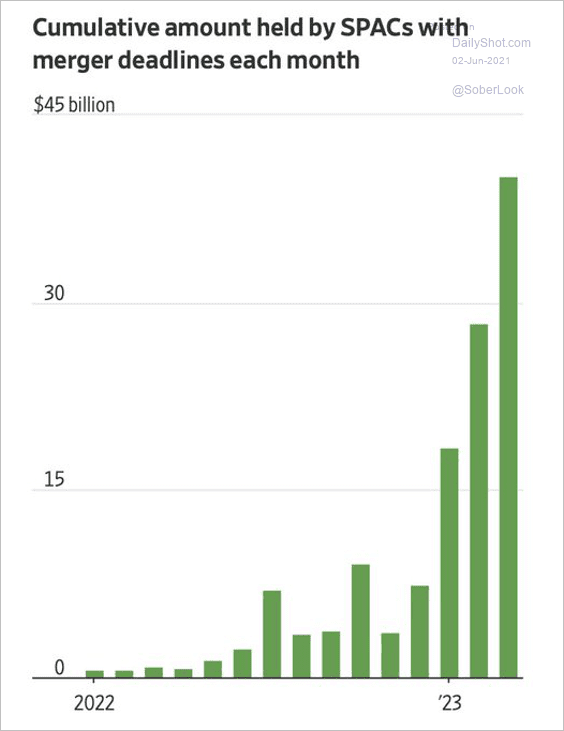 Source: @jessefelder, @WSJ Read full article
5. There are “retail favorites,” and then there are meme stocks.
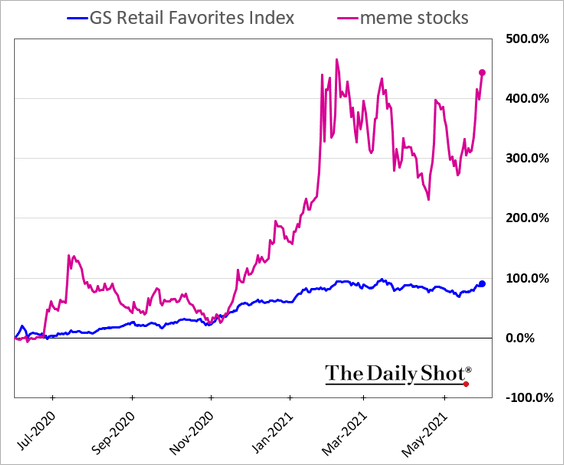
Madness …
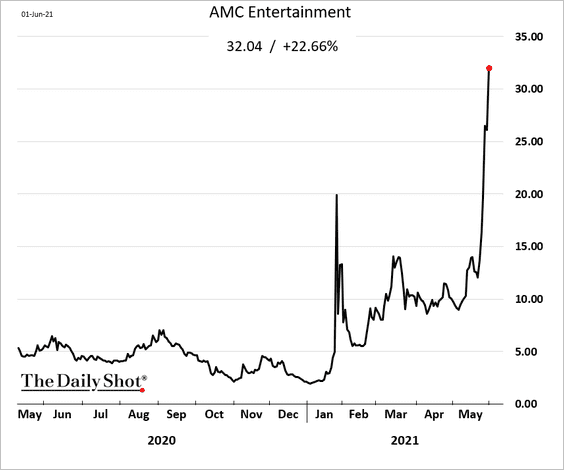
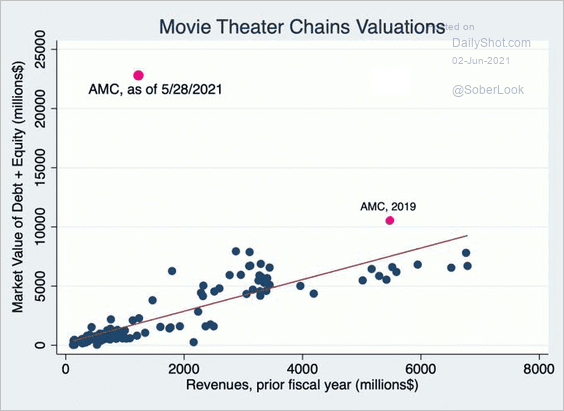 Source: @jessefelder, The Blindfolded Chimpanzee Read full article
Back to Index
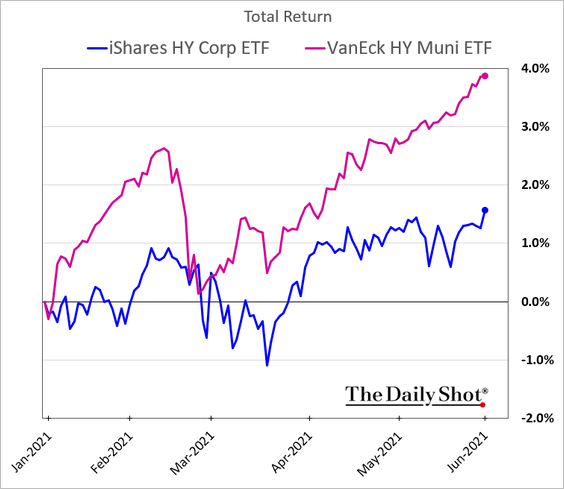
Credit
High-yield munis continue to rally, …
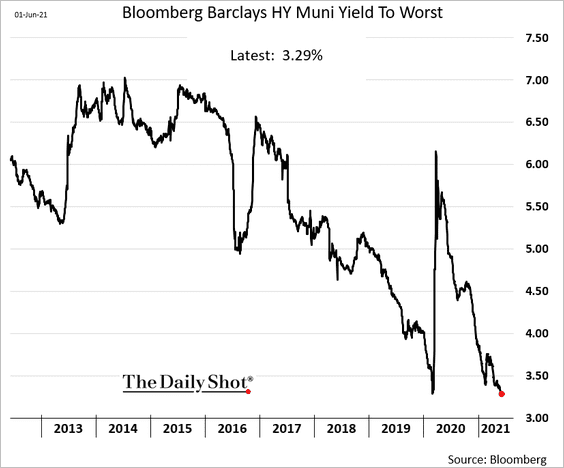
… outperforming high-yield corporates.
Back to Index
Rates
1. Realized volatility has declined in the 10-year Treasury yield and the iShares 20+ year Treasury bond ETF (TLT) since March (2 charts).
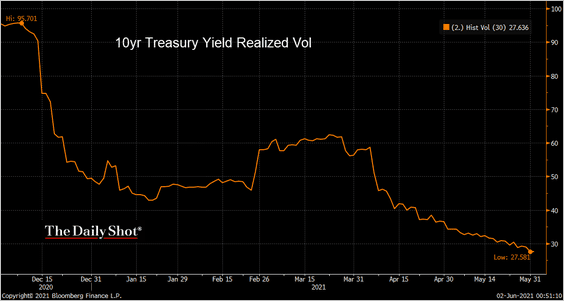 Source: @TheTerminal, Bloomberg Finance L.P.; h/t Chris Murphy, Susquehanna Derivative Strategy
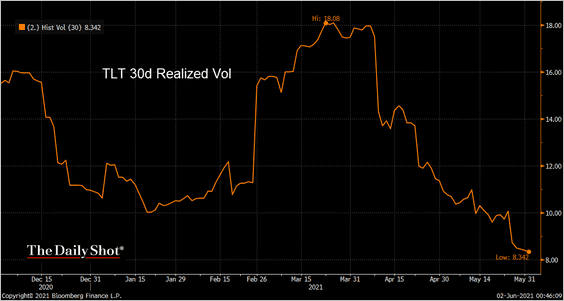 Source: @TheTerminal, Bloomberg Finance L.P.; h/t Chris Murphy, Susquehanna Derivative Strategy
——————–
2. Based on current yield levels, the bond market still doesn’t expect high inflation to persist for very long. The Fed’s QE also contributes to lower yields.
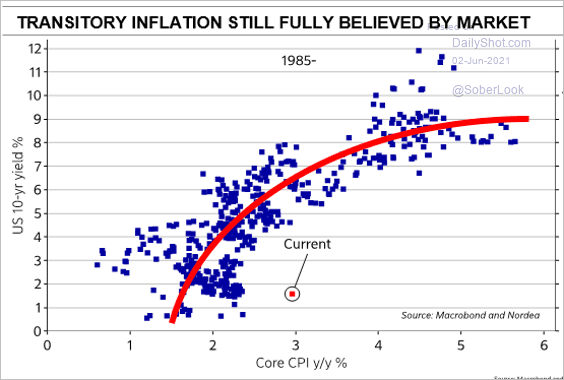 Source: @MikaelSarwe
3. The Fed now holds more Treasuries than foreign investors.
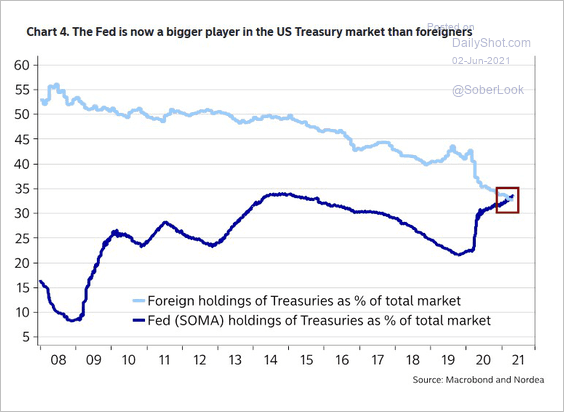 Source: Nordea Markets, @jessefelder
——————–
Food for Thought
1. Declining hunger rate in the US:
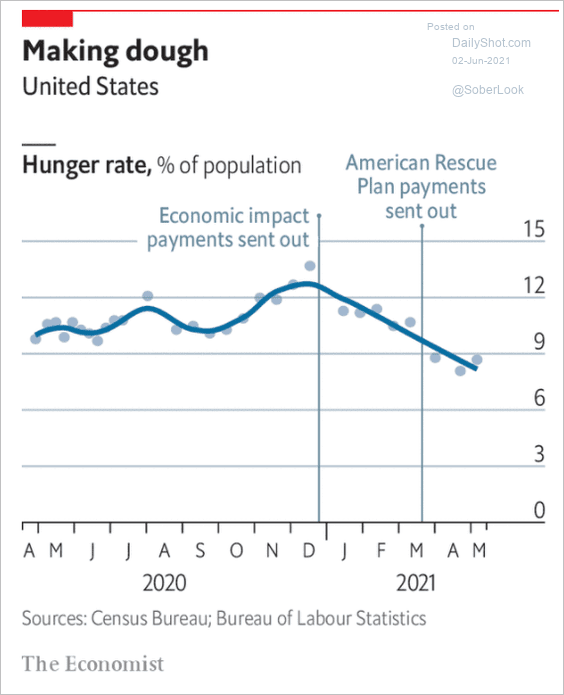 Source: The Economist Read full article
2. Demand for grilling products:
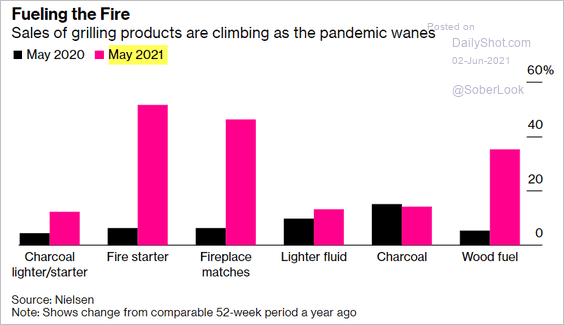 Source: Bloomberg Read full article
3. Views on business regulation:
 Source: Pew Research Center
4. The value of US rental homes:
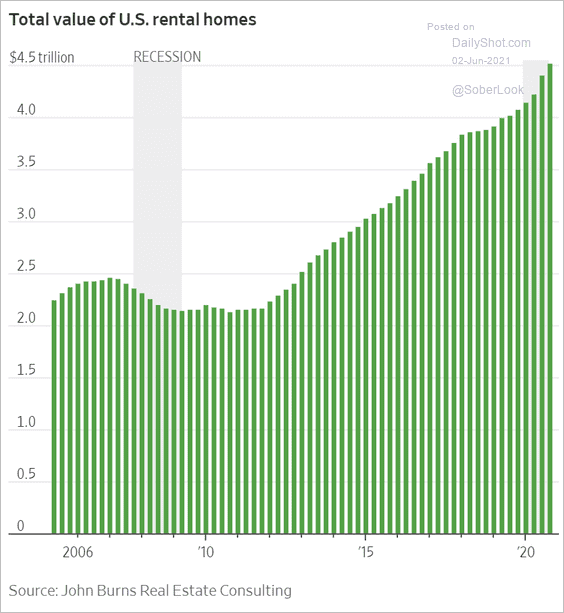 Source: @WSJ Read full article
5. US solar panel imports:
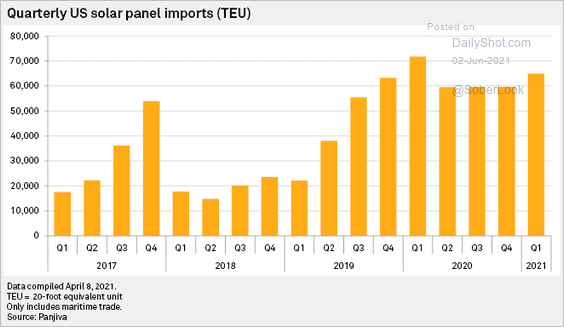 Source: S&P Global Market Intelligence
6. US motorcycle exports to the EU:
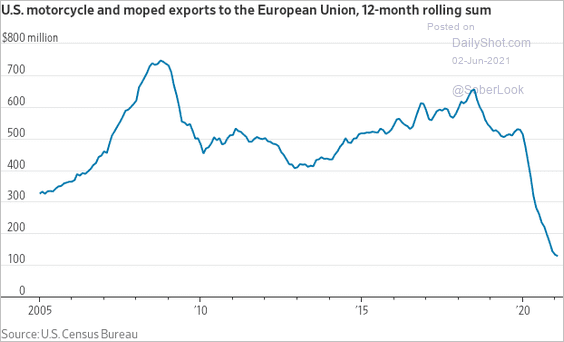 Source: @jeffsparshott
7. AI publications (2 charts):
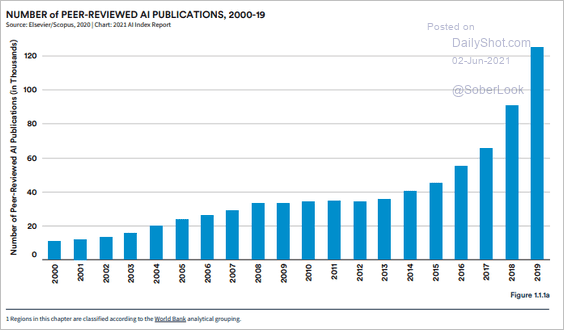 Source: Artificial Intelligence Index Report 2021
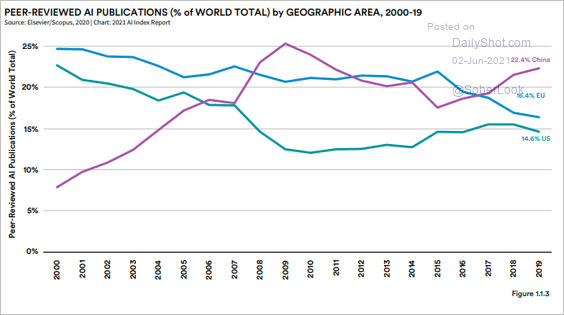 Source: Artificial Intelligence Index Report 2021
——————–
8. World leaders with most Twitter followers:
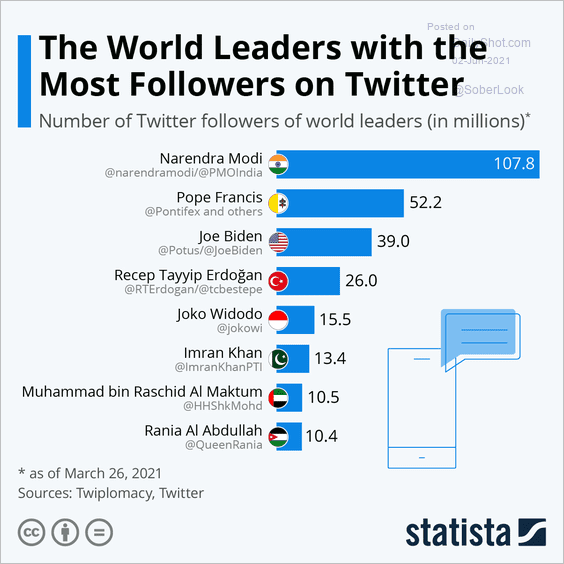 Source: Statista
9. Types of economics papers:
 Source: @maximananyev
——————–
Back to Index