
The Daily Shot: 04-Jun-21
• The United States
• Canada
• The United Kingdom
• The Eurozone
• Asia – Pacific
• Emerging Markets
• Cryptocurrencies
• Commodities
• Energy
• Equities
• Credit
• Rates
• Global Developments
• Food for Thought
The United States
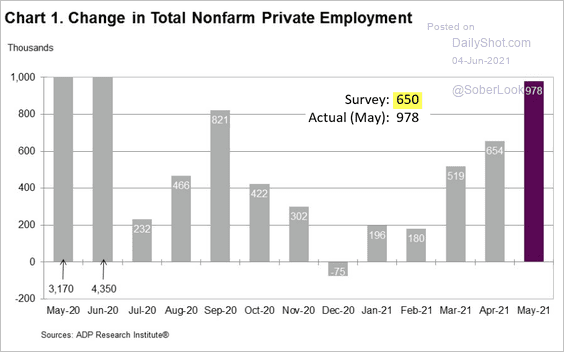
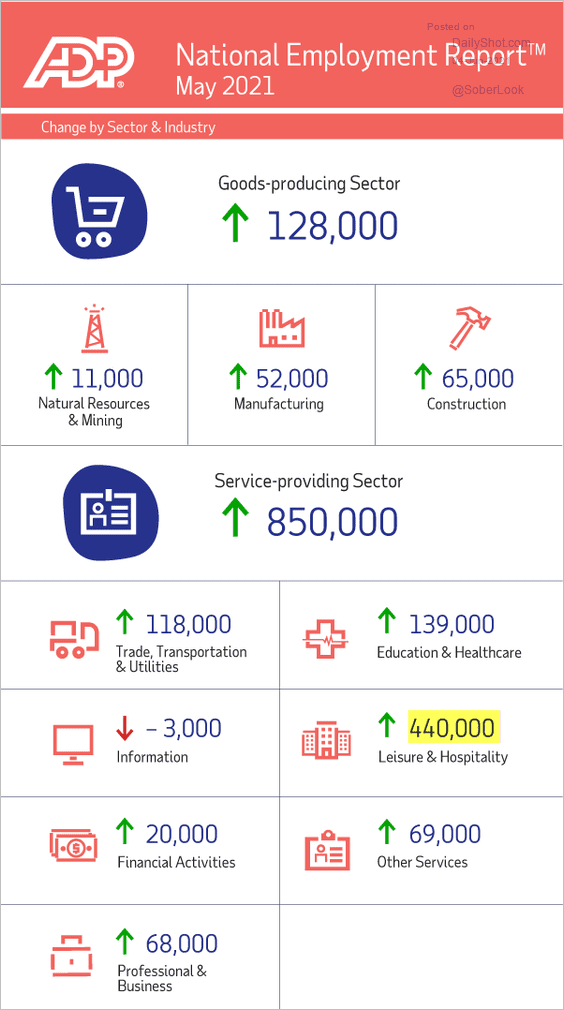
1. The ADP private payrolls report showed a gain of almost a million new jobs in May. That was well above forecasts.
 Source: ADP Research Institute
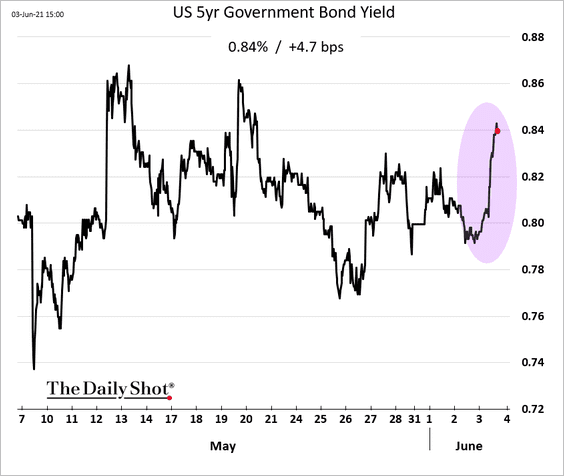
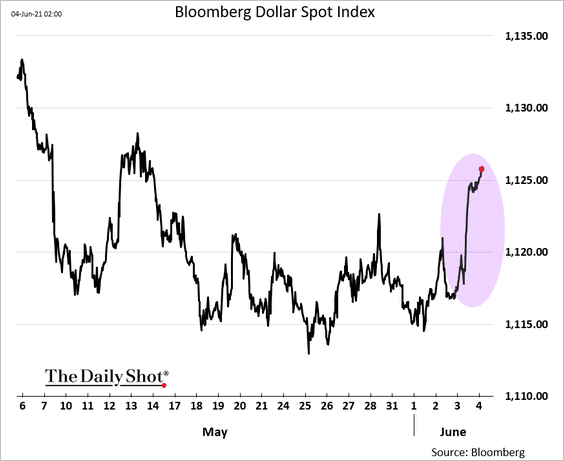
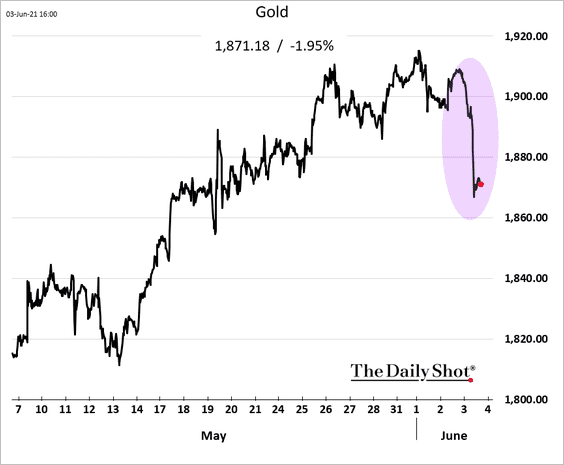
Strong job gains could put QE taper in play earlier than expected. Bond yields and the dollar climbed, while gold sold off.
——————–
• Job gains were broad.
 Source: ADP Research Institute
• What does it mean for the official jobs report this morning?
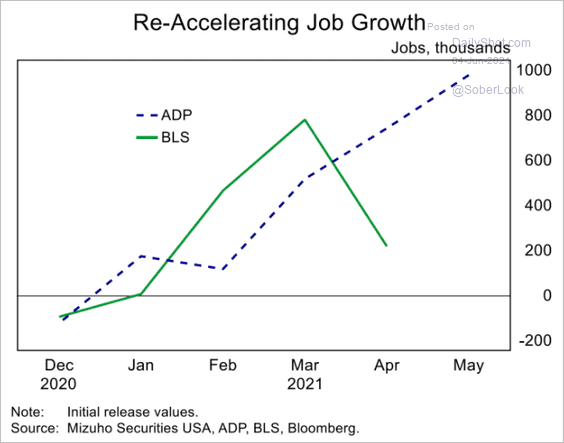 Source: Mizuho Securities USA
Economists think that the ADP figure is overstating payroll gains.
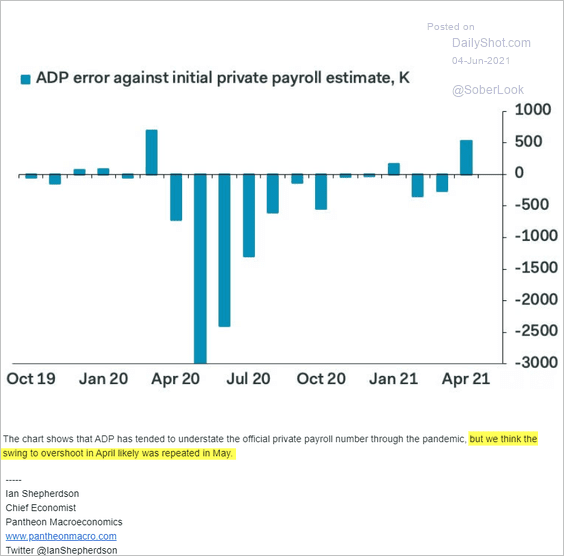 Source: Pantheon Macroeconomics
Morgan Stanley sees 600k jobs created in May (consensus is 674k).
 Source: Morgan Stanley Research
——————–
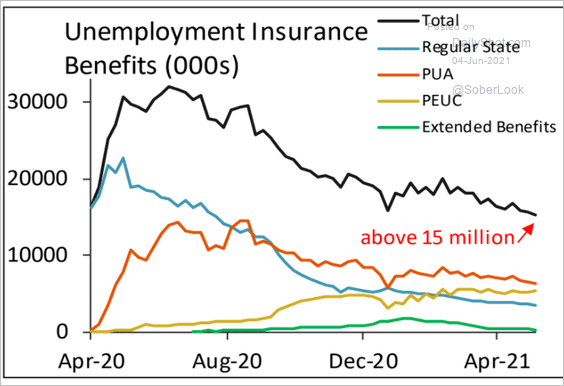
2. Initial jobless claims continue to trend lower.
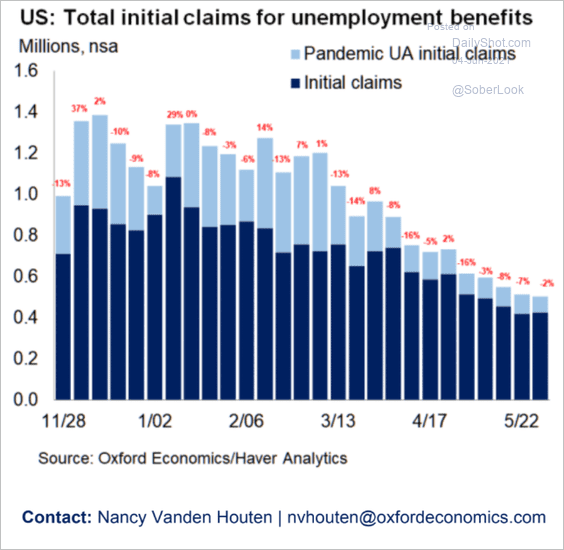 Source: Oxford Economics
Continuing claims are moving down as well, but there are still more than 15 million Americans receiving unemployment benefits.
 Source: Piper Sandler
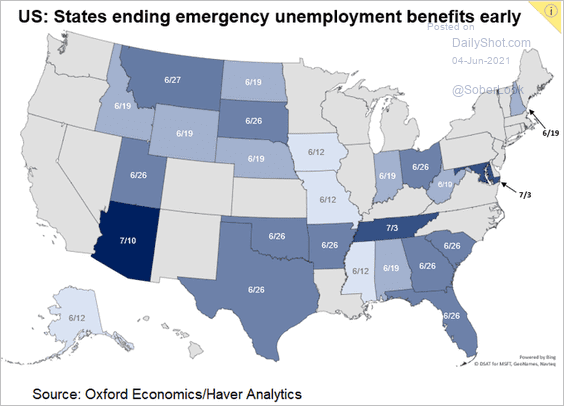
However, according to Oxford Economics, “roughly 4.1 million individuals will lose access to emergency unemployment benefits over the coming month” (an income cliff).
 Source: @GregDaco
——————–
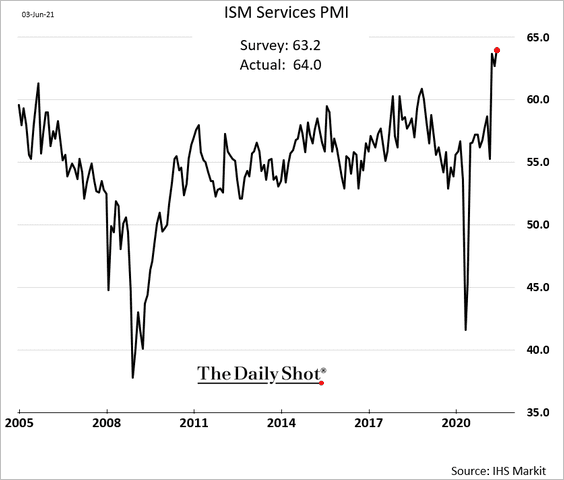
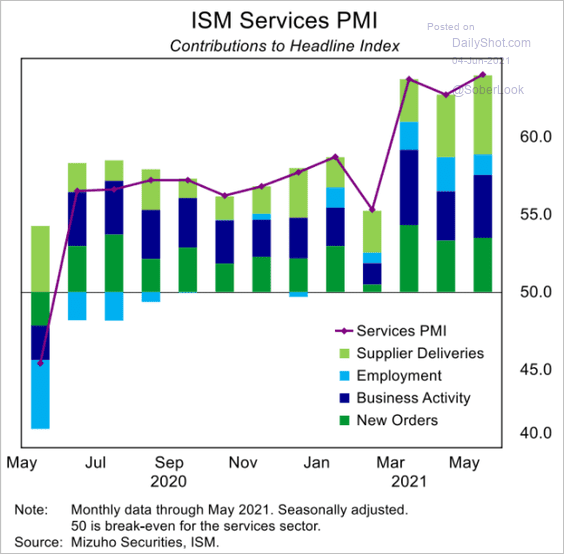
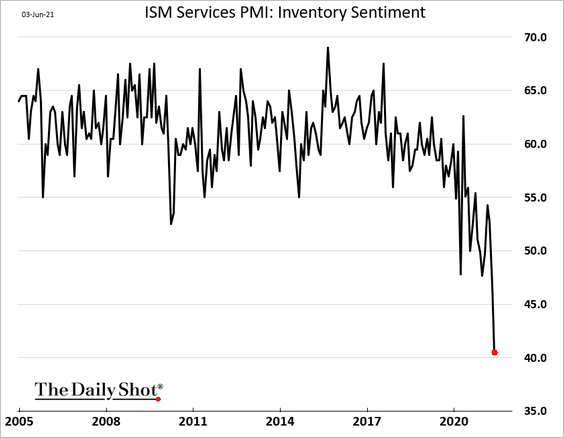
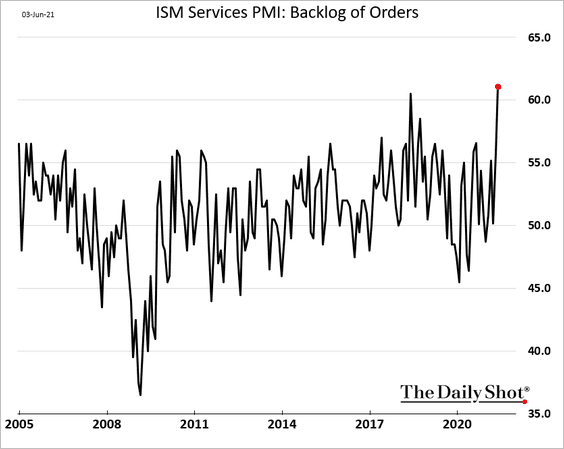
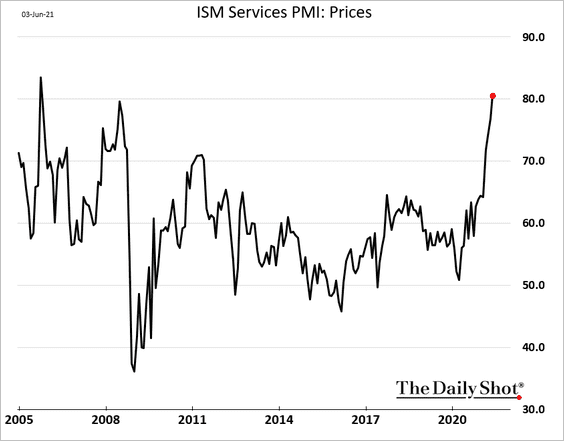
3. The ISM Services PMI remains exceptionally strong as the service-sector activity accelerates.
 Source: Mizuho Securities USA
But inventories are dwindling rapidly amid supplier delays, …
… while prices are surging.
Worker shortages are becoming a drag on hiring.

——————–
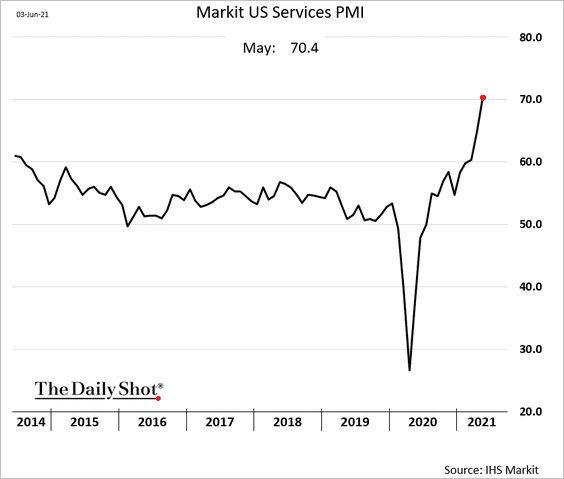
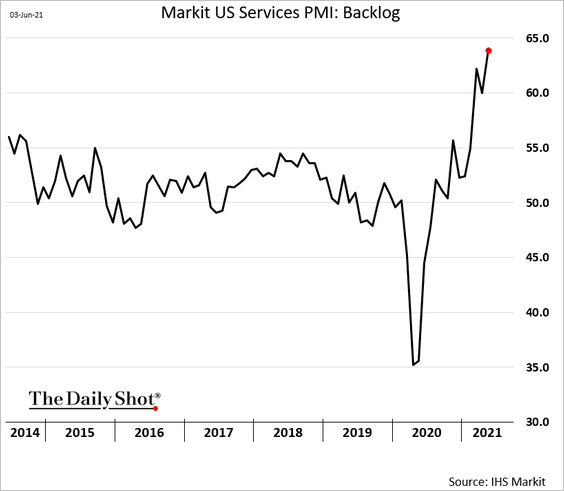
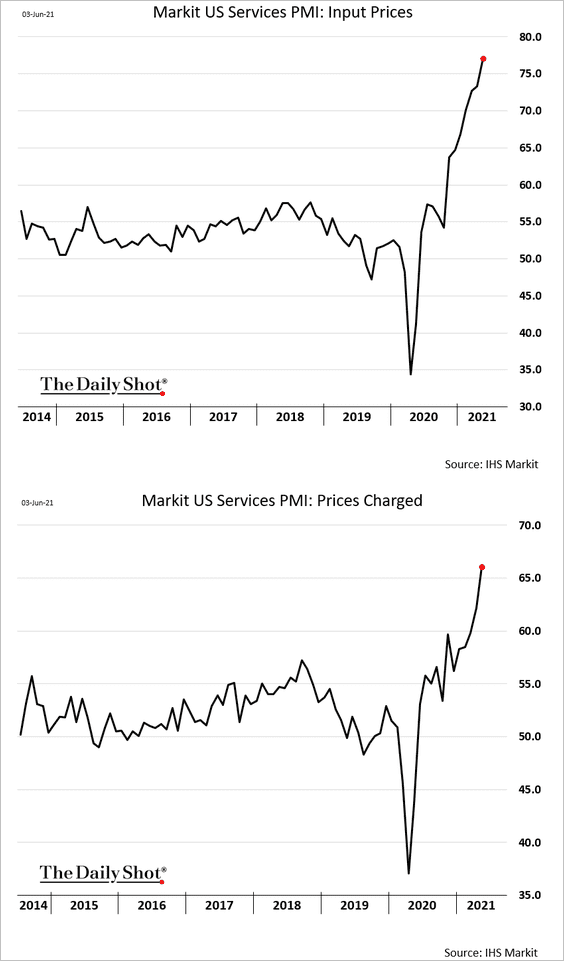
The ISM results are consistent with a similar report from IHS Markit.
• Headline PMI:
• Backlog of orders:
• Prices:
——————–
4. CEO confidence points to further gains in business investment.
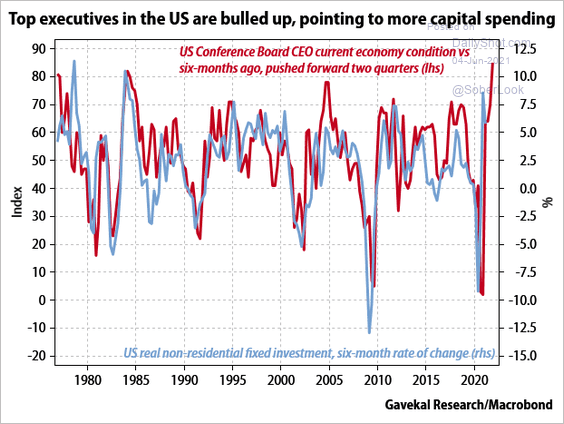 Source: Gavekal Research
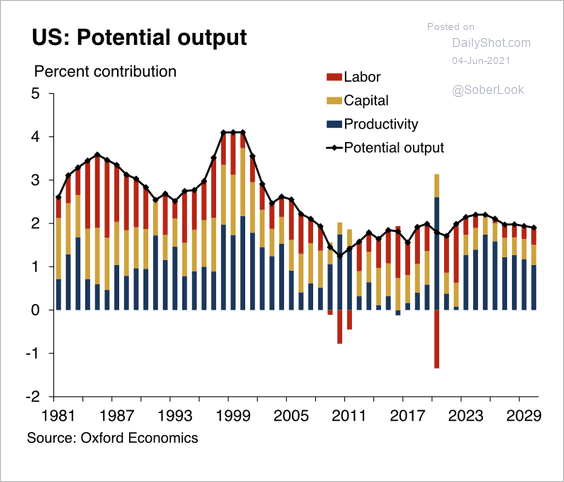
As a result, Oxford Economics expects productivity growth to rebound in the coming years, accounting for two-thirds of long-run GDP growth by 2025.
 Source: Oxford Economics
By the way, some of the hardest-hit industries during the pandemic have the lowest levels of productivity.
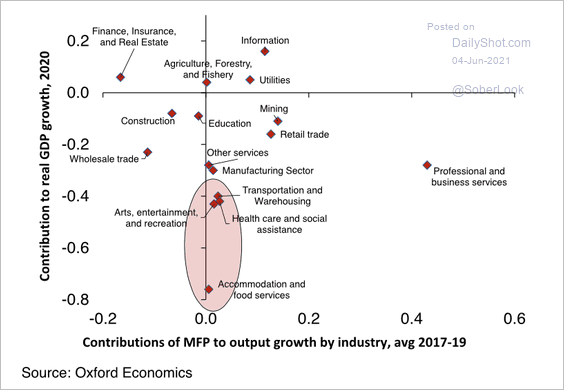 Source: Oxford Economics
——————–
5. Chase card data indicate robust consumer spending last month.
![]() Source: JP Morgan; @bobbyeubank
Source: JP Morgan; @bobbyeubank
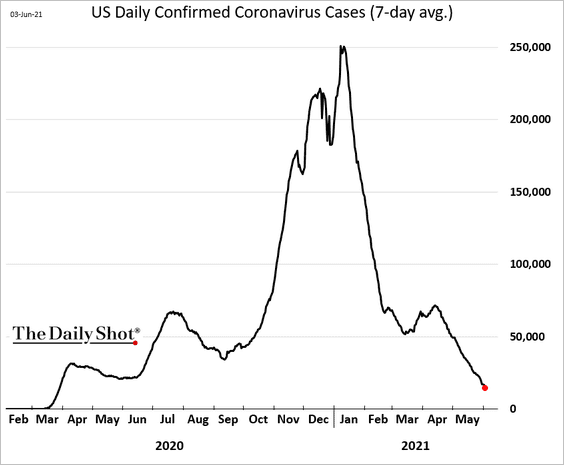
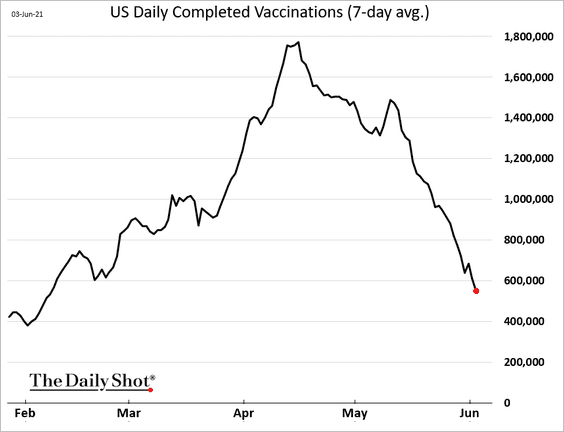
6. Finally, we have some updates on the pandemic.
• New cases:
• Daily completed vaccinations:
• Total vaccinations:
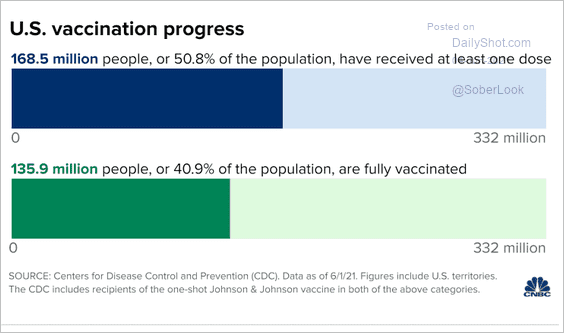 Source: CNBC Read full article
• Vaccination uptake:
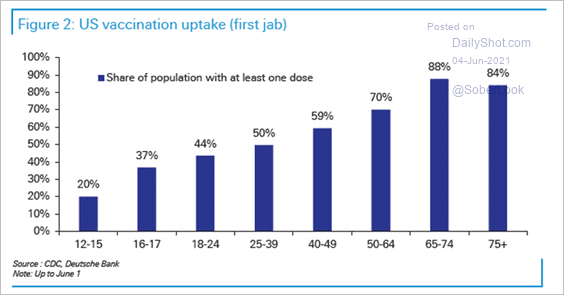 Source: Deutsche Bank Research
Back to Index
Canada
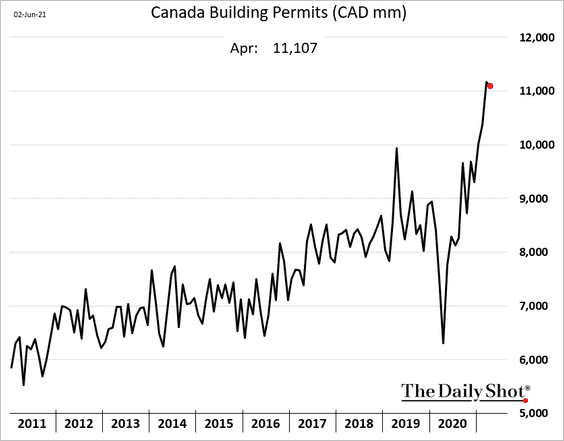
1. Building permits remained robust in April.
2. The number of Canadian dividend funds has increased over the past decade.
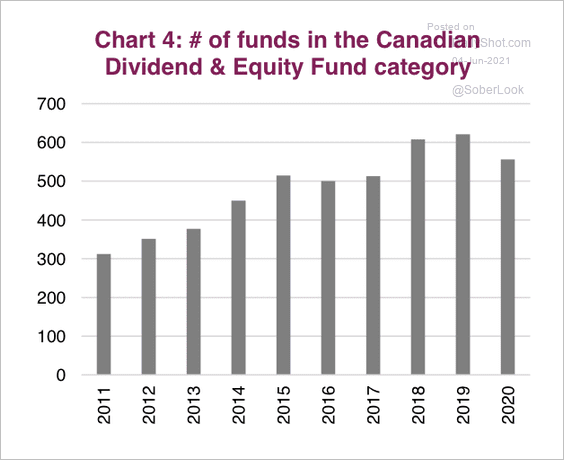 Source: Market Ethos, Richardson GMP
3. The TSX index appears overbought relative to long-term government bonds.
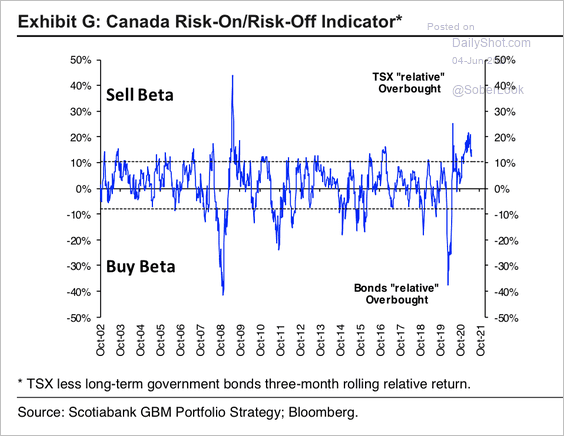 Source: Hugo Ste-Marie, Portfolio & Quantitative Strategy Global Equity Research, Scotia Capital
Back to Index
The United Kingdom
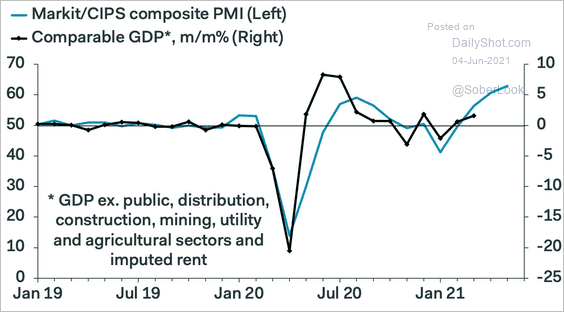
1. The final service-sector PMI from Markit was even stronger than the earlier release.
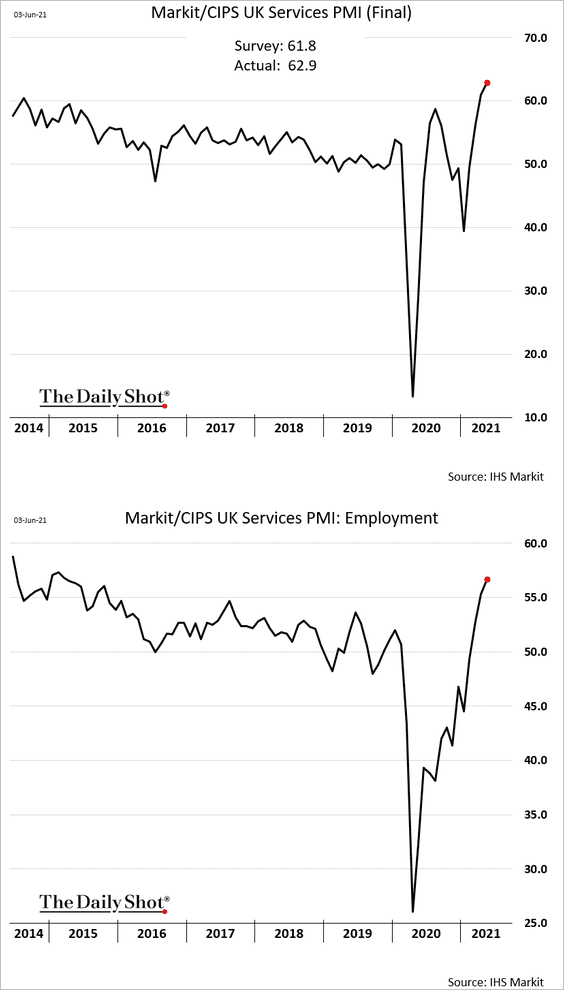
• We are looking at a substantial pickup in GDP growth.
 Source: Pantheon Macroeconomics
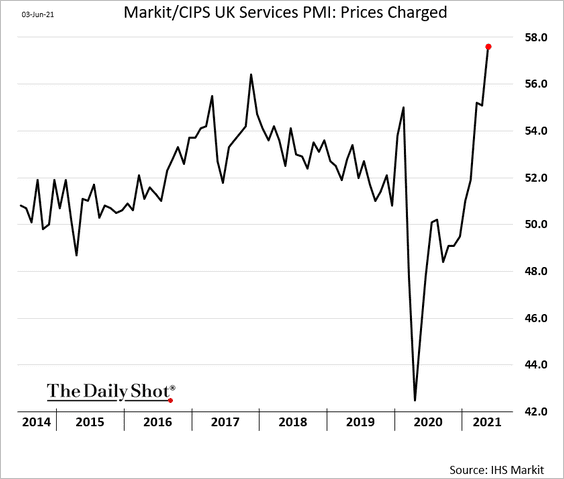
• Service companies are rapidly boosting prices, which will feed into consumer inflation.
——————–
2. The labor market has tightened in May.
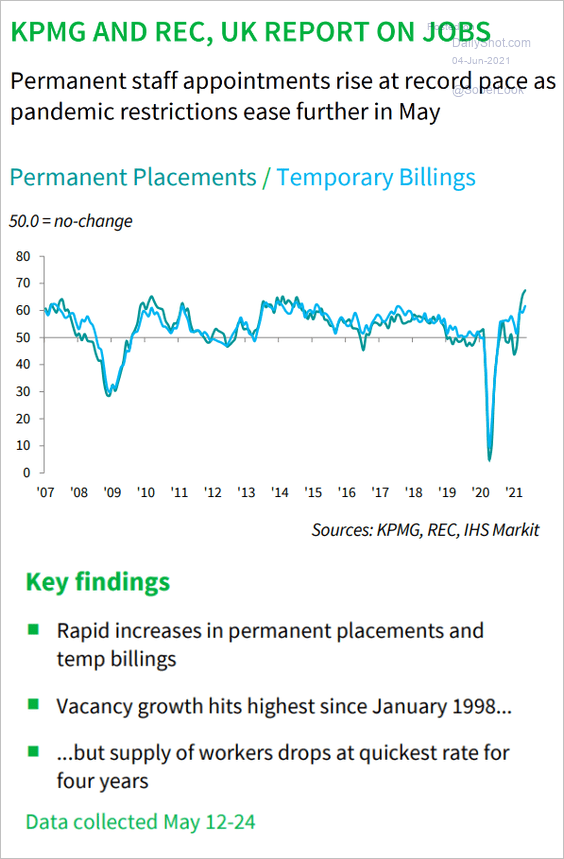 Source: IHS Markit
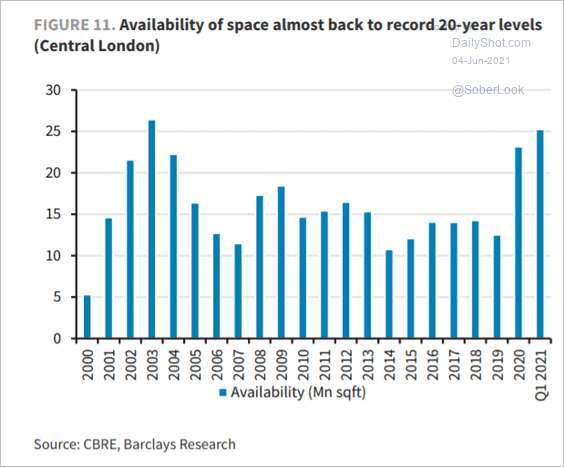
3. There is plenty of available office space in central London.
 Source: Barclays Research
Back to Index
The Eurozone
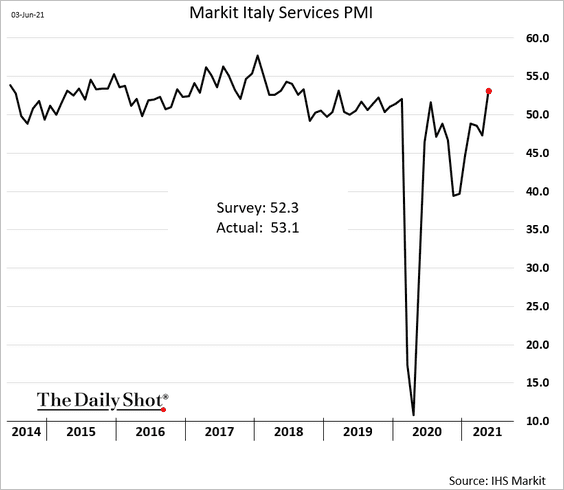
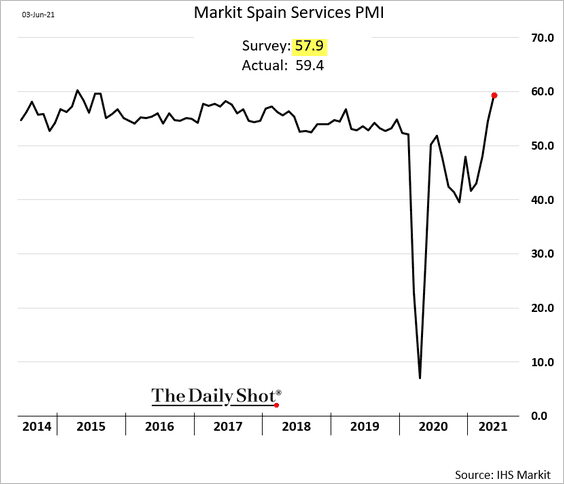
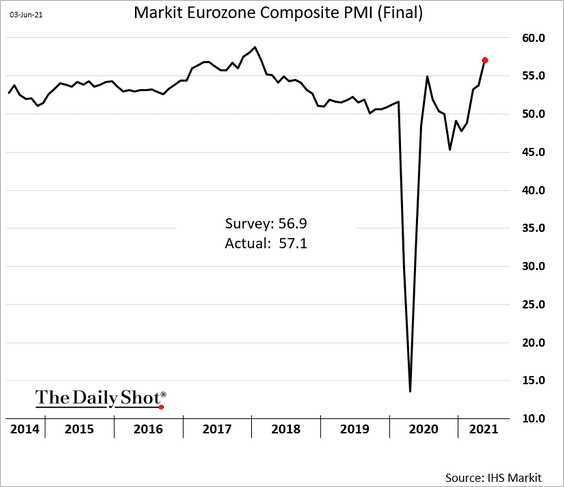
1. Service-sector activity continues to surprise to the upside.
• Italy:
• Spain:
Here is the final composite PMI chart.
——————–
2. Deutsche Bank estimates a temporary inflation spike in Q4, year-over-year, driven by energy prices (2 charts).
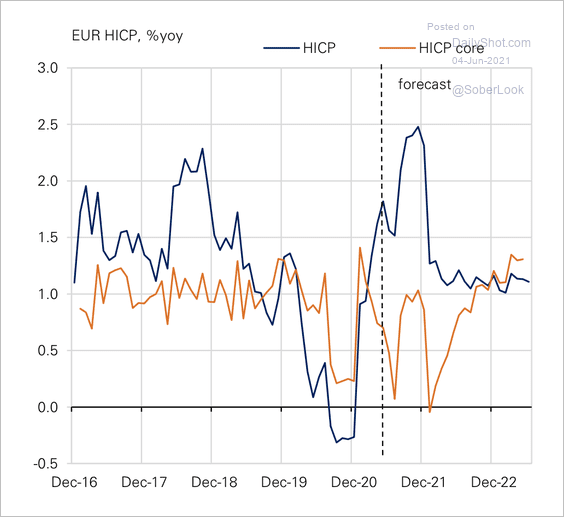 Source: Deutsche Bank Research
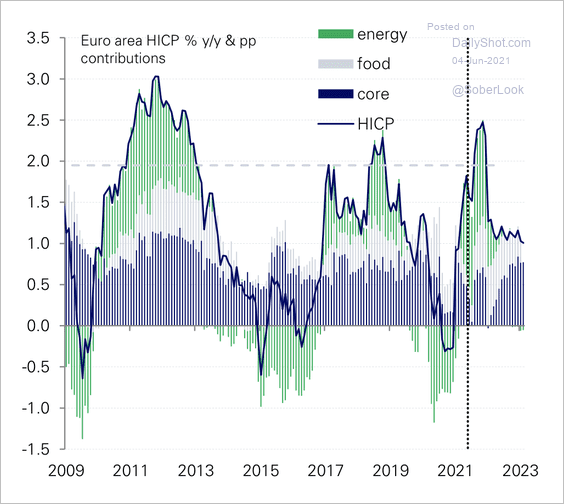 Source: Deutsche Bank Research
——————–
3. Real yield differentials with the US point to downside risks for the euro.
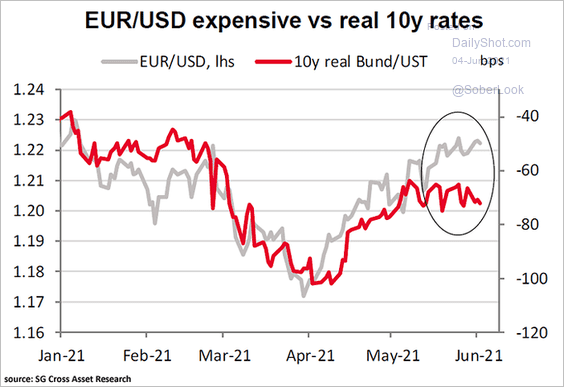 Source: @ISABELNET_SA, @SocGen_US, @DoejiStar
4. An “orderly” QE tapering will have a gradual impact on bond yields, according to Barclays Research.
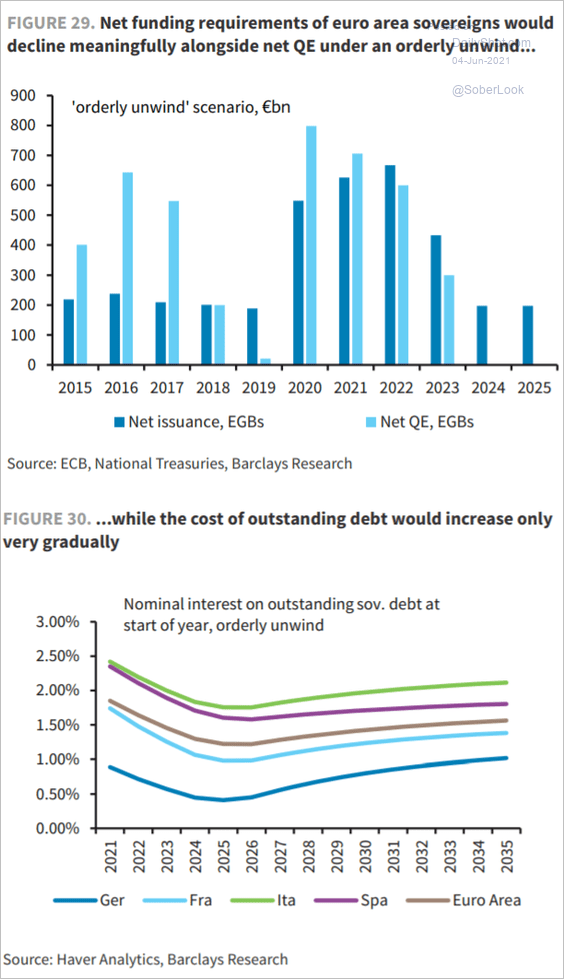 Source: Barclays Research
Back to Index
Asia – Pacific
1. This chart shows the sector PMI rankings across Asia.
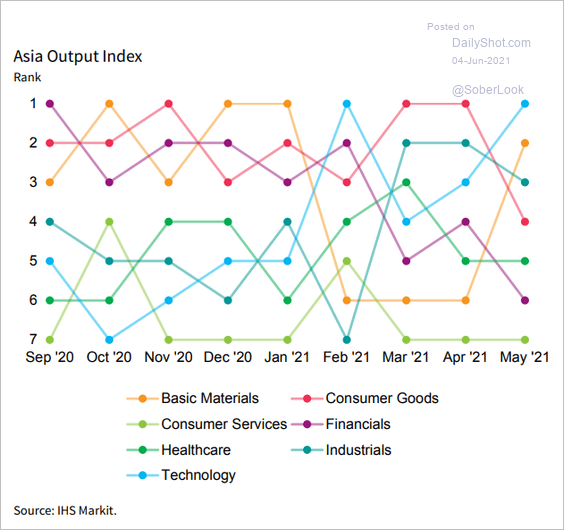 Source: IHS Markit
2. Next, we have some updates on Australia.
• The Aussie dollar vs. commodities:
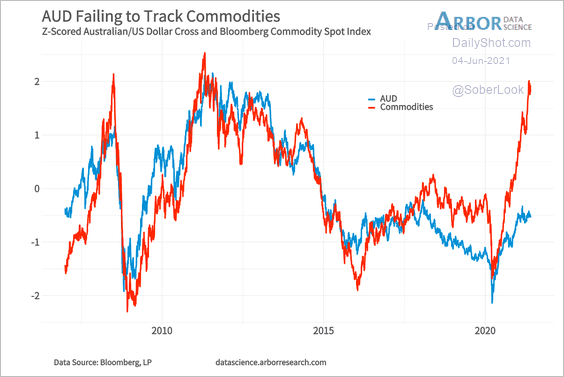 Source: Arbor Research & Trading
• Hawkish sentiment from the RBA:
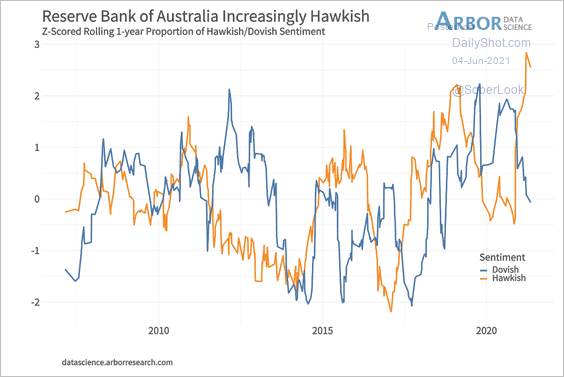 Source: Arbor Research & Trading
• Mortgage lending (regional trends):
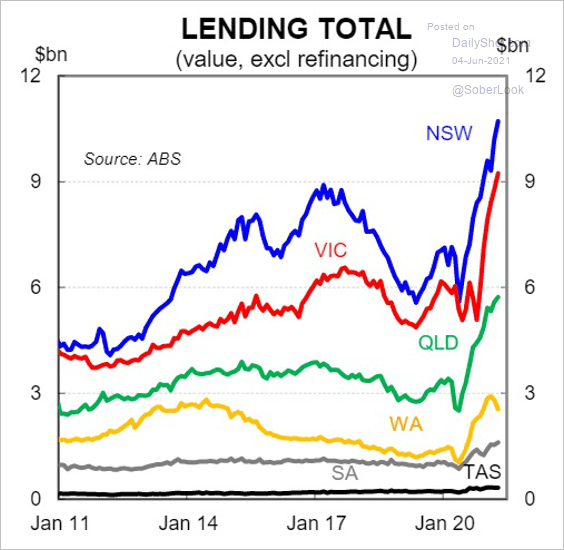 Source: @Scutty, @APRAinfo, @RBAInfo
Back to Index
Emerging Markets
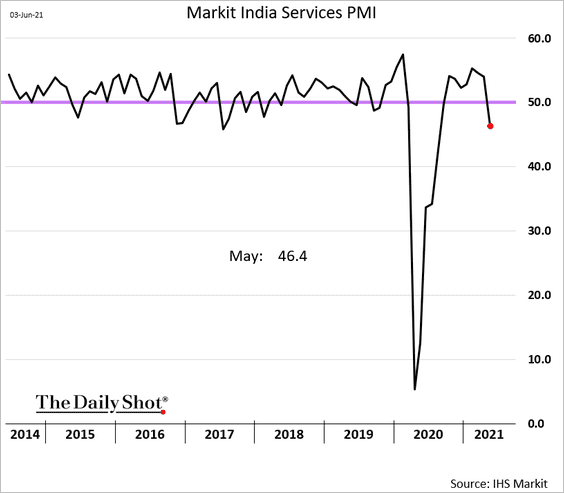
1. India’s service-sector activity contracted sharply in May amid lockdowns.
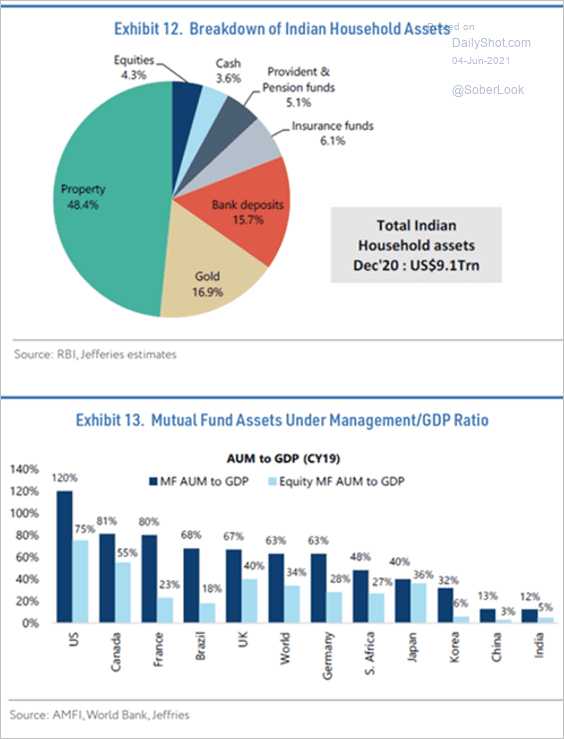
Separately, Indian households’ ownership of equities is still relatively low.
 Source: @DriehausCapital
——————–
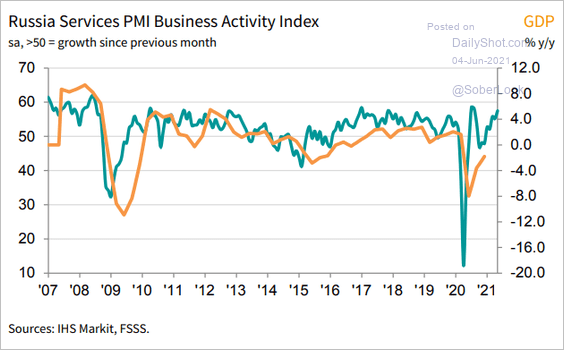
2. Russia’s service-sector activity strengthened further last month.
 Source: IHS Markit
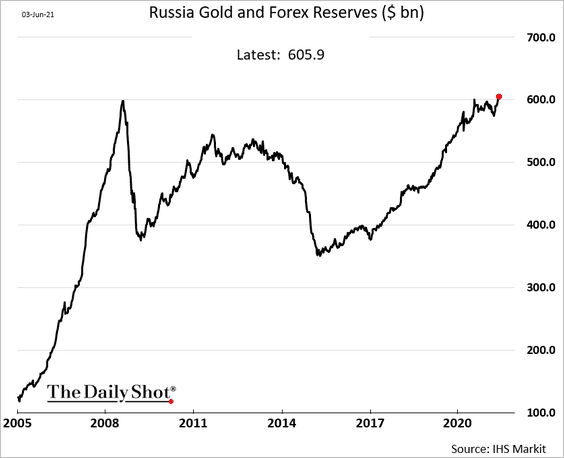
Russia’s FX reserves hit a record high.
——————–
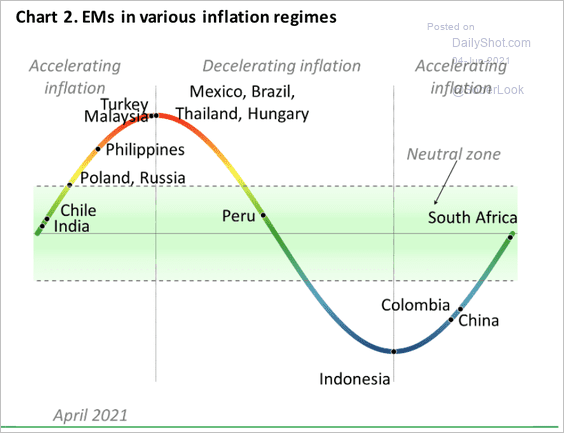
3. Inflation is accelerating in a majority of EM markets due to base effects.
 Source: IMF
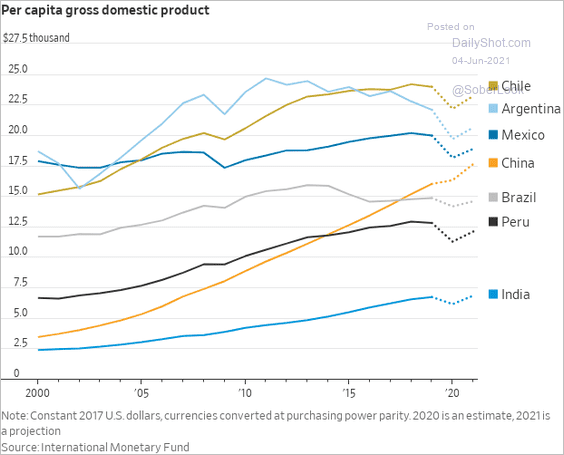
4. This chart shows the GDP per capita for select economies.
 Source: @WSJ Read full article
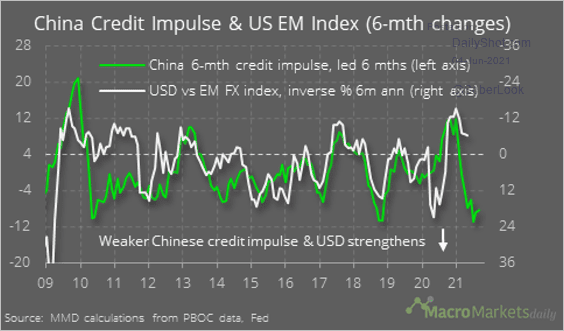
5. Will China’s slowing credit impulse put downward pressure on EM currencies?
 Source: @macro_daily
Back to Index
Cryptocurrencies
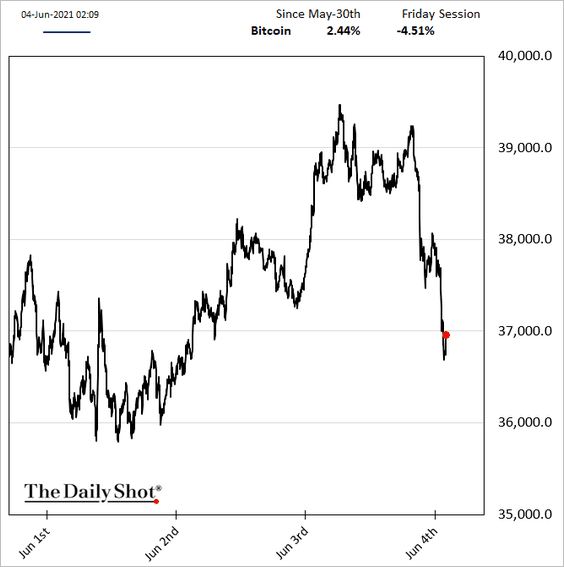
1. Bitcoin is lower after another tweet from our friend Elon.
 Source: MarketWatch Read full article
——————–
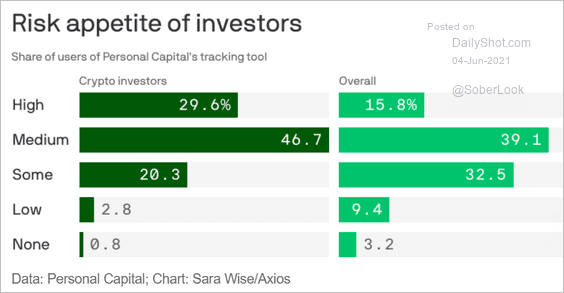
2. This chart shows investor risk appetite for cryptos.
 Source: @axios Read full article
Back to Index
Commodities
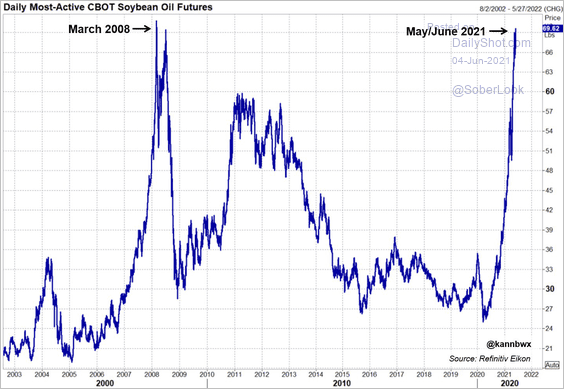
1. Soybean oil continues to rally amid massive demand from global restaurants.
 Source: @kannbwx
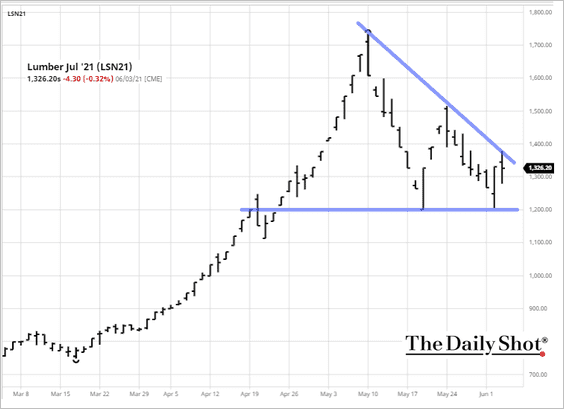
2. A wedge has formed in US lumber futures.
 Source: barchart.com
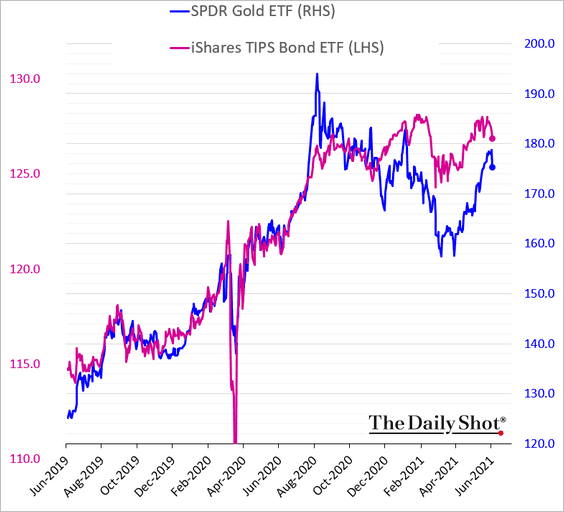
3. Gold and TIPS (inflation-linked Treasuries) are converging again.
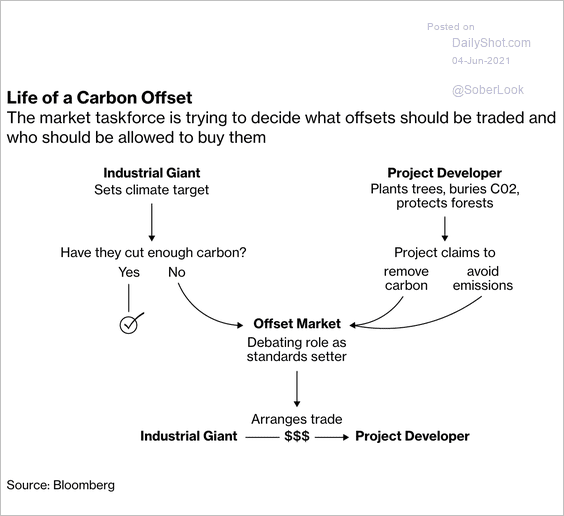
4. How do carbon offset markets work?
 Source: @BBGVisualData Read full article
Back to Index
Energy
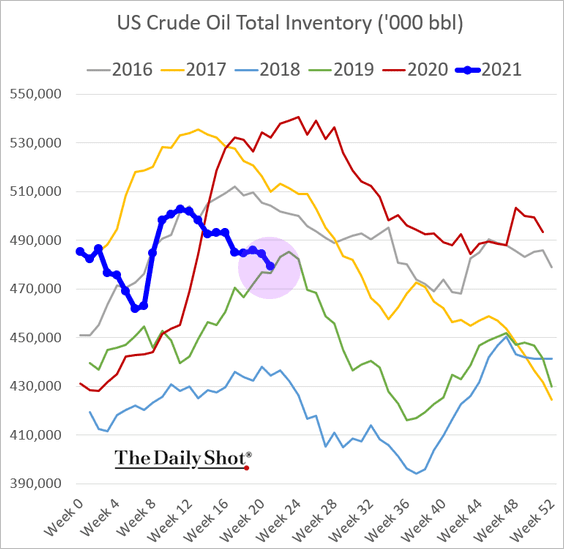
1. US crude oil inventory is now at 2019 levels.
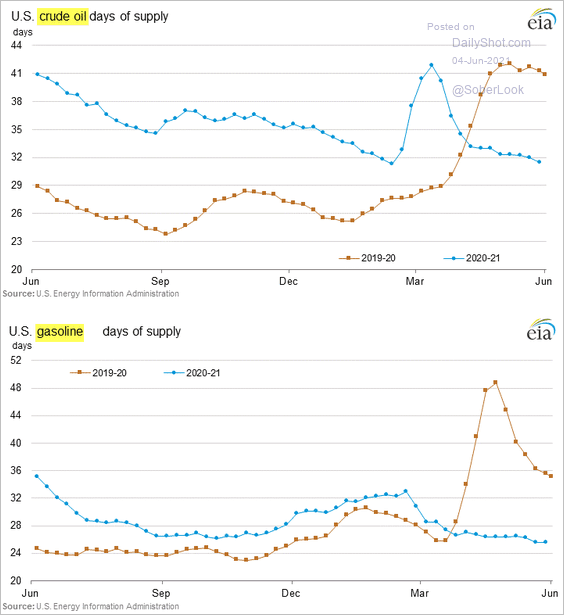
Here is crude and gasoline inventory measured in days of supply.
——————–
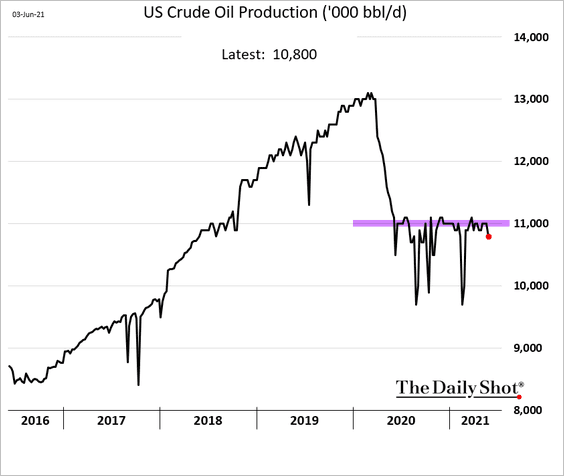
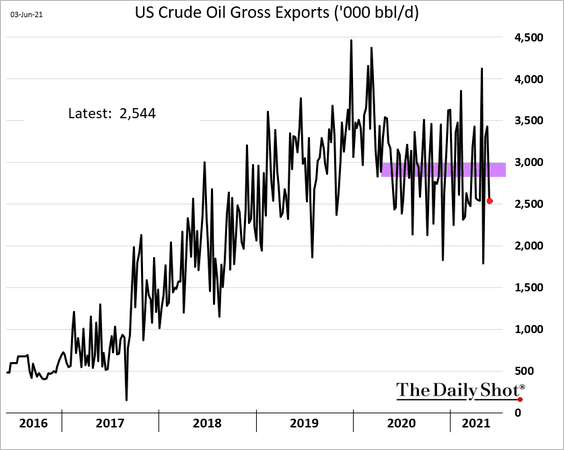
2. US crude oil production has been anchored at 11 million barrels per day.
And gross exports have leveled off at around 3 million barrels per day (average).
——————–
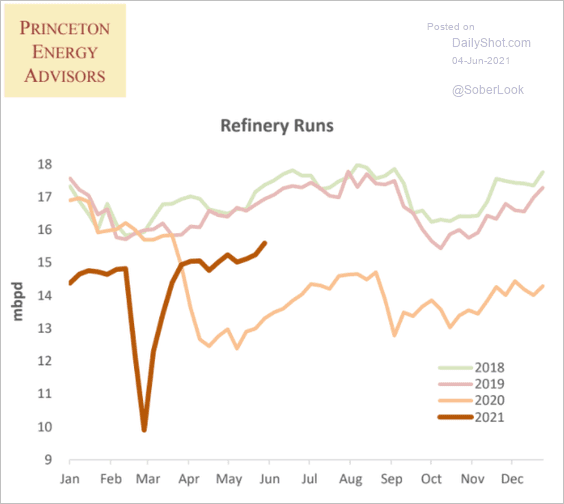
3. US refinery inputs remain well below pre-COVID levels.
 Source: Princeton Energy Advisors
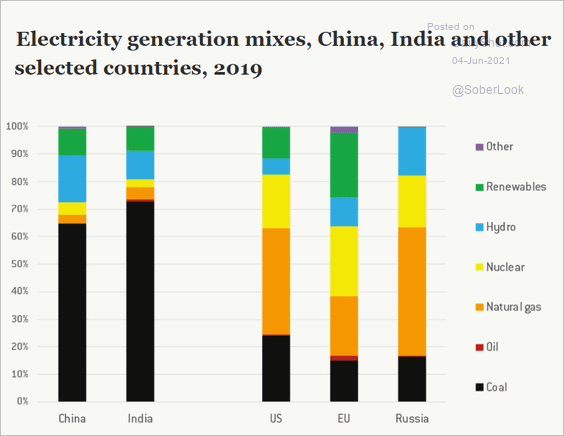
4. This chart shows electricity generation mixes in select countries.
 Source: Bruegel Read full article
Back to Index
Equities
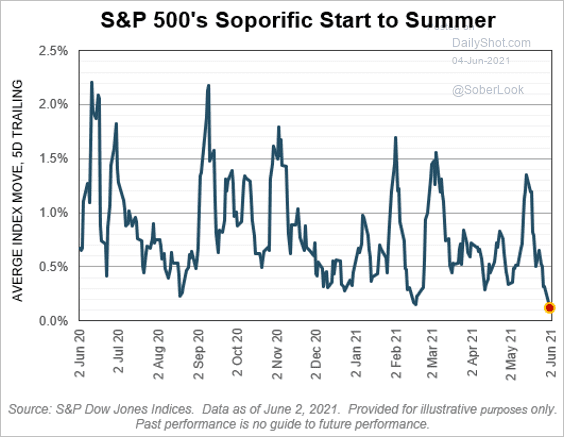
1. Markets have been sleepy lately.
 Source: Tim Edwards, S&P Global Market Intelligence
2. Will the S&P 500 test support at the 50-day moving average this month?
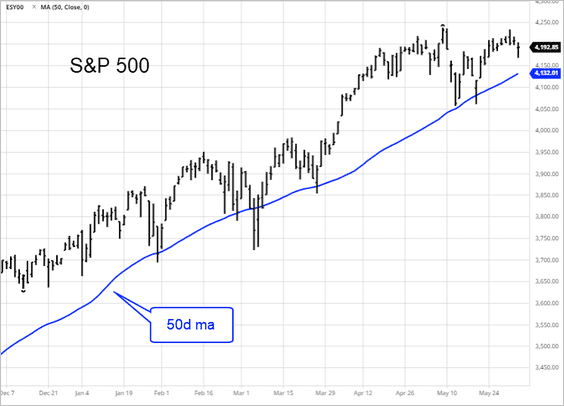 Source: barchart.com
3. Stocks, especially tech (white in the chart below), continue to move with Treasuries (blue) amid QE taper uncertainty.
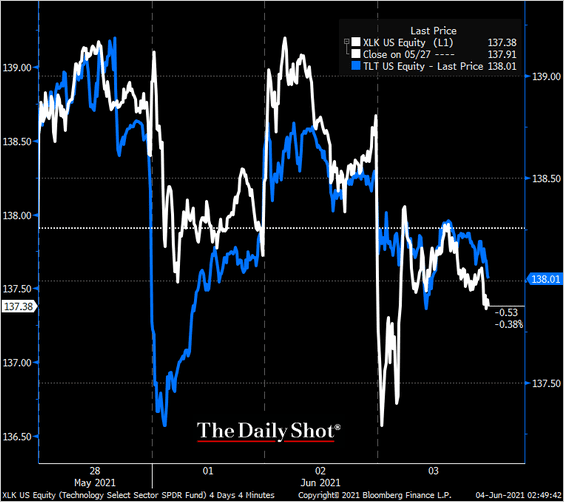 Source: @TheTerminal, Bloomberg Finance L.P.
4. Tech fund outflows in May were the worst since 2018.
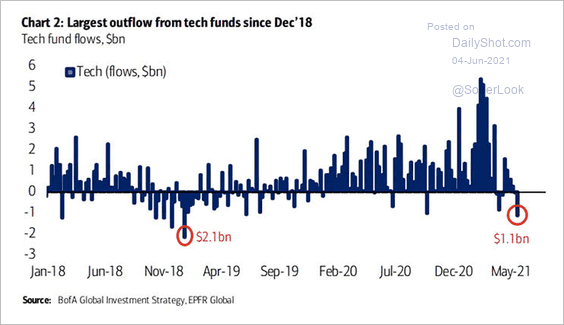 Source: BofA Global Research
5. Earnings revisions breadth hit a record high.
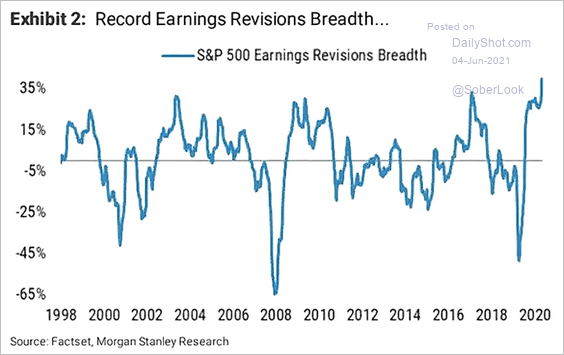 Source: @ISABELNET_SA, @MorganStanley
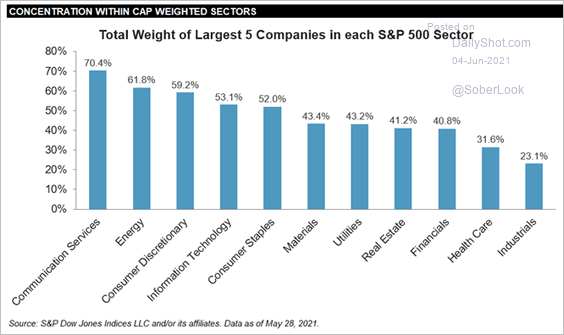
6. Which S&P 500 sectors are most concentrated?
 Source: Tim Edwards, S&P Global Market Intelligence
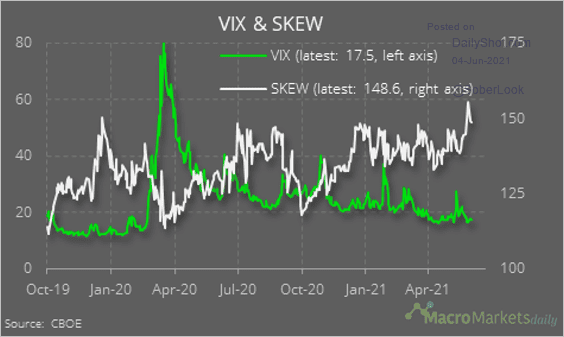
7. During low volatility periods, demand for downside protection (SKEW) typically increases.
 Source: @macro_daily
Back to Index
Credit
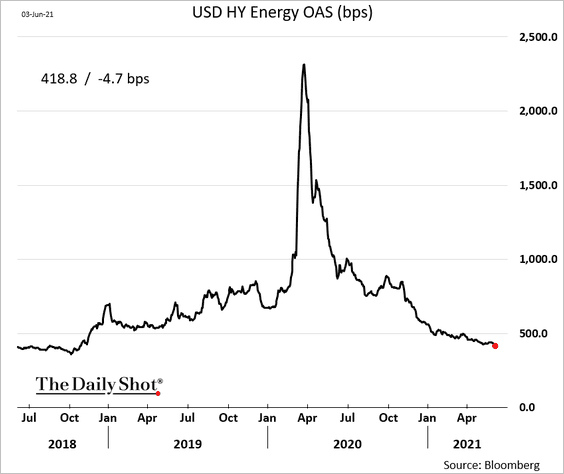
1. Energy-sector high-yield spreads hit the lowest level since 2018.
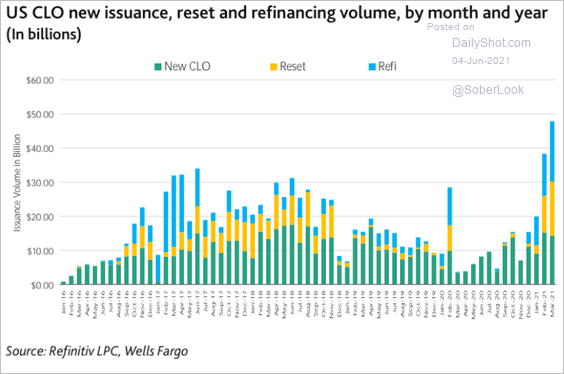
2. US CLO activity has been robust this year.
 Source: Moody’s Investors Service
Back to Index
Rates
1. The US inflation swap curve is highly inverted, partially due to strong backwardation in crude oil.
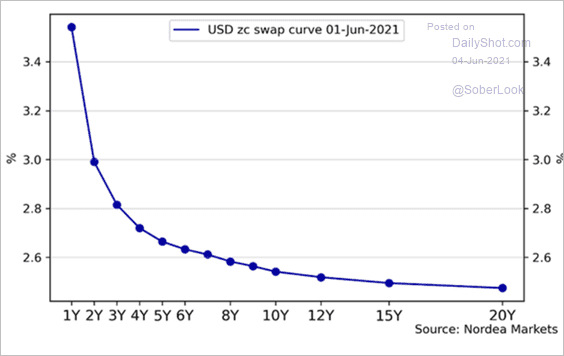 Source: Nordea Markets
2. The Fed will have the ability to quickly shrink its bond portfolio without selling any securities (just letting them mature).
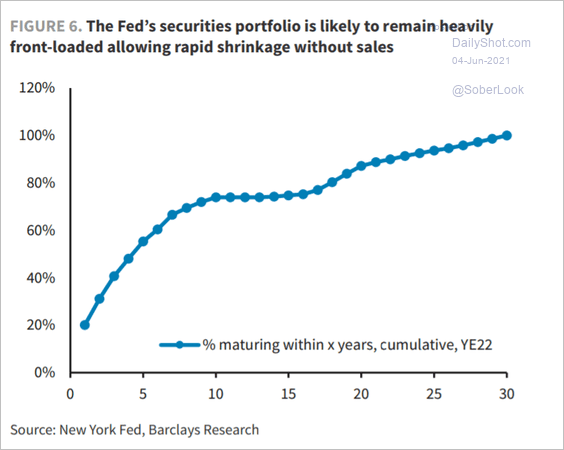 Source: Barclays Research
3. This chart shows US 10yr Treasury yields vs. other advanced economies (since 1870).
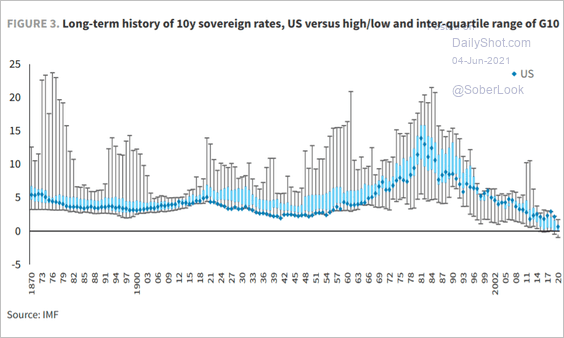 Source: Barclays Research
Back to Index
Global Developments
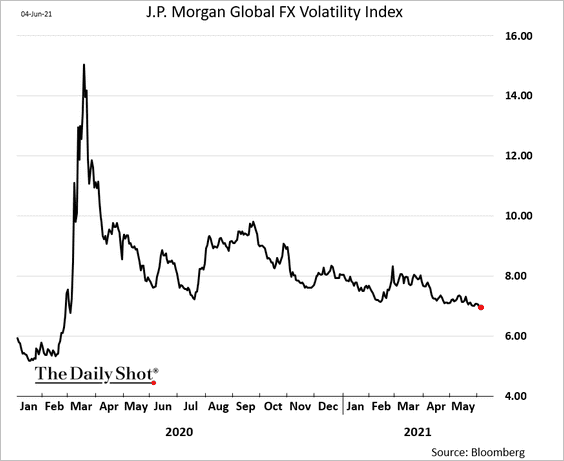
1. Currency markets’ implied volatility continues to drift lower.
2. The combination of higher inflows into US securities and a marginal shift in implied rate expectations could be positive for the dollar (2 charts).
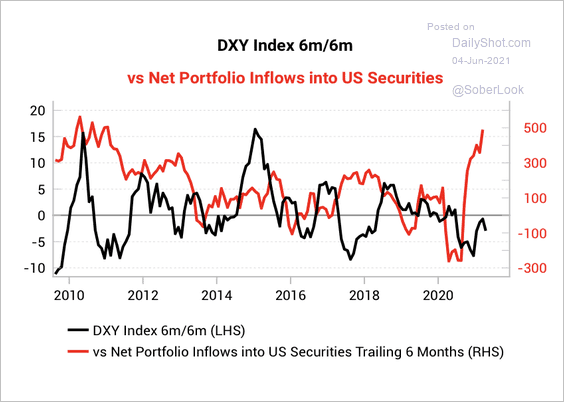 Source: Variant Perception
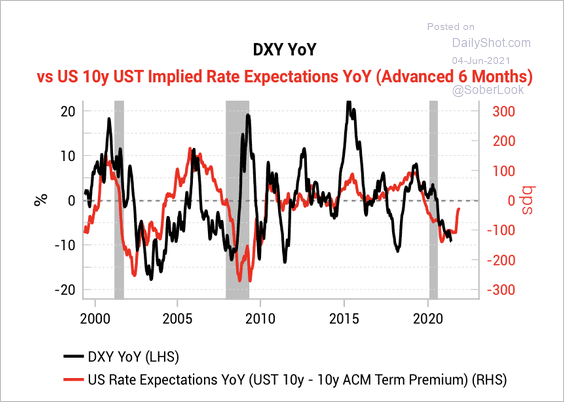 Source: Variant Perception
——————–
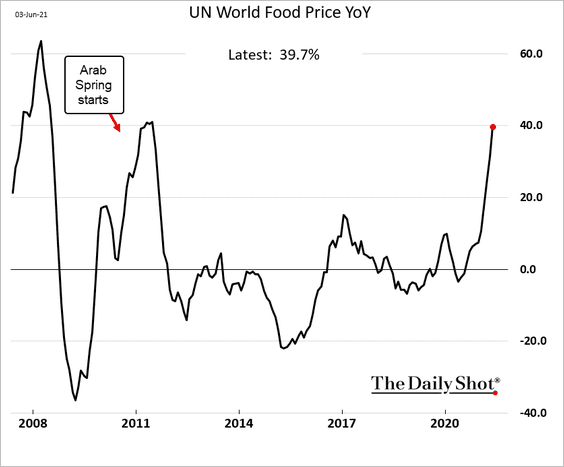
3. Get ready for rising mass protests around the world. Global food prices are up 40% from a year ago.
Back to Index
Food for Thought
1. US car models worst hit by chip shortages:
 Source: Statista
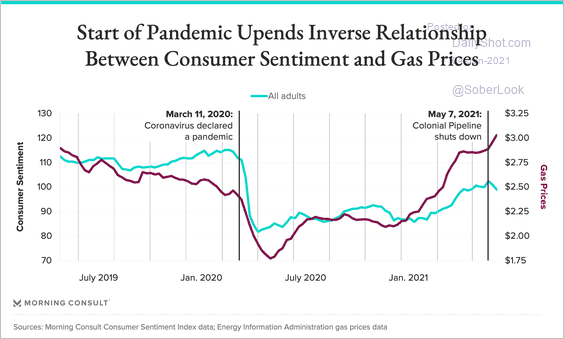
2. US consumer sentiment vs. gas prices:
 Source: Morning Consult Read full article
3. Household wealth by generation:
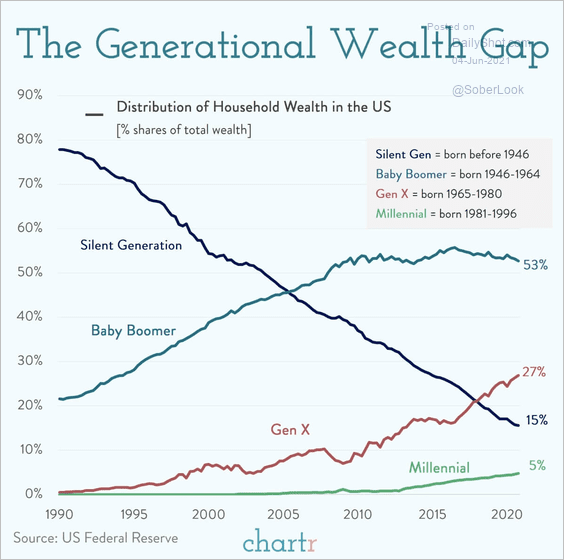 Source: @chartrdaily
4. The most expensive toll roads:
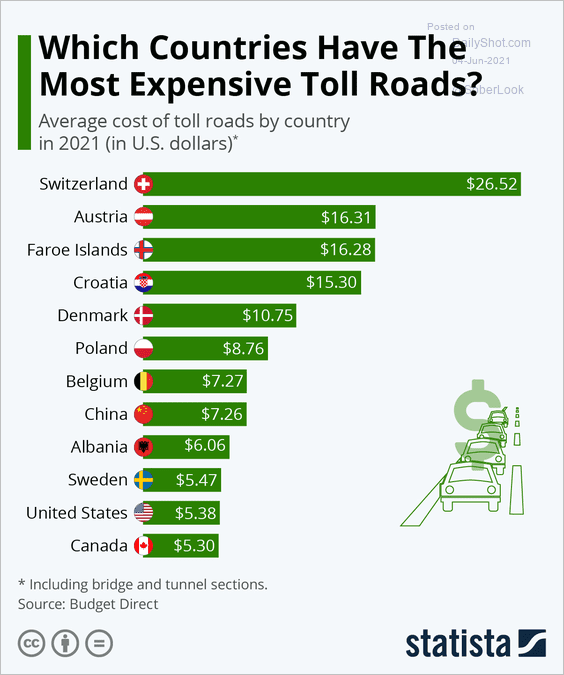 Source: Statista
5. Pandemic-related productivity acceleration potential:
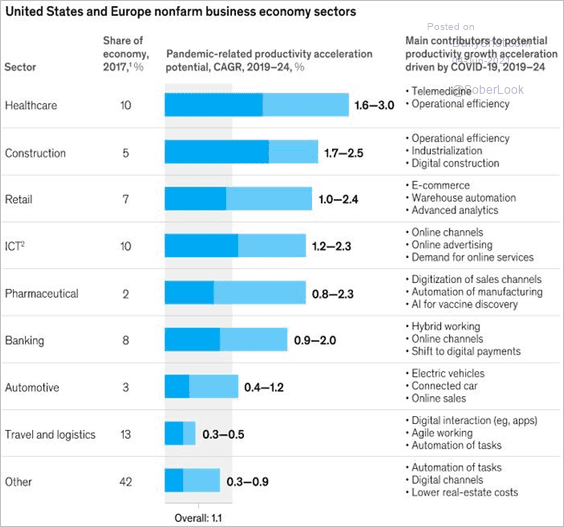 Source: McKinsey Global Institute, h/t Garrett Roche Read full article
6. Views on the lab-leak theory:
 Source: @YouGovAmerica Read full article
7. COVID deaths vs. obesity rates:
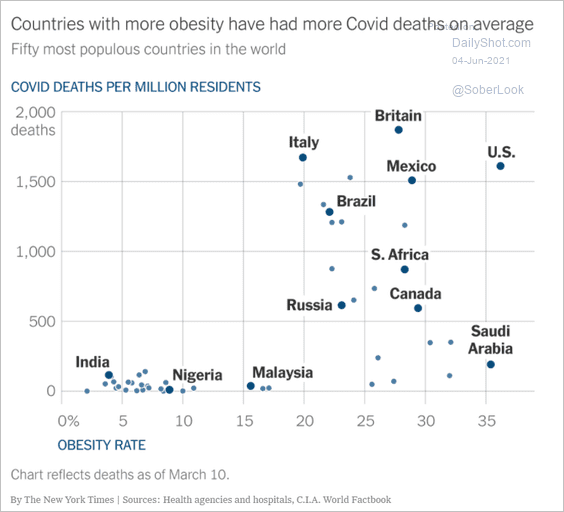 Source: The New York Times Read full article
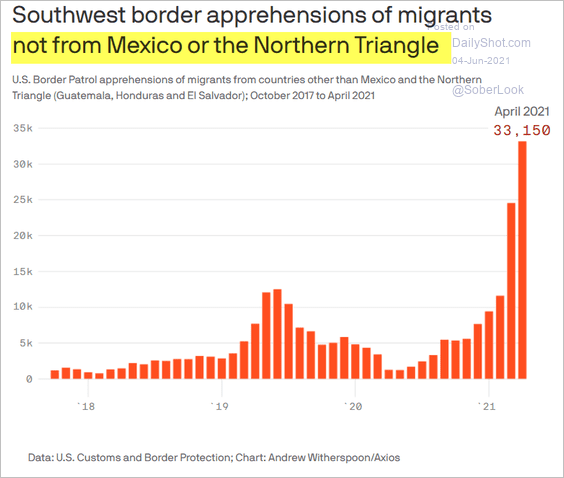
8. US migrants who are not from Mexico or the Northern Triangle:
 Source: @axios Read full article
9. Remembering D-Day:
• Departure points:
 Source: historyextra.com Read full article
• Taking territory:
 Source: BBC Read full article
• D-Day data:
 Source: D-Day Overlord Read full article
——————–
Have a great weekend!
Back to Index