
The Daily Shot: 07-Jun-21
• The United States
• Canada
• The United Kingdom
• The Eurozone
• Europe
• Asia – Pacific
• China
• Emerging Markets
• Cryptocurrency
• Equities:
• Global Developments
• Food for Thought
The United States
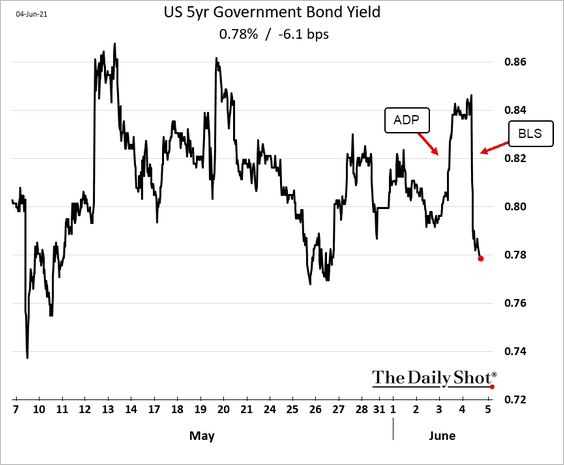
1. The May jobs report came in below economists’ forecasts.
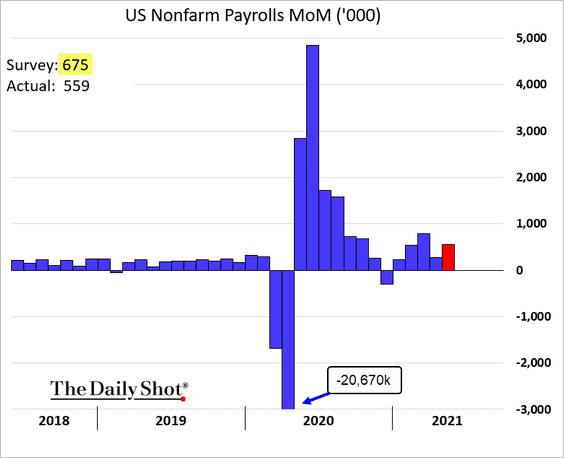
As we saw last month, there is no shortage of demand for labor. Instead, job growth is constrained by supply, …
 Source: ING
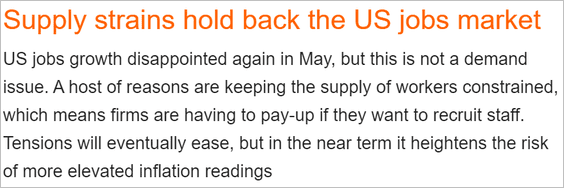
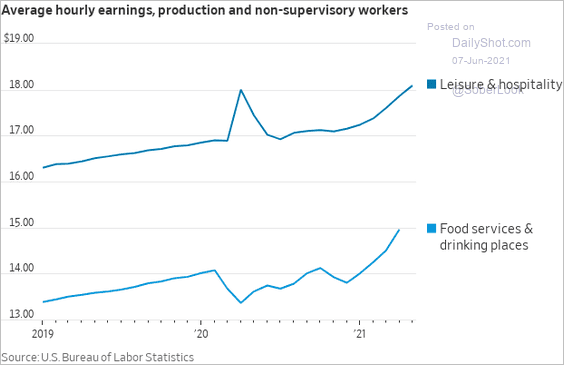
… which is pushing wages higher in some sectors (2 charts).
 Source: Jeffrey Sparshott, @WSJ Read full article
 Source: BofA Global Research
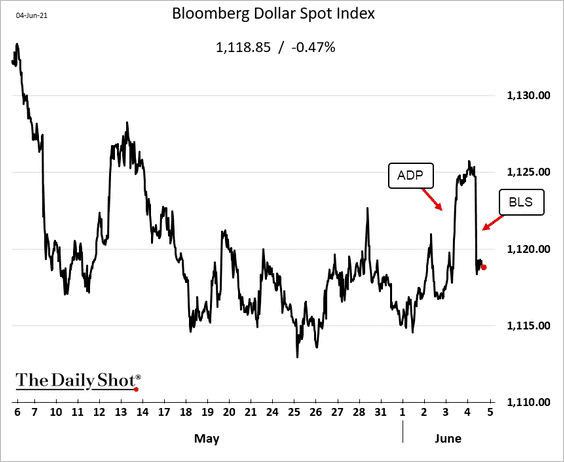
Nonetheless, bond yields and the dollar reversed Thursday’s gains.
——————–
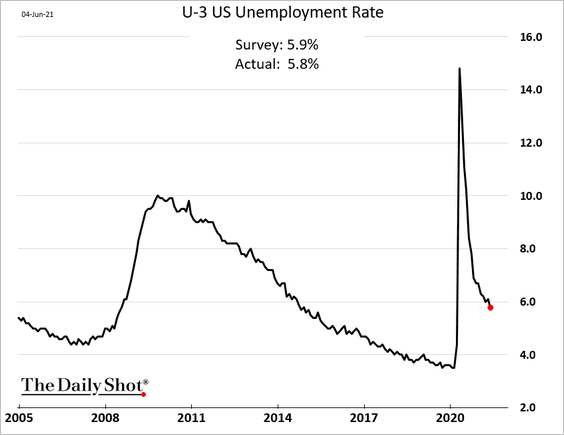
• The unemployment rate dipped below 6%.
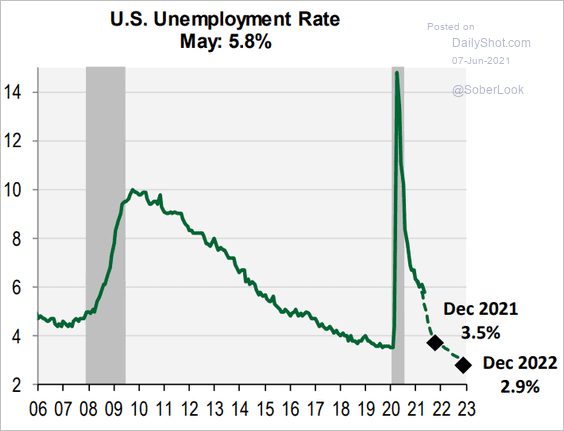
Cornerstone Macro expects the labor market to keep tightening, with the unemployment rate hitting 2.9% by the end of next year.
 Source: Cornerstone Macro
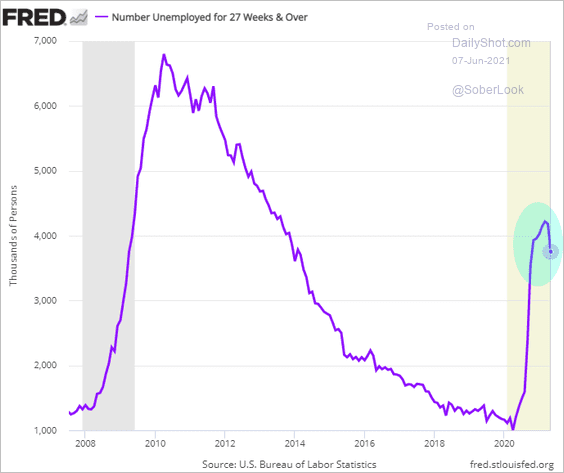
• Long-term unemployment appears to have peaked.
• The labor force participation rate remains depressed (2 charts).
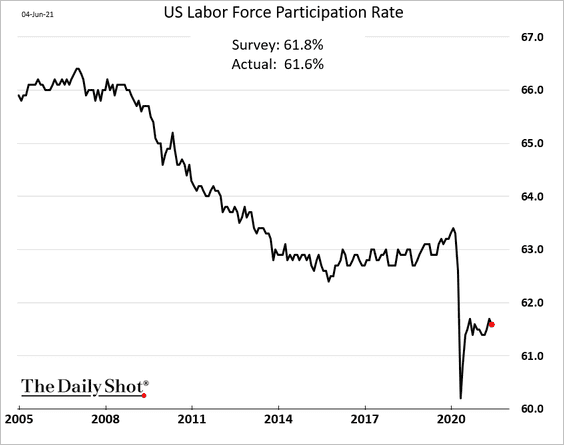
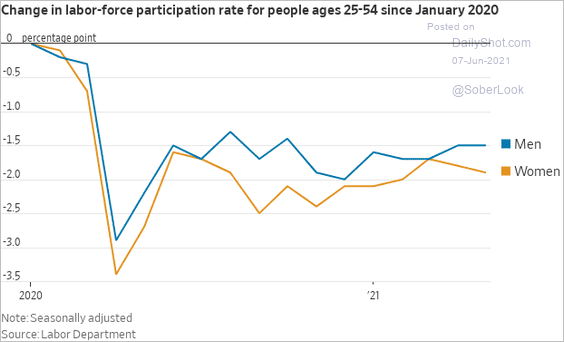 Source: Jeffrey Sparshott, @WSJ Read full article
• Below are some additional labor-market trends.
– Hours worked:
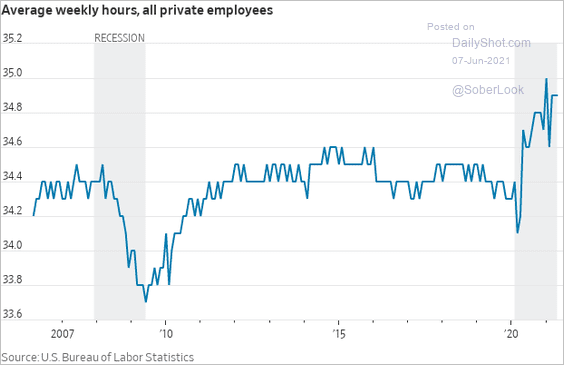 Source: Jeffrey Sparshott, @WSJ Read full article
– Lost payrolls vs. job openings:
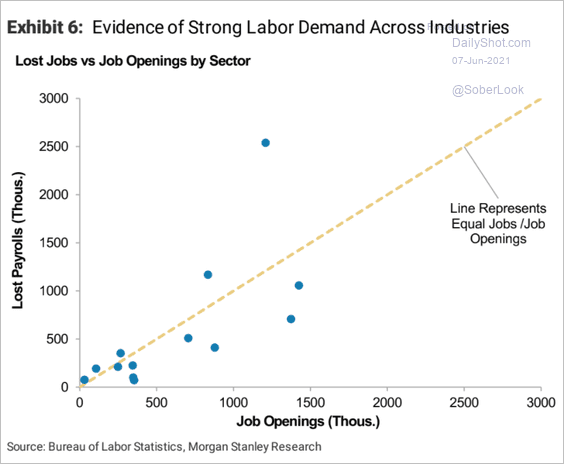 Source: Morgan Stanley Research
– Teen employment:
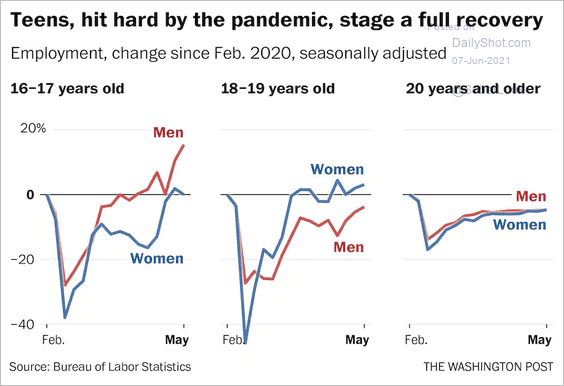 Source: The Washington Post Read full article
– Teen unemployment (lowest since 1953):
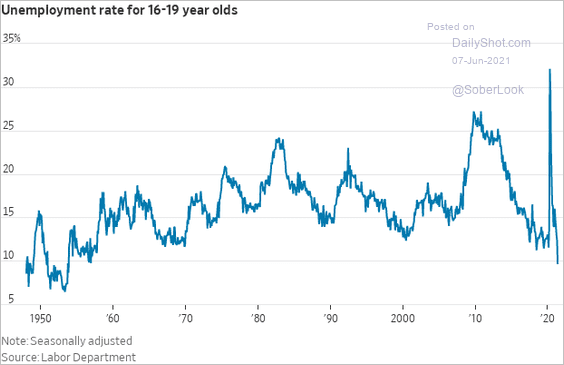 Source: Jeffrey Sparshott, @WSJ Read full article
– Employment recovery by wage category:
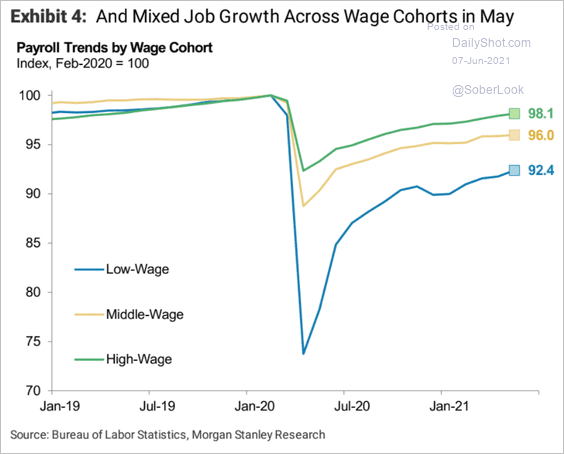 Source: Morgan Stanley Research
– Job gains by sector (the loss in construction jobs was all in the non-residential sector):
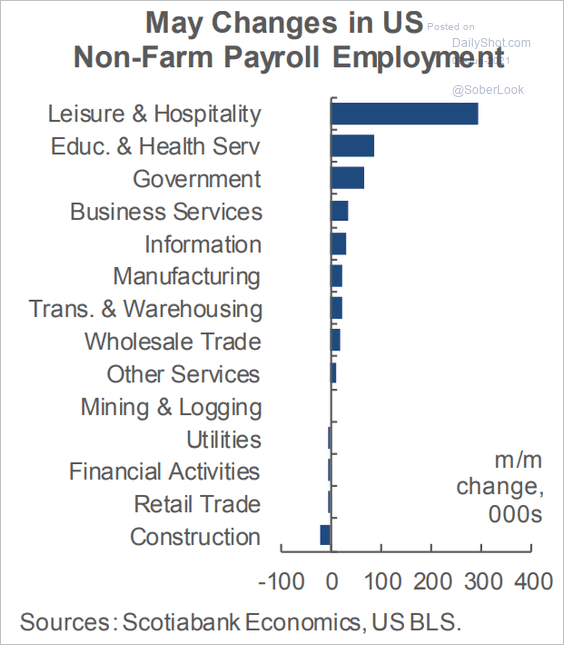 Source: Scotiabank Economics
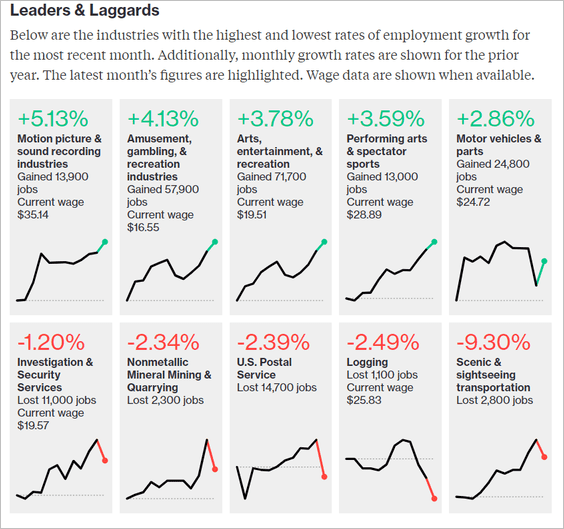 Source: @bbgvisualdata Read full article
– Current payrolls vs. the 2008 recovery:
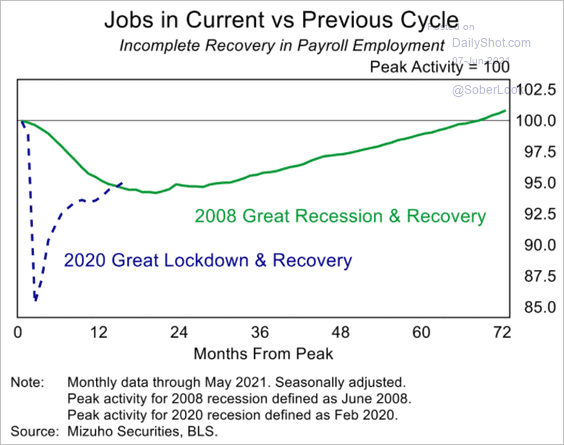 Source: Mizuho Securities USA
… and vs. the pre-COVID trend:
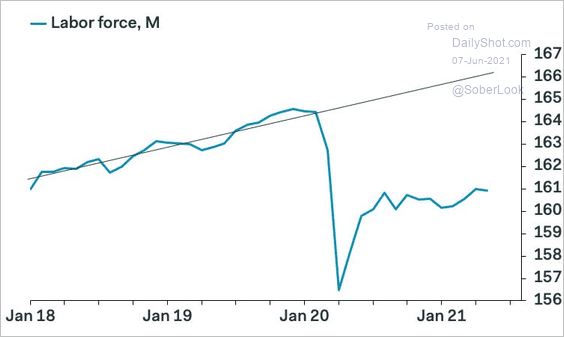 Source: Pantheon Macroeconomics
Will deteriorating demographics (aging population, low birth rates, and low immigration rates) keep US job gains from ever reaching the pre-COVID trend?
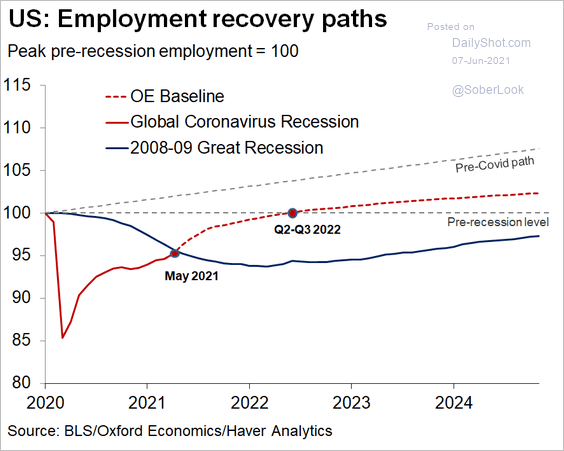 Source: @GregDaco
——————–
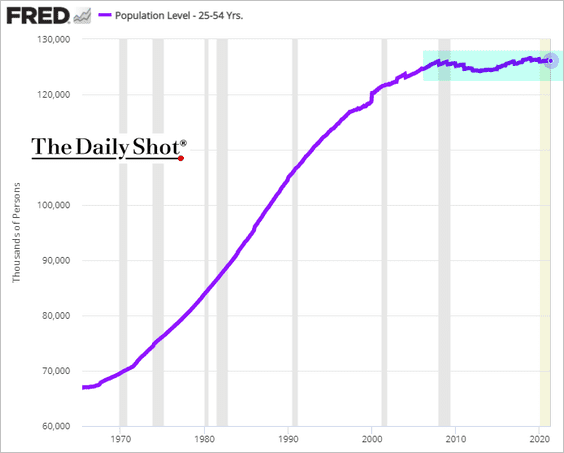
2. The prime-age population has been flat since 2007.
3. Consumer spending is still near 20% higher than 2019 levels.
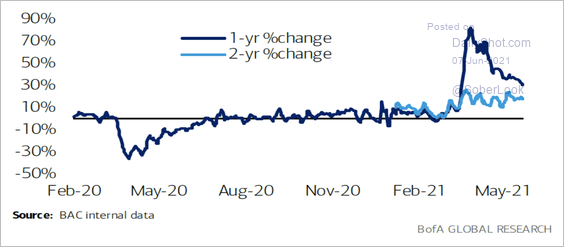 Source: BofA Global Research
4. The partisan gap in consumer confidence remains wide.
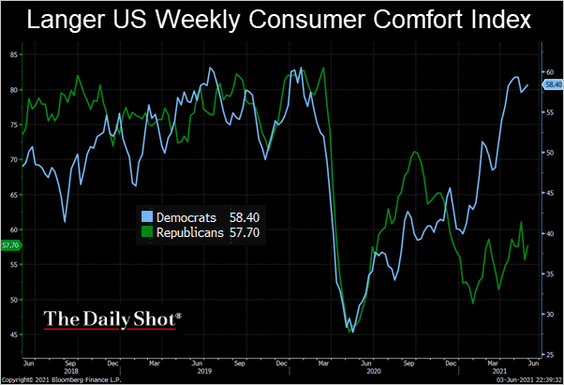 Source: @TheTerminal, Bloomberg Finance L.P.
5. High-frequency indicators continue to trend up.
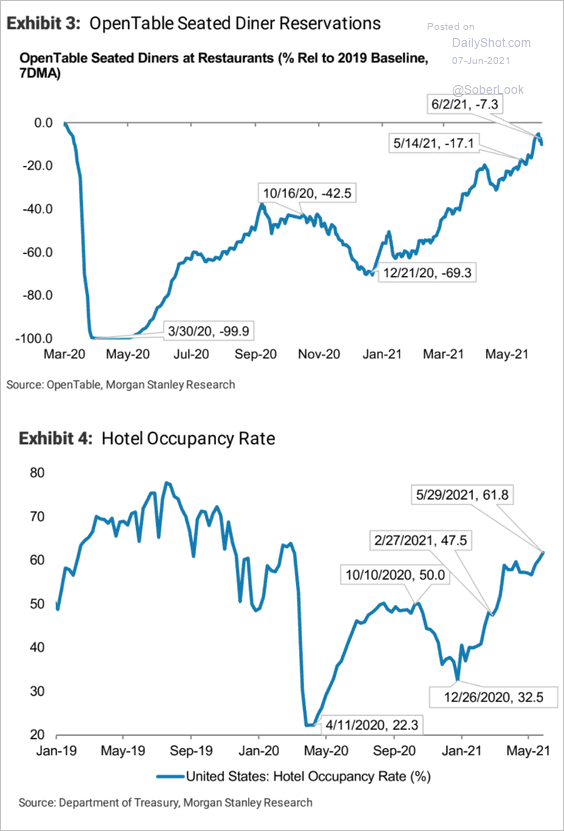 Source: Morgan Stanley Research
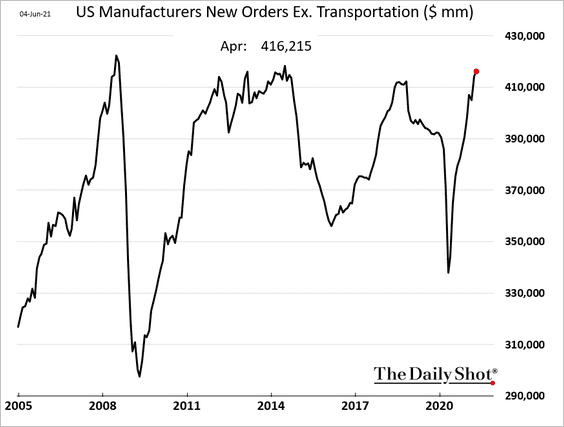
6. April factory orders hit the highest level since early 2014.
7. Next, we have some updates on the housing market.
• Condo vs. single-family unit home price appreciation:
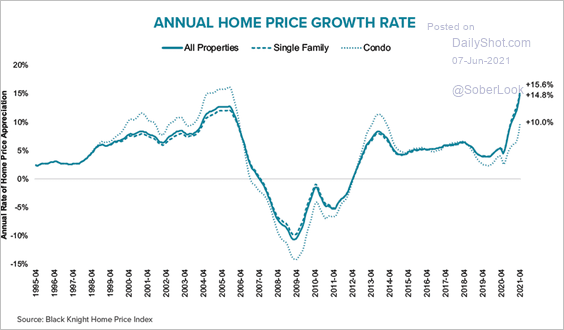 Source: Black Knight Technologies
• Home price appreciation by state:
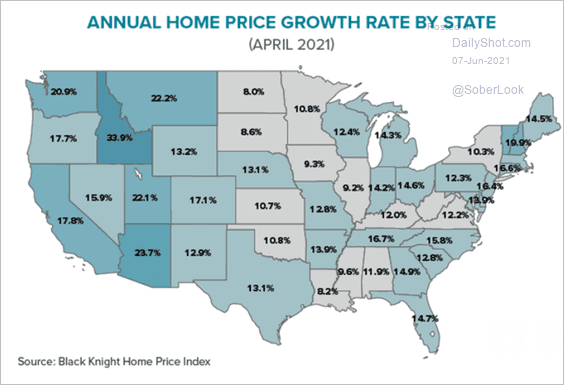 Source: Black Knight Technologies
• The home-price-to-rent ratio:
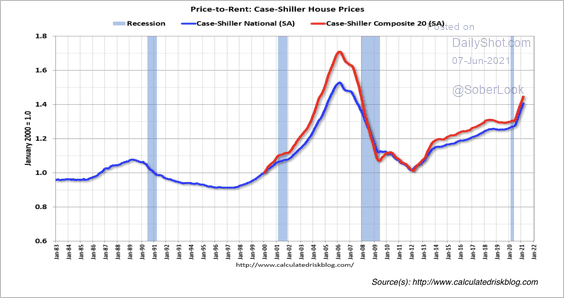 Source: Calculated Risk
• Home price appreciation by price category:
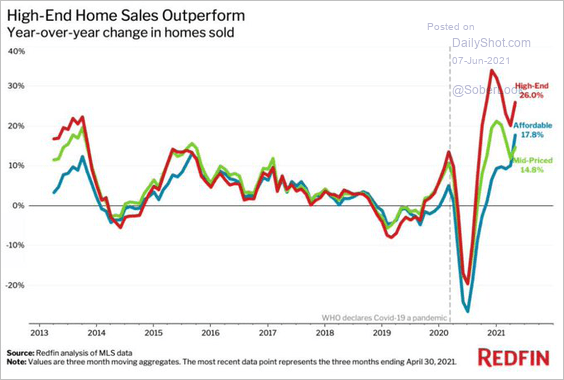 Source: @LizAnnSonders, @Redfin
Back to Index
Canada
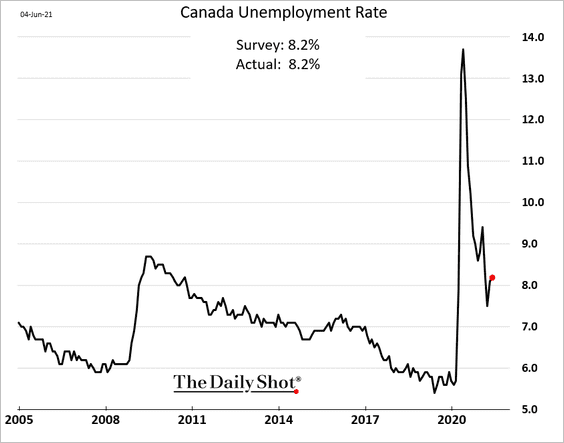
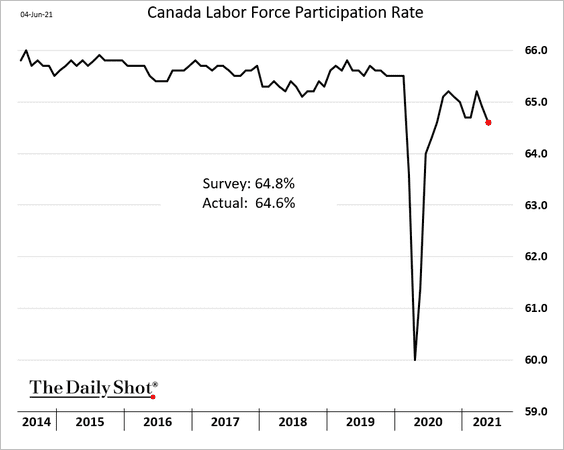
1. The May employment report was disappointing.
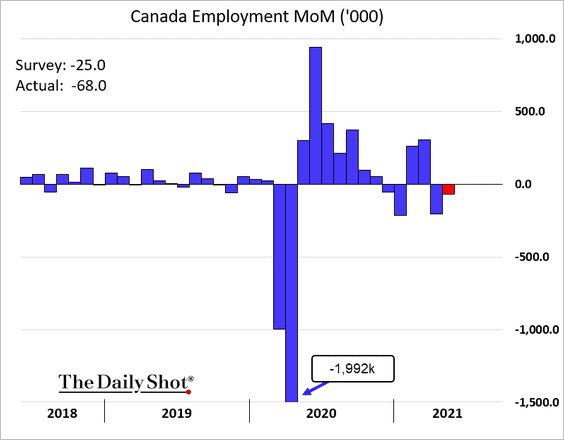
The unemployment rate ticked higher again.
And the participation rate declined.
Here are the changes by sector.
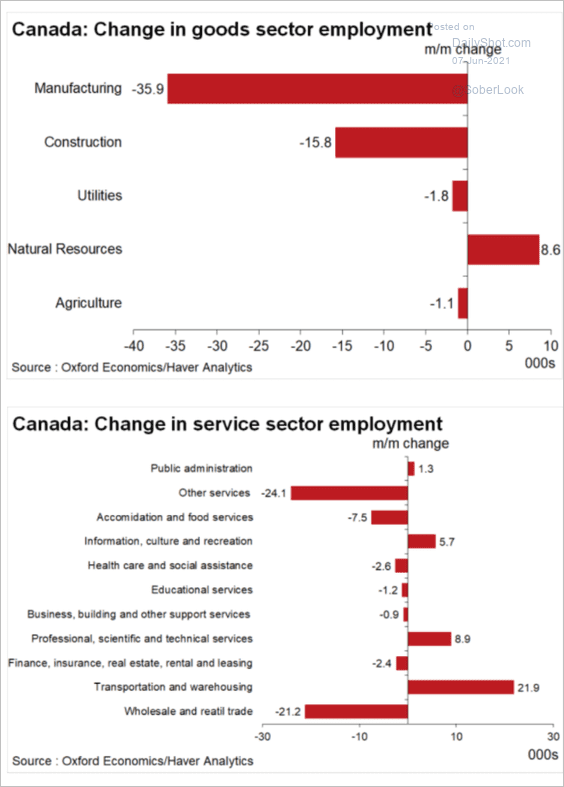 Source: Oxford Economics
——————–
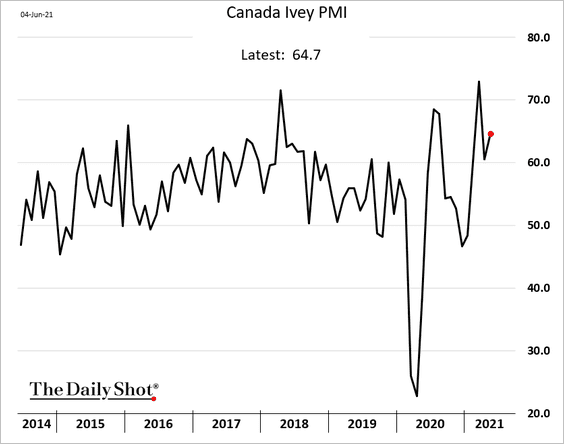
2. The Ivey PMI shows that business activity remained robust in May.
3. The BoC has funded nearly the entire budget deficit.
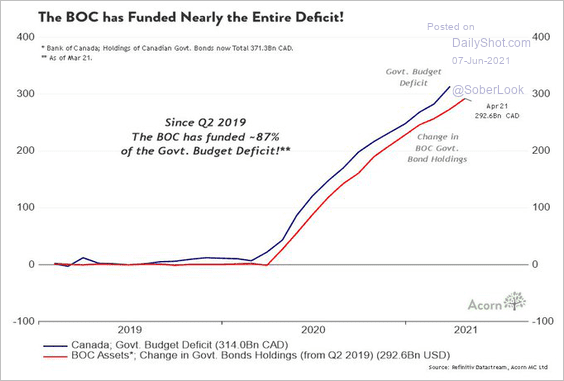 Source: @RichardDias_CFA
4. Canada has become the global leader in vaccinations.
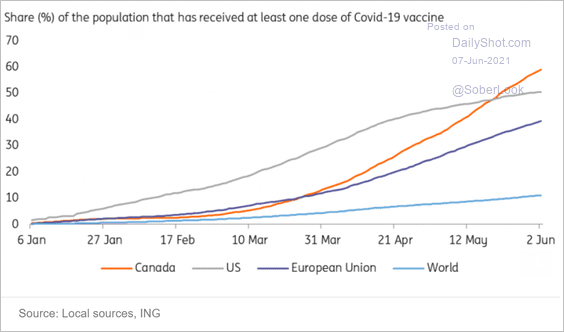 Source: ING
Back to Index
The United Kingdom
1. Construction activity accelerated in May.
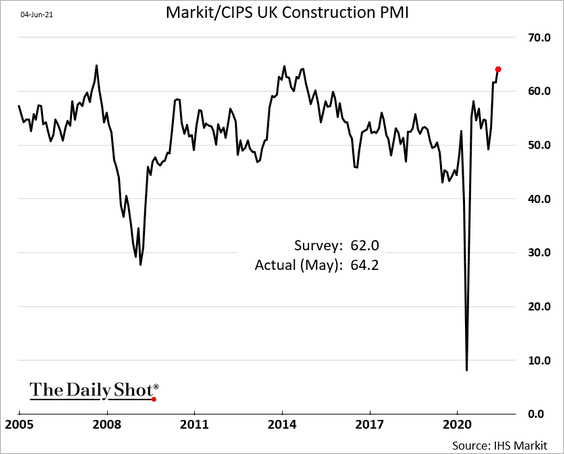
But construction input costs are soaring.
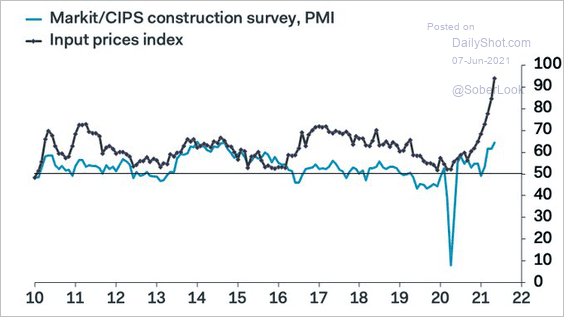 Source: @samueltombs
——————–
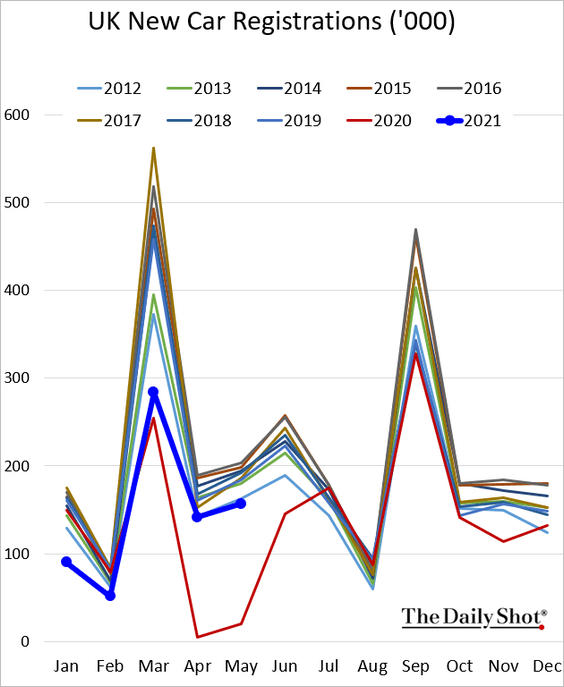
2. New car registrations remain weak, now running below 2012 levels.
Back to Index
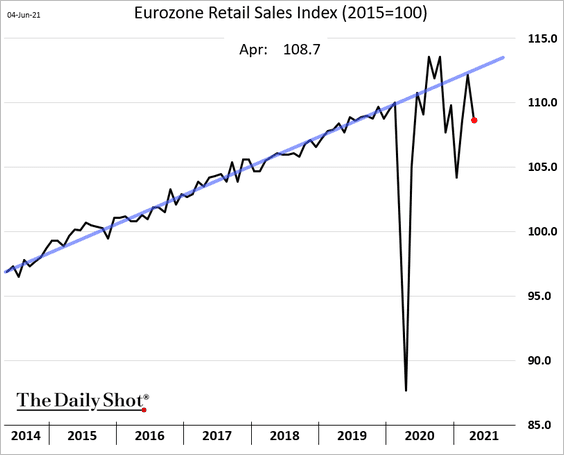
The Eurozone
1. Retail sales declined in April and are well below the pre-COVID trend.
Here is the gap with online sales.
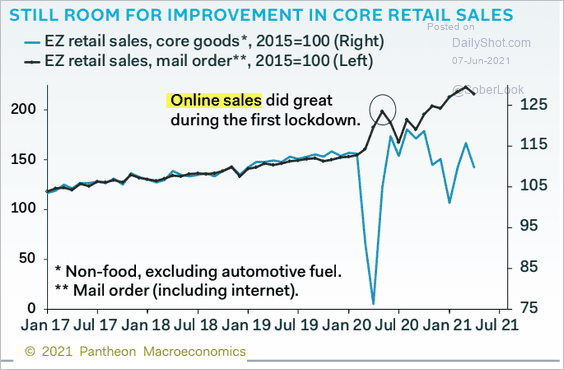 Source: Pantheon Macroeconomics
2. The ECB’s securities purchases have accelerated.
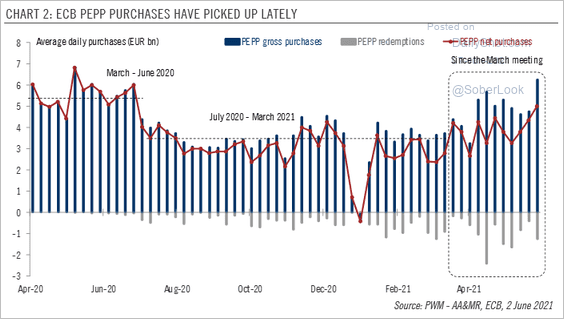 Source: @fwred
Will the central bank maintain the current pace through the end of the program?
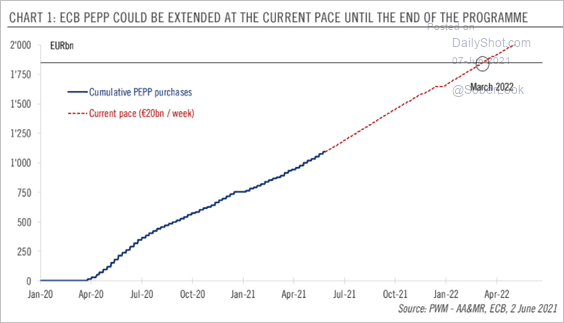 Source: @fwred
——————–
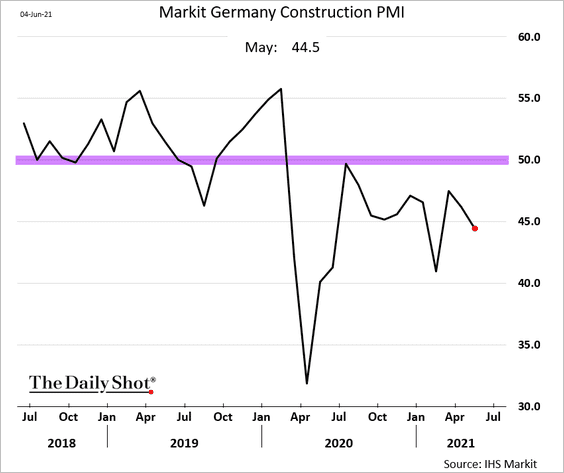
3. Next, we have some updates on Germany.
• Construction activity continues to shrink (PMI < 50).
• German car output deteriorated in May as a result of chip shortages.
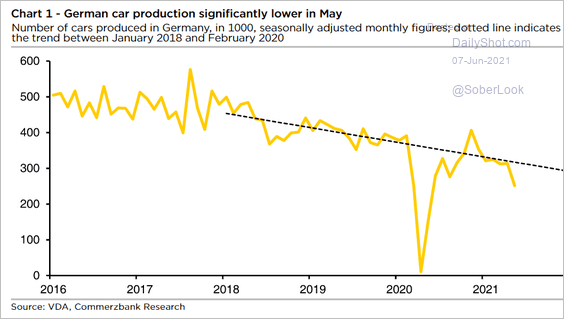 Source: Commerzbank Research
• Most Germans are not too concerned about sustainable shipping.
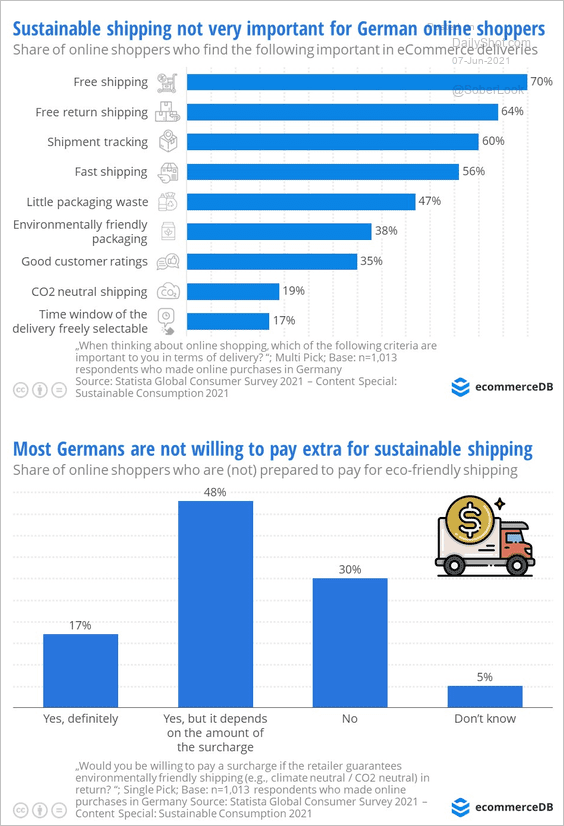 Source: ecommerceDB Read full article
——————–
4. Here is a forecast for Italy’s GDP growth from Oxford Economics (NGEU = EU’s recovery plan).
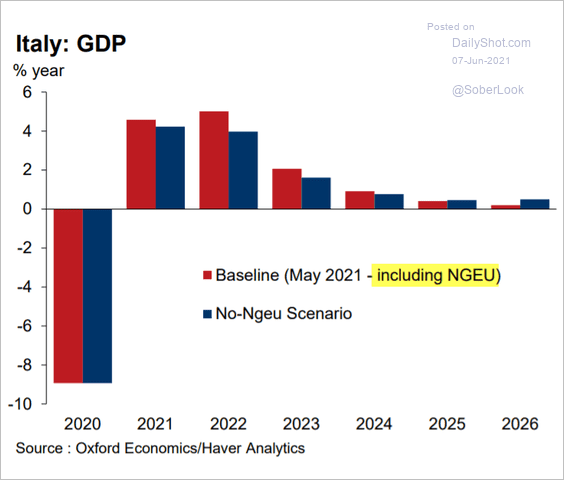 Source: Oxford Economics
5. This scatterplot shows public budget balance vs. public debt.
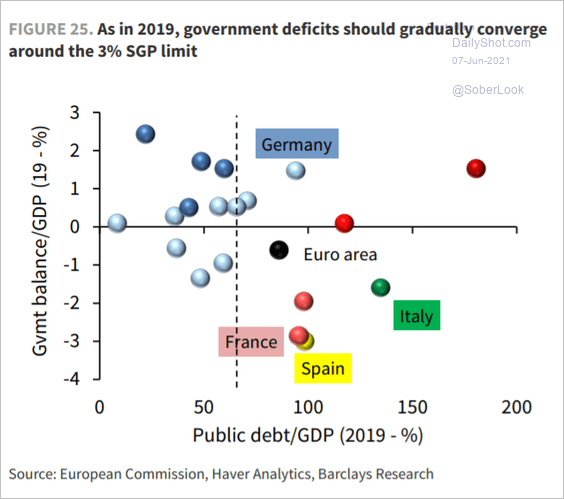 Source: Barclays Research
Back to Index
Europe
1. European equity funds are enjoying significant capital inflows.
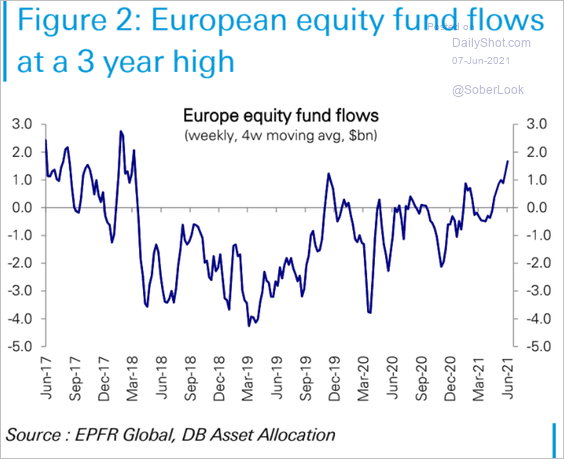 Source: Deutsche Bank Research
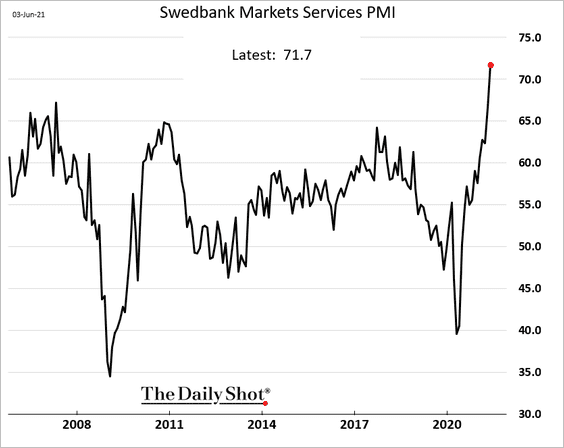
2. Sweden’s services PMI hit a new high.
3. About a third of European bank credit is exposed to potential losses as a result of climate change.
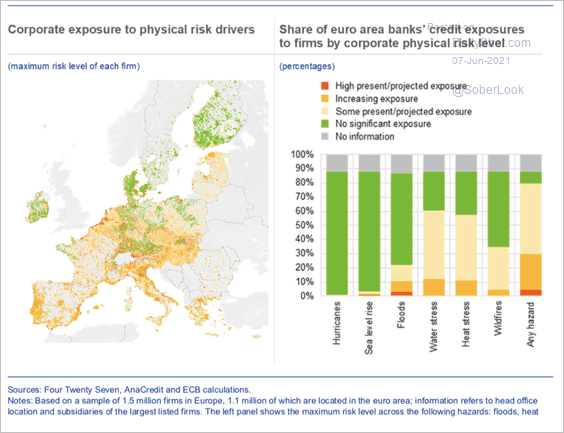 Source: ECB
4. This chart shows new cars per 1,000 inhabitants:
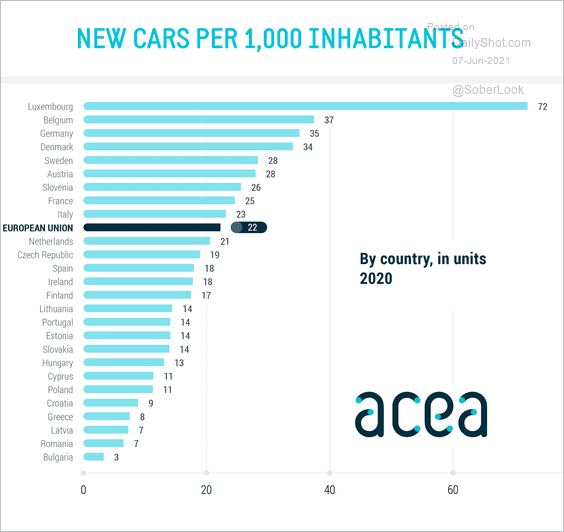 Source: @ACEA_auto
5. Next, we have some data on healthcare costs.
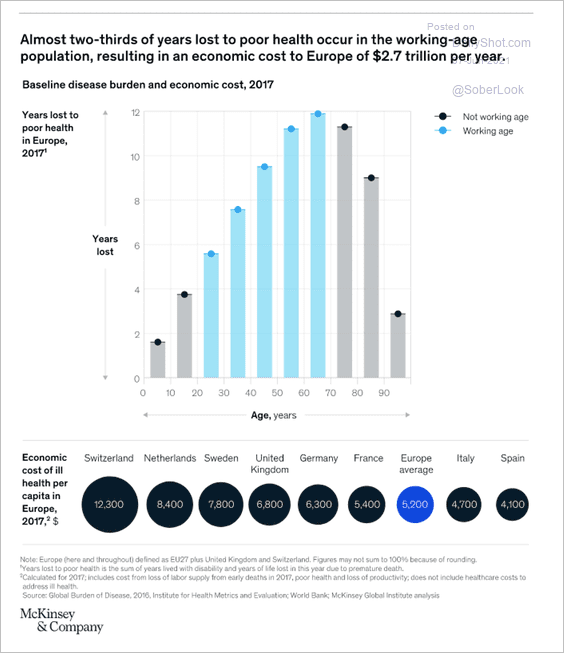 Source: McKinsey & Company
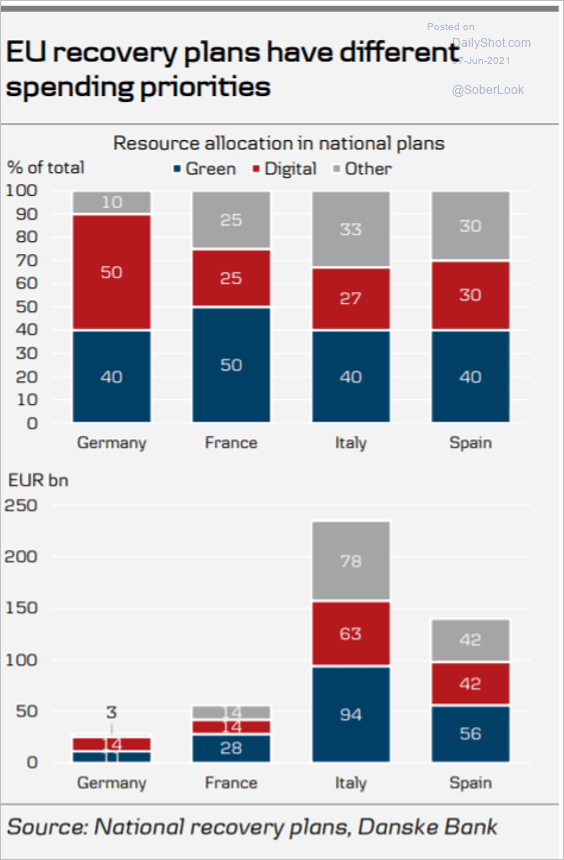
6. What will be the impact of the EU’s recovery plan on the GDP (and how will the funds be spent – 3 charts)?
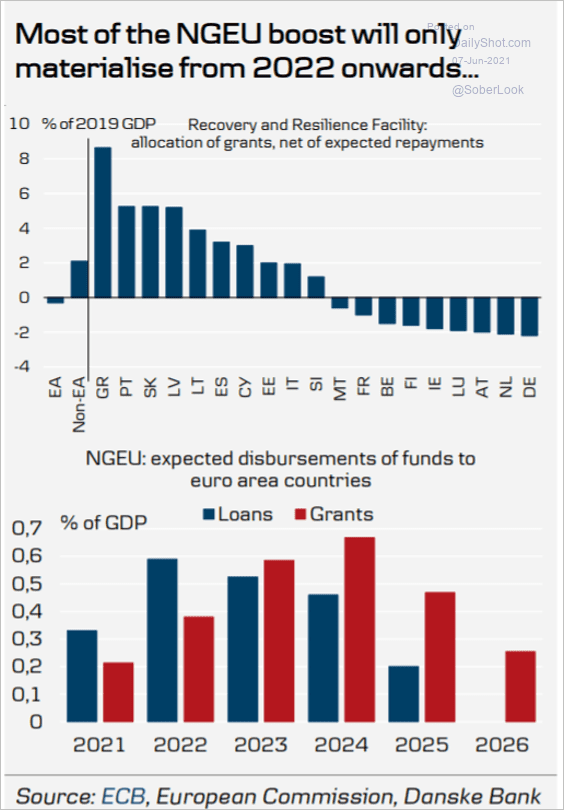 Source: Danske Bank
 Source: Danske Bank
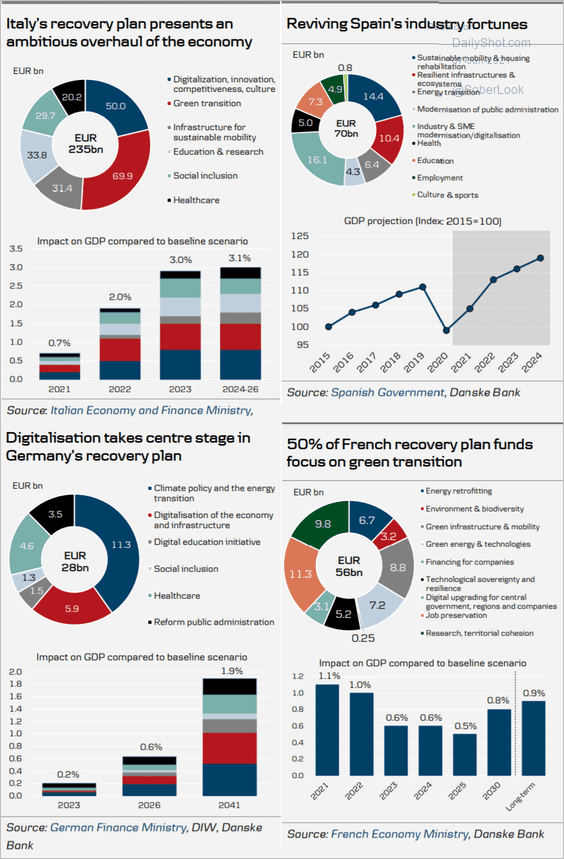 Source: Danske Bank
——————–
7. Here is the European Regional Social Progress Index.
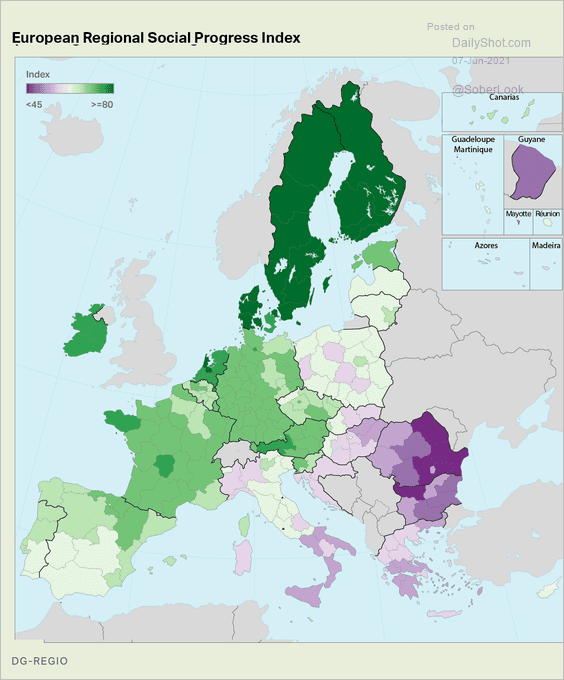 Source: Gallup Read full article
Back to Index
Asia – Pacific
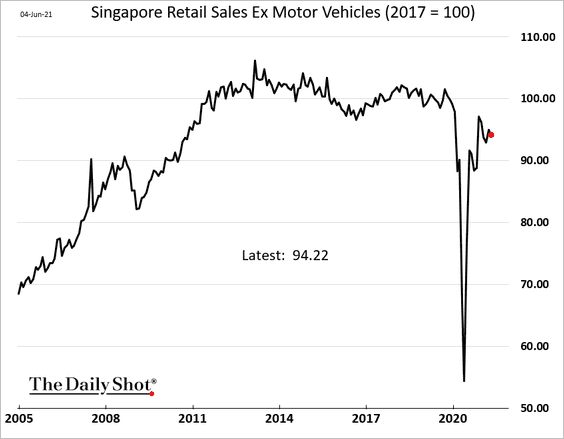
1. Singapore’s retail sales remain below pre-COVID levels.
2. Job ads are surging in Australia, pointing to lower unemployment ahead.
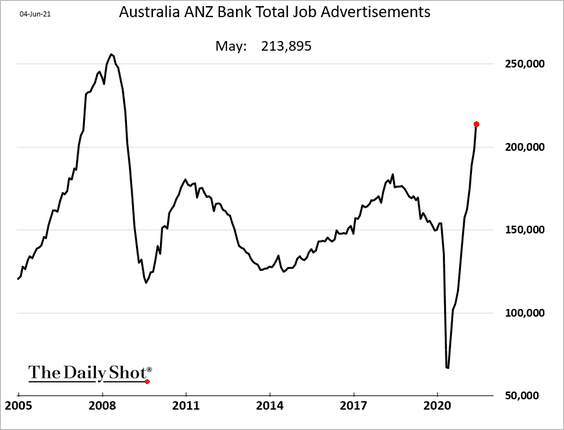
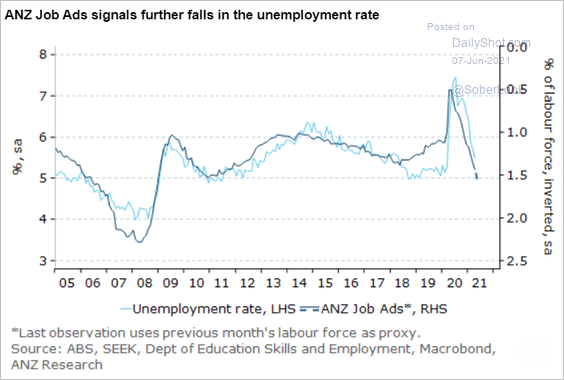 Source: ANZ Research
Back to Index
China
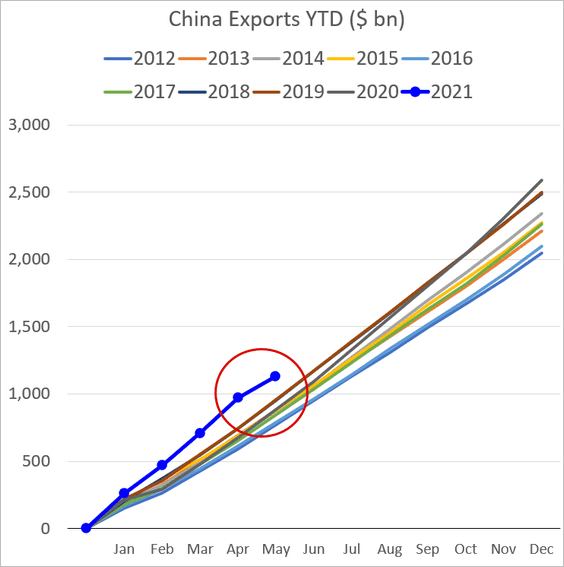
1. Exports were weaker than expected last month.
2. A decline in China’s social financing typically coincides with a slowdown in manufacturing activity and lower commodity prices.
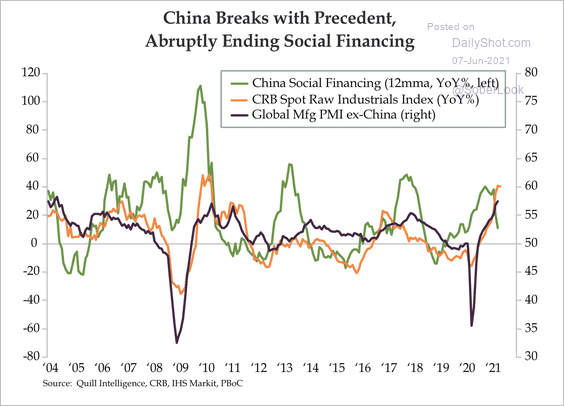 Source: Quill Intelligence
3. Credit spreads have tightened.
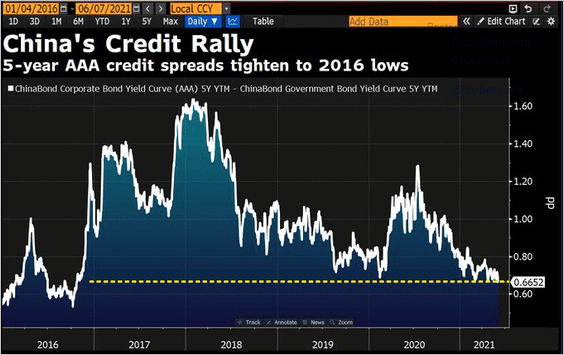 Source: @DavidInglesTV
4. China’s nuclear power capacity remains relatively low.
![]() Source: Barclays Research
Source: Barclays Research
5. Here is the ratio of urban workers’ income and consumption to that of rural workers.
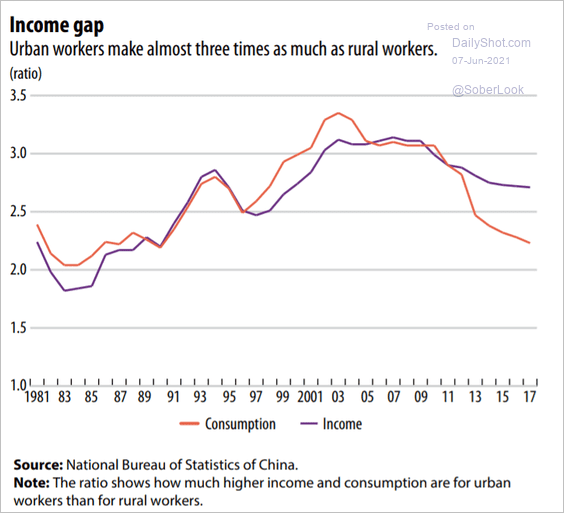 Source: IMF Read full article
6. Hong Kong’s home price appreciation has stalled.
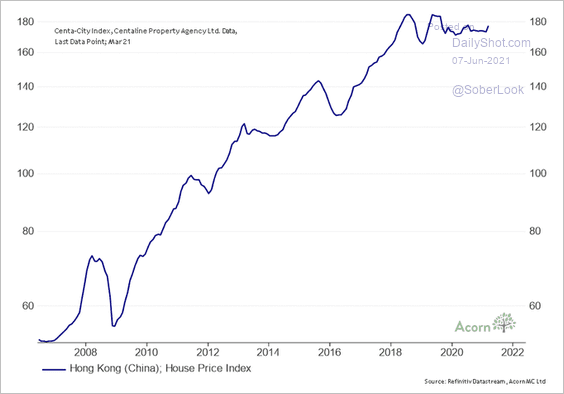 Source: @RichardDias_CFA
7. Hong Kong’s IPO activity had the worst month since 2009.
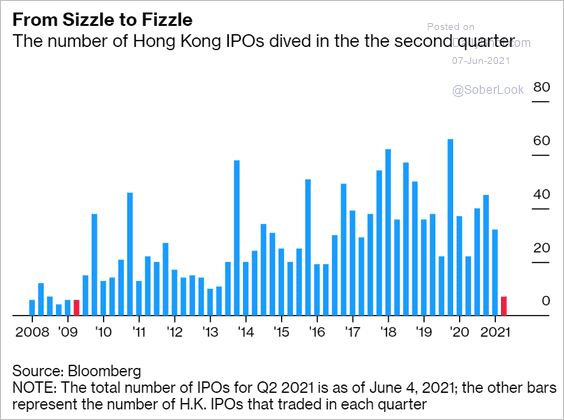 Source: @markets Read full article
Back to Index
Emerging Markets
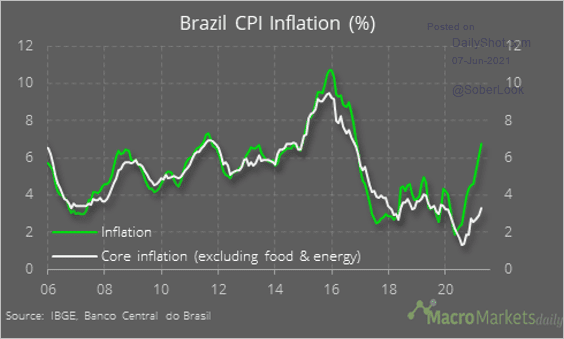
1. Brazil’s service sector contraction slowed in May.
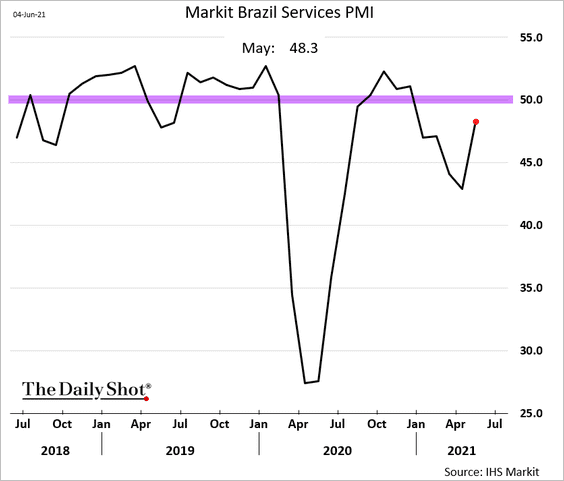
Core inflation remains relatively low.
 Source: @macro_daily
——————–
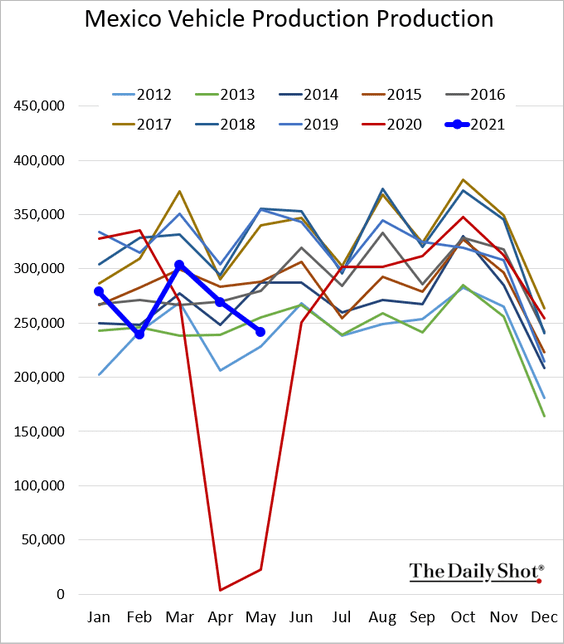
2. Mexico’s vehicle production is moving in the wrong direction.
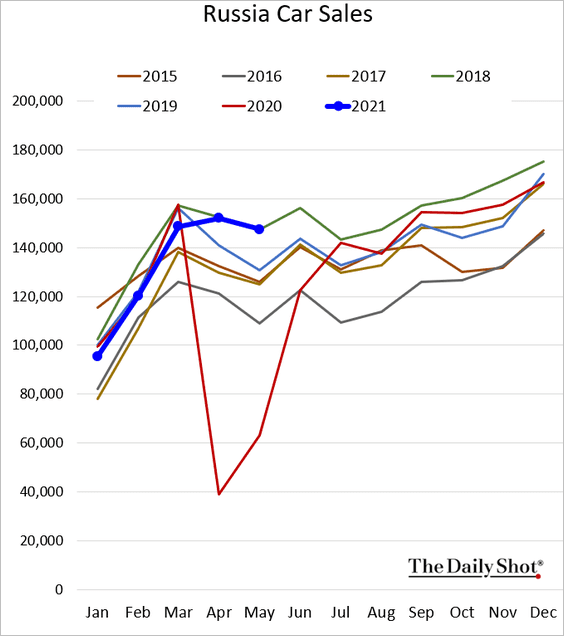
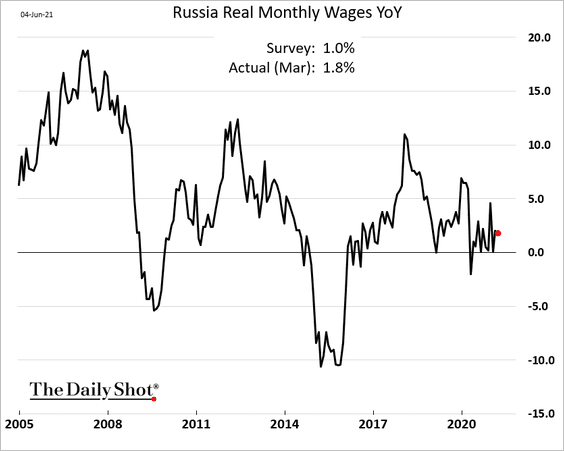
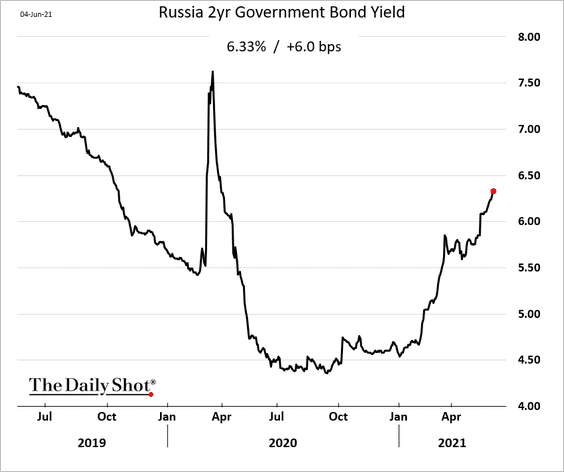
3. Here are some updates on Russia.
• Car sales (at 2018 levels):
• Wage growth:
• The 2yr bond yield (pricing in more hikes):
——————–
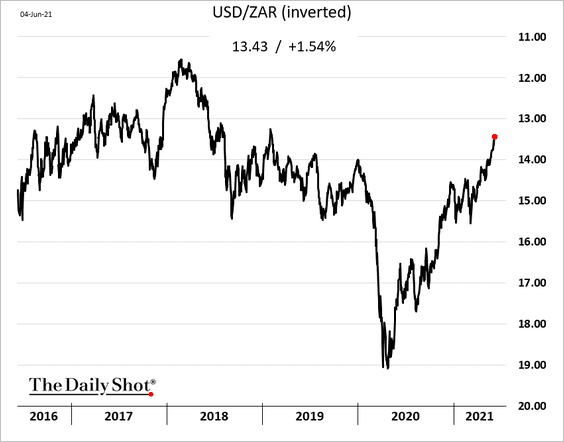
4. The South African rand continues to rally.
Back to Index
Cryptocurrency
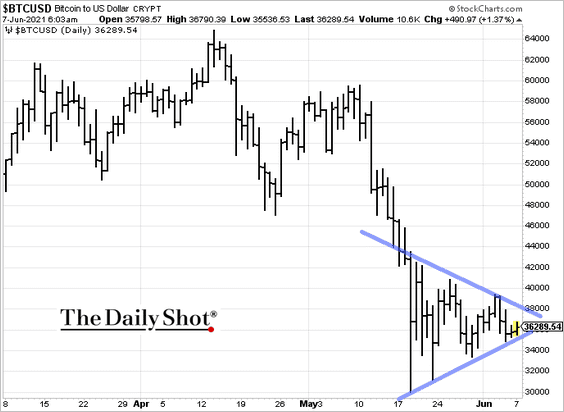
1. Bitcoin has been consolidating.
2. It’s been a good year for NFTs.
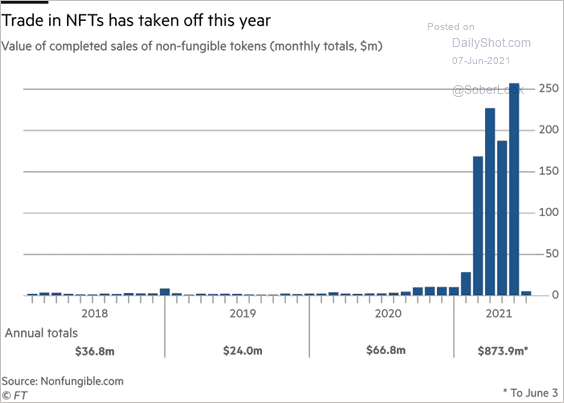 Source: @financialtimes, h/t @ISABELNET_SA Read full article
Back to Index
Equities:
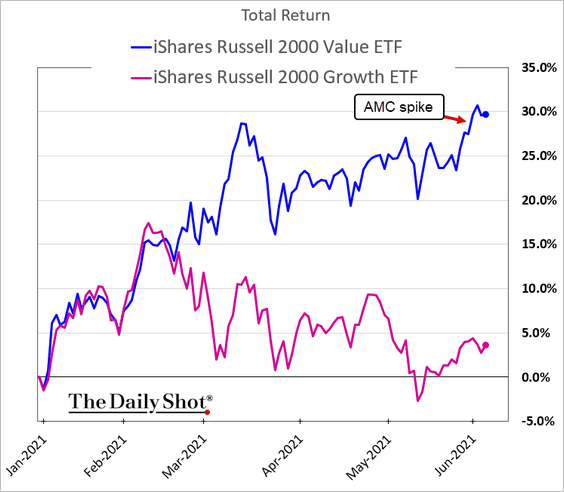
1. Meme stocks widened the Russell 2000 Value outperformance over growth.
2. Stocks most correlated with Treasuries (those that expect substantial earnings growth far in the future) trade at record premiums to the rest of the market.
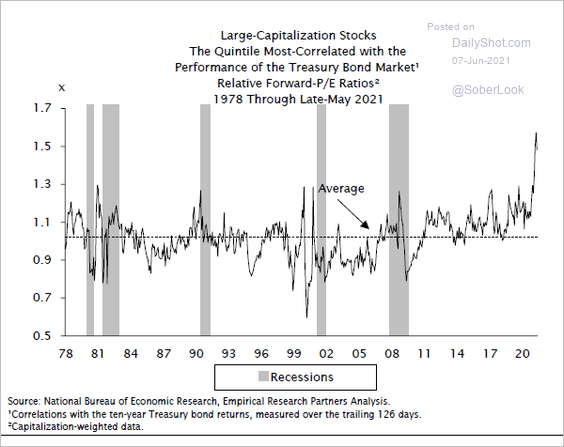 Source: Empirical Research Partners, @RBAdvisors
3. Equity-bond correlations tend to turn positive during periods of high inflation.
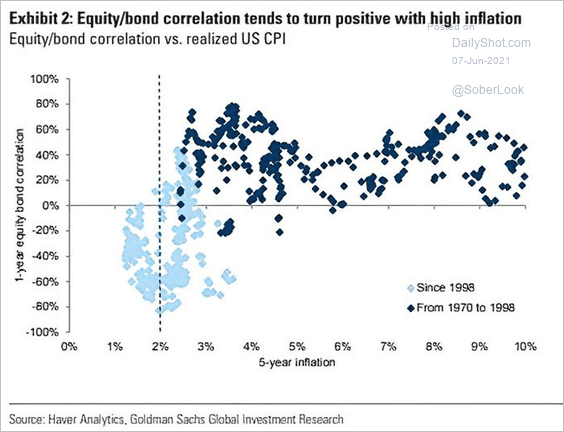 Source: @ISABELNET_SA, @GoldmanSachs
4. Equity positioning remains stretched.
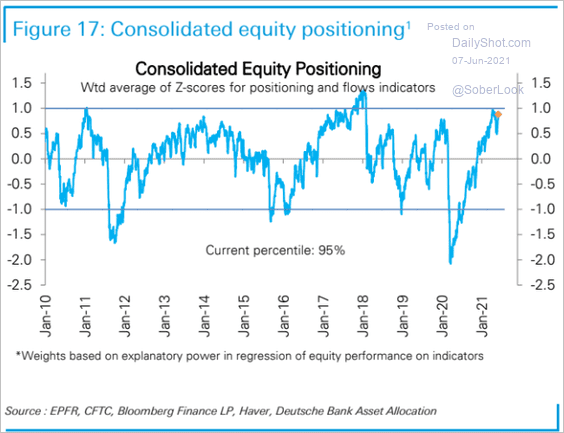 Source: Deutsche Bank Research
• There are several other warning signs for equities, according to BCA Research (2 charts).
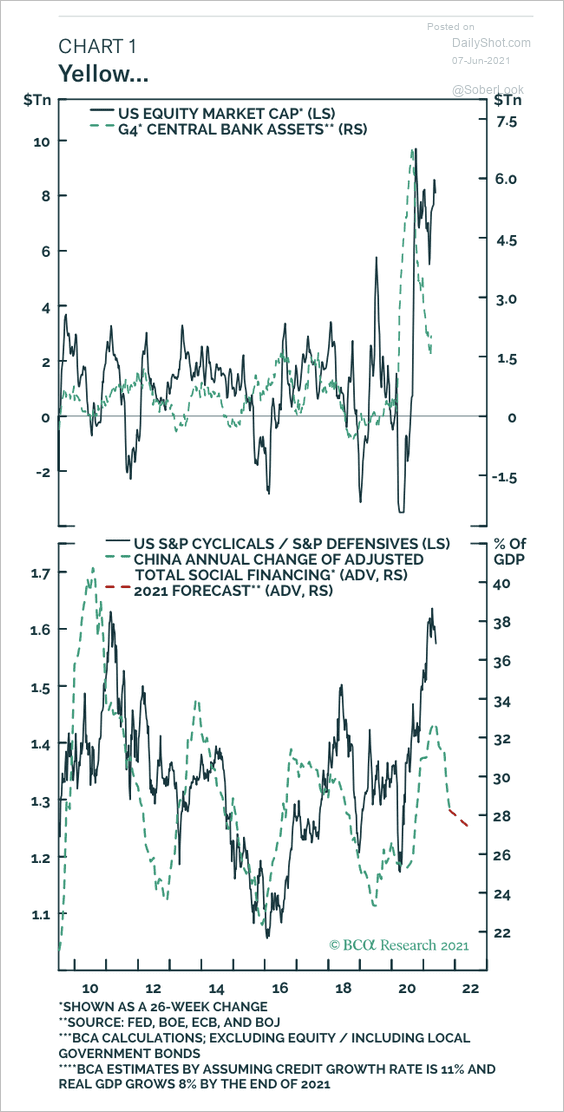 Source: BCA Research
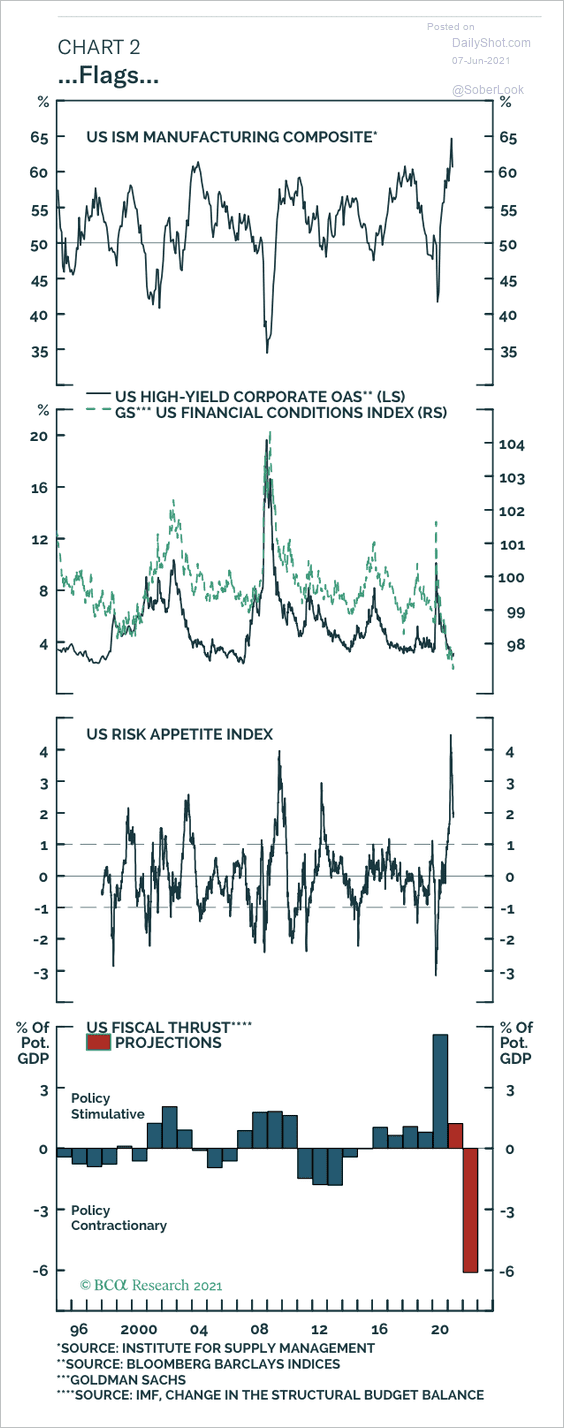 Source: BCA Research
Here is Morgan Stanley’s Market Timing Indicator.
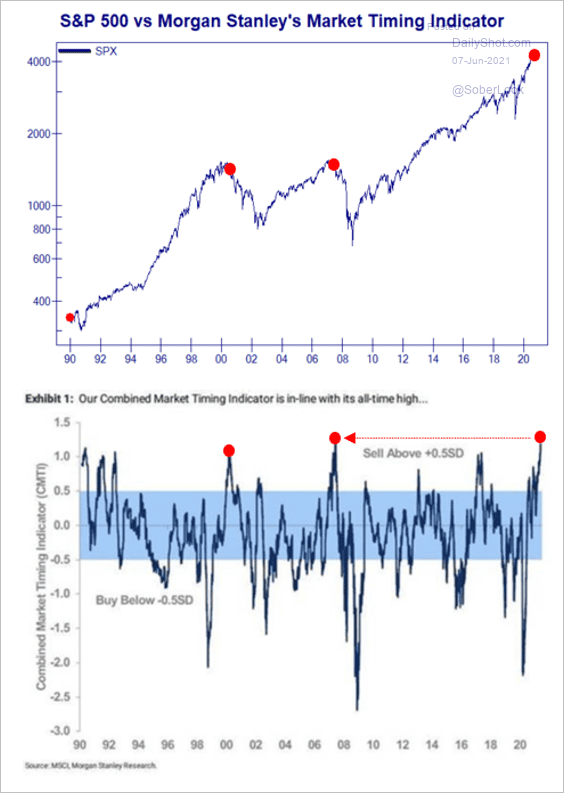 Source: @Not_Jim_Cramer
——————–
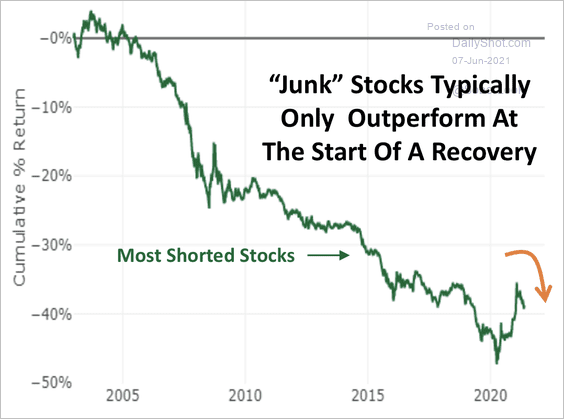
5. The most-shorted US stocks surged with the latest meme share rally.
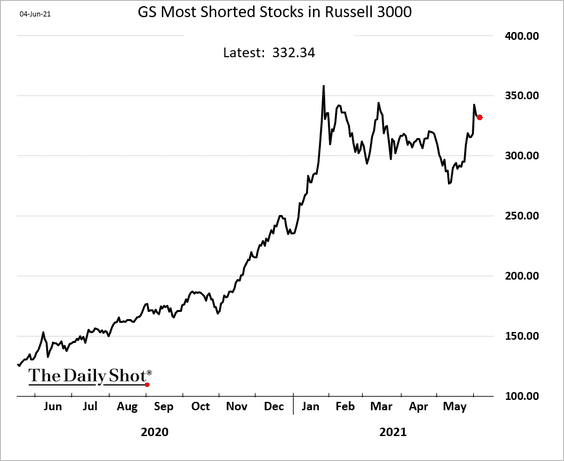
Cornerstone Macro expects the most shorted stocks to underperform.
 Source: Cornerstone Macro
——————–
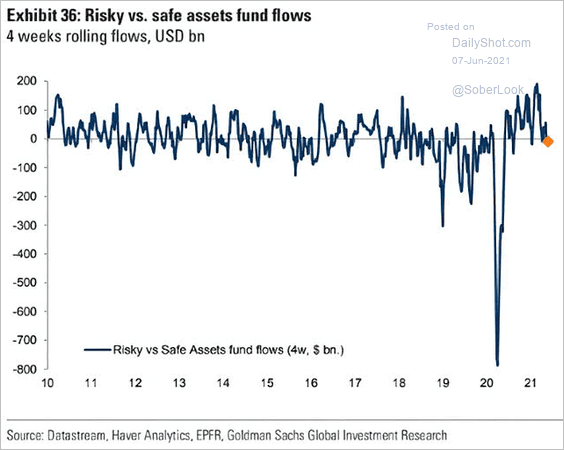
6. This chart shows risky vs. safe assets’ fund flows.
 Source: @ISABELNET_SA, @GoldmanSachs
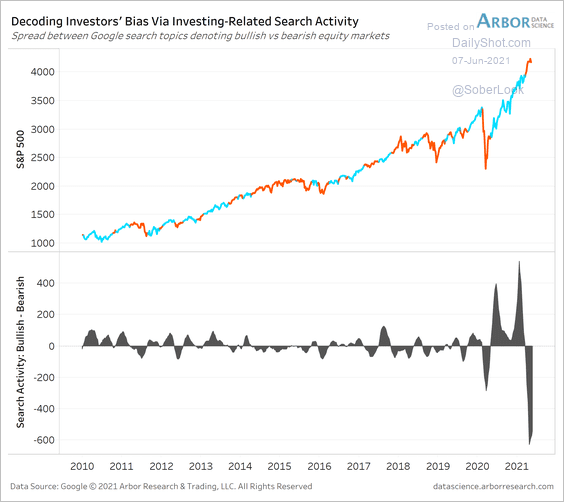
7. Online search activity has turned bearish.
 Source: Arbor Research & Trading
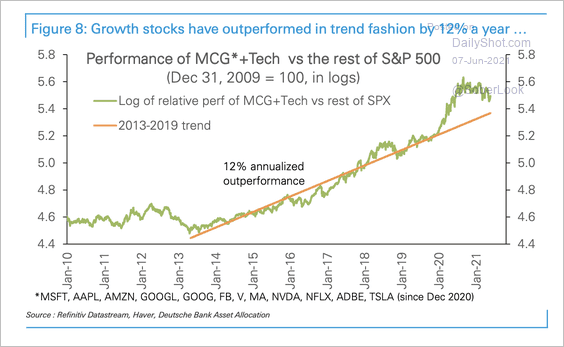
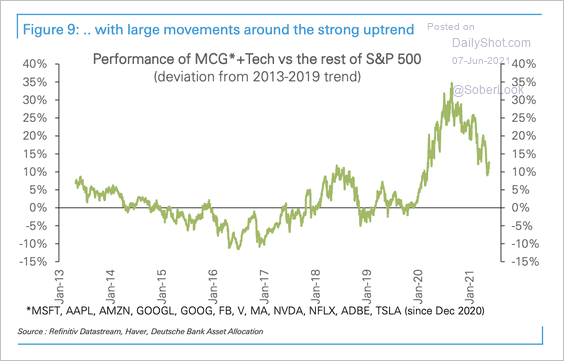
8. Growth stocks are have been underperforming after deviating far above trend (2 charts).
 Source: Deutsche Bank Research
 Source: Deutsche Bank Research
Deutsche Bank expects further underperformance of growth stocks this year.
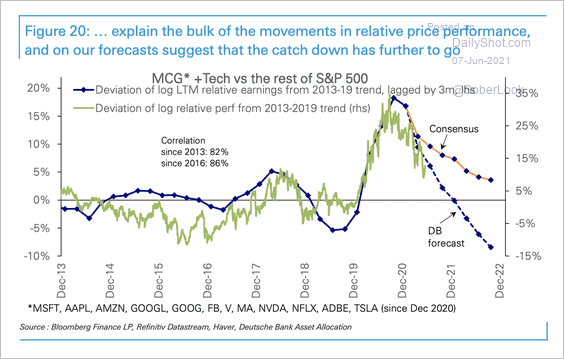 Source: Deutsche Bank Research
However, growth stocks now appear oversold relative to value stocks.
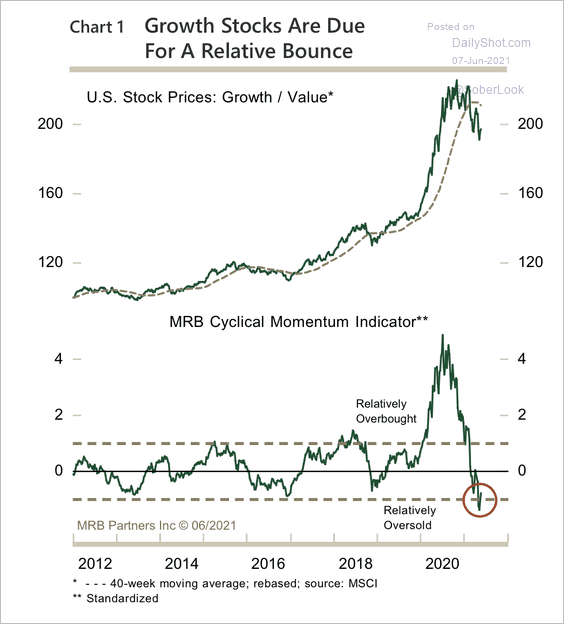 Source: MRB Partners
——————–
9. Financials are trading in line with 2009-2010, which suggests a period of weakness relative to the S&P 500.
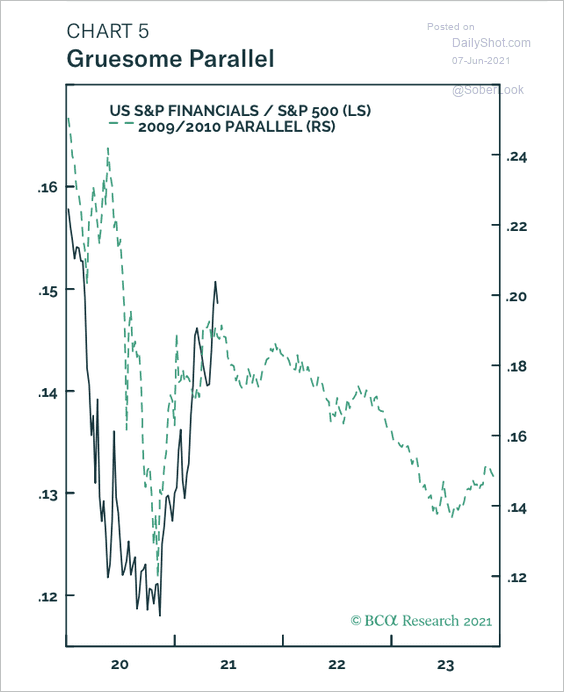 Source: BCA Research
For now, financials are supported by a steepening yield curve.
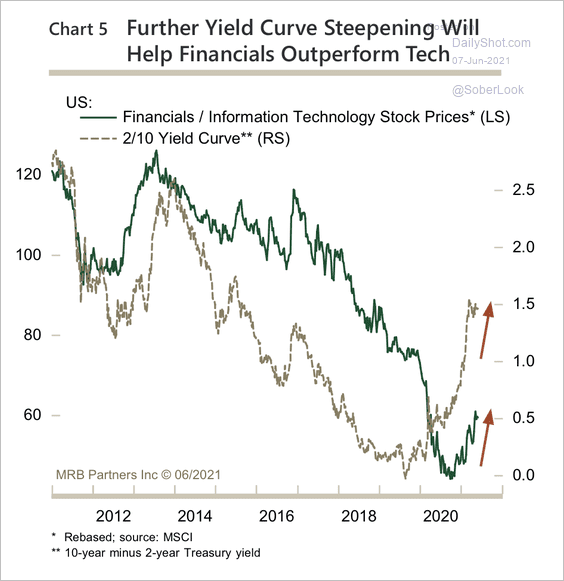 Source: MRB Partners
——————–
10. Cybersecurity firms are lagging despite all the recent ransomware attacks.
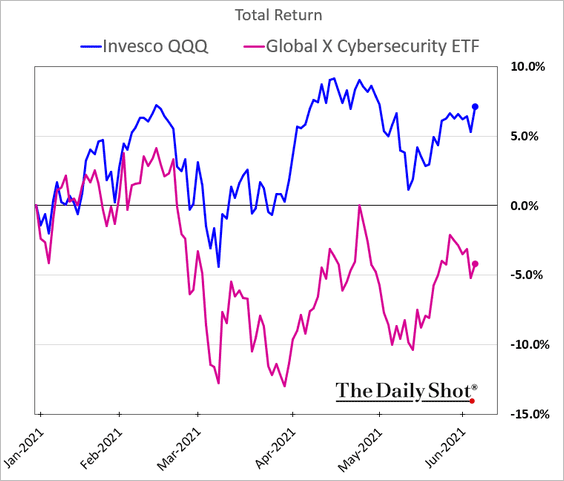 h/t Cormac Mullen
11. ARK Innovation entered a death cross.
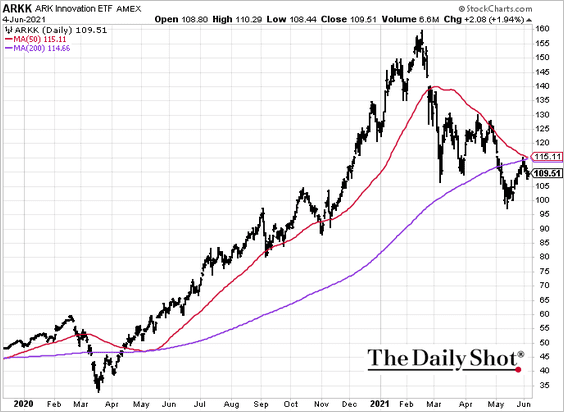 h/t @Tobin_Tweets
Back to Index
Global Developments
1. Are the bets against the US dollar becoming stretched?
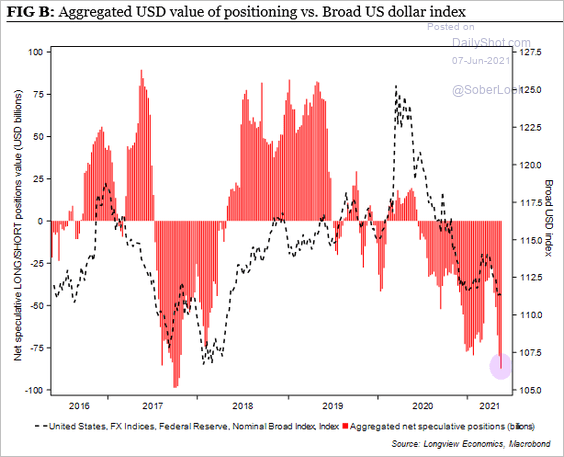 Source: Longview Economics
2. Which countries saw the highest home price appreciation recently?
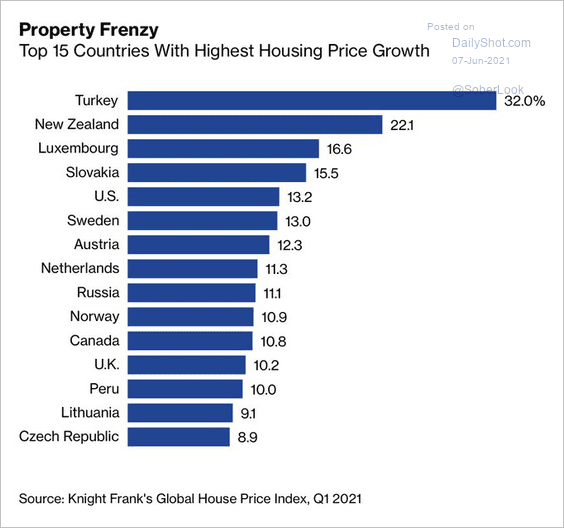 Source: @jessefelder, Bloomberg Read full article
3. This chart shows how each country’s economy compares to pre-COVID levels.
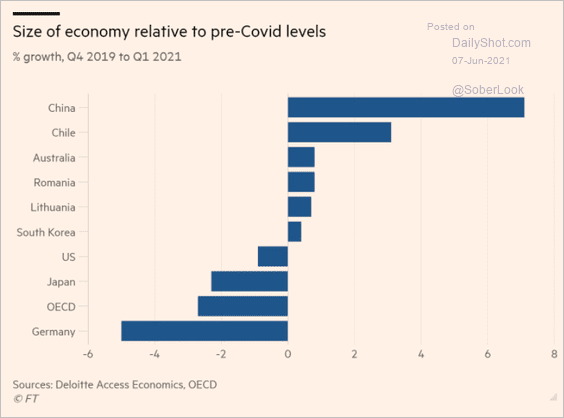 Source: @financialtimes Read full article
4. The global composite PMI points to robust GDP growth in Q2
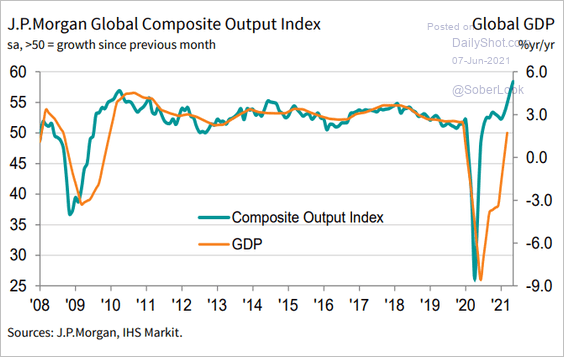 Source: IHS Markit
5. Finally, we have central banks’ government debt holdings as a share of outstanding debt.
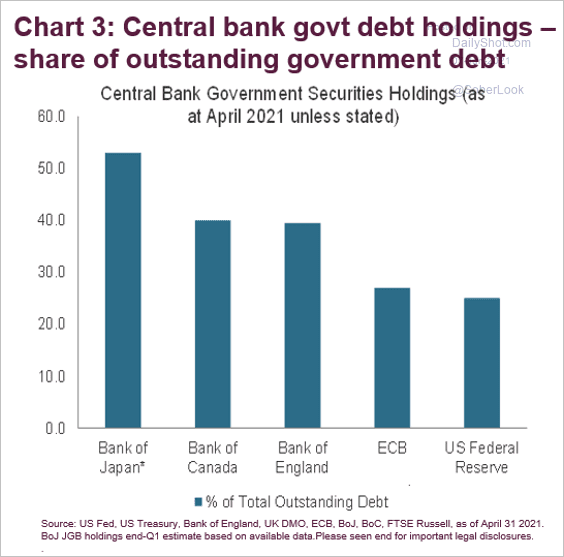 Source: FTSE Russell Read full article
——————–
Food for Thought
1. Tax revenues as a share of GDP:
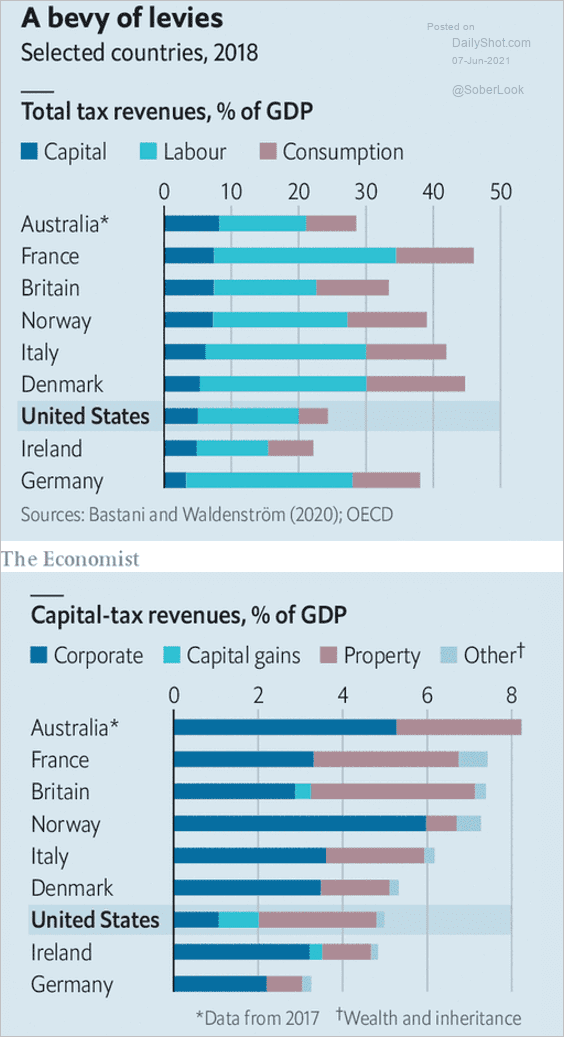 Source: @adam_tooze, @TheEconomist Read full article
2. Corporate tax rates in 2000 and 2020:
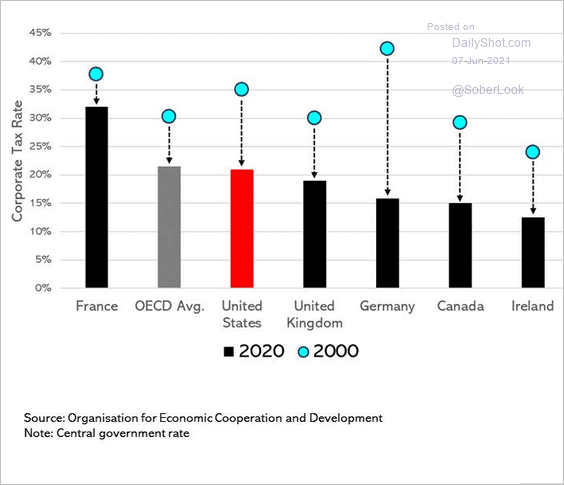 Source: @SteveRattner
• US top and effective corporate tax rate:
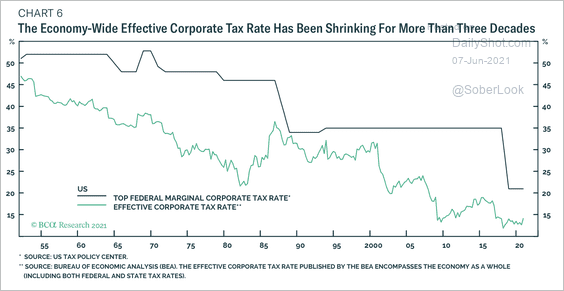 Source: BCA Research
——————–
3. US individuals audited by the IRS:
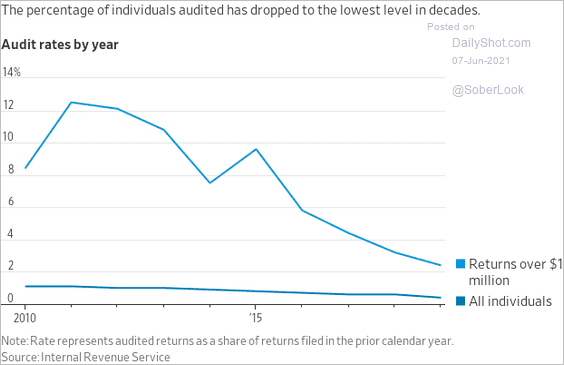 Source: @WSJ Read full article
4. Remote work by age (2 charts):
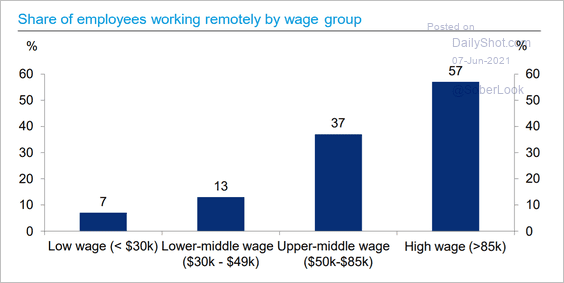 Source: Deutsche Bank Research
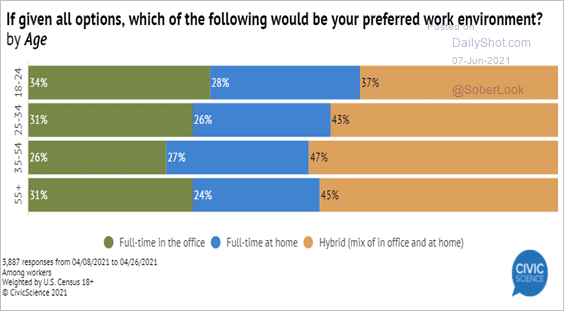 Source: CivicScience Read full article
5. Hybrid work:
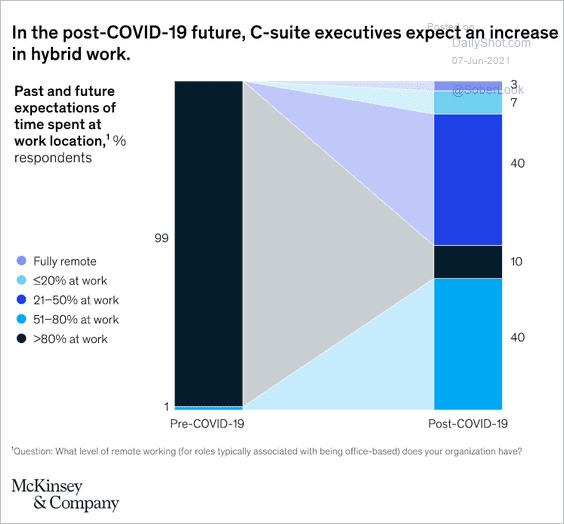 Source: McKinsey Read full article
——————–
6. The labor force participation gap by country:
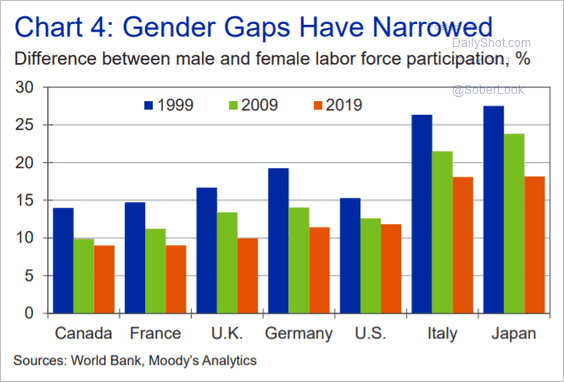 Source: Moody’s Analytics
7. US concerns about catching COVID:
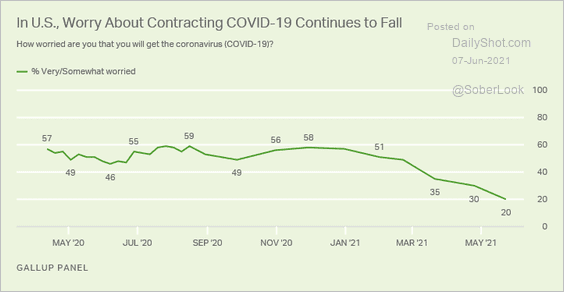 Source: Gallup Read full article
8. Vaccine funding:
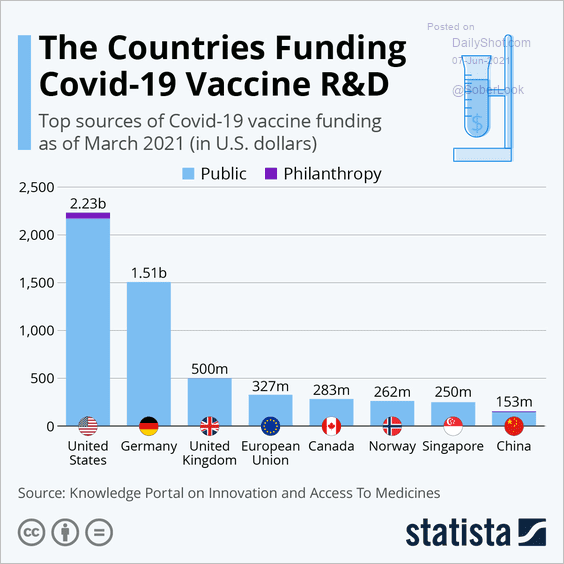 Source: Statista
9. Brood X cicadas emerging this year:
 Source: Vox Read full article
——————–
Back to Index