
The Daily Shot: 09-Jun-21
• The United States
• Canada
• The United Kingdom
• The Eurozone
• Aisa – Pacific
• China
• Emerging Markets
• Cryptocurrency
• Energy
• Equities
• Rates
• Food for Thought
The United States
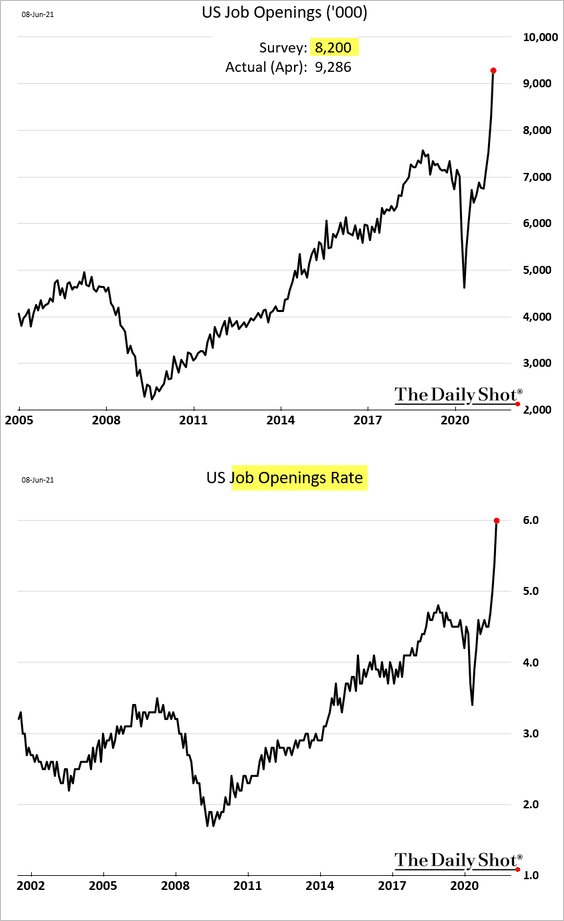
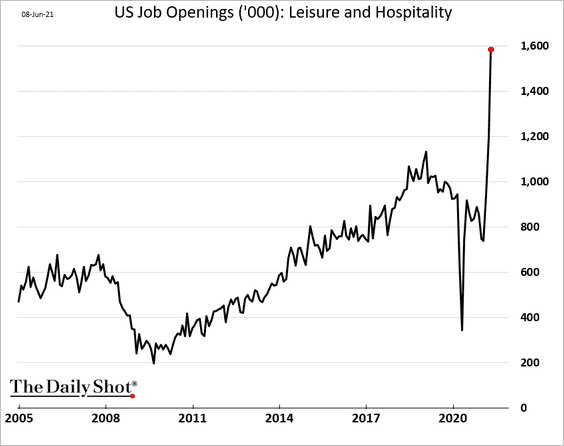
1. The labor market continues to tighten, with the latest job openings indicators hitting record highs (well above consensus forecasts). Note that both the absolute number and the openings rate have been surging.
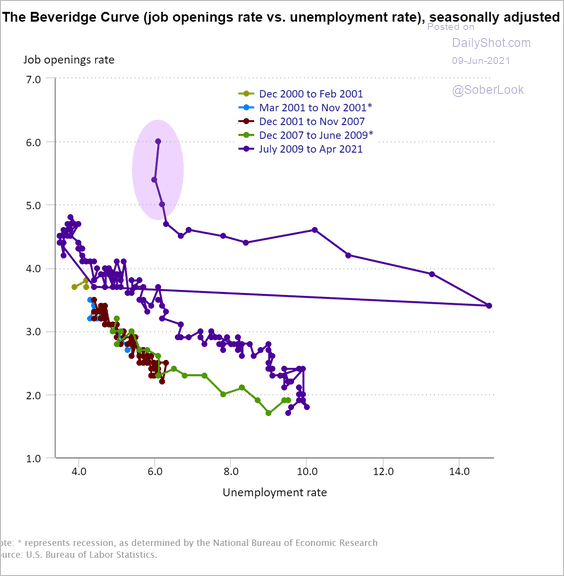
The labor market’s acute supply constraints are clearly visible in the Beveridge curve.
 Source: U.S. Bureau of Labor Statistics
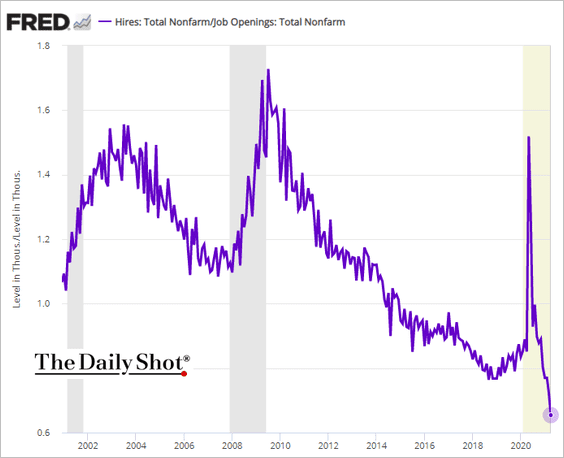
Here is the hires-to-openings ratio.
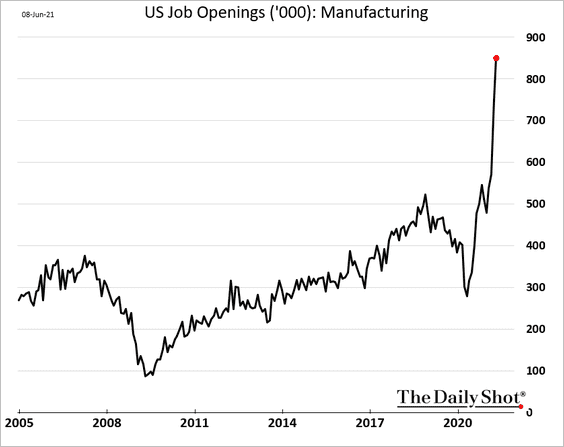
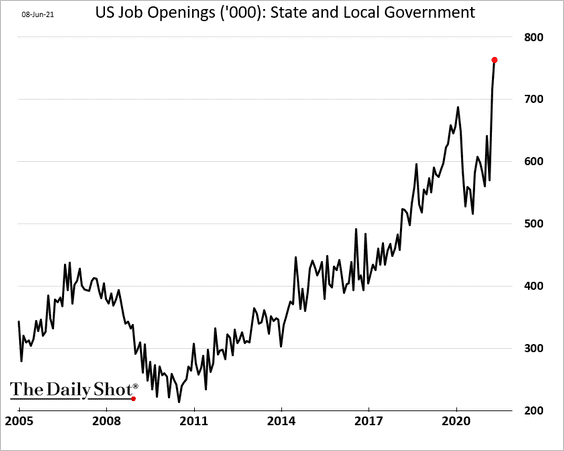
Gains in job openings were quite broad, with many sectors hitting record levels.
– Manufacturing (factory jobs are here; workers are not):
– Trade, Transportation, and Utilities:
![]()
– Leisure and hospitality:
– State and local government:
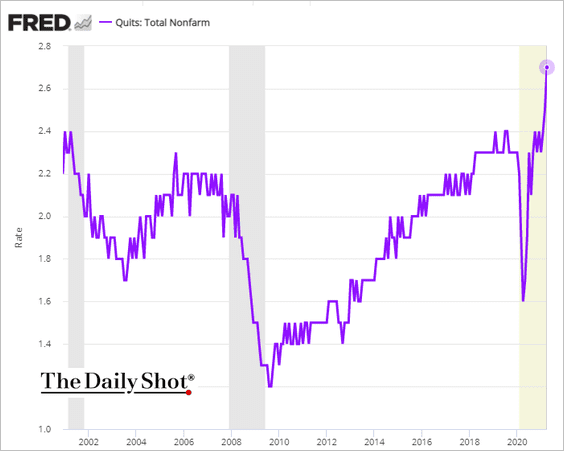
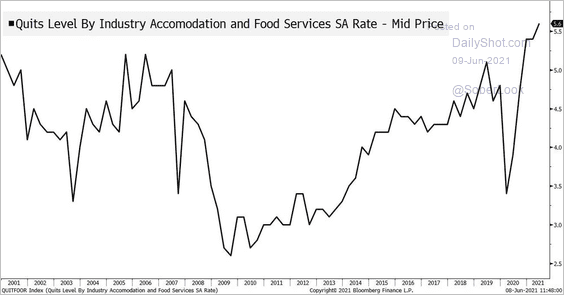
• The rate of voluntary resignations (quits rate) hit a record high, pointing to confidence in the job market and rising competition for workers.
 Source: Bloomberg Read full article
This chart shows the quits rate vs. layoffs.
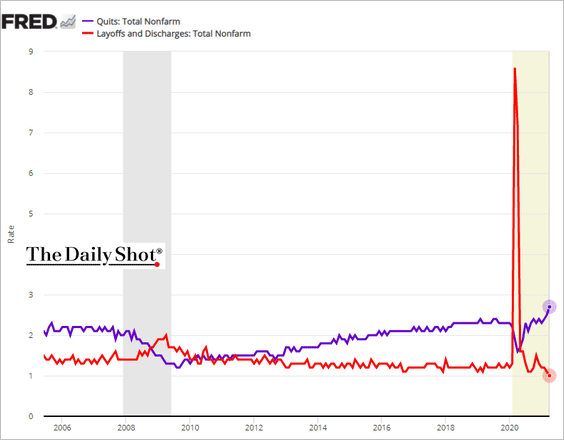
The spike in resignations points to higher wage inflation.
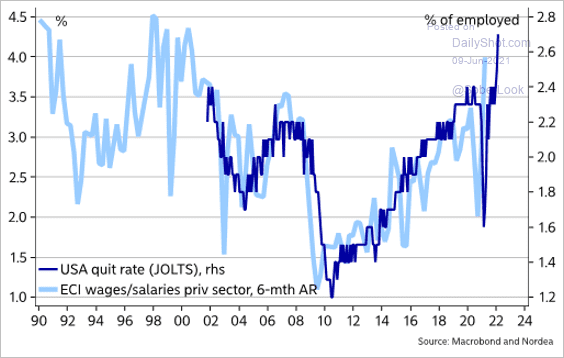 Source: @MikaelSarwe
• Here is the unemployment-to-openings ratio.
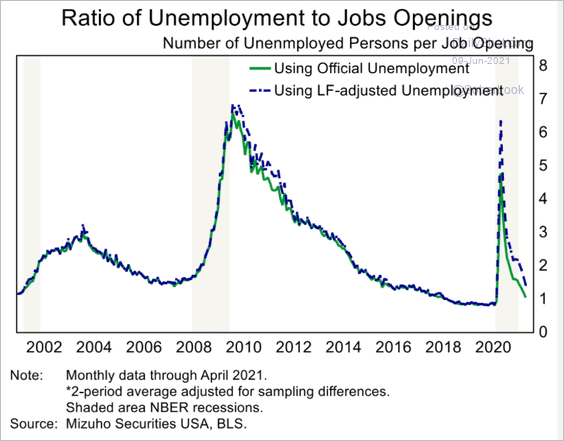 Source: Mizuho Securities USA
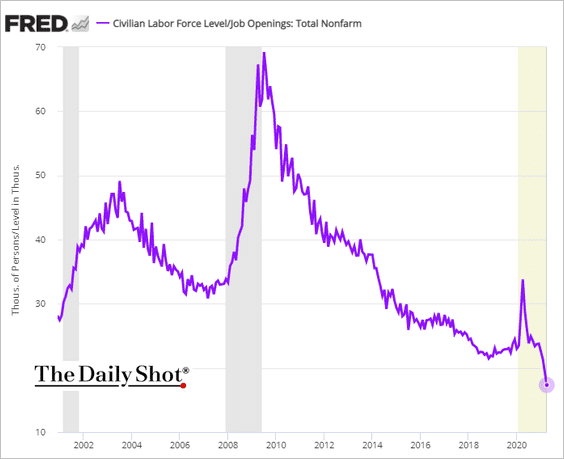
And this chart shows the total number of US workers (employed and unemployed) per one job opening.
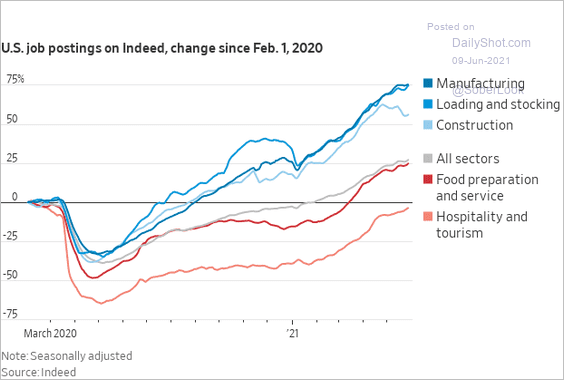
• Job openings posted on Indeed continue to climb.
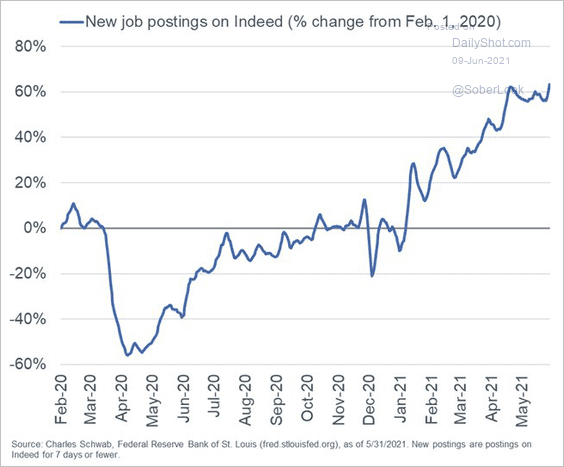 Source: @LizAnnSonders, @indeed
 Source: @WSJ Read full article
——————–
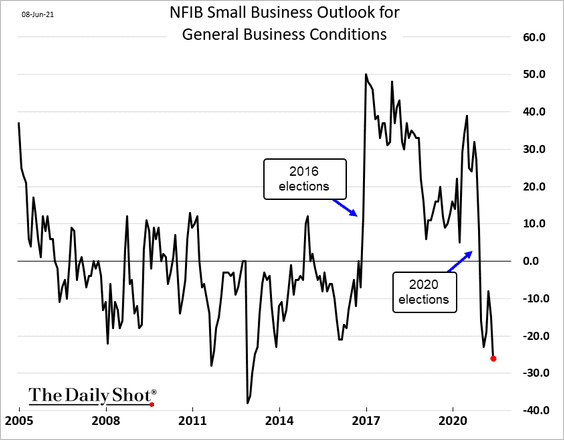
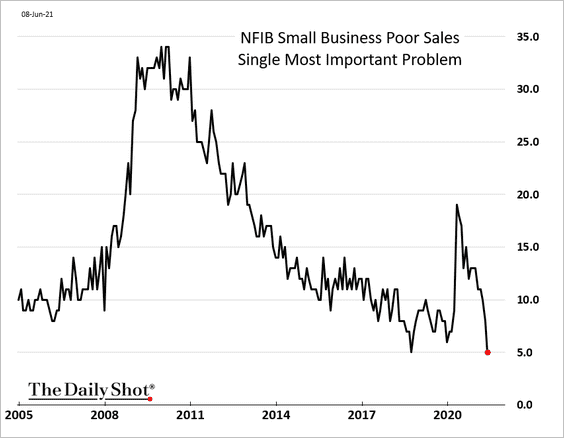
2. The May NFIB Small Business Optimism Index was below expectations.
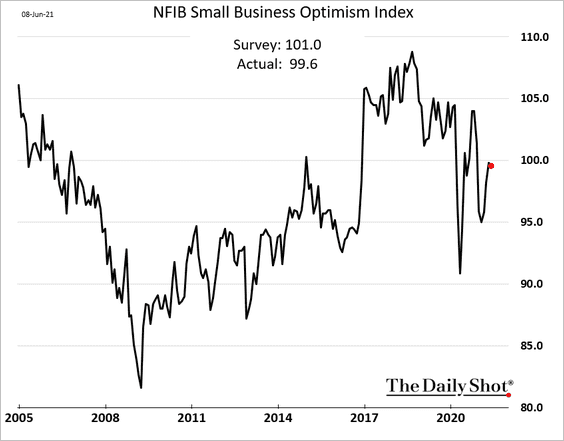
However, the weakness in the report was primarily due to partisan sentiment.
The underlying dynamics of the report were very strong.
– Poor sales as the most important problem:
– Hiring plans:
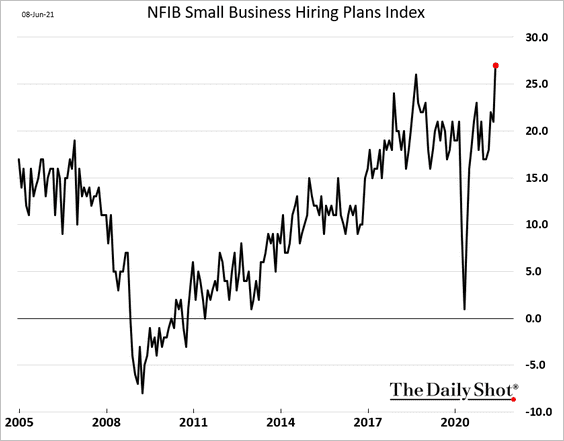
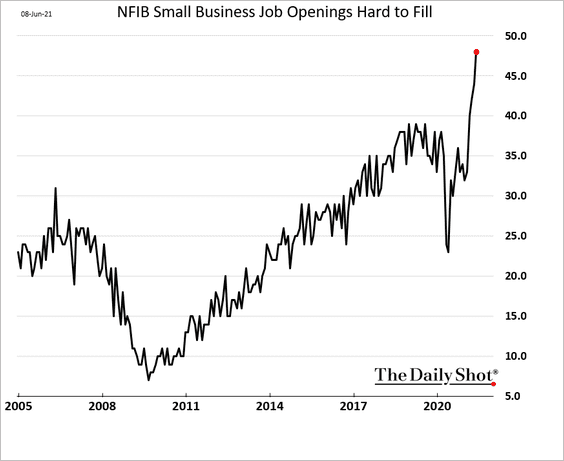
• Just as with the jobs openings data, the NFIB report points to acute labor shortages.
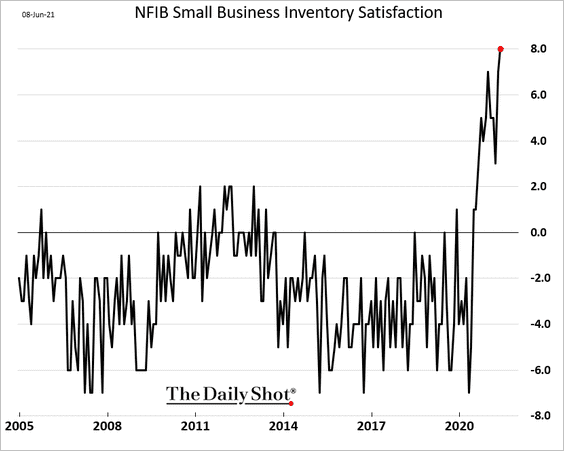
• Inventories are extremely tight due to supply constraints.
• Businesses now have pricing power. They are raising prices and plan to keep doing so in the months ahead.
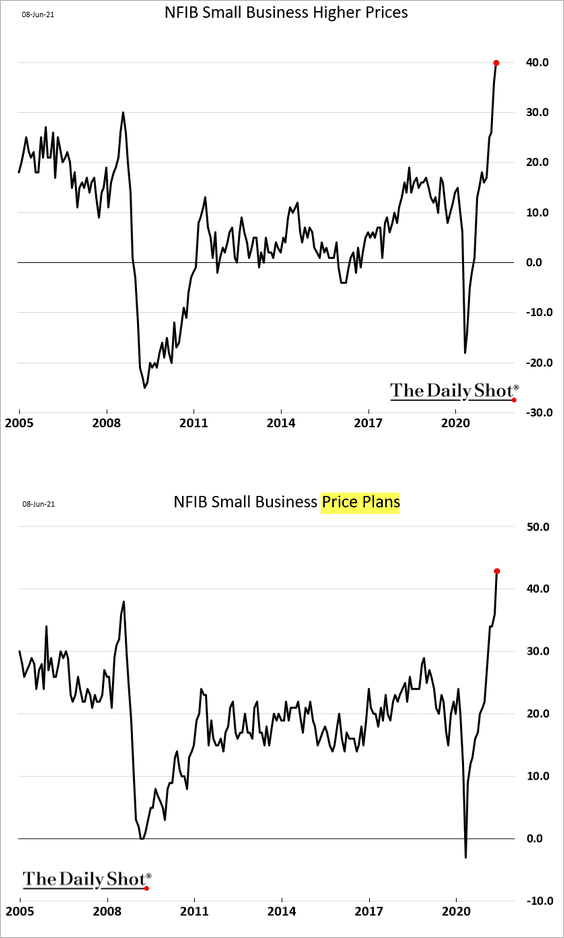
This trend points to higher consumer inflation.
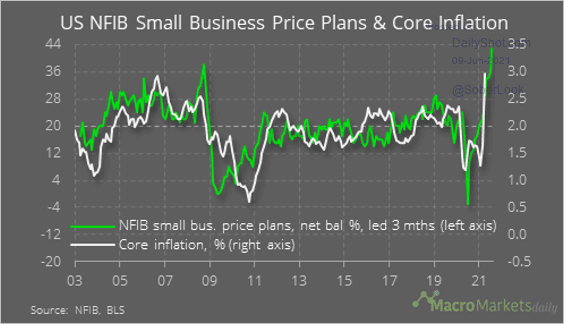 Source: @macro_daily
——————–
3. Let’s continue with the inflation theme.
• To forecast inflation, one needs a reliable estimate of the output gap. MRB Partners expects the output gap to rise toward 4% next year, which could boost inflation.
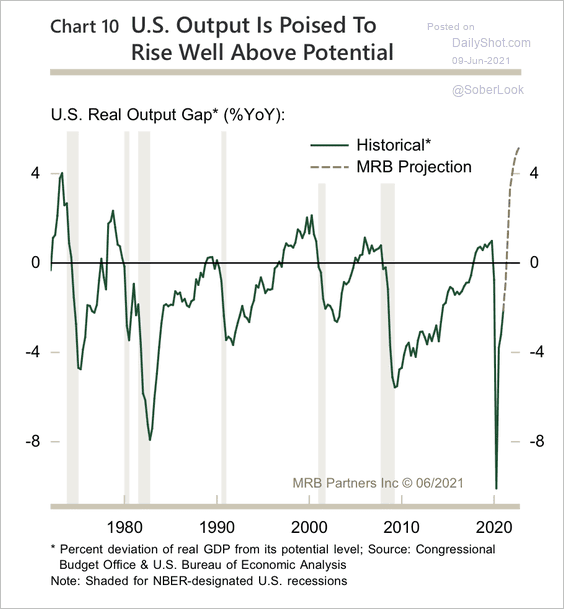 Source: MRB Partners
Here is Deutsche Bank’s forecast.
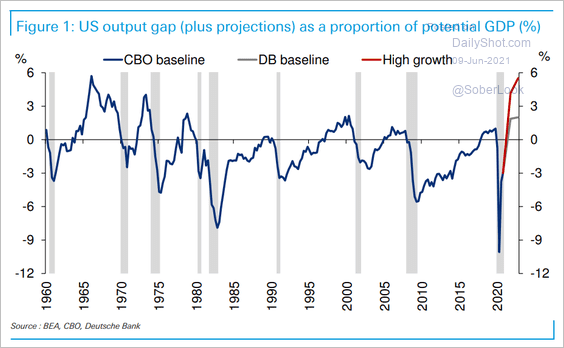 Source: Deutsche Bank Research
• Markets are pricing cyclical rather than structural inflation pressures.
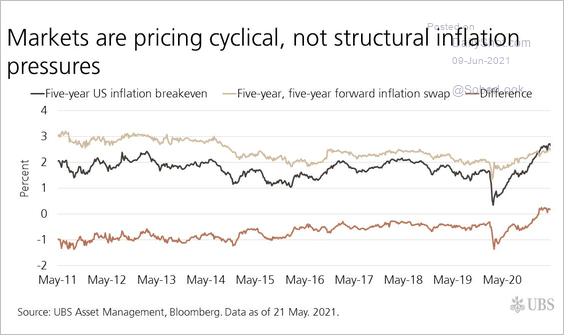 Source: UBS Asset Management
• Here is the year-over-year CPI forecast from Barclays.
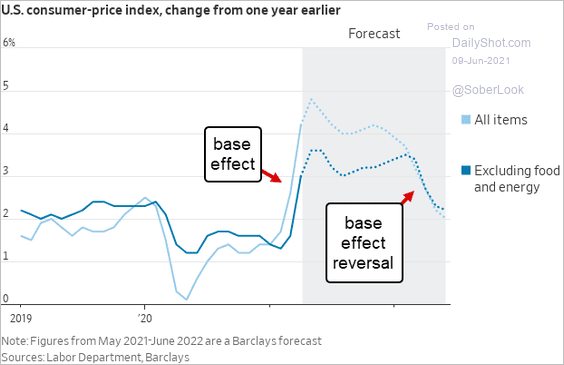 Source: @WSJ Read full article
• Airline fares inflation is rebounding.
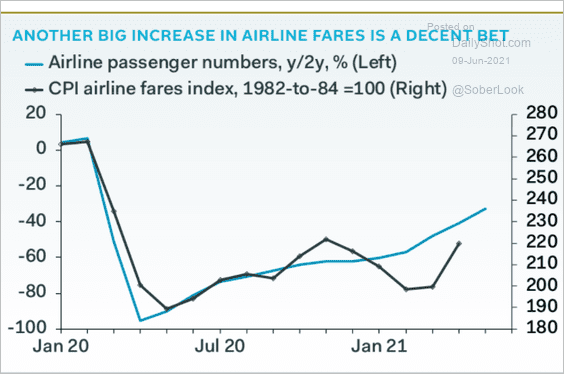 Source: Pantheon Macroeconomics
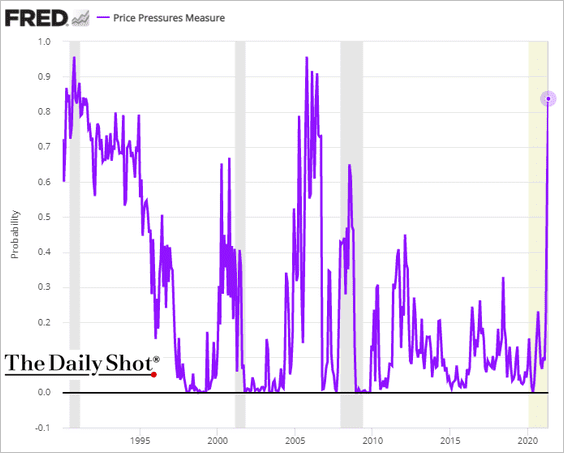
• Below is the St. Louis Fed’s Price Pressures Measure.
This series measures the probability that the expected personal consumption expenditures price index (PCEPI) inflation rate (12-month percent changes) over the next 12 months will exceed 2.5 percent.
——————–
4. US financial conditions are most accommodative in decades (a chart for our friends at the Federal Reserve).
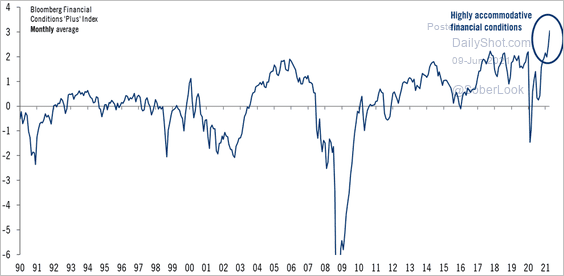 Source: @TCosterg
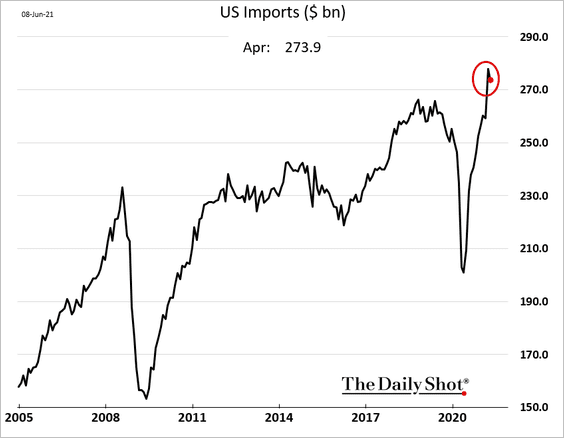
5. US imports came off the highs due to supply disruptions.
Back to Index
Canada
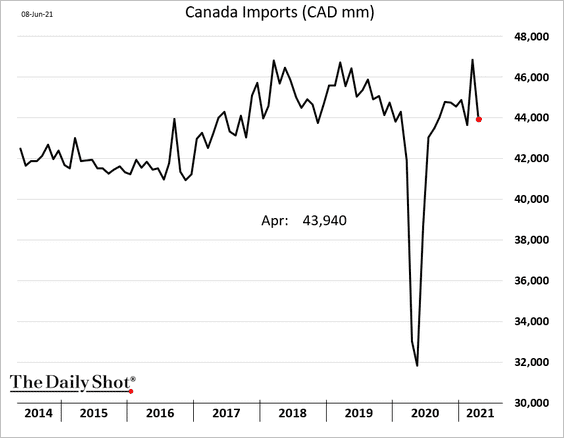
1. Canadian imports fell sharply due to supply disruptions in the auto industry. The trade balance swung into surplus.
2. Will Canada’s stock market outperform the S&P 500 in the months ahead?
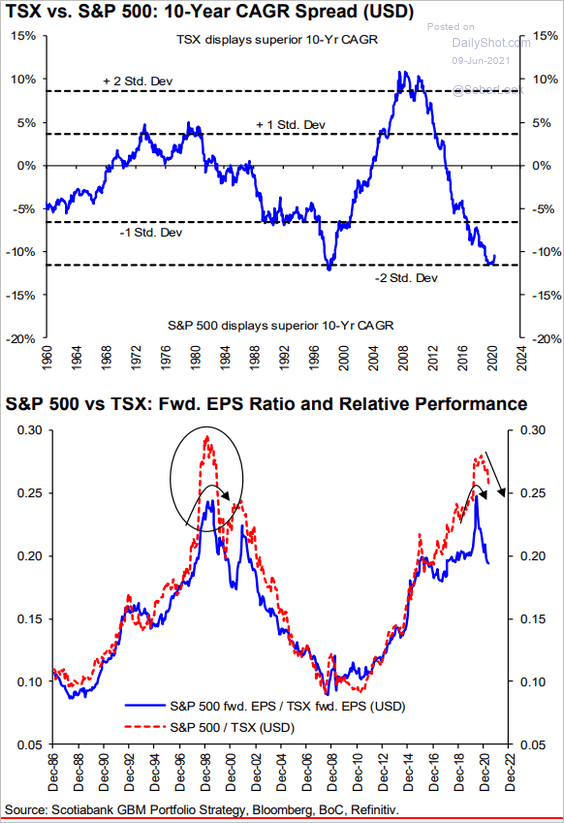 Source: Hugo Ste-Marie, Portfolio & Quantitative Strategy Global Equity Research, Scotia Capital
Back to Index
The United Kingdom
1. Permanent staff hiring has accelerated.
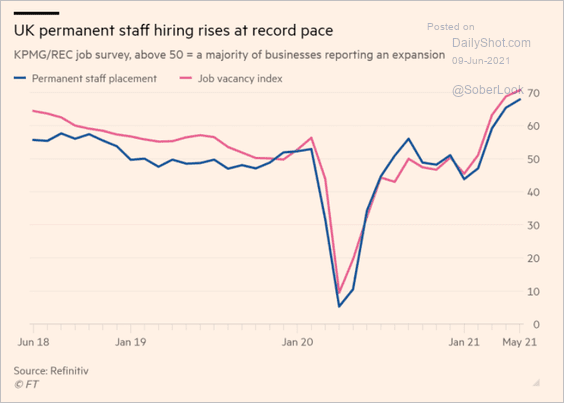 Source: @financialtimes Read full article
Low-paid workers are now moving off furlough in large numbers.
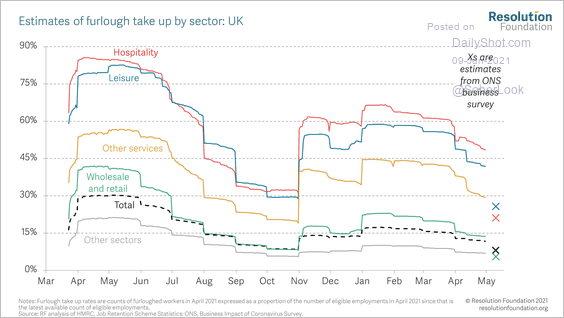 Source: @resfoundation
——————–
2. Home price appreciation continues to strengthen.
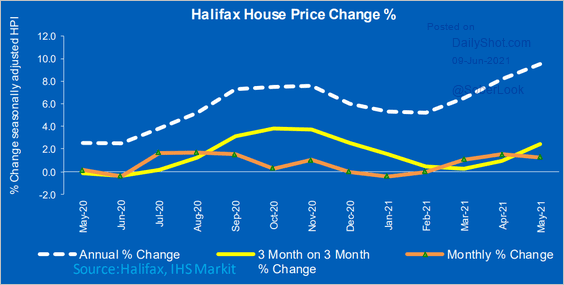 Source: IHS Markit
3. Card spending deteriorated last month.
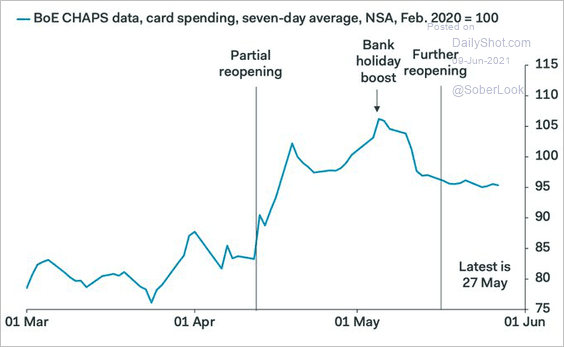 Source: @samueltombs
But restaurant/pub activity has been robust.
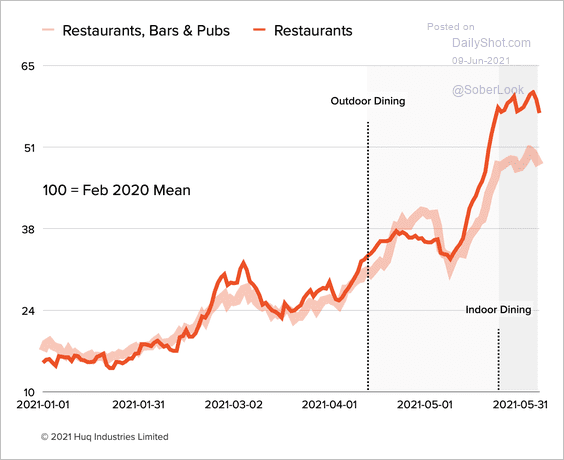 Source: huq Read full article
Back to Index
The Eurozone
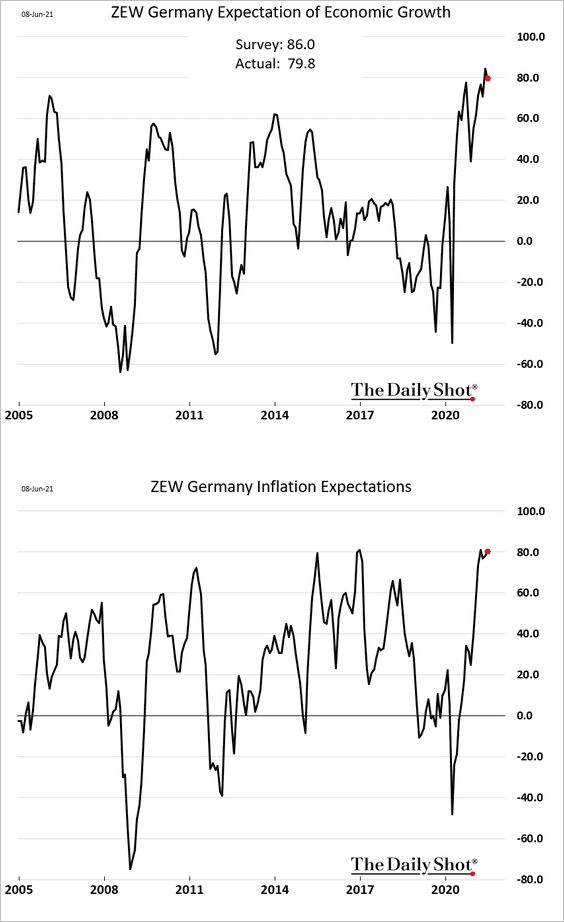
1. Germany’s ZEW economic expectations index is off the highs but still very strong. Inflation expectations remain elevated (2nd chart).
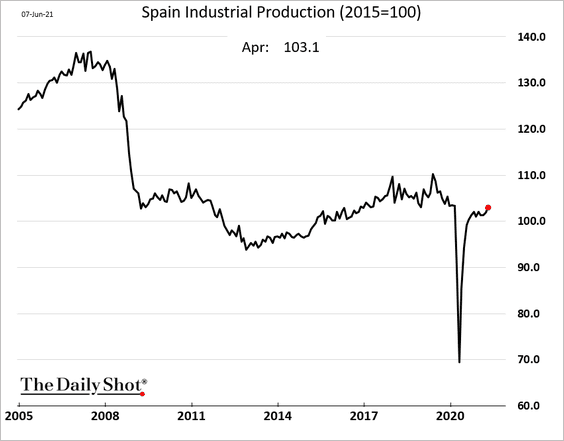
2. Spain’s industrial production is almost at pre-COVID levels.
3. This chart shows hiring pressures by sector.
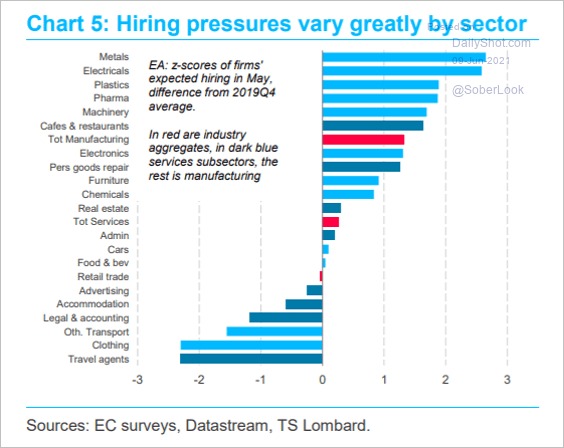 Source: TS Lombard
4. Next, we have some trends in the key components of the GDP (through Q1).
• Contributions:
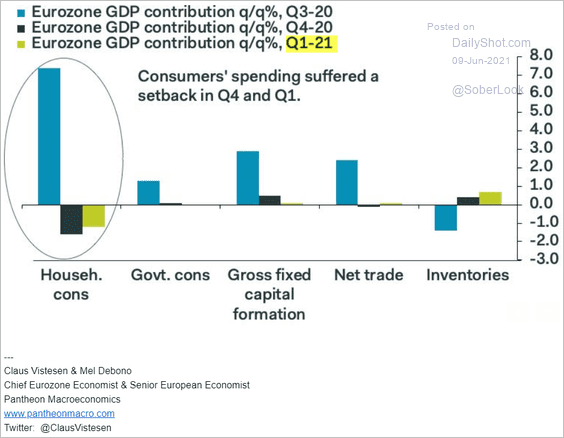 Source: Pantheon Macroeconomics
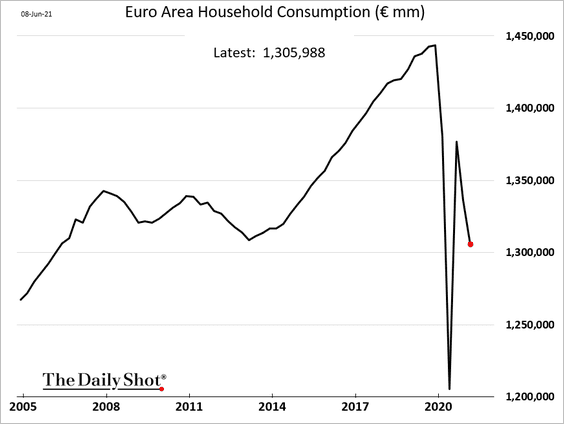
• Household consumption (down in Q4 and Q1):
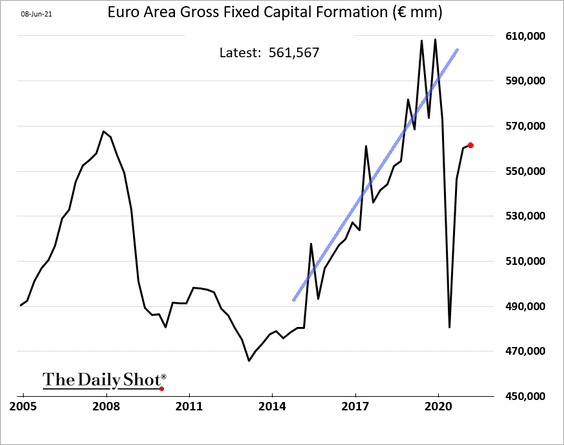
• Business investment:
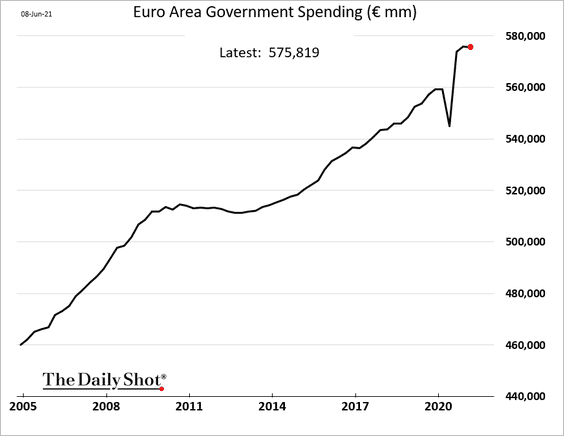
• Government spending (flat in Q1):
Back to Index
Aisa – Pacific
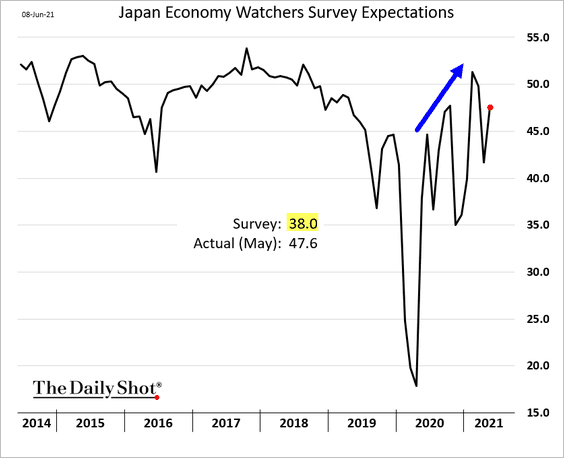
1. Japan’s Economy Watchers Expectations index is trending higher.
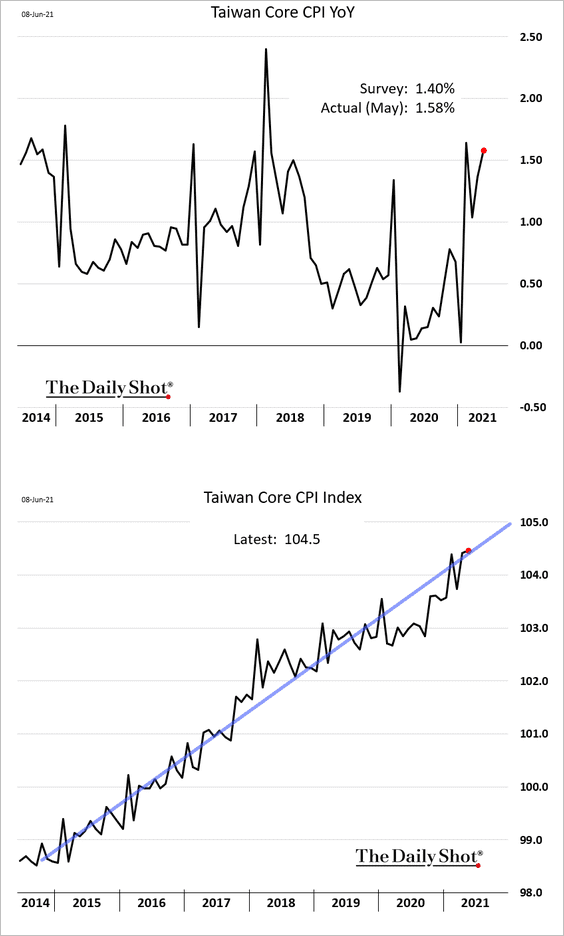
2. Taiwan’s core CPI came in above forecasts.
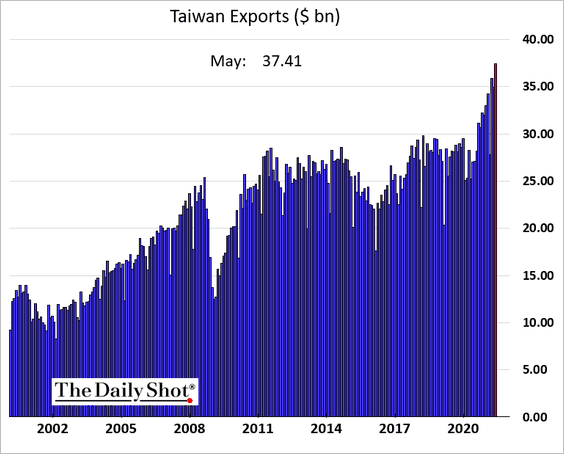
Tawan’s exports hit a record high.
——————–
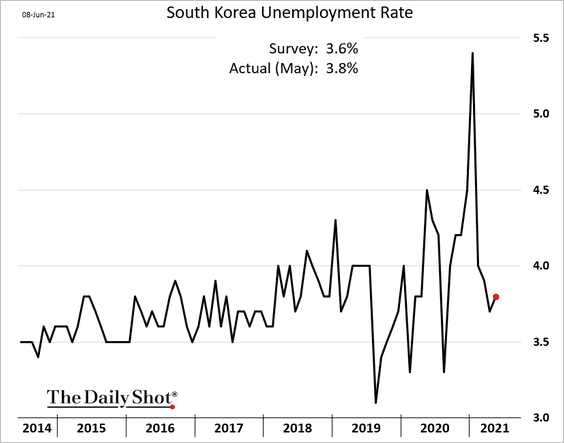
3. South Korea’s May unemployment rate was higher than expected.
4. New Zealand’s heavy truck traffic points to strong GDP growth.
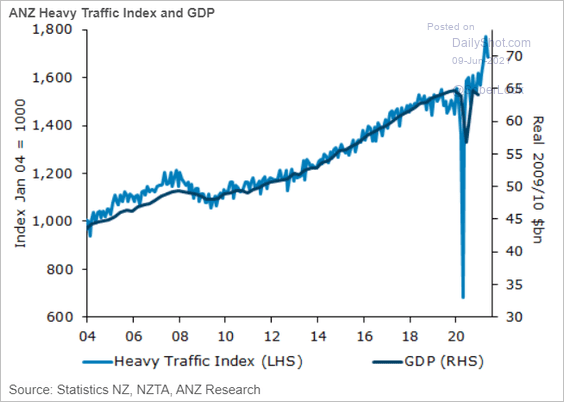 Source: ANZ Research
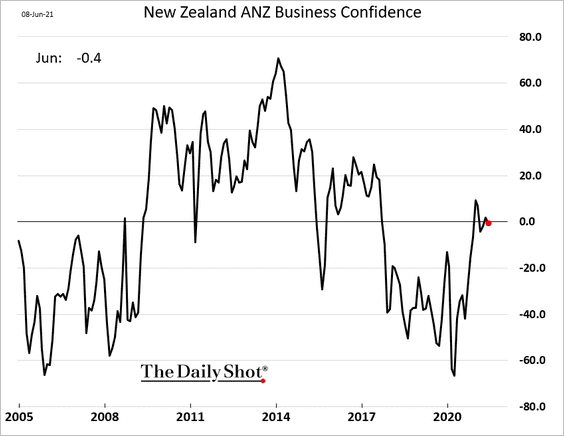
Business confidence has leveled off.
——————–
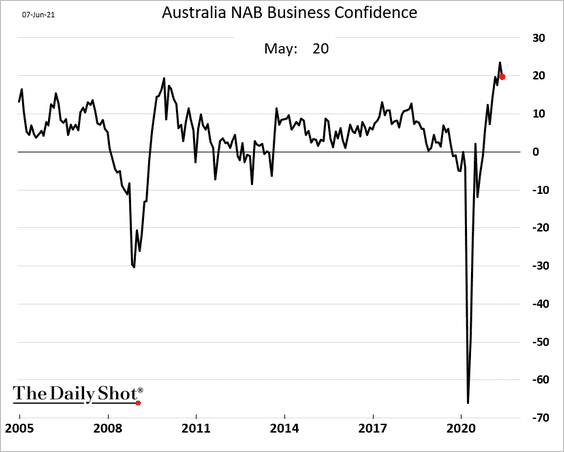
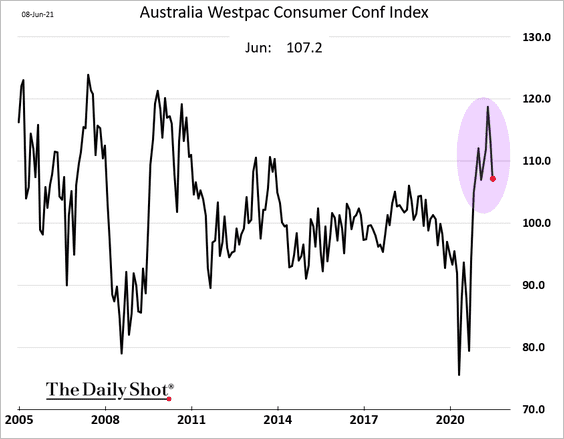
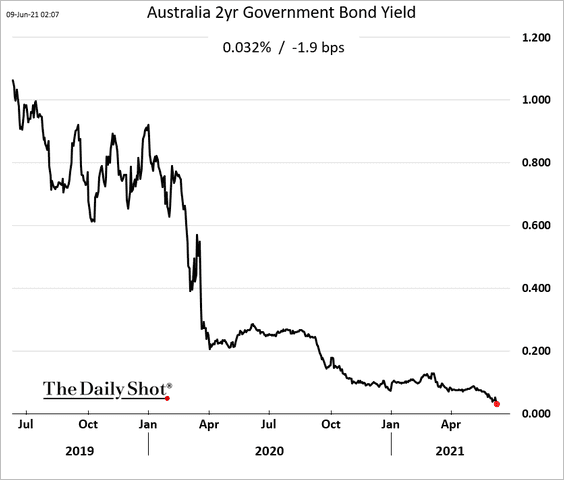
5. Next, we have some updates on Australia.
• Business confidence remains robust.
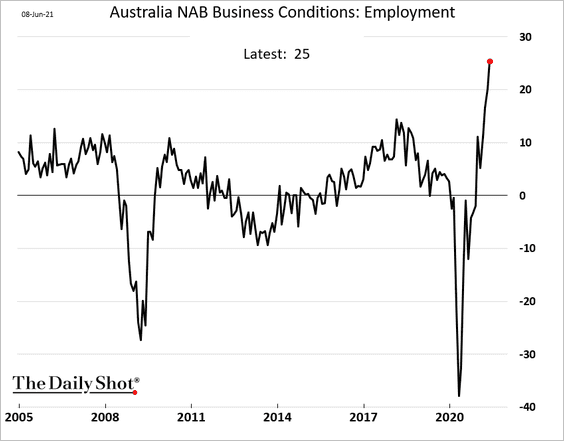
Hiring has been surging.
• Consumer confidence dipped this month.
• The 2-year yield hit a record low.
——————–
6. This chart shows vaccination trends in select countries.
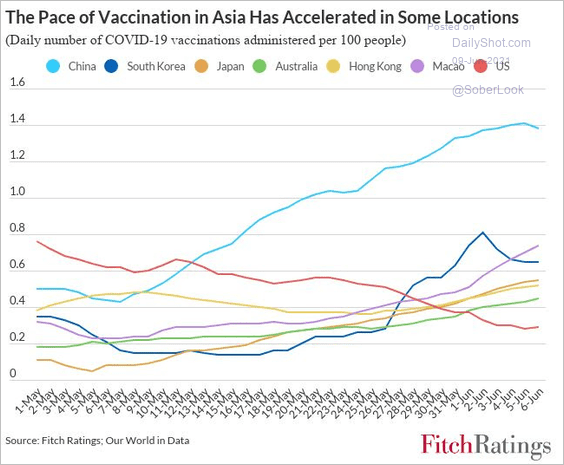 Source: Fitch Ratings
Back to Index
China
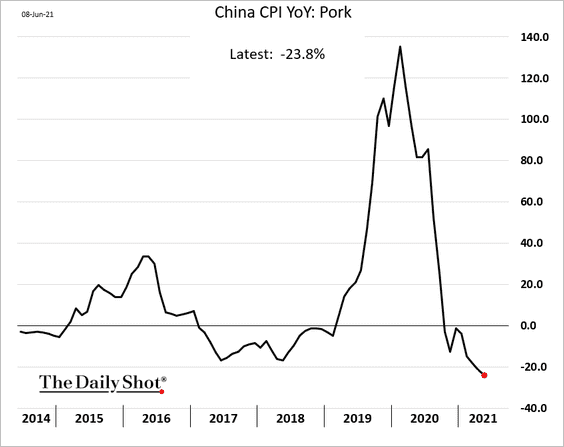
1. The May CPI report surprised to the downside.
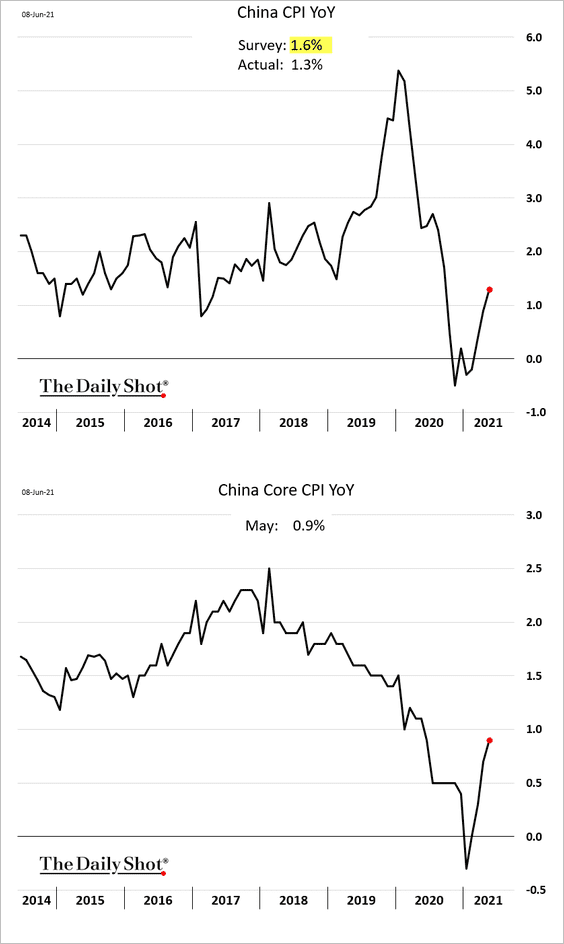
Pork prices have been coming off the highs, putting downward pressure on food inflation.
——————–
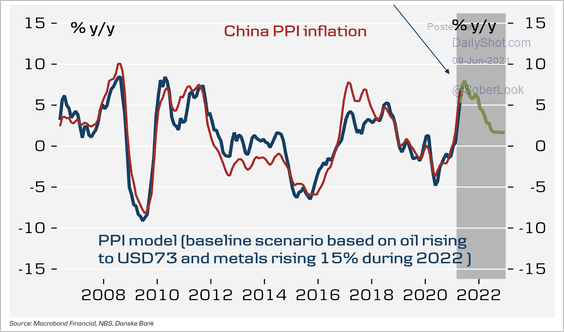
2. On the other hand, producer prices topped forecasts, driven by industrial commodity and energy prices.
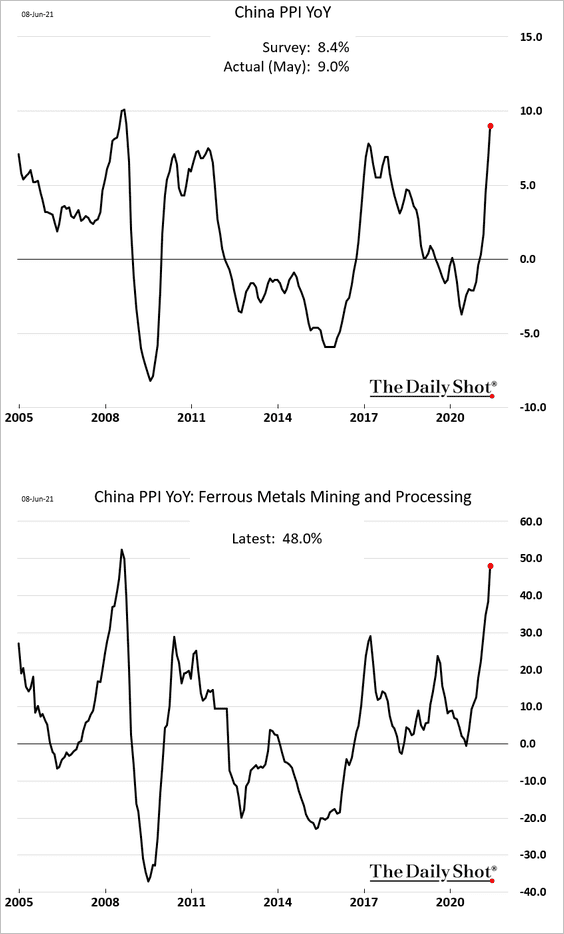
Danske Bank expects PPI to peak over the next two months and then level off into 2022.
 Source: Danske Bank
——————–
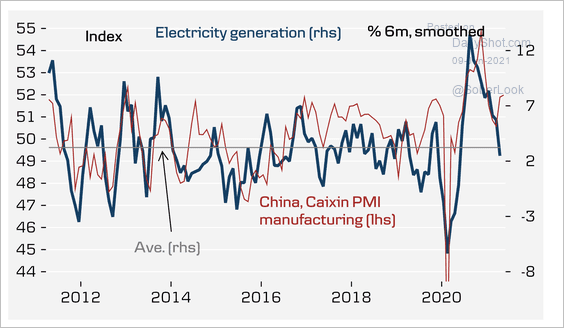
3. The decline in electricity generation points to weaker manufacturing activity.
 Source: Danske Bank
Back to Index
Emerging Markets
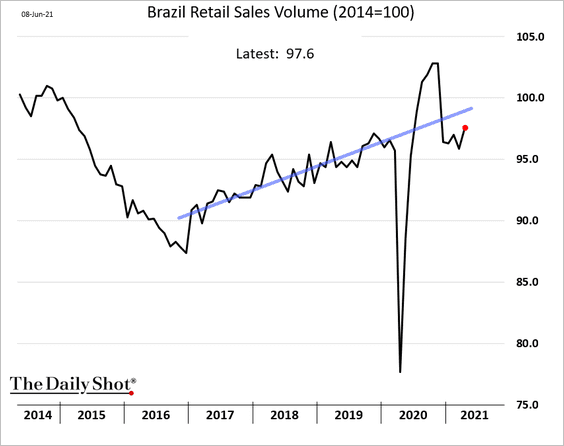
1. Brazil’s retail sales remain below the pre-COVID trend.
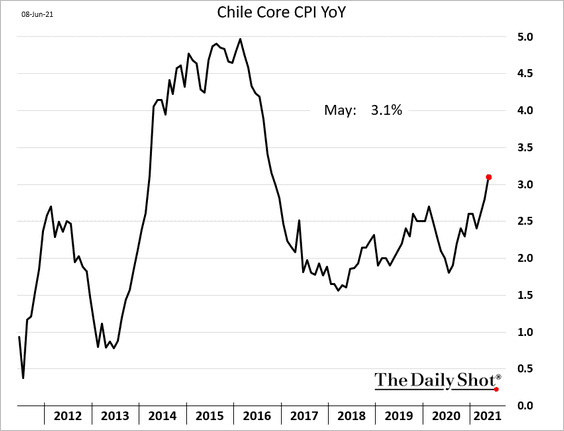
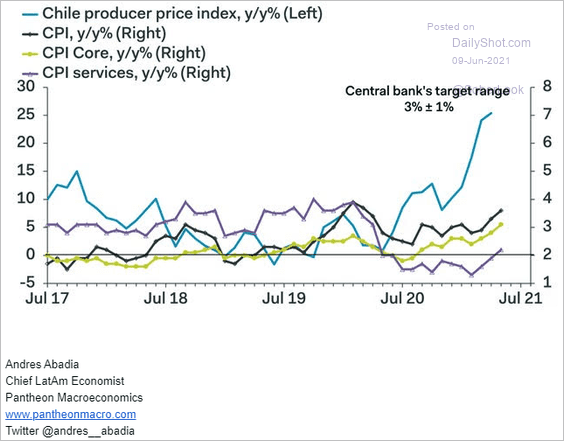
2. Chile’s inflation has been trending higher, with the core CPI now above 3%. The central bank may begin to raise rates soon.
 Source: Pantheon Macroeconomics
——————–
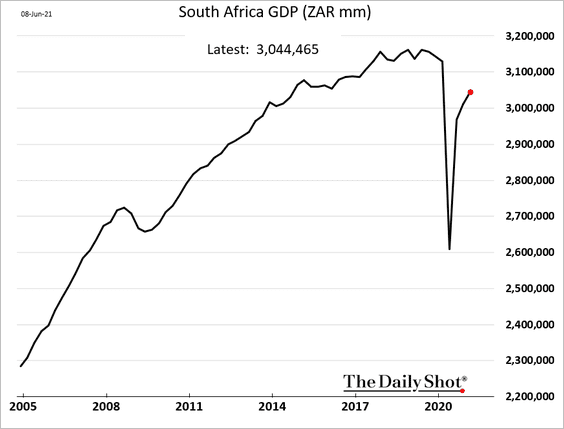
3. South Africa’s GDP is still below pre-COVID levels.
4. Russia is facing some inflationary pressures, with more rate hikes on the way.
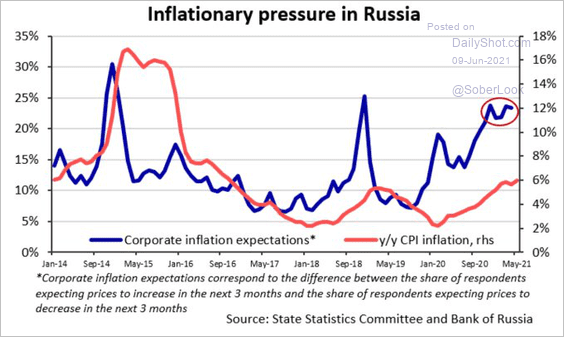 Source: @Tatiana_Evd
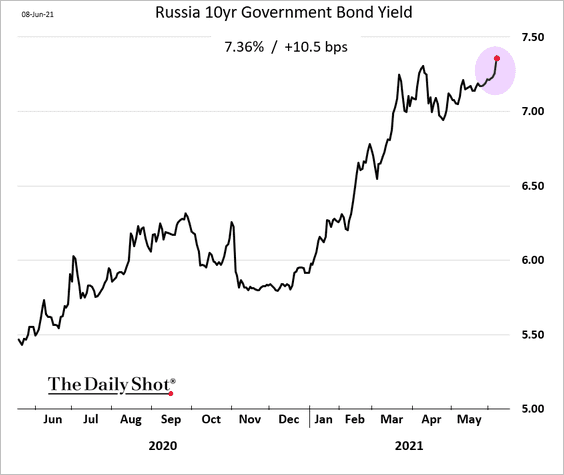
The 10yr bond yield jumped this week.
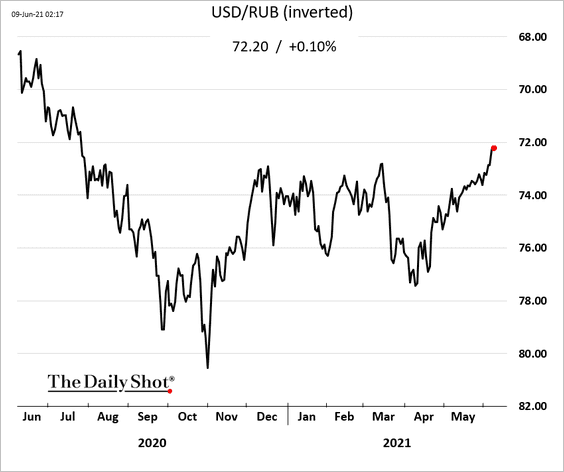
And the ruble continues to climb.
——————–
5. Here is the COVID situation across EM economies.
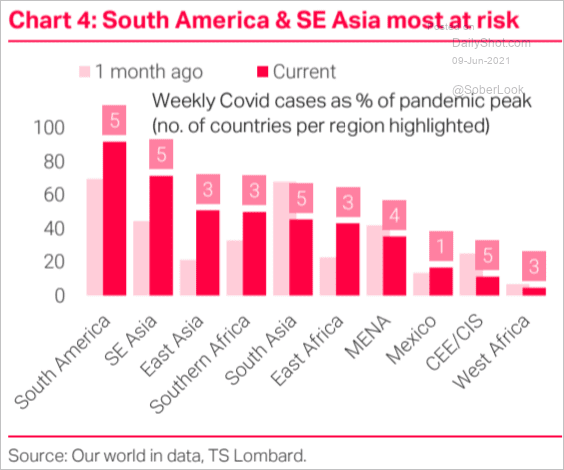 Source: TS Lombard
Back to Index
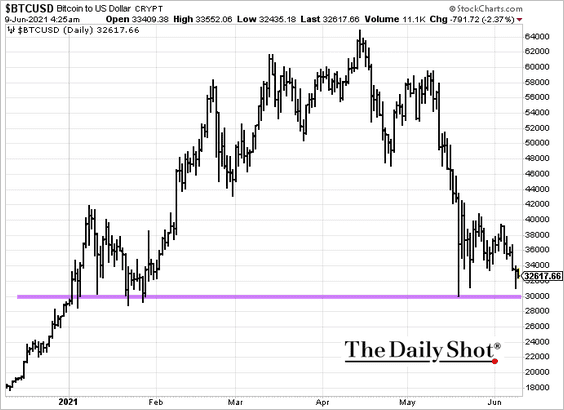
Cryptocurrency
1. Bitcoin is holding support at $30k.
2. The IRS wants to track crypto movements.
 Source: Reuters Read full article
Back to Index
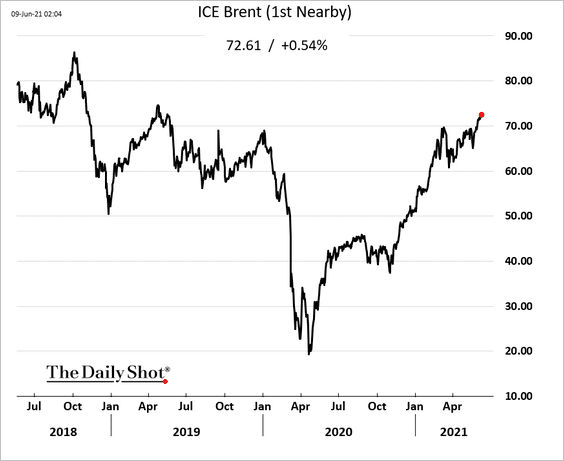
Energy
1. Brent continues to grind higher.
2. Rising prices bode well for energy CapEx (2 charts).
• Rigs vs. prices:
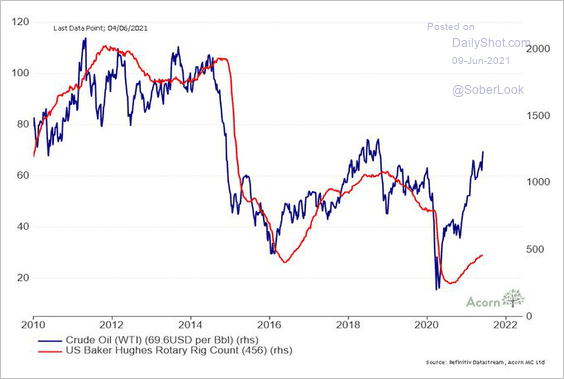 Source: @RichardDias_CFA
• Morgan Stanley’s CapEx index:
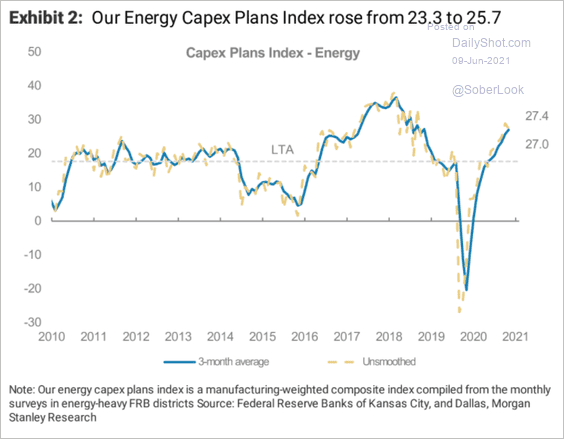 Source: Morgan Stanley Research
——————–
3. A lower dollar and rising oil prices could benefit energy stocks.
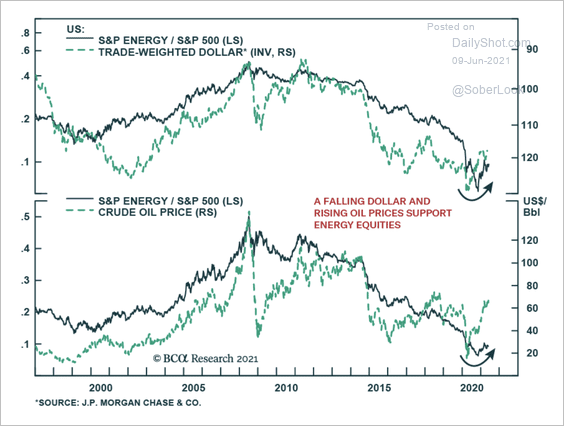 Source: BCA Research
Back to Index
Equities
1. Exceptionally low correlation between value and growth points to massive rotation (from growth to value).
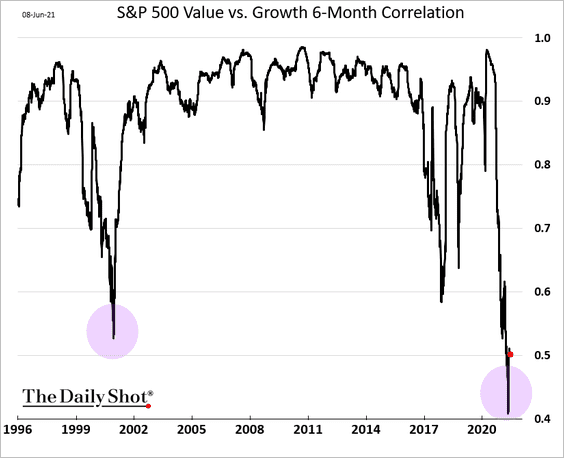
The resurgence of value stocks has been a major trend so far this year, outperforming growth in most regions globally.
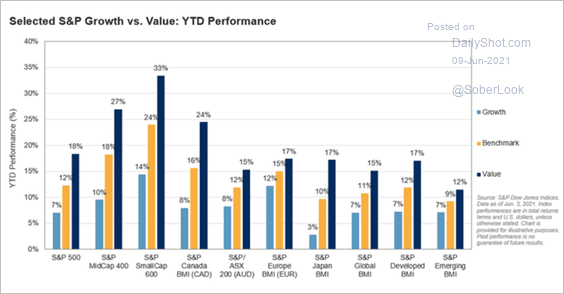 Source: S&P Global Market Intelligence
Value stocks’ valuations are still relatively low.
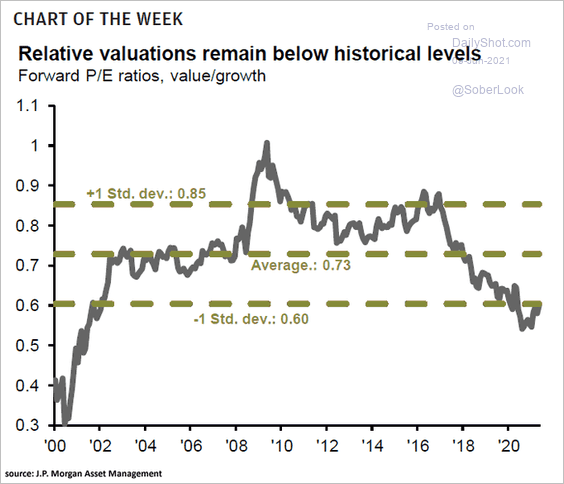 Source: @ISABELNET_SA, @JPMorganAM
——————–
2. The S&P 500 has been consolidating gains following a record rebound off pandemic lows.
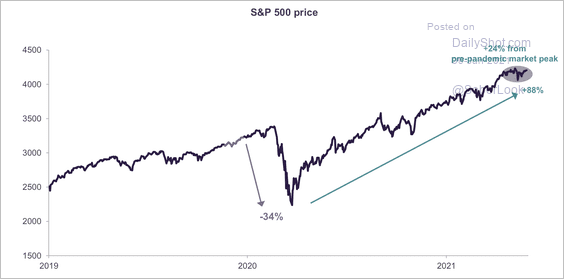 Source: Truist Advisory Services
3. The S&P SmallCap 600 Index’s daily return dispersion is rising again, which typically benefits stock pickers.
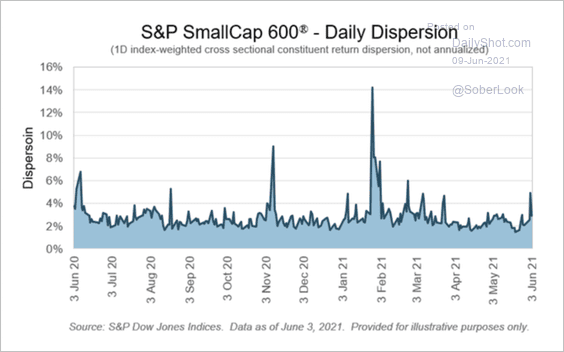 Source: S&P Global Market Intelligence
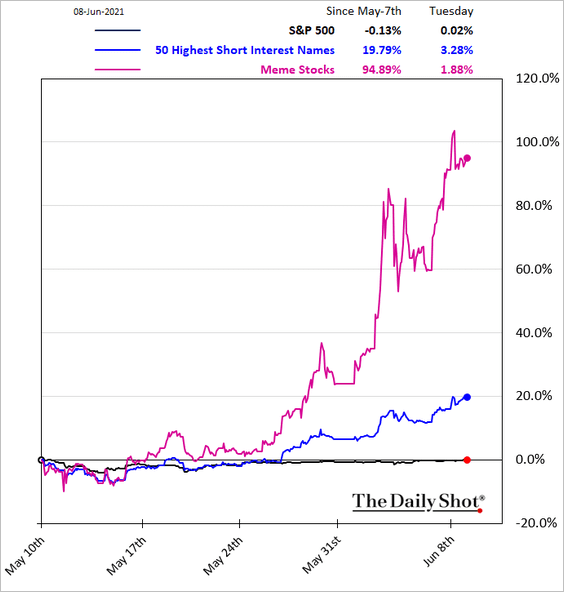
4. Targeted by the Reddit crowd, the most shorted names are up 20% over the past couple of weeks.
5. With institutional traders afraid to short stocks, the market is vulnerable to a downside gap.
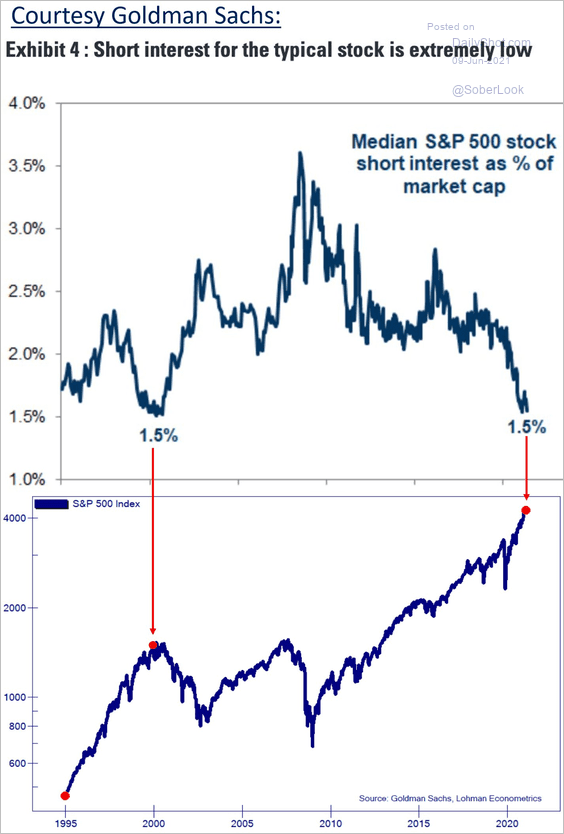 Source: Goldman Sachs, @Not_Jim_Cramer
6. Retail investors are deploying options again.
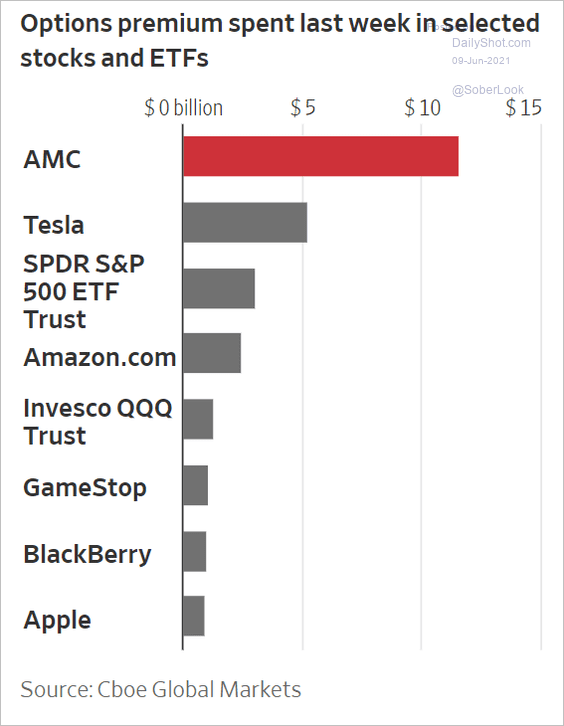 Source: @WSJ Read full article
Improved mobility (and a partial return to the office) hasn’t stopped individual investors from playing the options game – so far.
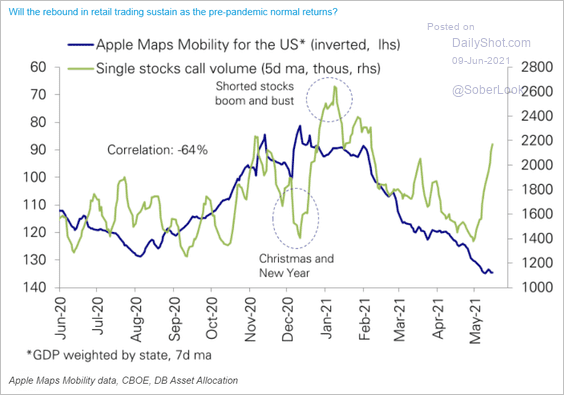 Source: Deutsche Bank Research
——————–
7. Here is an illustration of base effects in the S&P 500 profits.
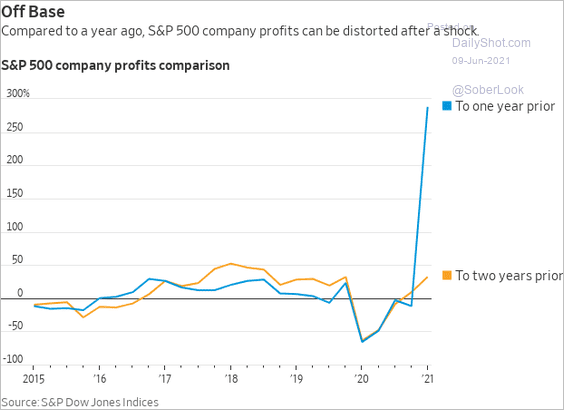 Source: @WSJ Read full article
• Earnings revisions have trended higher recently, especially for energy and material stocks.
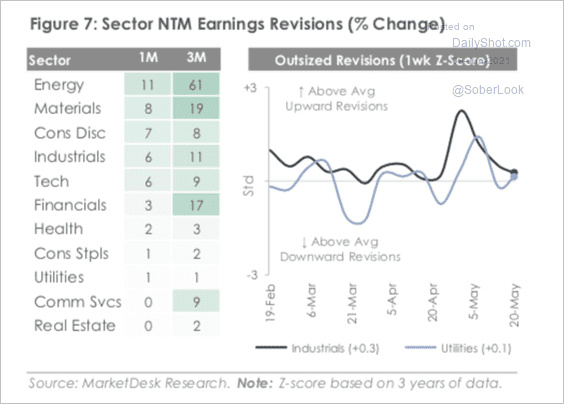 Source: MarketDesk Research
• This chart shows the evolution of forward EPS for large, mid, and small-cap shares.
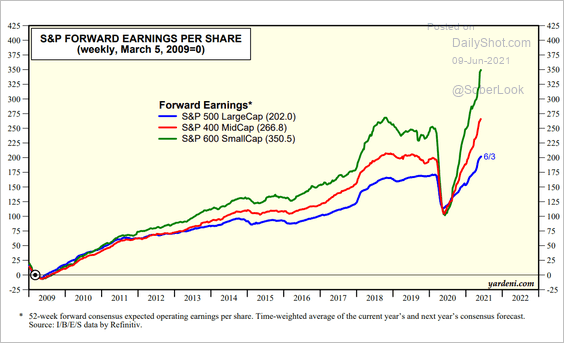 Source: Yardeni Research
——————–
8. Which sectors benefitted the most from COVID?
 Source: @ISABELNET_SA, @BofAML
9. Active large-cap funds did well in May.
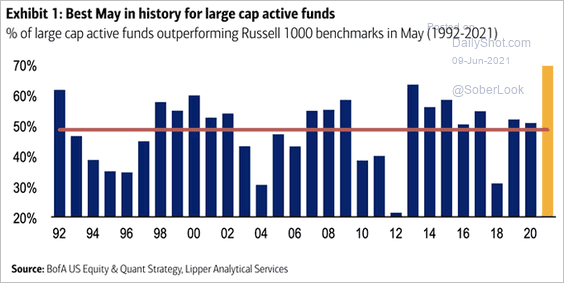 Source: @ISABELNET_SA, @BofAML
10. The recovery in retail sales points to continued gains in consumer discretionary stocks.
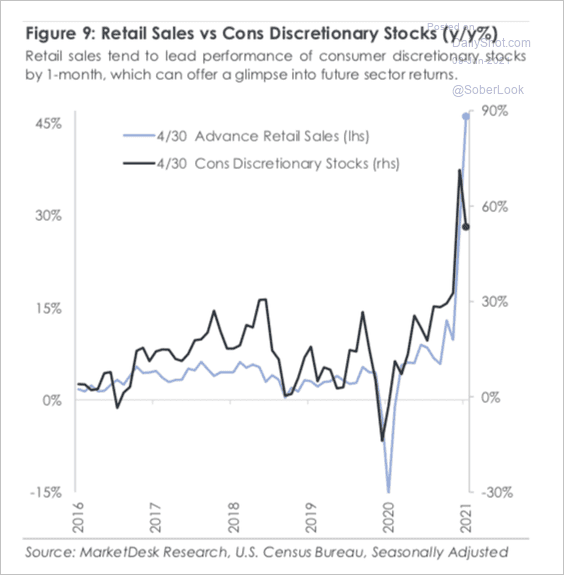 Source: MarketDesk Research
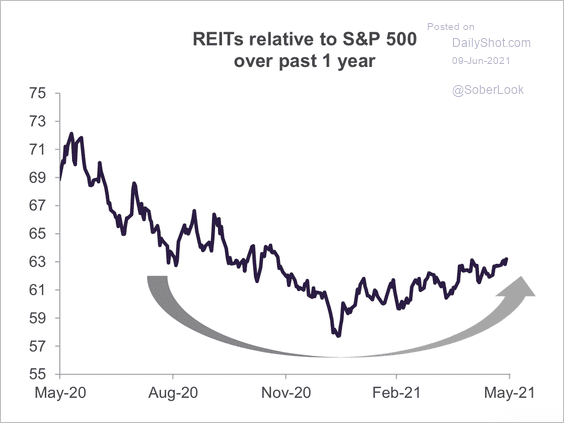
11. REITs have been recovering relative to the S&P 500 after extended underperformance (2 charts).
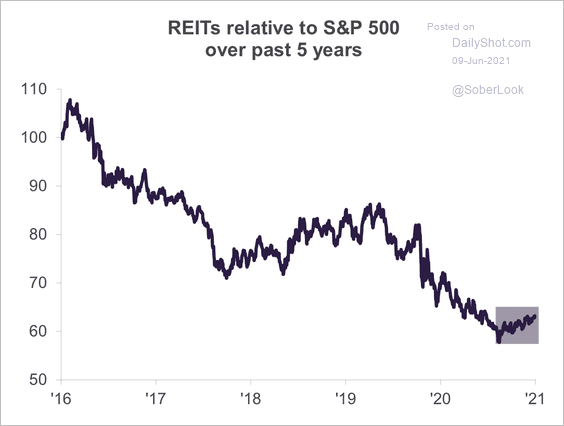 Source: Truist Advisory Services
 Source: Truist Advisory Services
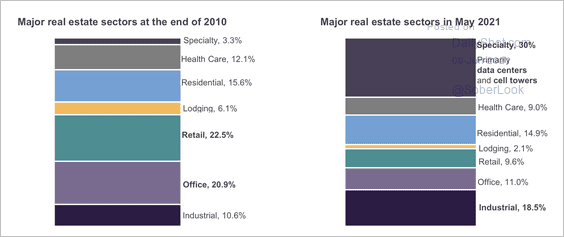
The Morningstar US REITs Index now includes more specialty REITs, primarily in data centers and cell towers.
 Source: Truist Advisory Services
Back to Index
Rates
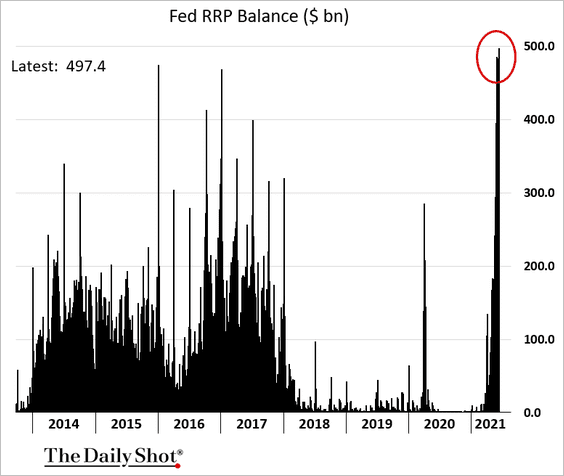
1. The Fed has been able to drain some excess liquidity with the reverse repo program. Banks and money market funds are depositing more cash with the central bank (nearly half a trillion now). This is what’s keeping short-term rates from moving deep into negative territory.
Short-term rates have drifted lower as demand for securities associated with large increases in bank reserves and money fund assets have exceeded supply, according to Cornerstone Macro.
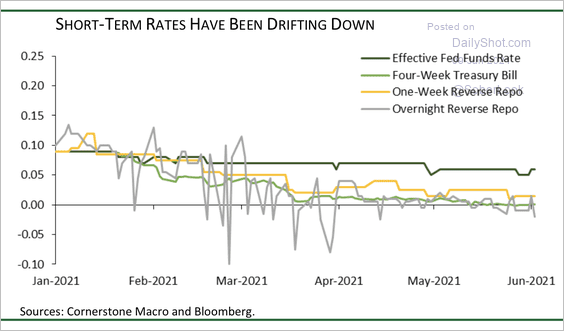 Source: Cornerstone Macro
The Treasury’s net issuance of bills has been negative in recent months, putting downward pressure on yields.
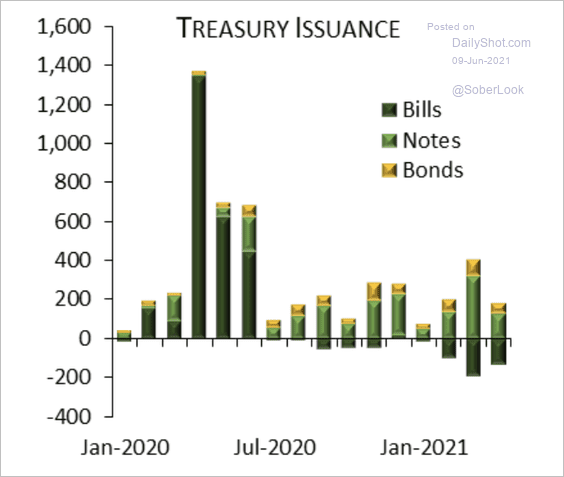 Source: Cornerstone Macro
——————–
2. JP Morgan’s client survey points to deeper bets against Treasuries. The risk to yields is to the downside.
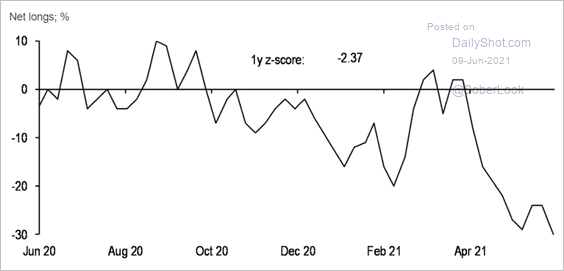 Source: JP Morgan, @themarketear
——————–
Food for Thought
1. Who is not online?
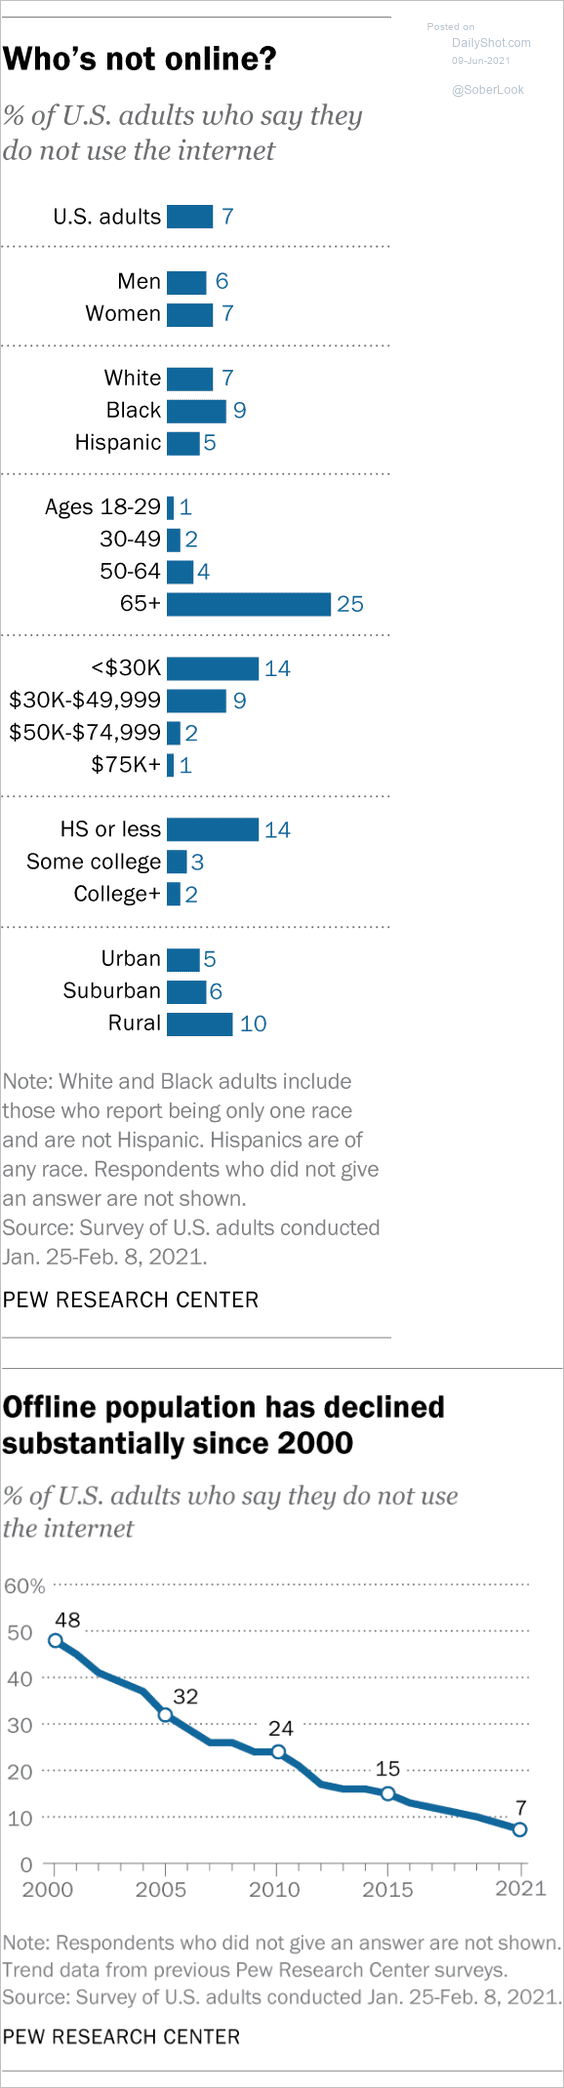 Source: Pew Research Center Read full article
2. What are you worth to Facebook?
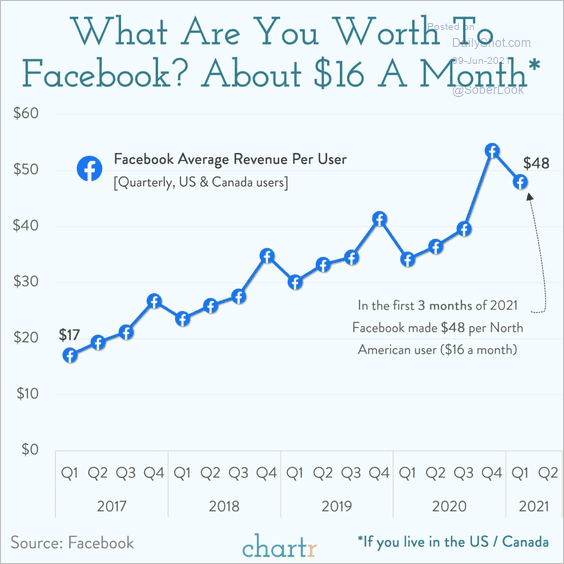 Source: @chartrdaily
3. The evolution of human space flight:
 Source: Statista
4. Highest number of days in space:
 Source: Statista
5. Global EV sales:
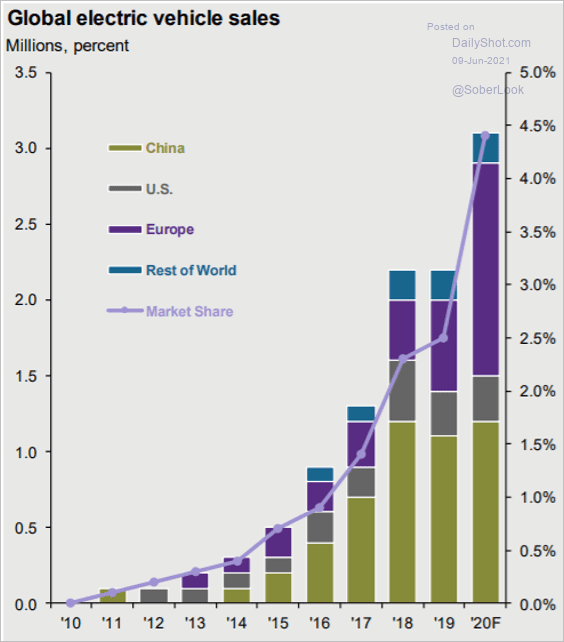 Source: J.P. Morgan Asset Management
6. How Tesla makes its money:
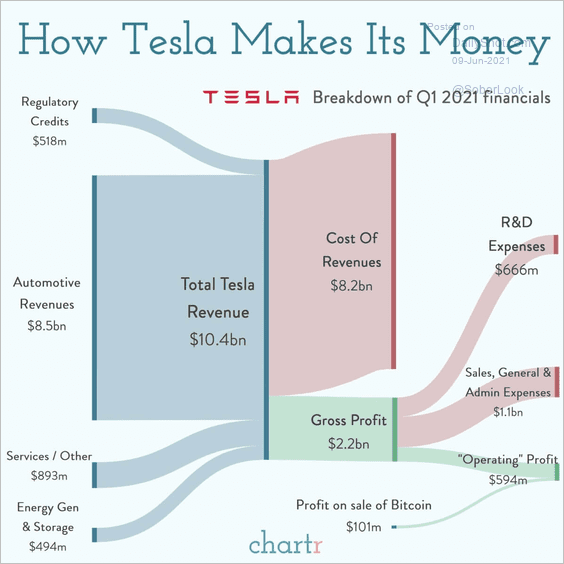 Source: @chartrdaily
7. Leaving San Francisco:
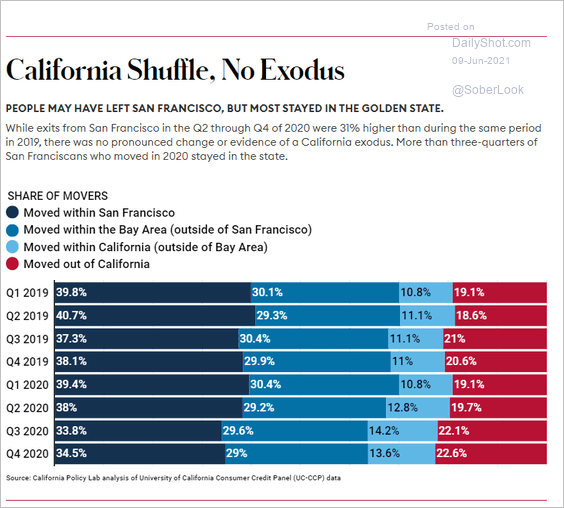 Source: Forbes Read full article
8. US imports of laptop computers:
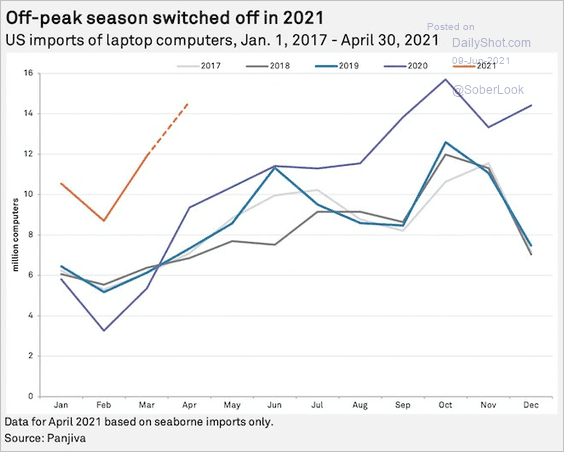 Source: S&P Global Market Intelligence
9. US mass shootings:
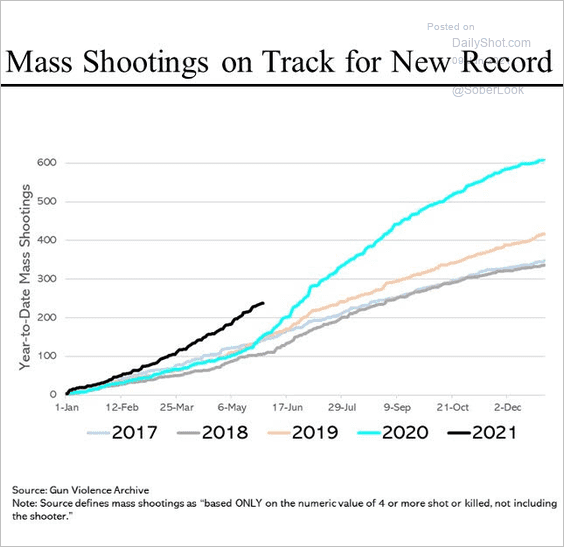 Source: @SteveRattner
10. President’s party performance in first midterms:
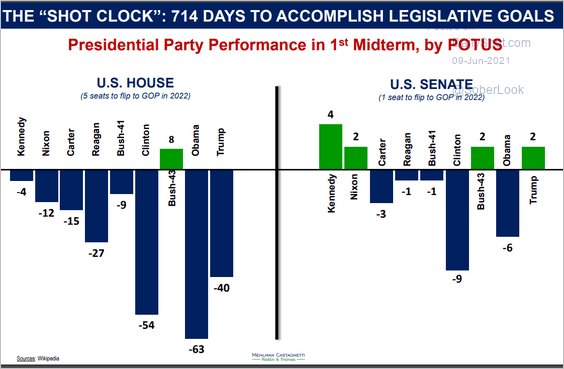 Source: Bruce Mehlman Read full article
11. Top powerlifting and marathon performances over time:
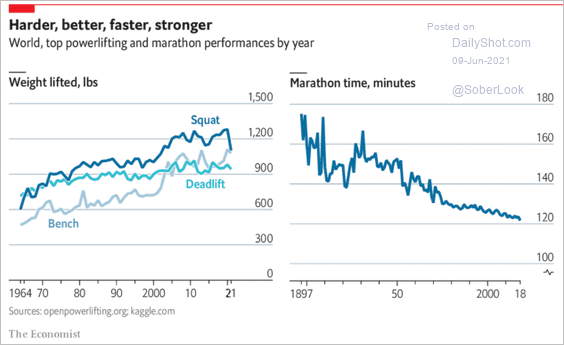 Source: The Economist Read full article
——————–
Back to Index