
The Daily Shot: 24-Jun-21
• The United States
• Canada
• The United Kingdom
• The Eurozone
• Asia – Pacific
• Emerging Markets
• Cryptocurrency
• Commodities
• Energy
• Equities
• Rates
• Global Developments
• Food for Thought
The United States
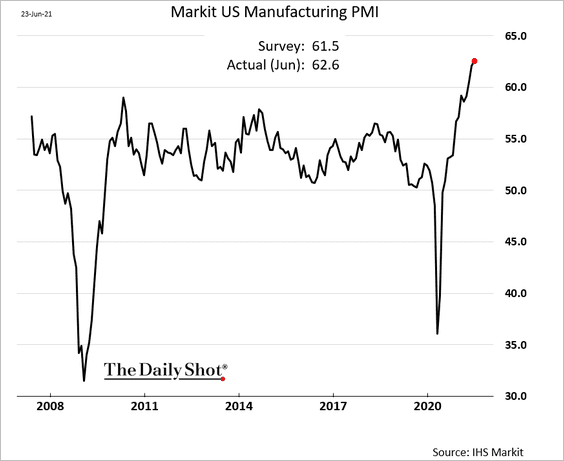
1. The Markit Manufacturing PMI hit a new record, pointing to exceptionally strong growth in US factory activity.
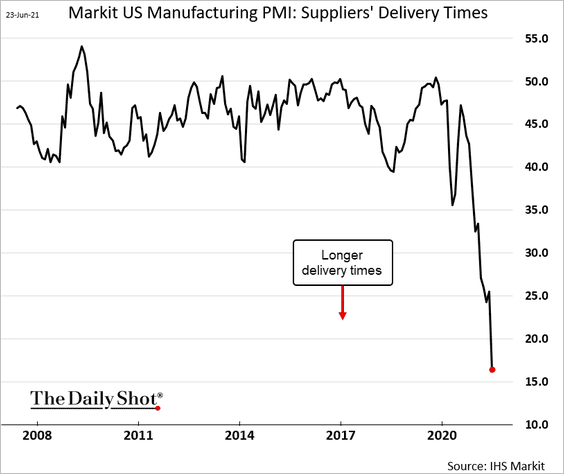
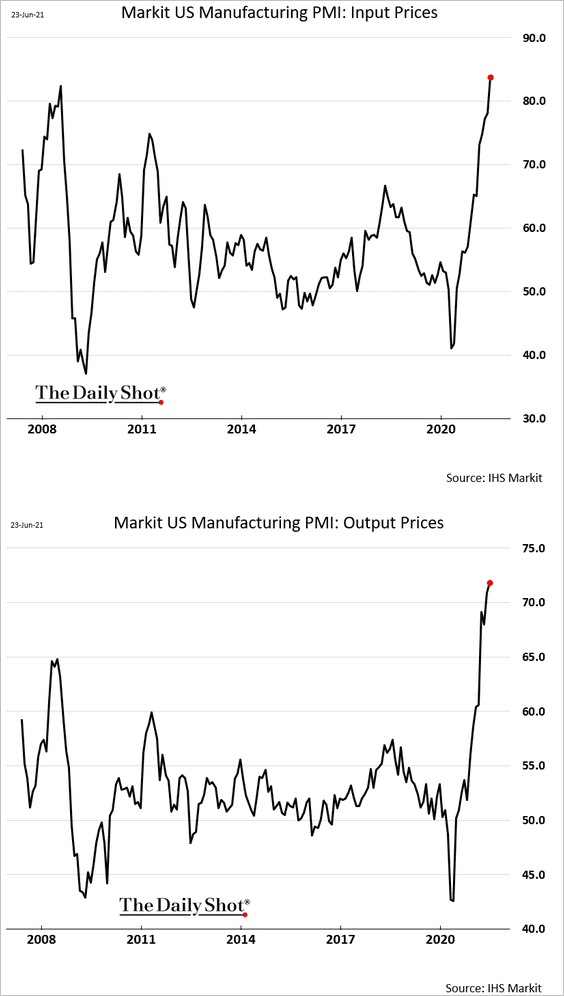
Neither supply chain bottlenecks nor price pressures show signs of abating.
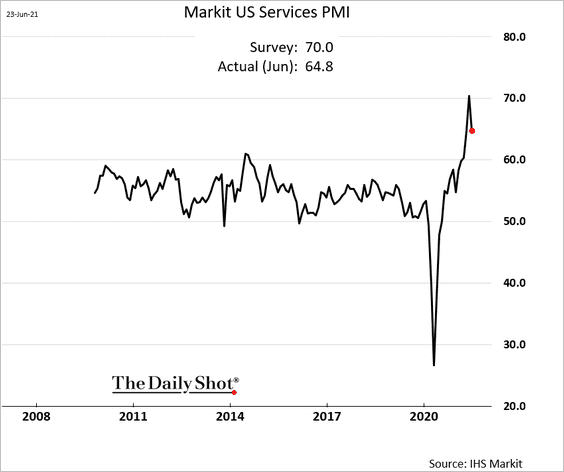
Markit’s service-sector growth index eased from the May peak but remains robust.
——————–
2. Trucking rates appear to be peaking.
 Source: Arbor Research & Trading
3. The massive revision in the nation’s industrial production index shows that the trade war did more damage to output than previously thought.
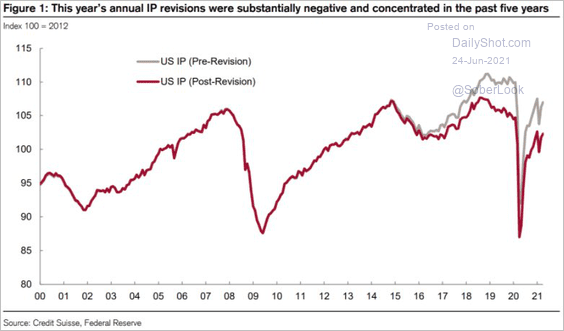 Source: @LizAnnSonders, @CreditSuisse
4. After years of underinvestment, …
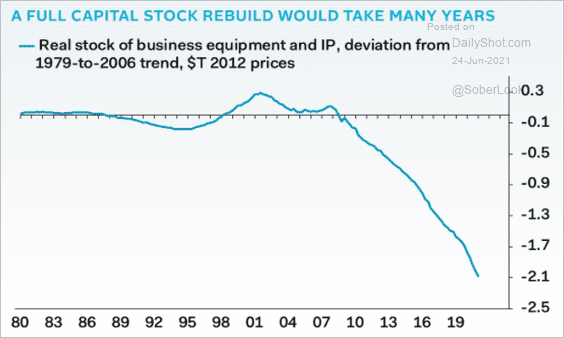 Source: Pantheon Macroeconomics
… CapEx is expected to rebound, boosted by strong corporate earnings.
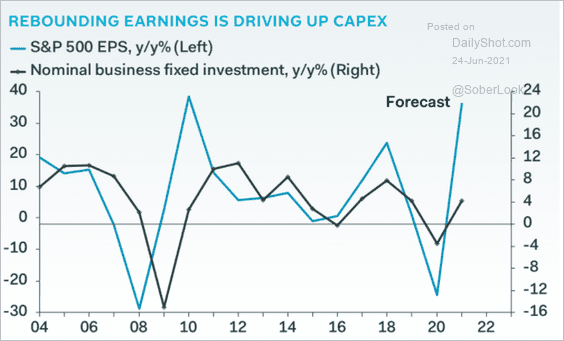 Source: Pantheon Macroeconomics
——————–
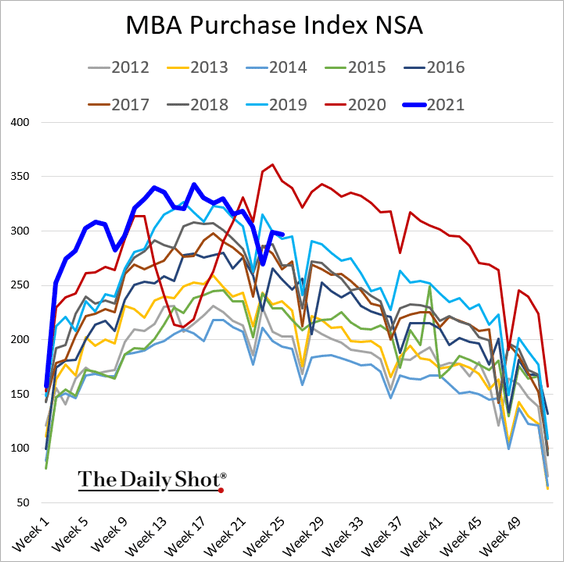
5. Next, we have some updates on the housing market.
• Loan applications for house purchase are now at 2019 levels, suggesting that the pandemic-driven surge in housing activity is ebbing.
• New home sales remain elevated but are moderating.
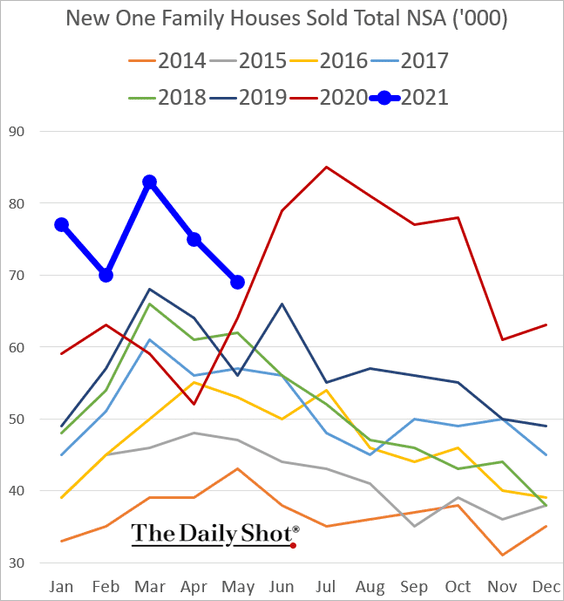
We are back to the pre-COVID trend.
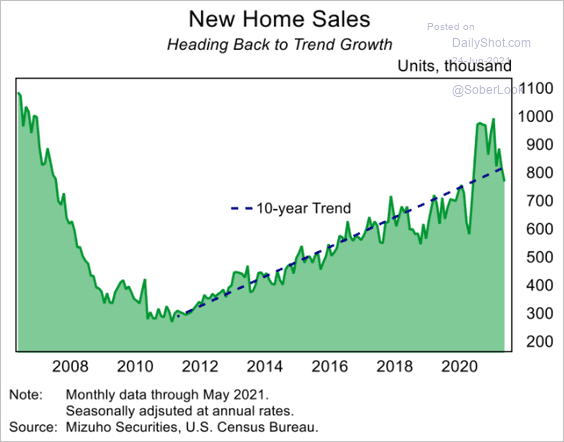 Source: Mizuho Securities USA
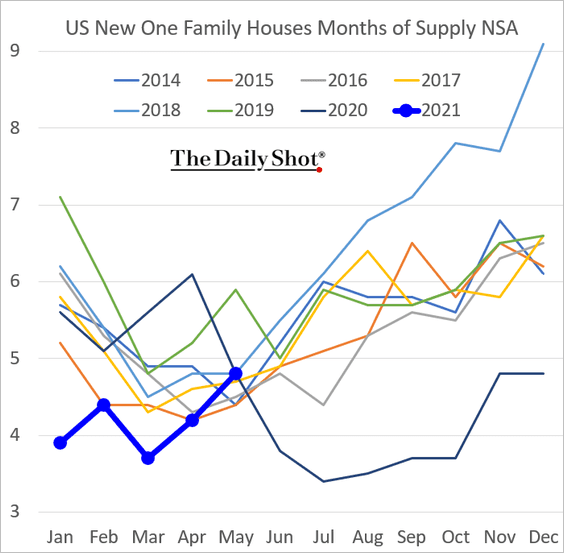
– The inventory of new homes for sale (measured in months of supply) climbed in May.
– The median price of new homes sold hit a record high.
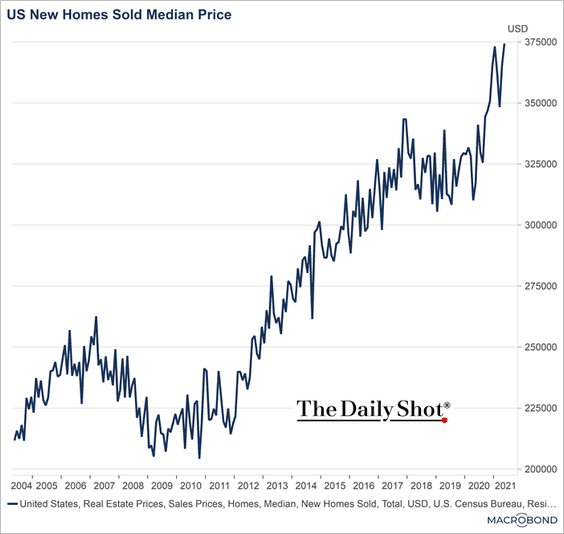 Source: Chart and data provided by Macrobond
Here is the shift in price categories from May 2020.
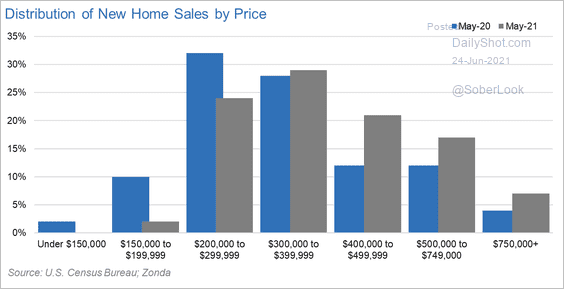 Source: @TheStalwart, @AliWolfEcon Read full article
• This chart shows the ratio of new to existing home prices.
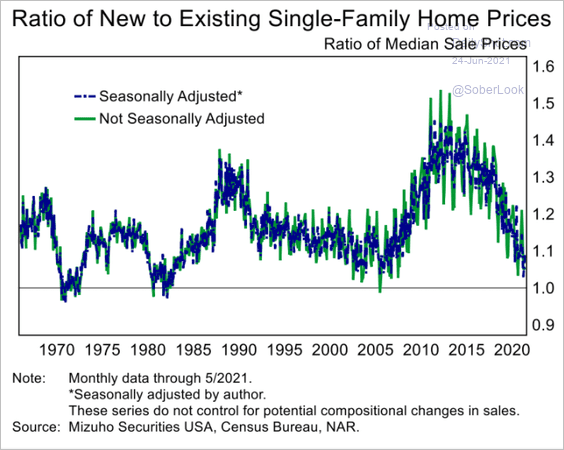 Source: Mizuho Securities USA
• Construction on many new homes for sale hasn’t started yet, as homebuilders face capacity constraints.
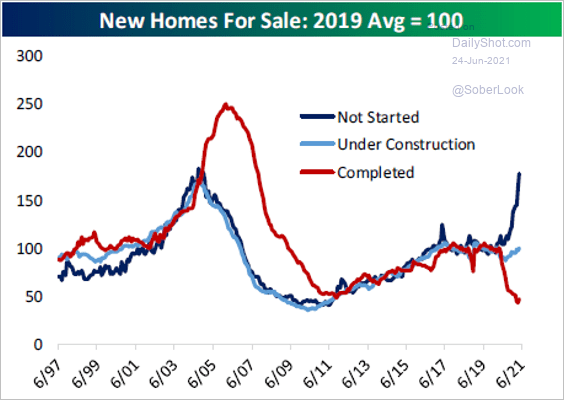 Source: @bespokeinvest Read full article
• Homebuilder and homebuyer confidence trends have diverged.
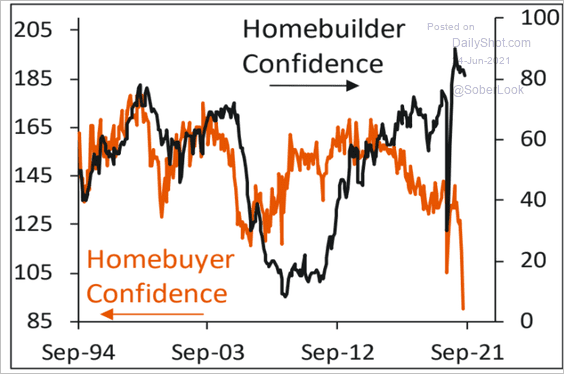 Source: Piper Sandler
——————–
6. Just as we saw in the U. Michigan report, the HP S-CS data show consumers increasingly uneasy with buying a home or making other major purchases. This trend is due to rapid price gains.
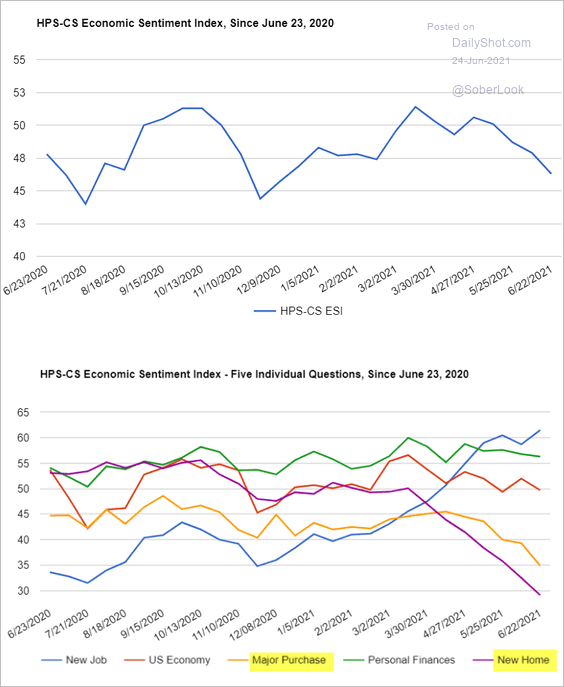 Source: @HPS_CS, @HPSInsight, @CivicScience
7. US birth rates are collapsing and are now only slightly above death rates. With immigration remaining depressed (chart), the US is “turning Japanese.”
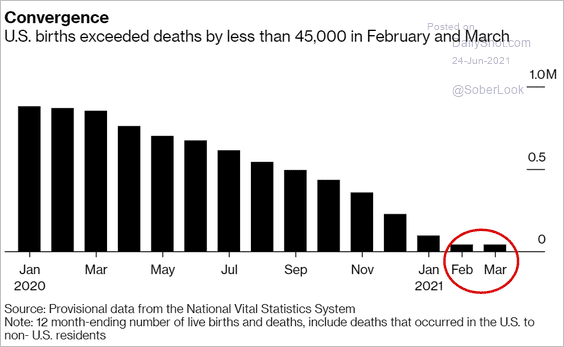 Source: @business Read full article
Back to Index
Canada
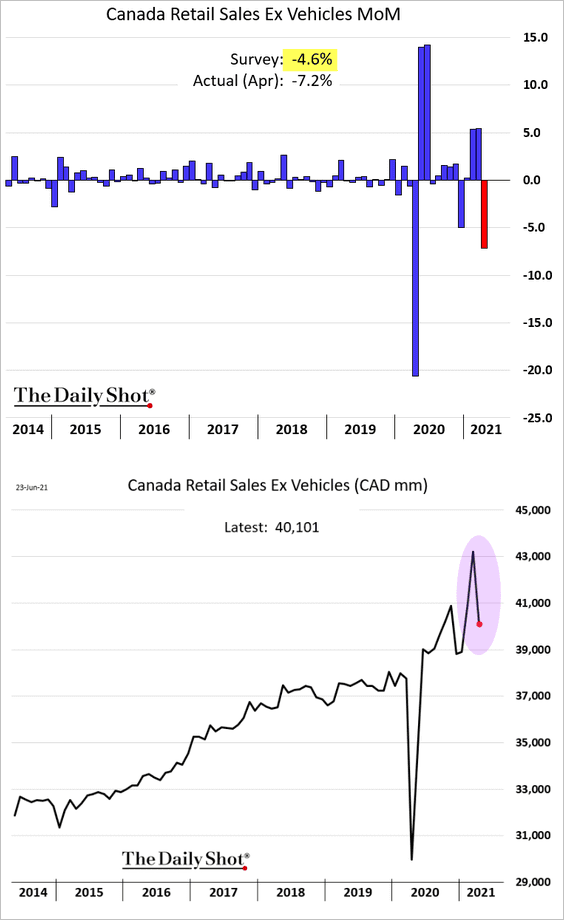
1. Retail sales tumbled in April but were still well above pre-COVID levels.
2. Canada’s housing inventory remains exceptionally tight.
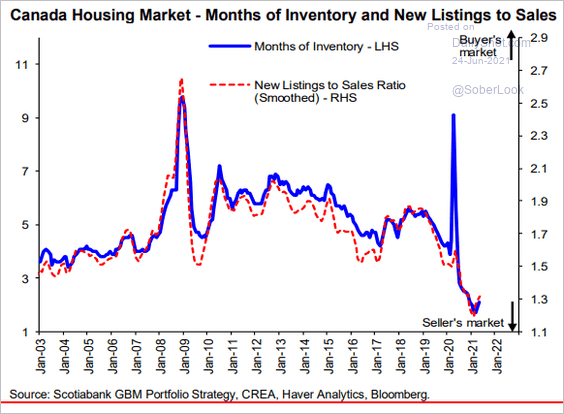 Source: Hugo Ste-Marie, Portfolio & Quantitative Strategy Global Equity Research, Scotia Capital
3. According to Desjardins, the BoC will begin hiking rates in tandem with the Fed.
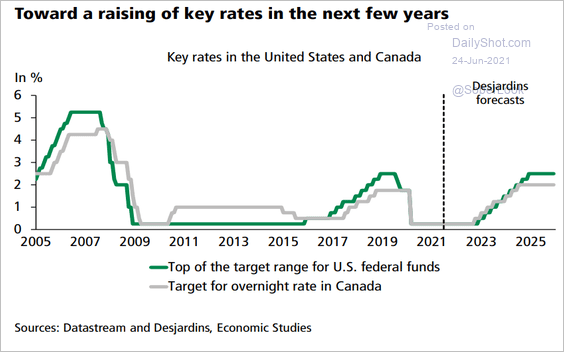 Source: Desjardins
4. Here is the Oxford Economics Recovery Tracker.
![]() Source: Oxford Economics
Source: Oxford Economics
Back to Index
The United Kingdom
1. June PMI indices were off the highs, but growth remains robust.
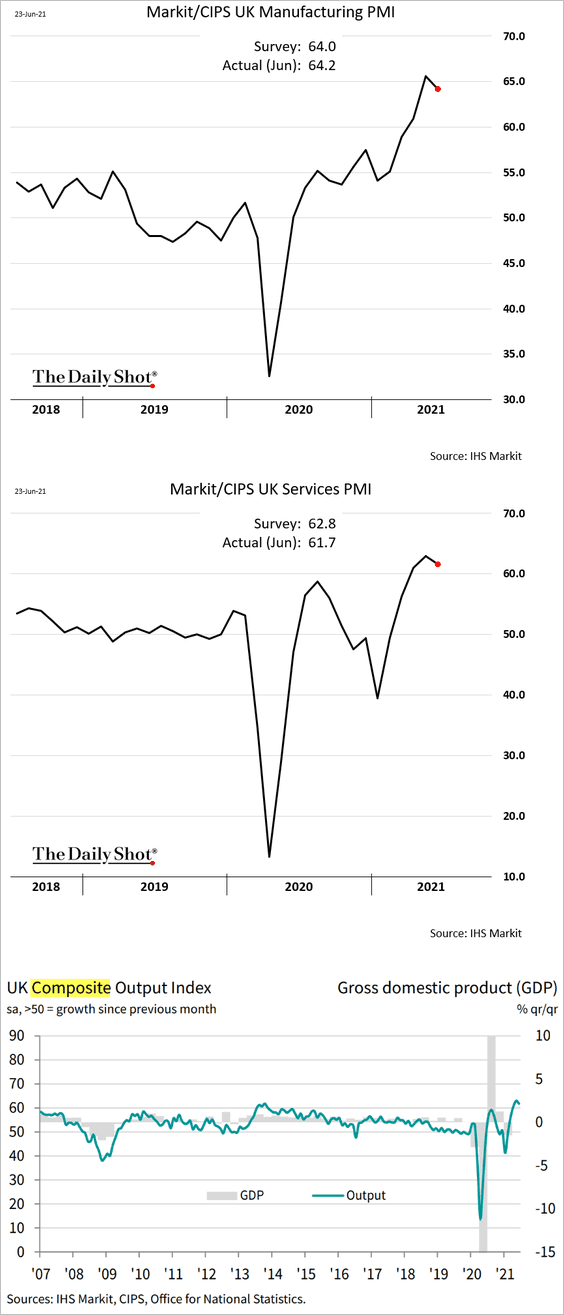 Source: IHS Markit
Supplier bottlenecks are becoming more extreme.
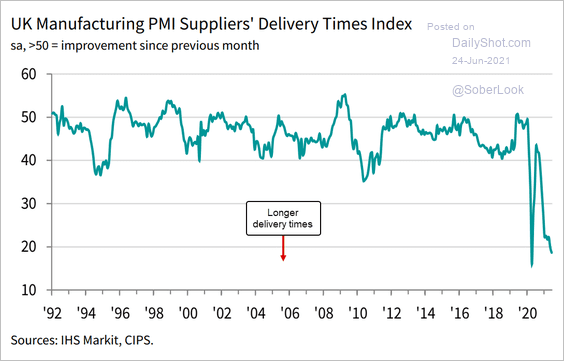 Source: IHS Markit
The services PMI price index points to a sharp acceleration in service consumer inflation.
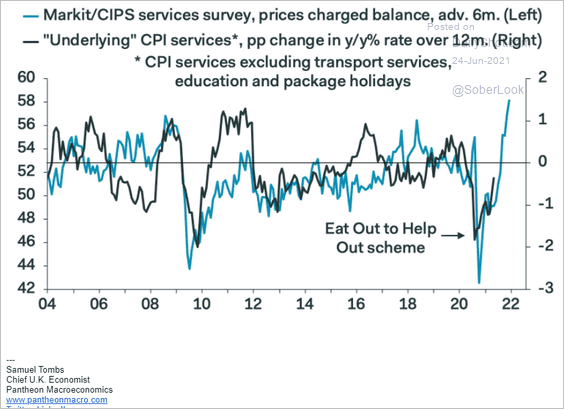 Source: Pantheon Macroeconomics
——————–
2. High-frequency indicators suggest that activity is close to full recovery.
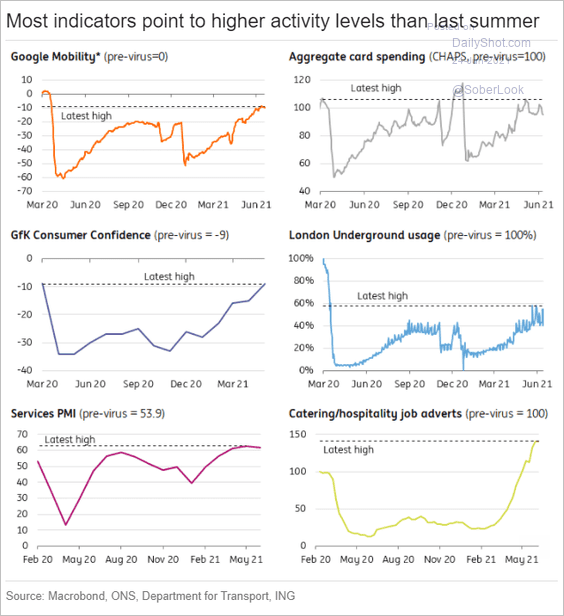 Source: ING
Social distancing indices are trending lower.
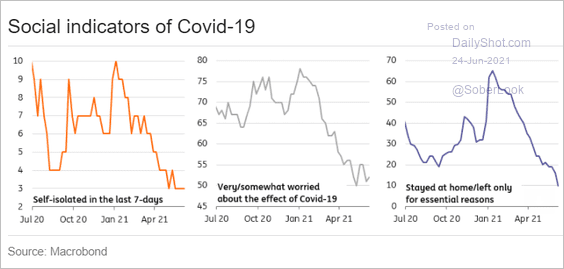 Source: ING
——————–
3. UK stocks continue to underperform.
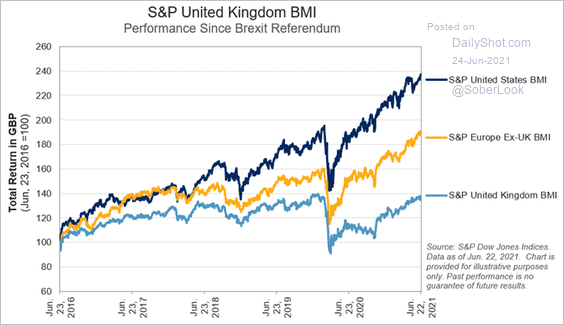 Source: S&P Global Market Intelligence
Back to Index
The Eurozone
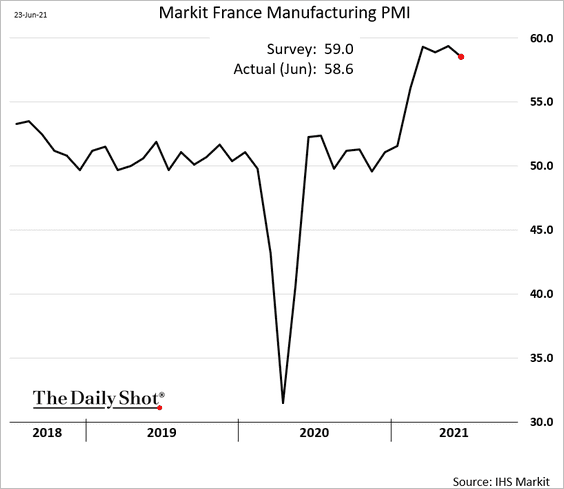
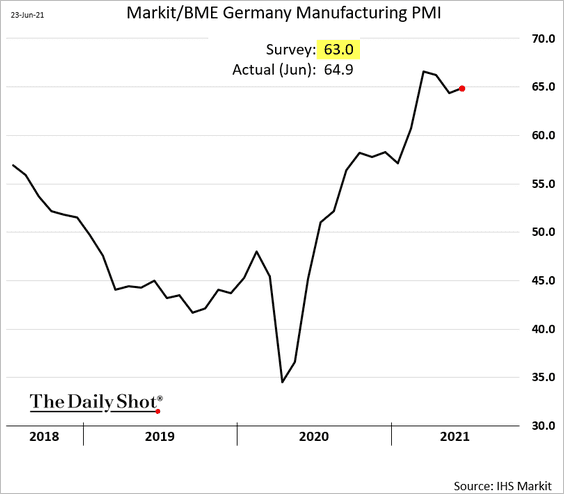
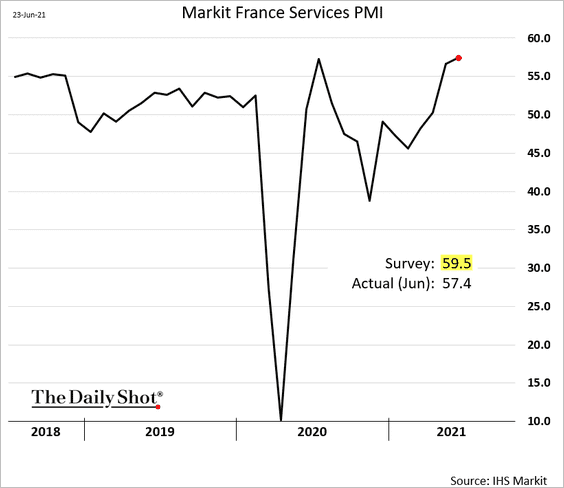
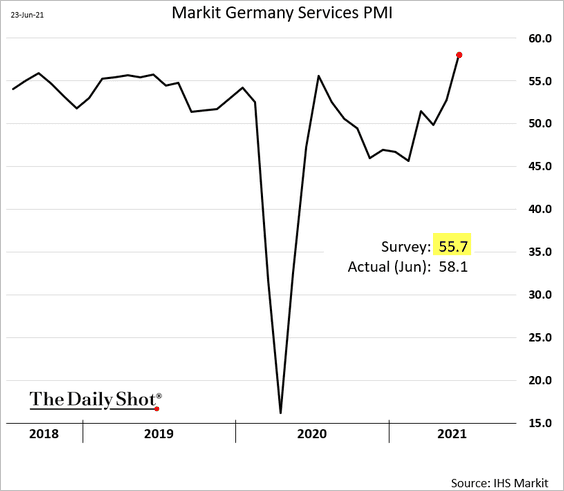
1. The June PMI report shows business activity accelerating.
• Manufacturing:
• Services (sharp gains in Germany):
• Germany’s composite PMI:
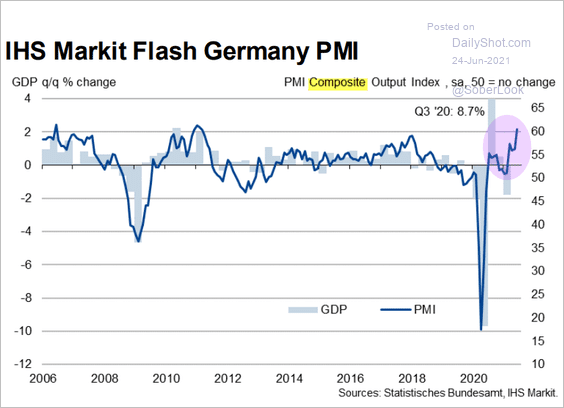 Source: IHS Markit
• The Eurozone composite PMI:
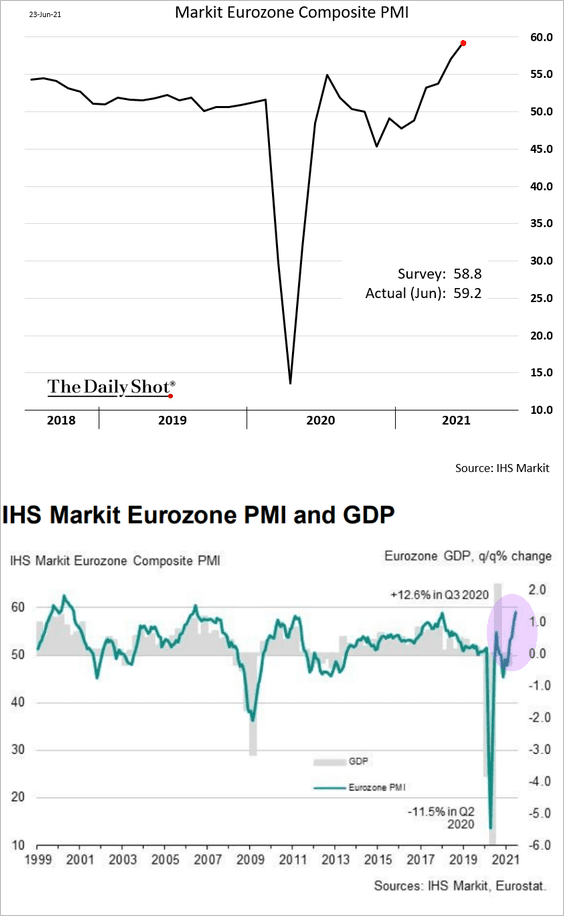 Source: IHS Markit
——————–
2. Price pressures continue to build.
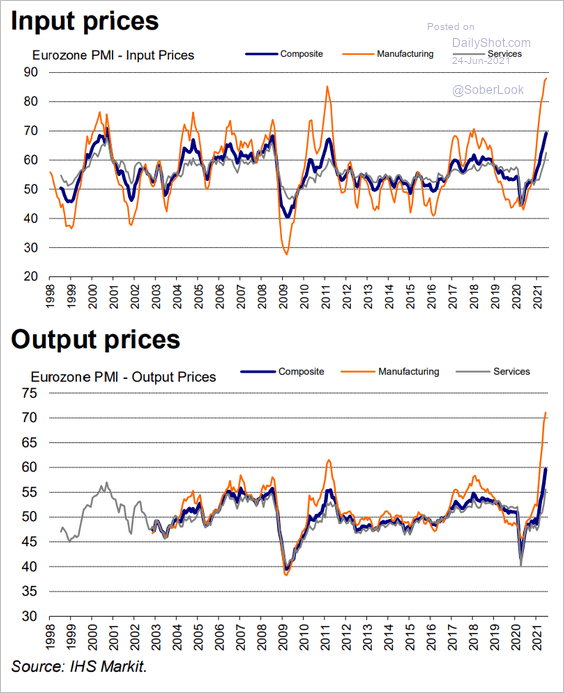 Source: IHS Markit
3. The euro is much stronger than the EUR/USD exchange rate suggests. Will the currency strength delay the ECB’s QE taper?
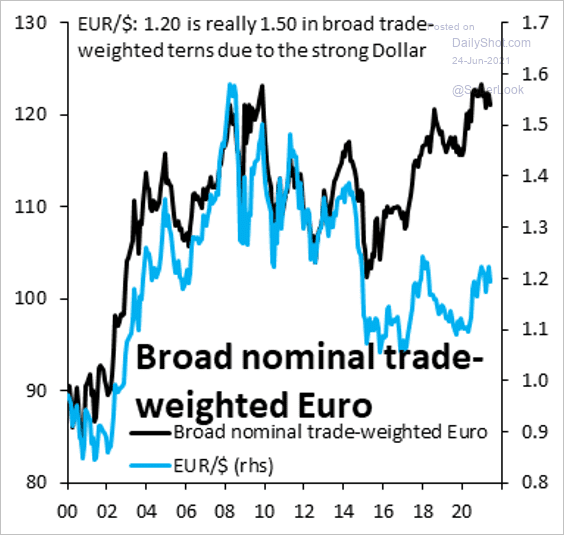 Source: @RobinBrooksIIF
Back to Index
Asia – Pacific
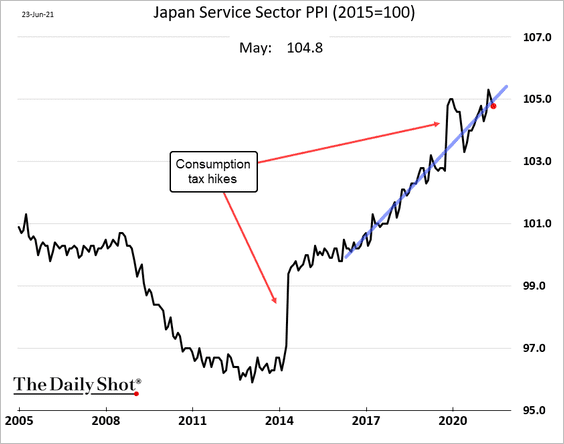
1. Japan’s recent service-sector PPI gains are consistent with the multi-year trend.
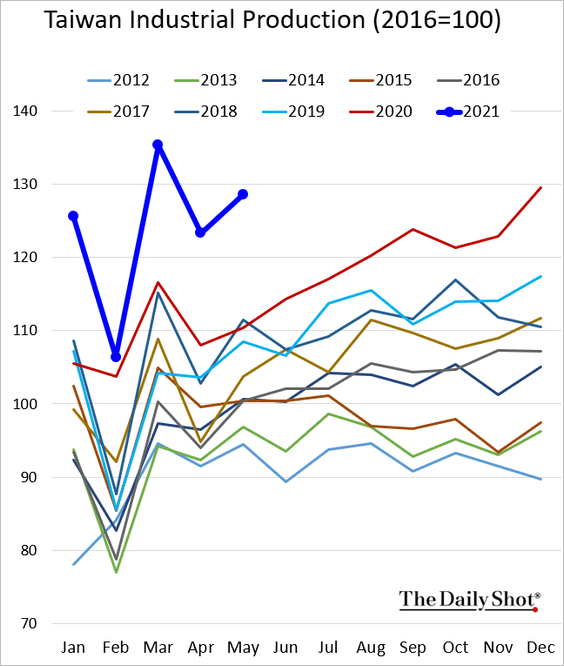
2. Taiwan’s industrial production remains remarkably strong (boosted by export orders).
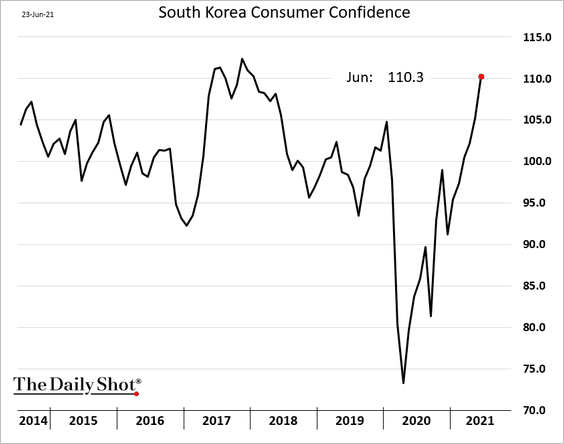
3. South Korea’s consumer confidence is surging.
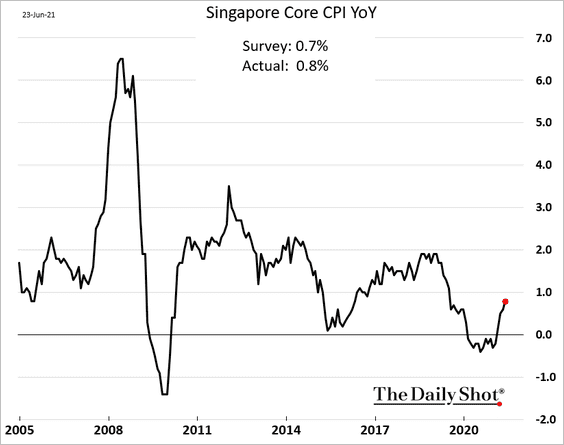
4. Singapore’s consumer inflation is recovering, but the core CPI remains below 1%.
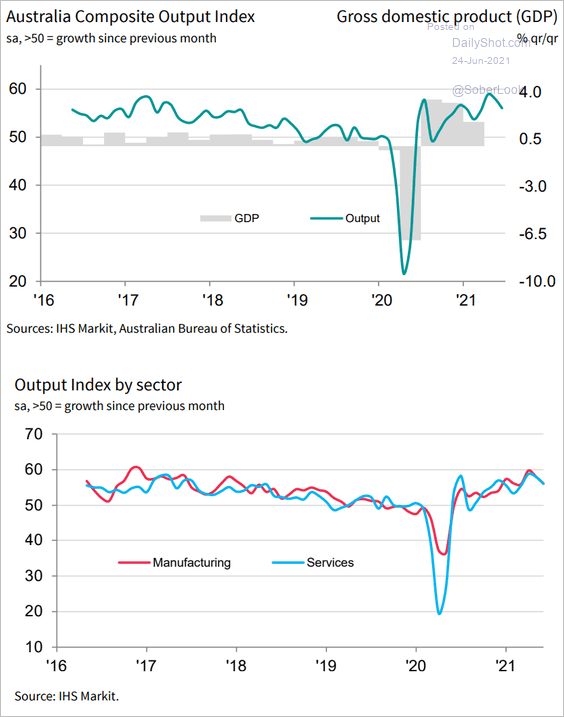
5. Australia’s PMI indicators are off the highs, but expansion continues.
 Source: IHS Markit
Separately, Morgan Stanley expects AUD/USD to re-test support at 0.70.
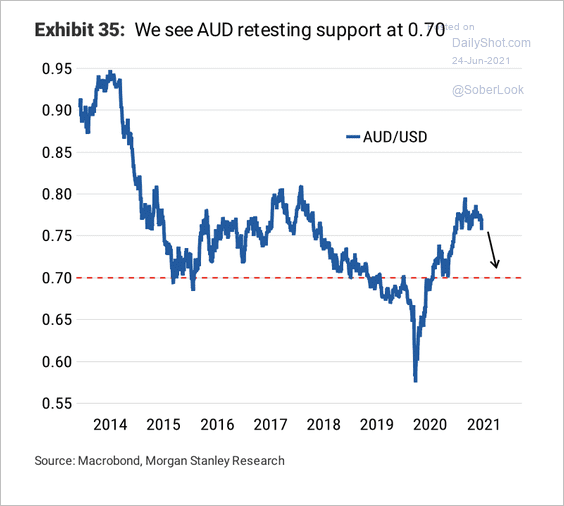 Source: Morgan Stanley Research
Back to Index
Emerging Markets
1. Let’s start with some data on LatAm international debt issuance.
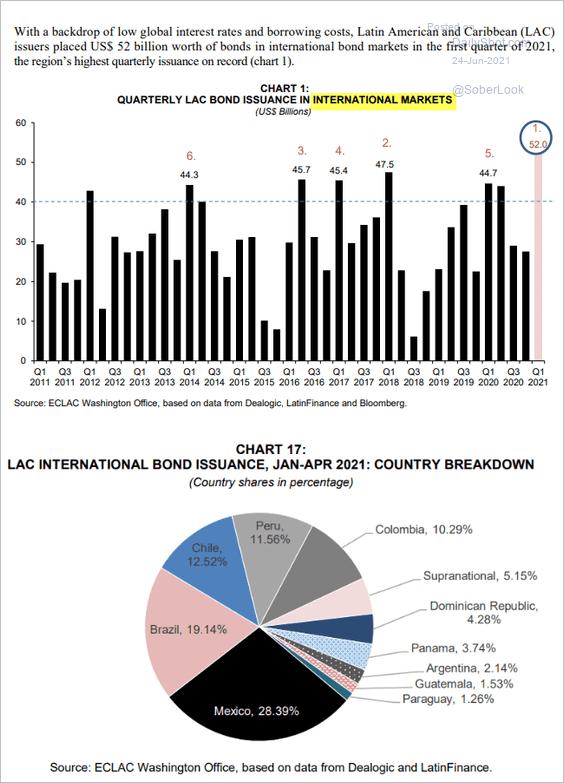 Source: ECLAC – United Nations Read full article
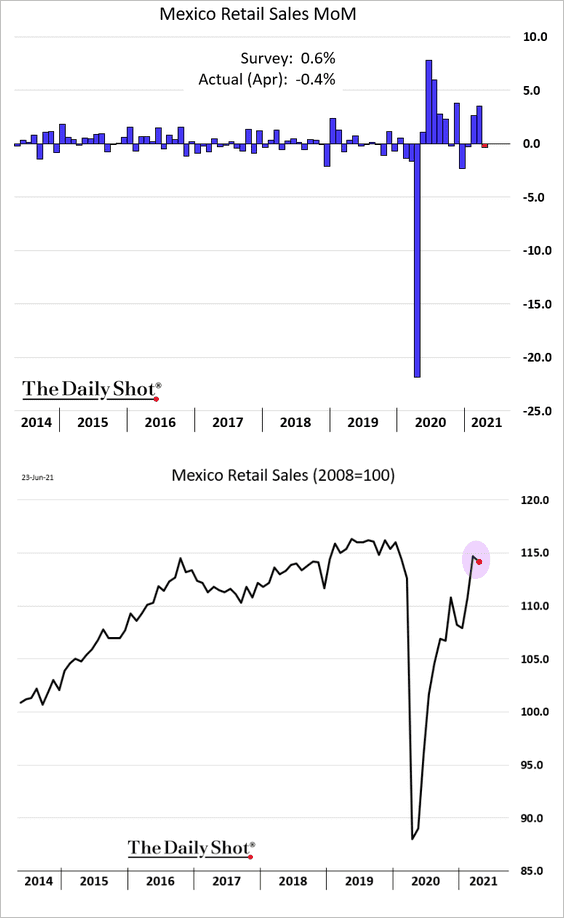
2. Mexican retail sales unexpectedly dipped in April. Note that recent retail sales reports missed market expectations across North America (Mexico, Canada, and the US).
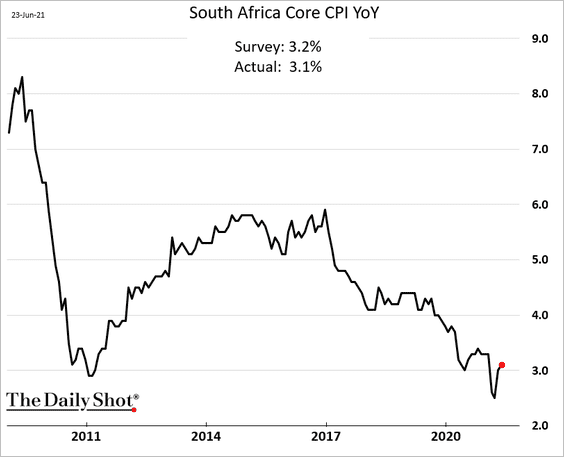
3. South Africa’s inflation remains relatively benign.
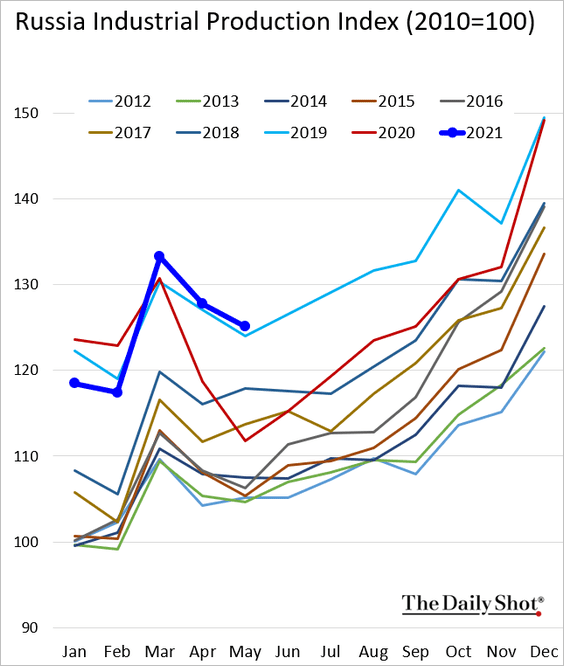
4. Russia’s industrial production is in line with pre-COVID (2019) levels.
5. Bank lending has weakened in some emerging Asia countries over the past few years.
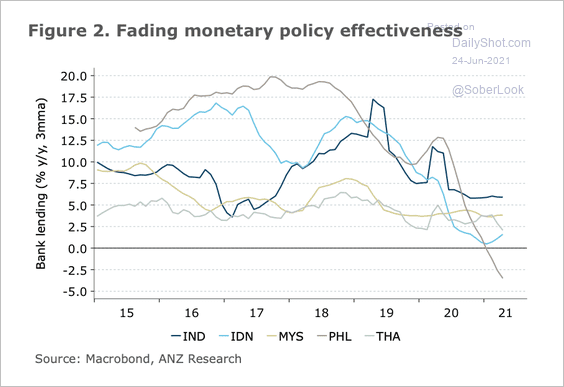 Source: ANZ Research
Back to Index
Cryptocurrency
1. Bitcoin’s sell-off coincided with a broader move away from risky assets over the past month, as shown by the decline in the copper/gold ratio. Will support hold?
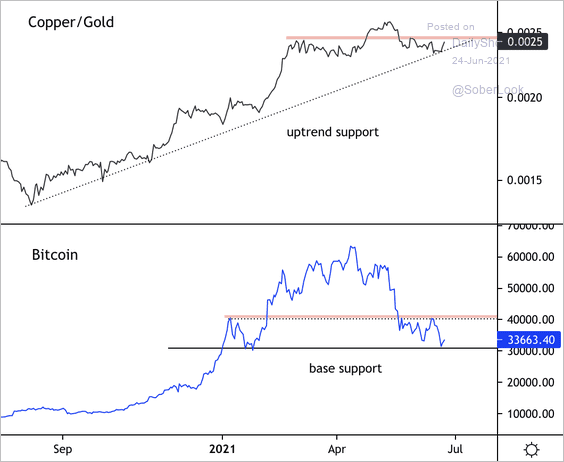 Source: Dantes Outlook
Also, we’ve got a head-and-shoulders formation in Bitcoin.
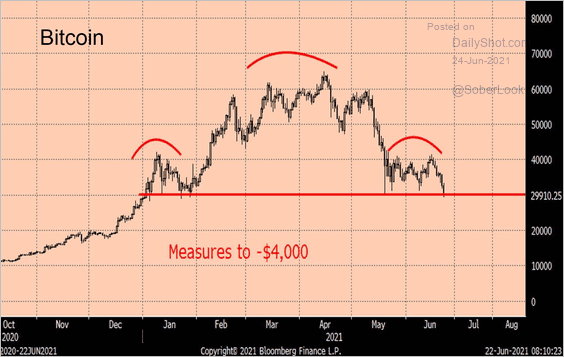 Source: @carlquintanilla, @DRWTrading
——————–
2. Some of the largest cryptocurrencies are still down over the past month.
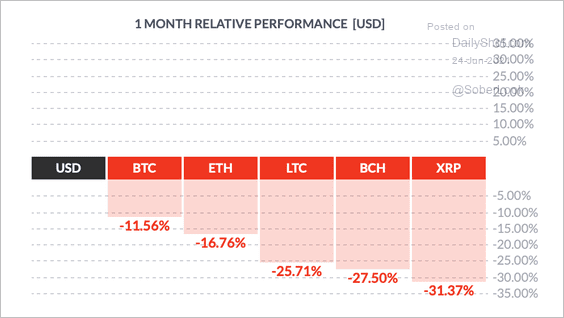 Source: FinViz
3. Bitcoin has lost market share to altcoins this year.
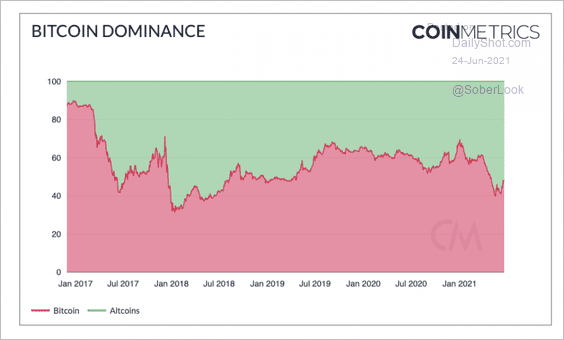 Source: Coin Metrics
4. Is the latest boom/bust cycle different?
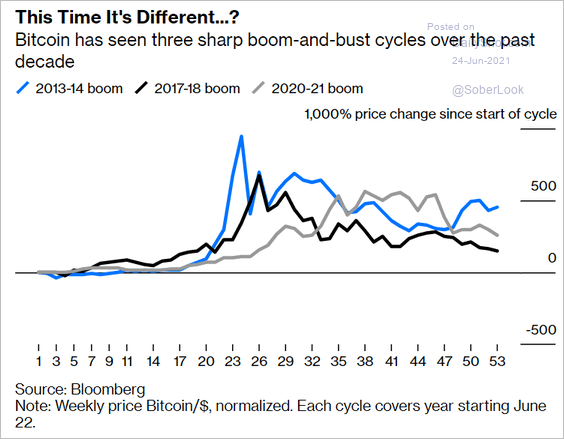 Source: @LionelRALaurent, @bopinion Read full article
5. The recent decline in the share of global negative-yielding debt could present a headwind for cryptocurrencies.
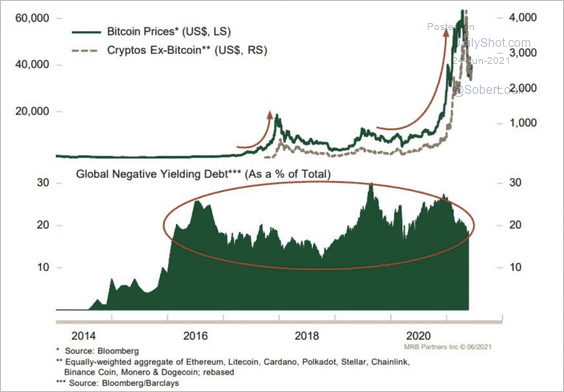 Source: MRB Partners
6. Online search activity for crypto declined in recent weeks.
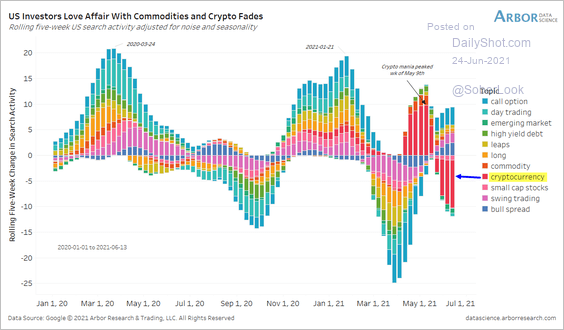 Source: Arbor Research & Trading
Back to Index
Commodities
1. Fitch Solutions expects that lower Chinese demand and higher production will pressure copper prices towards the second half of the year (2 charts).
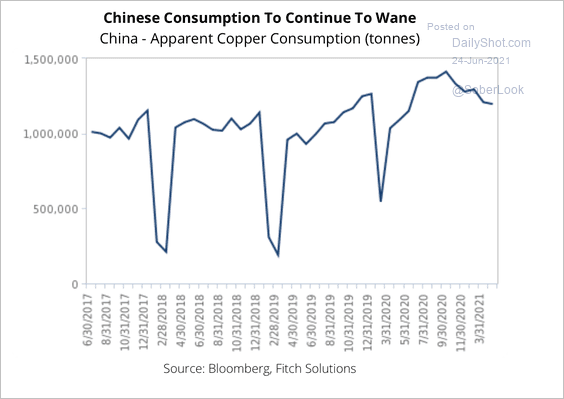 Source: Fitch Solutions Macro Research
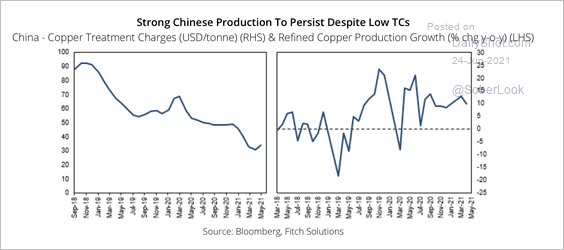 Source: Fitch Solutions Macro Research
——————–
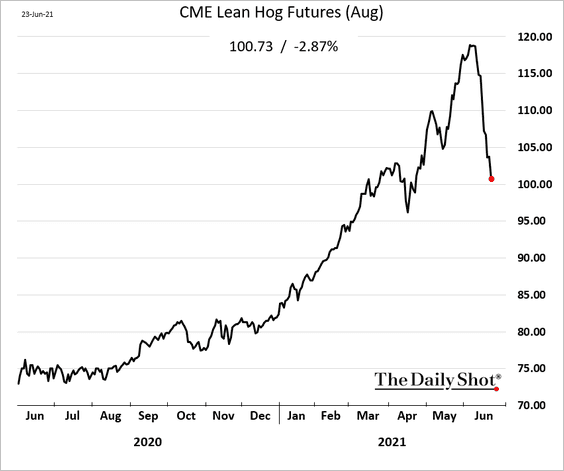
2. Chicago hog futures continue to tumble.
 Source: Reuters Read full article
Back to Index
Energy
1. US crude oil inventories keep shrinking.
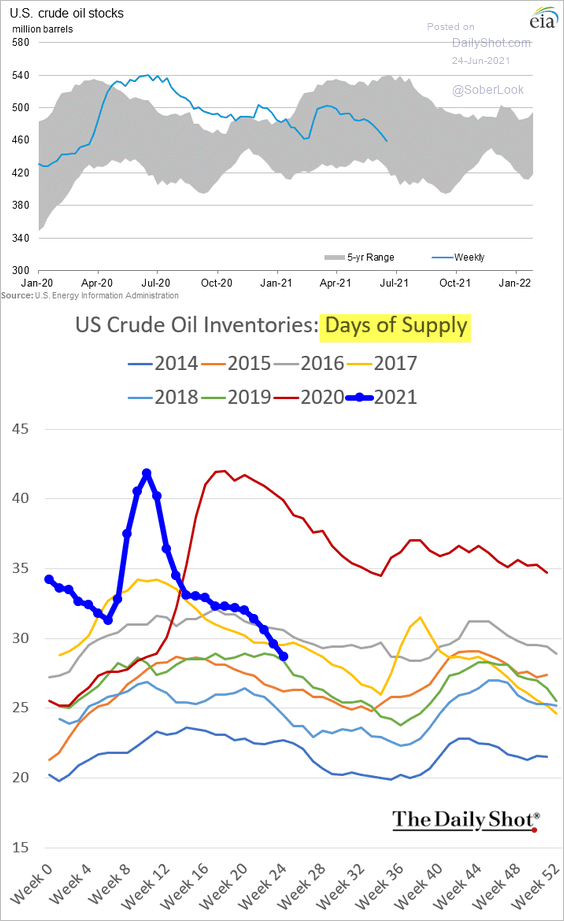
Gasoline demand remains robust (just below 2018/19 levels).
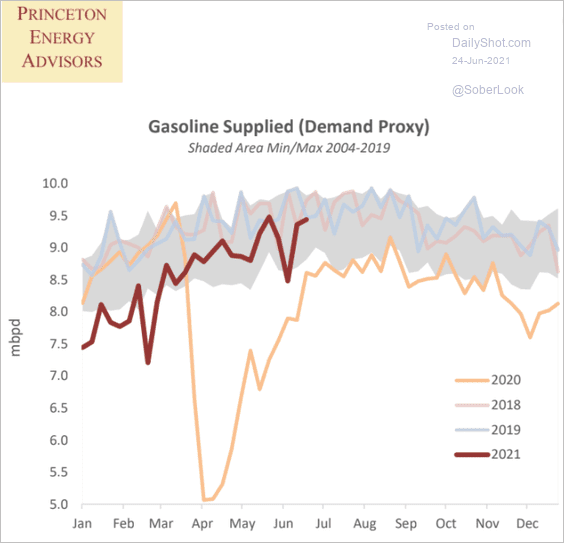 Source: Princeton Energy Advisors
——————–
2. Conventional oil and gas shares are recovering as renewable energy stocks consolidate.
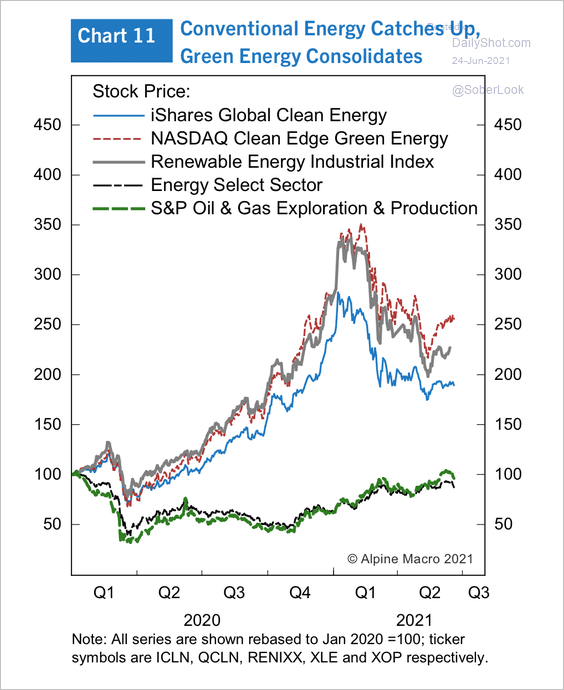 Source: Alpine Macro
Back to Index
Equities
1. This chart shows the performance of key sectors relative to the S&P 500 over the past two years. Cyclicals have benefitted from mean reversion.
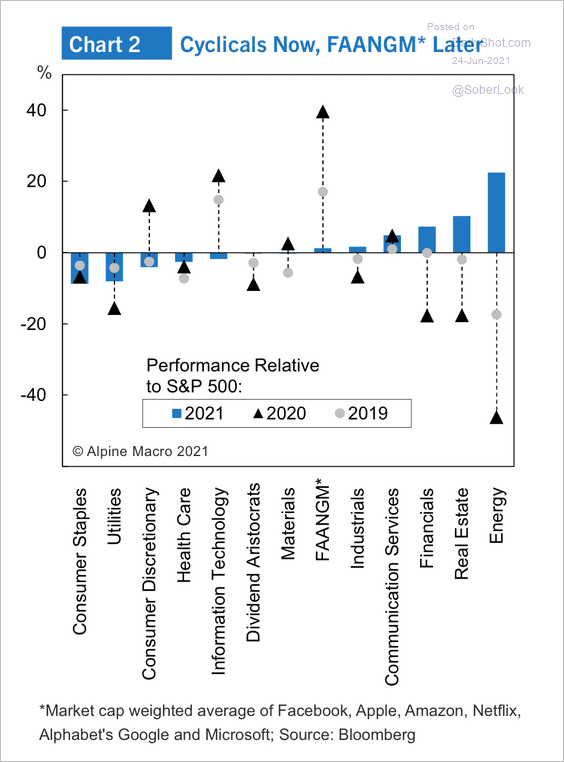 Source: Alpine Macro
2. The downward trend of the top 50 stocks in the S&P 500 relative to the overall index appears to be over.
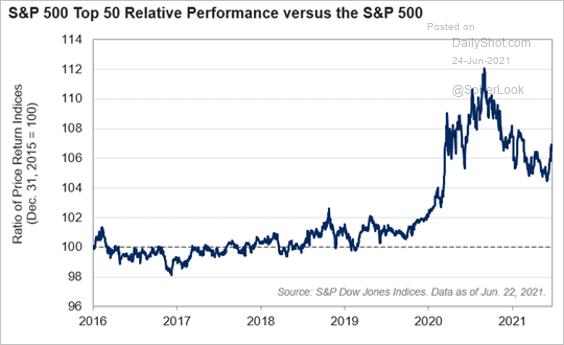 Source: S&P Global Market Intelligence
3. Here are the industries targeted by SPACs.
 Source: Hyde Capital
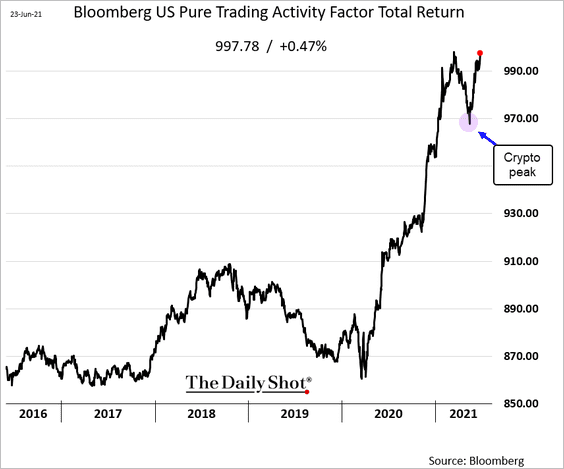
4. Bloomberg’s trading activity factor, which measures stocks’ trading turnover, is nearing record highs. The recent rebound corresponds to the crypto market peak.
5. Who owns US equities?
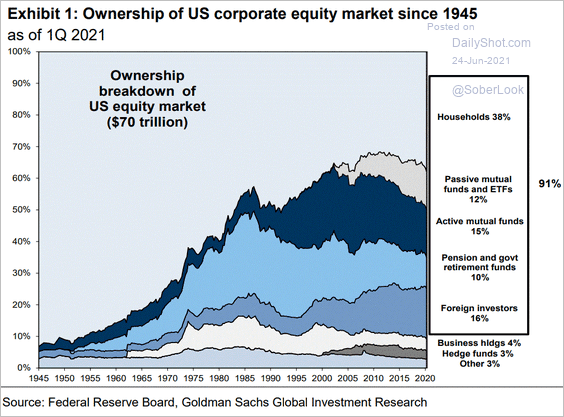 Source: Goldman Sachs; Haresh Raju
Back to Index
Rates
1. While Chair Powell’s comments remain dovish, other Fed officials are talking about rate hikes next year. That would suggest that QE tapering should start later this year to give the central bank a sufficient runway.
 Source: @markets Read full article
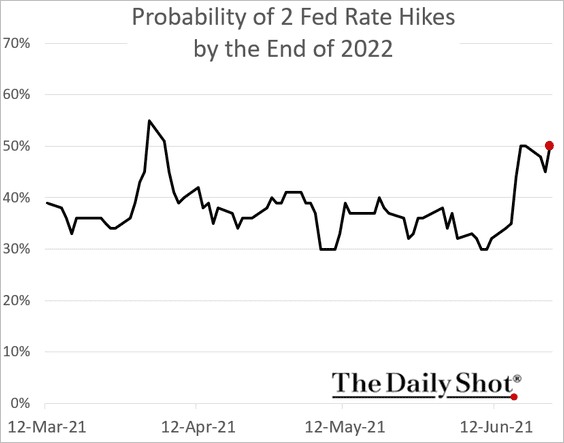
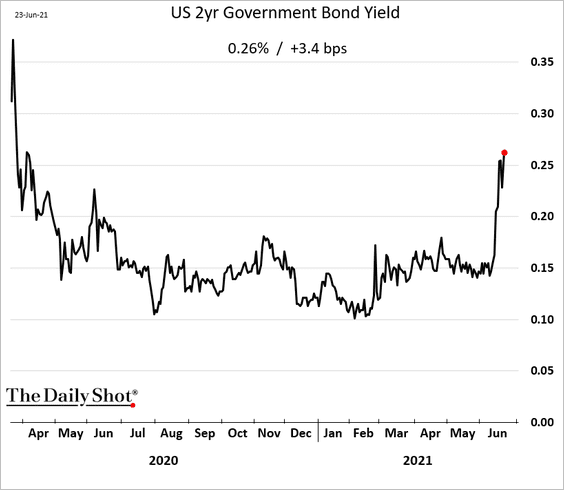
The market has now fully priced in a 2022 liftoff, with a 50% chance of two rate hikes next year.
With more hikes priced in, the 2-year Treasury yield climbed further.
——————–
2. The recent movements in the 10yr Treasury yield have been quite different than during taper-tantrum in 2013.
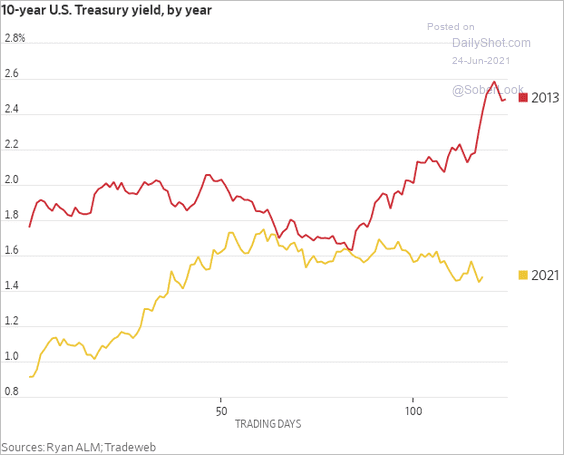 Source: @WSJ Read full article
3. Foreigners have been buying Treasuries again.
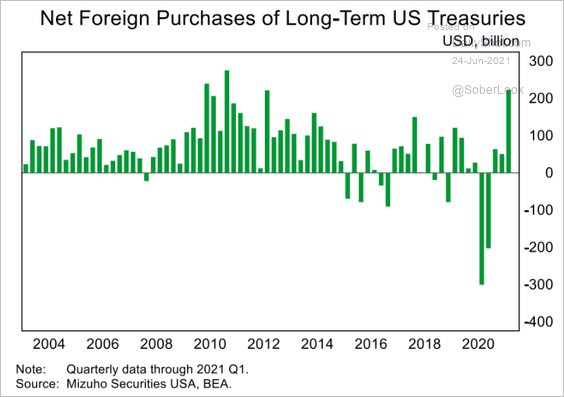 Source: Mizuho Securities USA
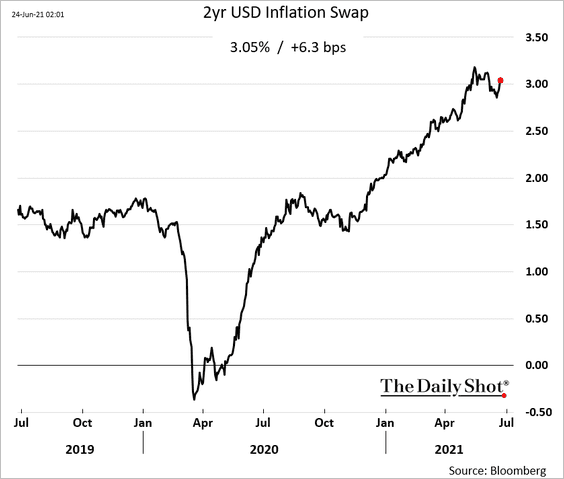
4. The 2-year inflation swap (a measure of inflation expectations) is back above 3%.
Back to Index
Global Developments
1. Here are the market-implied policy rate trajectories for select economies.
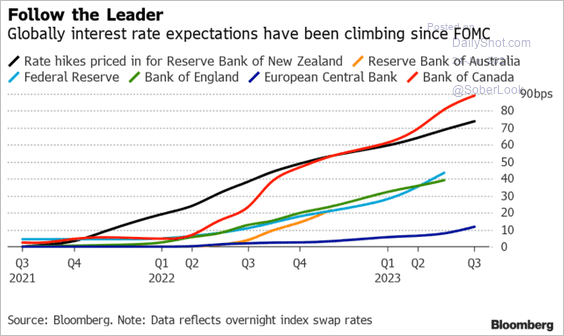 Source: @StephenSpratt Read full article
2. Transit usage is gradually improving, although still below pre-pandemic levels.
![]() Source: Market Ethos, Richardson GMP
Source: Market Ethos, Richardson GMP
3. The recovery in retail sales has been uneven across advanced economies.
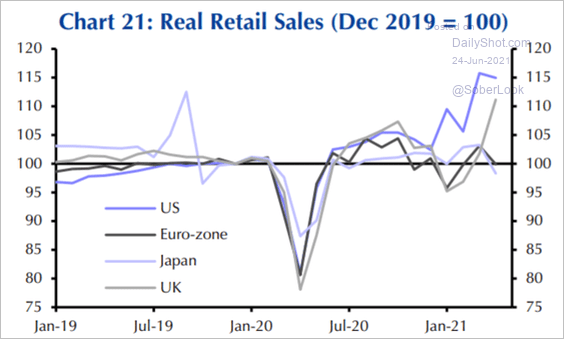 Source: Capital Economics
——————–
Food for Thought
1. Attitudes toward banking regulation:
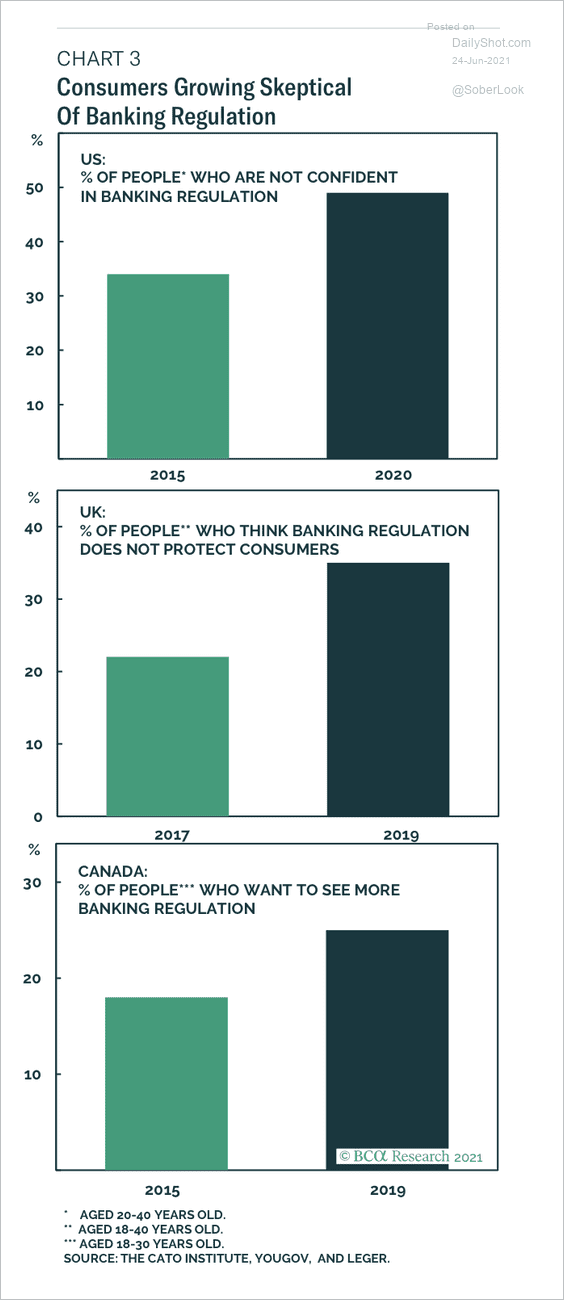 Source: BCA Research
2. Homeownership by generation:
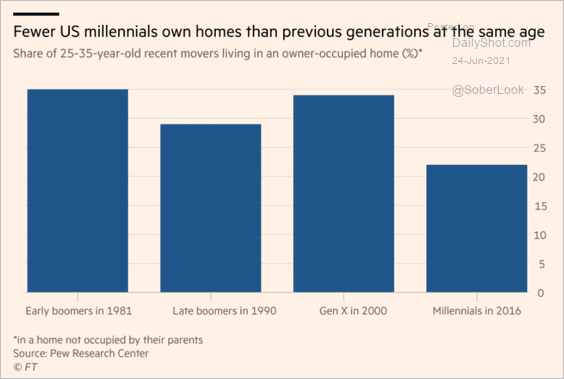 Source: @financialtimes Read full article
3. US changes in life expectancy and education levels:
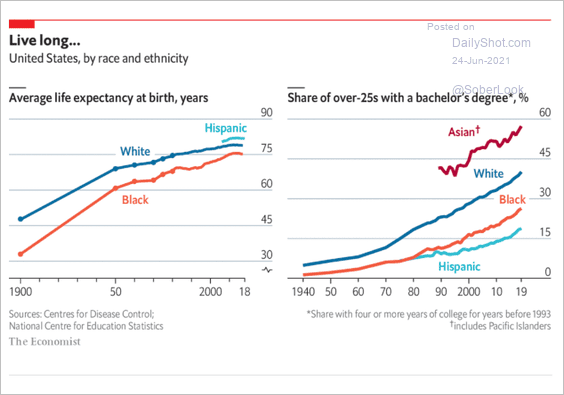 Source: The Economist Read full article
4. Life expectancy of women vs. men:
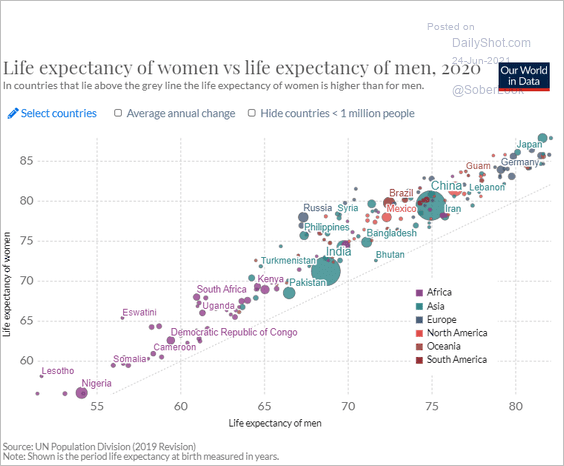 Source: Our World In Data Read full article
5. Population aged 65 and older by country:
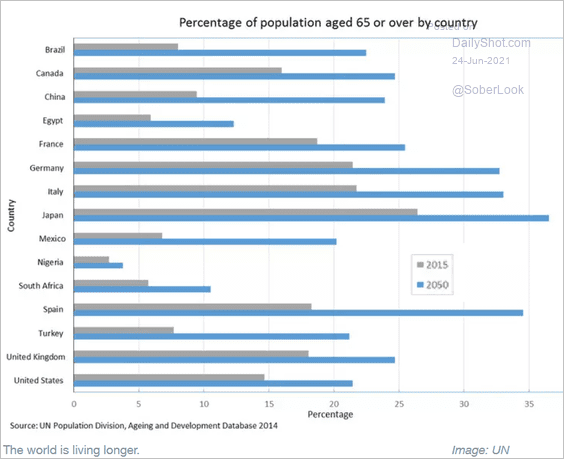 Source: WEF Read full article
6. COVID deaths by age:
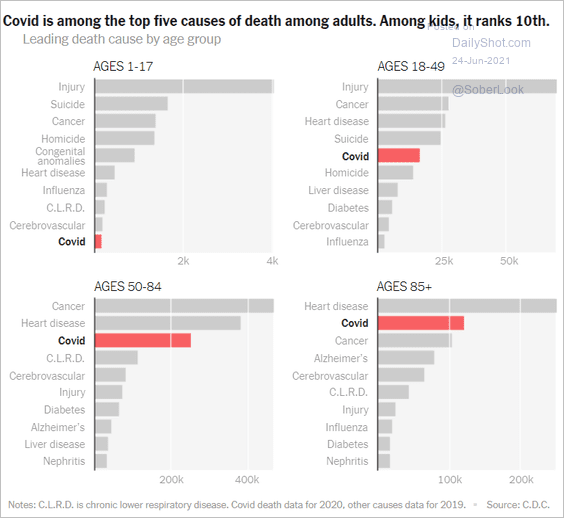 Source: The New York Times Read full article
7. Share of traffic collisions in California involving …
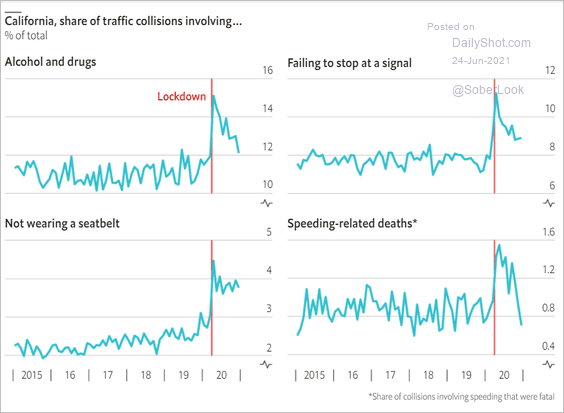 Source: The Economist Read full article
8. Sperm concentration over time:
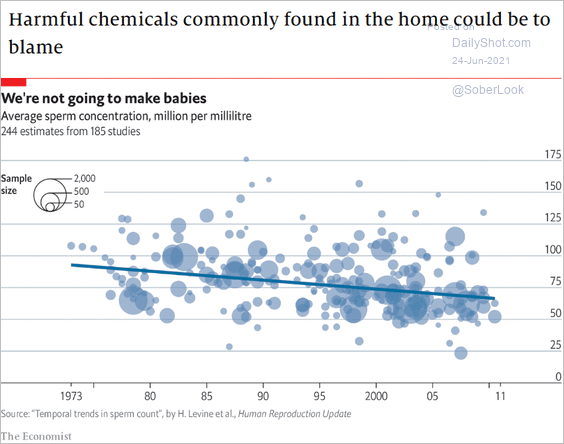 Source: The Economist Read full article
9. Teen depression rates:
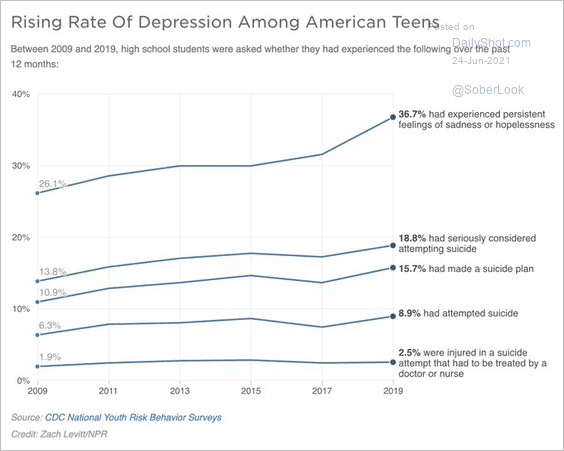 Source: @jessefelder, NPR Read full article
10. The number of beehives by region:
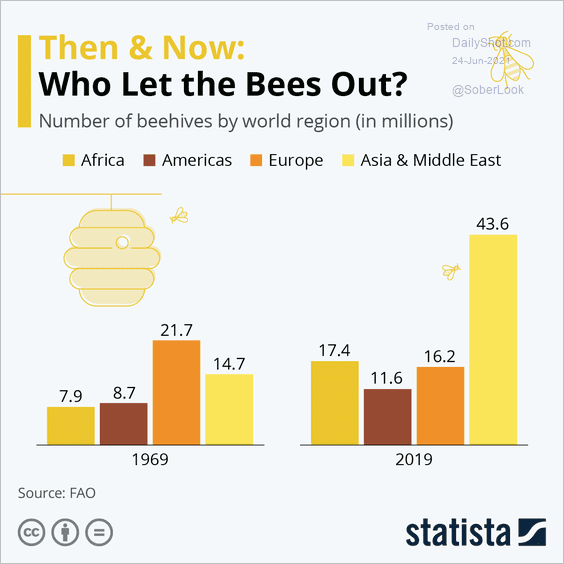 Source: Statista
——————–
Back to Index