
The Daily Shot: 25-Jun-21
• Administrative Update
• The United States
• The United Kingdom
• The Eurozone
• Europe
• Asia – Pacific
• China
• Emerging Markets
• Cryptocurrency
• Commodities
• Energy
• Equities
• Credit
• Rates
• Global Developments
• Food for Thought
Administrative Update
Please note that The Daily Shot will not be published on Friday, July 2nd.
Back to Index
The United States
1. Growth in durable goods orders eased in May, but the dollar amount was at record highs (2nd chart).
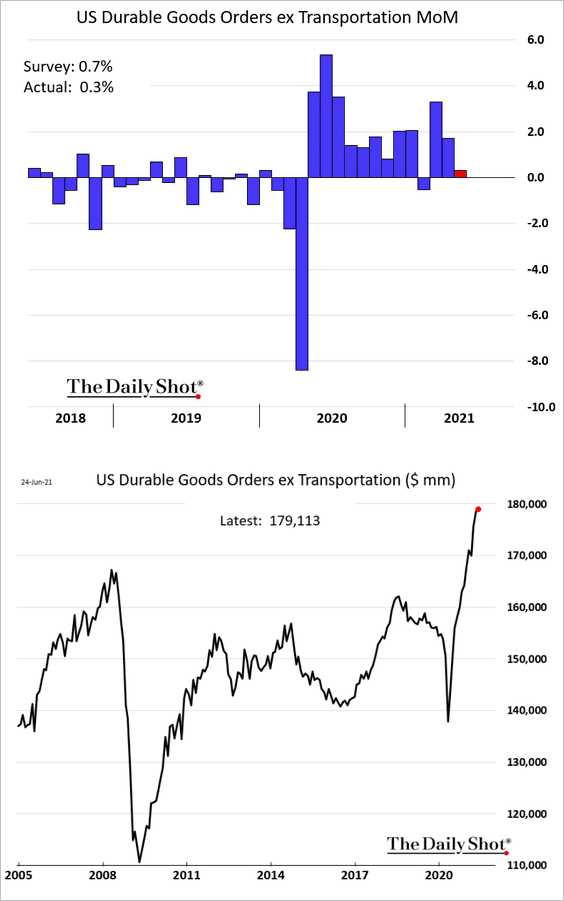
Below are some additional data from the report.
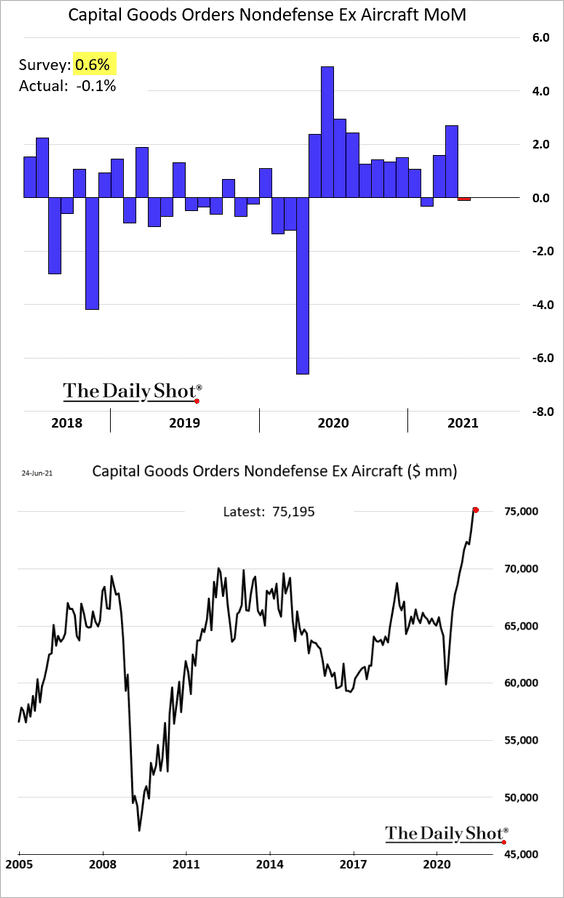
• Capital goods orders (a proxy for CapEx):
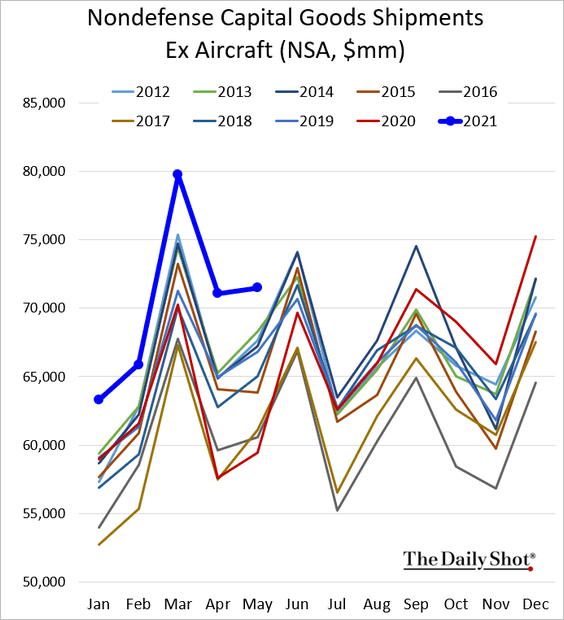
• Capital goods shipments without seasonal adjustments:
• Trends with and without transportation products (separate y-axes):
![]() Source: @macro_daily
Source: @macro_daily
• Changes in durable goods orders by sector:
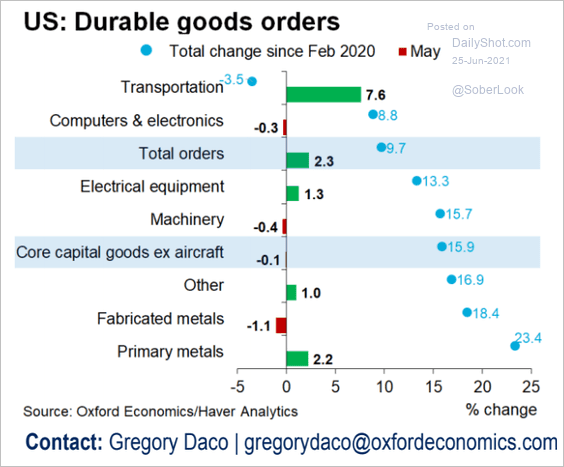 Source: Oxford Economics
• Comparison to the post-2008 recovery:
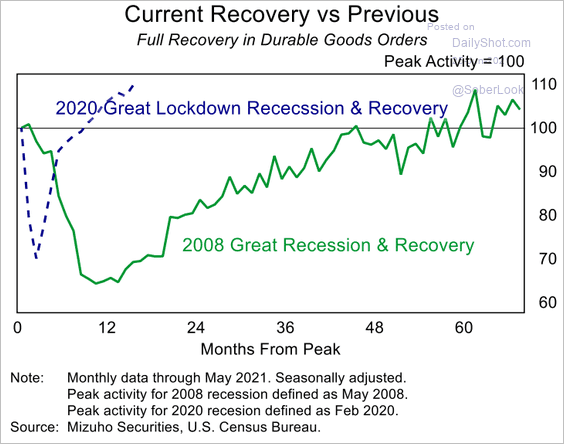 Source: Mizuho Securities USA
——————–
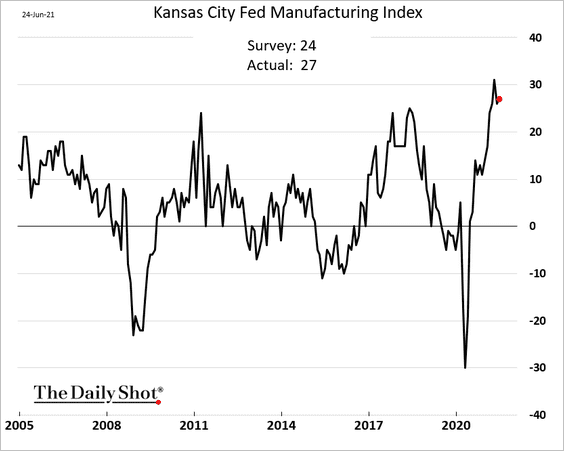
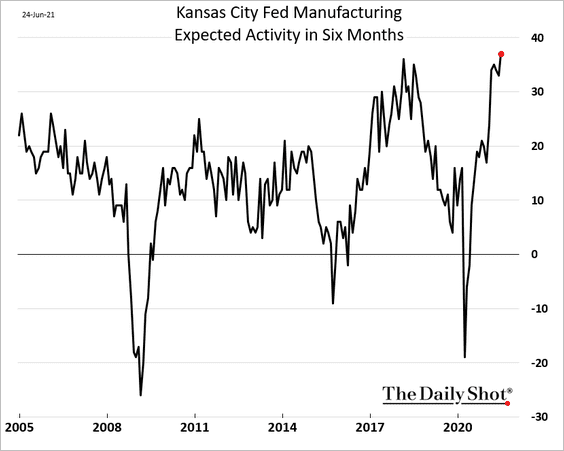
2. The June regional manufacturing report from the Kansas City Fed was firmer than expected.
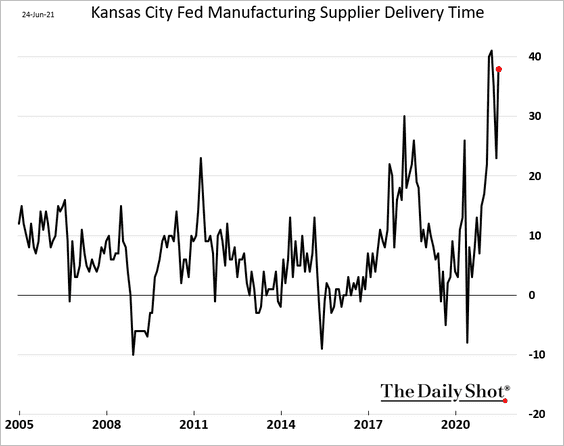
• Supply-chain bottlenecks are still at extreme levels, with the situation worsening this month.
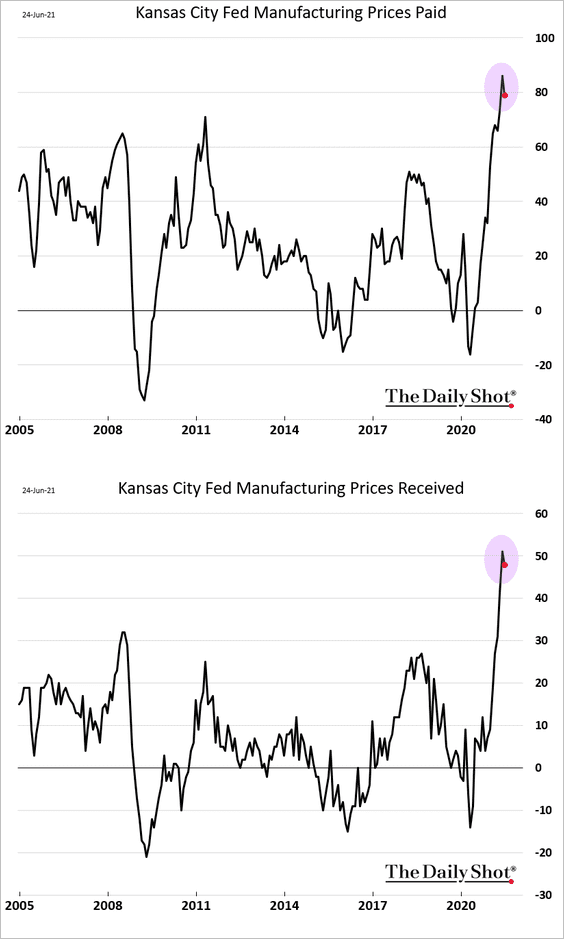
• The share of companies reporting rising prices remains near extremes but appears to have peaked.
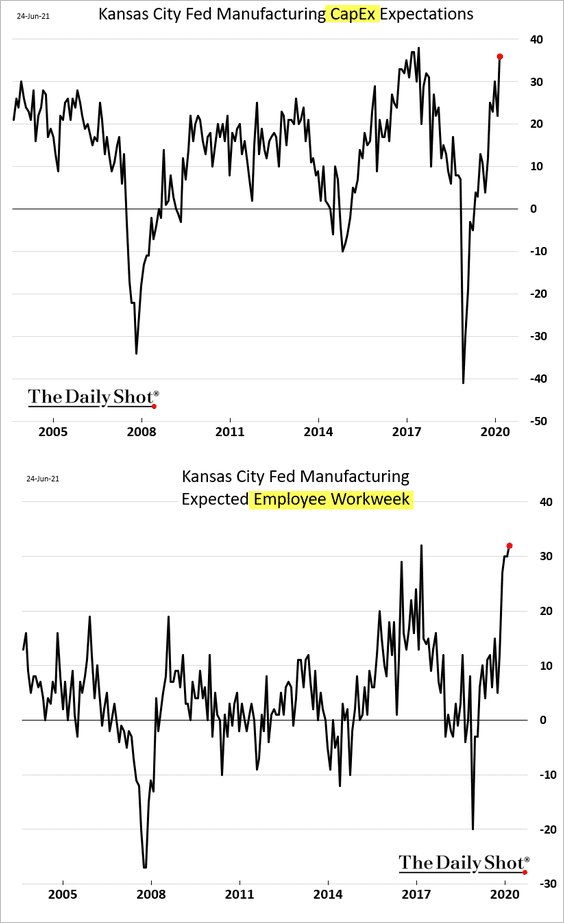
• Factories in the Kansas City Fed’s district are very upbeat about the future (3 charts).
——————–
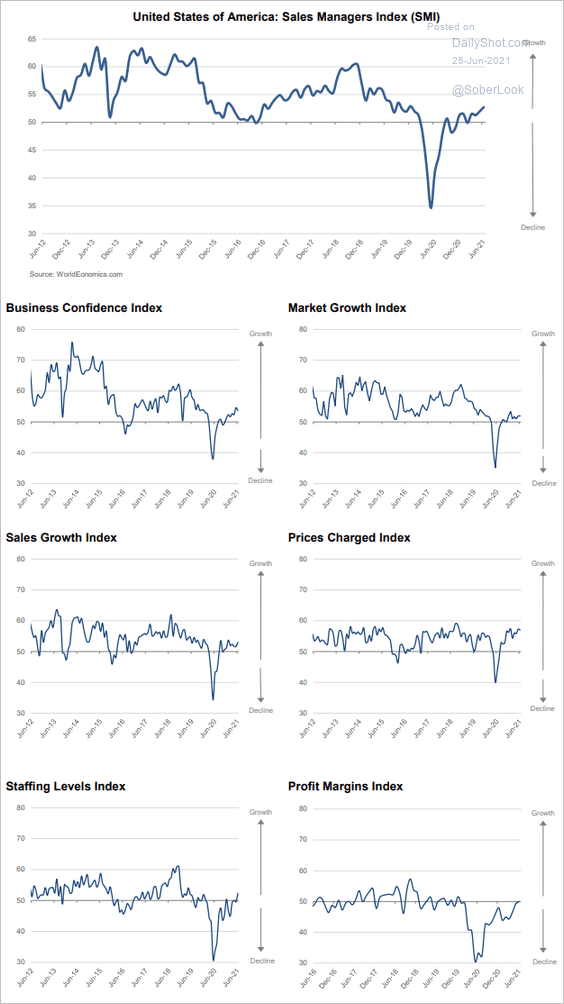
3. The World Economics SMI index shows accelerating business growth in the US.
 Source: World Economics
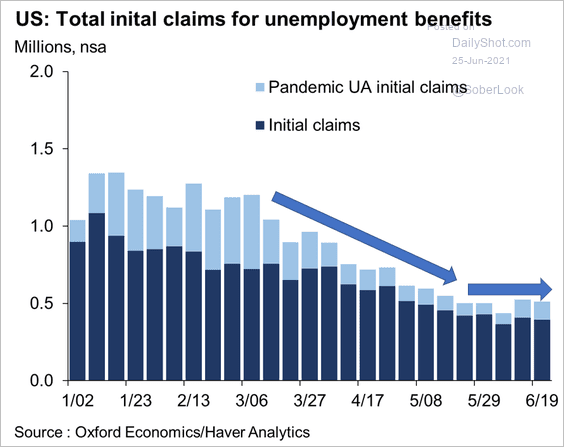
4. Initial jobless claims have leveled off (note that many of these applications are denied).
 Source: @GregDaco
But continuing claims keep trending lower.
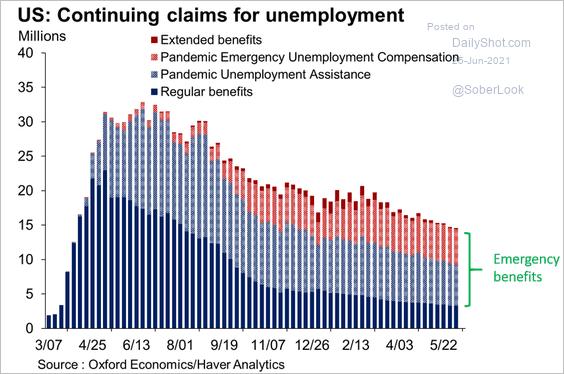 Source: @GregDaco
——————–
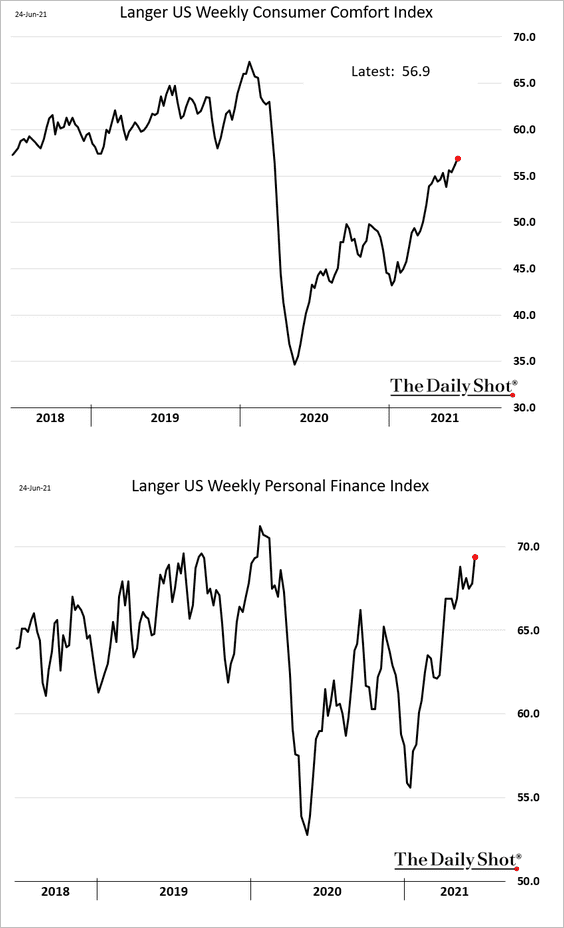
5. Consumer confidence continues to improve. Americans are now almost as comfortable with personal fiances as they were before the pandemic.
Back to Index
The United Kingdom
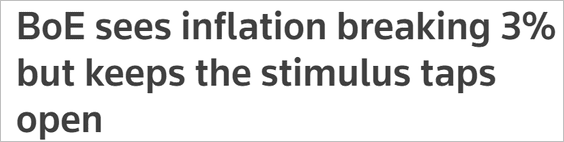
1. The BoE struck a somewhat dovish tone this week.
 Source: @markets Read full article
 Source: Reuters Read full article
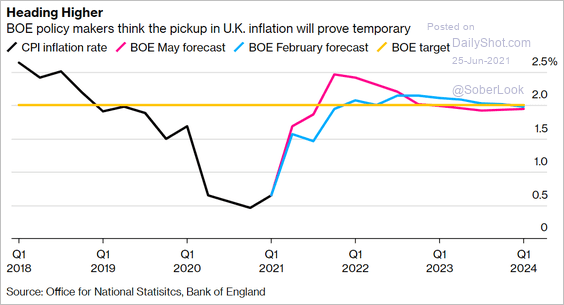
The central bank’s inflation forecast assumes a “transient” bump.
 Source: @markets Read full article
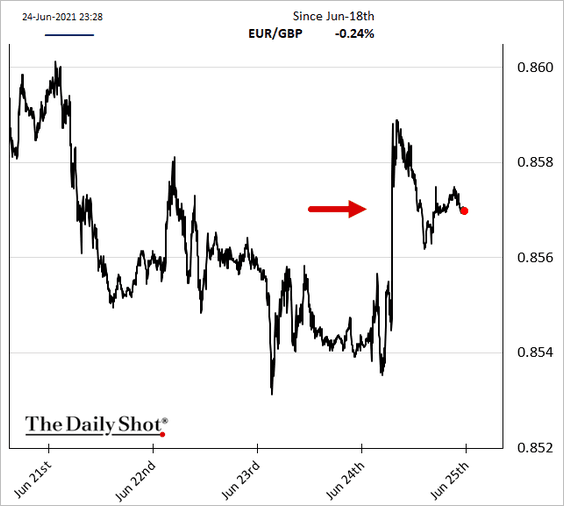
2. The pound weakened (chart shows EUR strengthening against GBP).
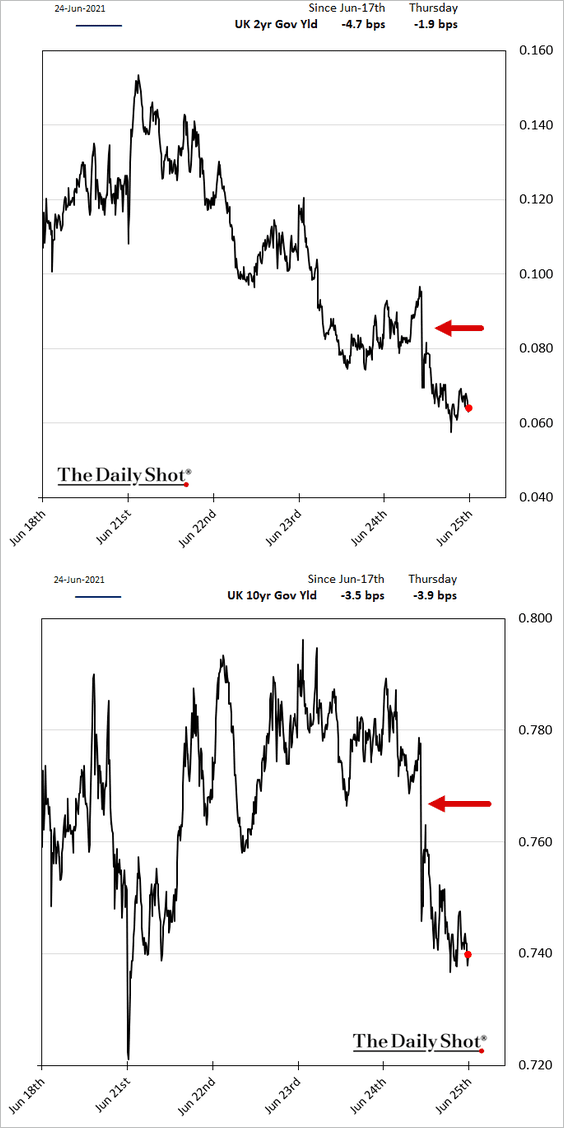
Gilt yields dropped.
——————–
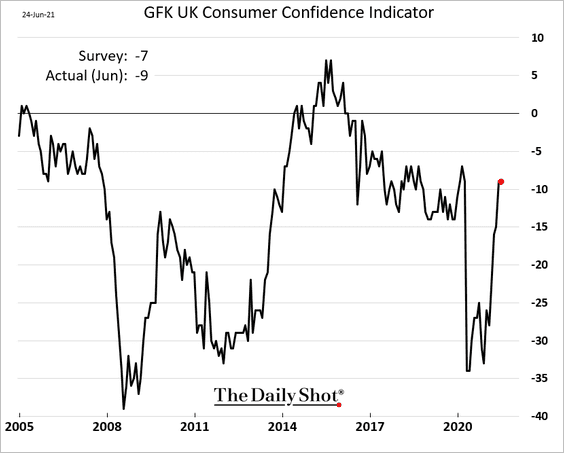
3. Gains in consumer confidence paused in June.
Back to Index
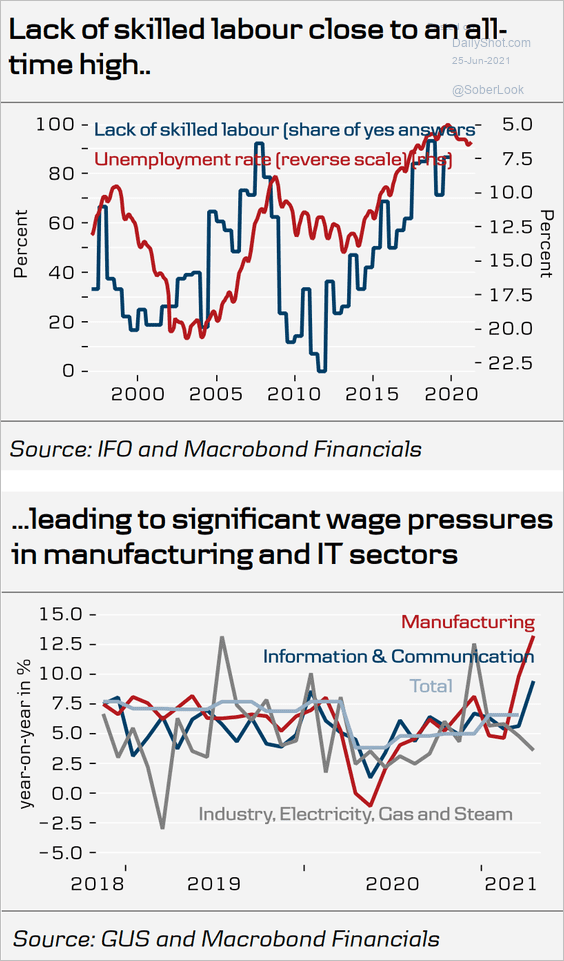
The Eurozone
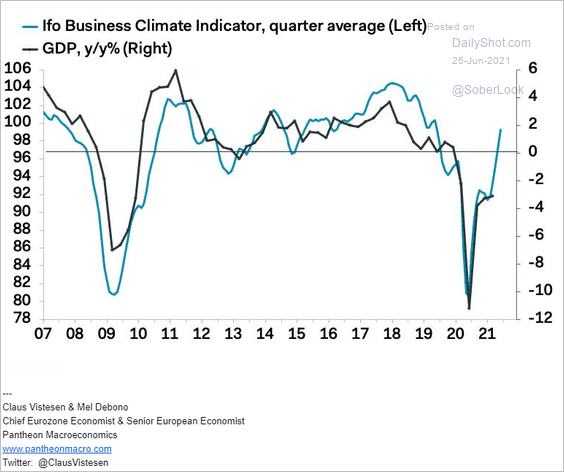
1. Germany’s Ifo business expectations index hit the highest level in over a decade.
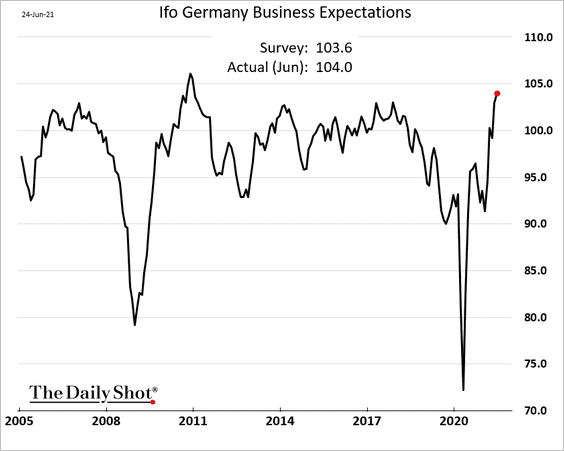
• We are looking at a sharp increase in Germany’s Q2 GDP.
 Source: Pantheon Macroeconomics
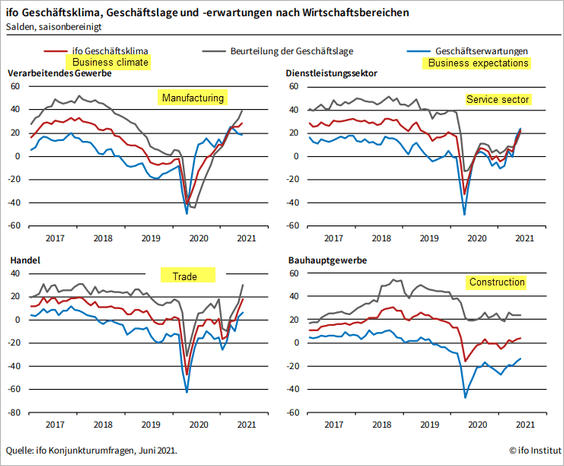
• Here is the Ifo index by sector (with English translations).
 Source: ifo Institute
——————–
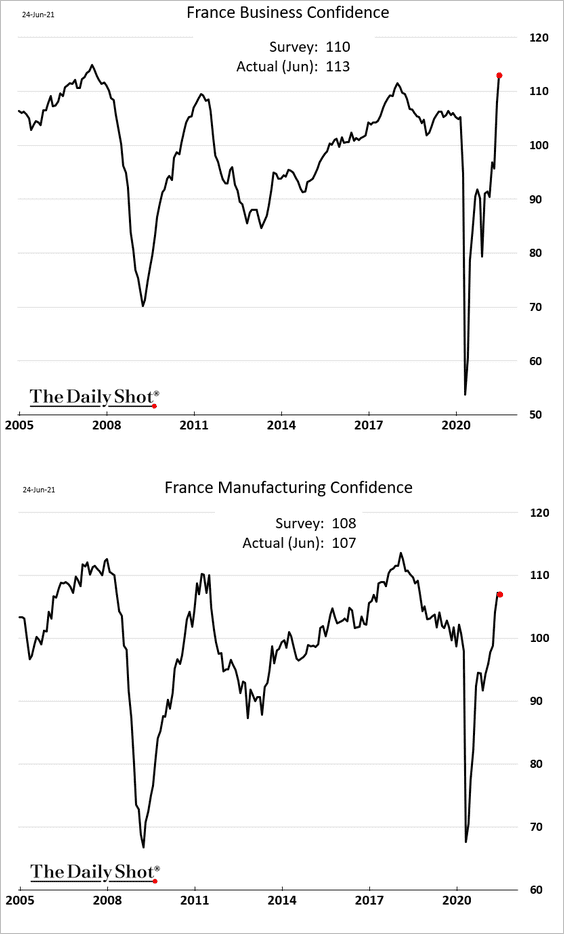
2. French business confidence hit the highest level since 2007.
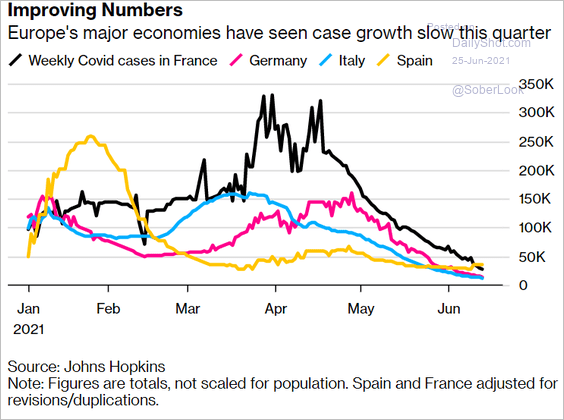
3. COVID cases have been trending lower, but the new (Delta) variant is a risk.
 Source: @bpolitics Read full article
Back to Index
Europe
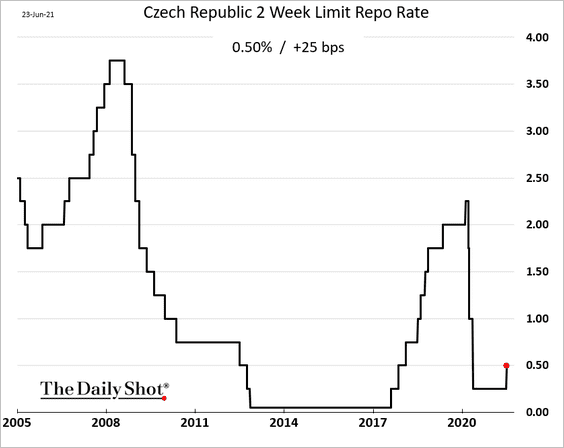
1. The Czech central bank hiked rates this week.
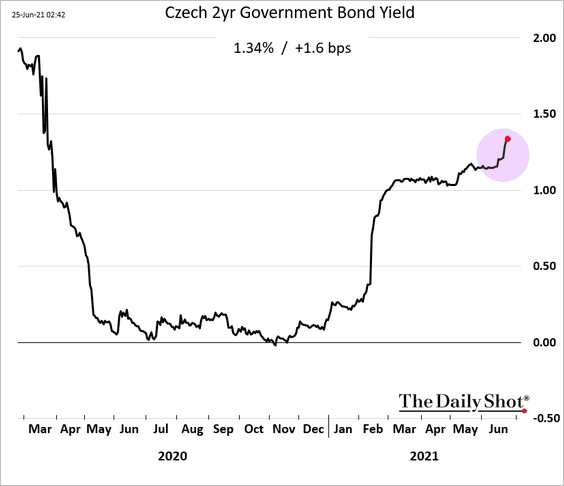
Bond yields climbed, pointing to further tightening ahead.
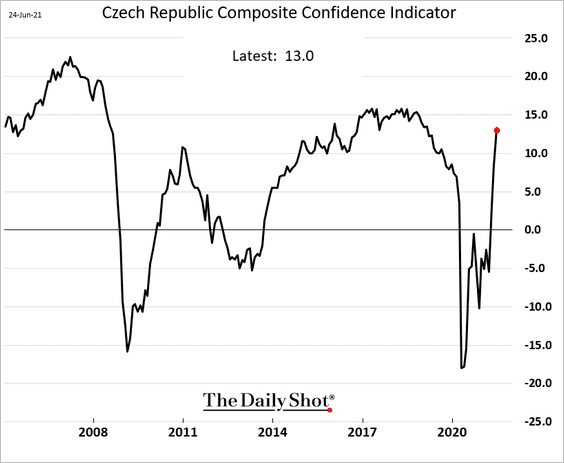
Separately, Czech sentiment indicators have been surging (chart shows combined consumer and business confidence).
——————–
2. Poland’s unemployment rate has peaked, …
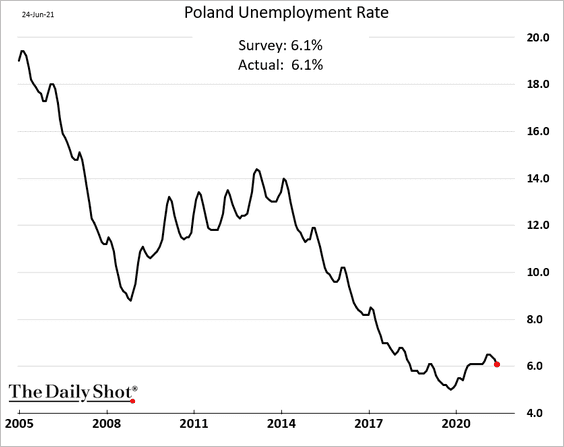
… as the labor market tightens.
 Source: Danske Bank
——————–
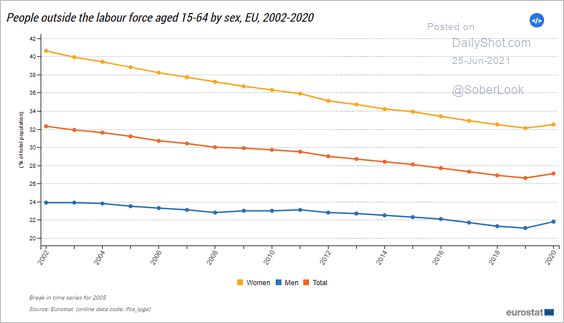
3. This chart shows EU citizens aged 15-64 who are not in the labor force.
 Source: Eurostat Read full article
Back to Index
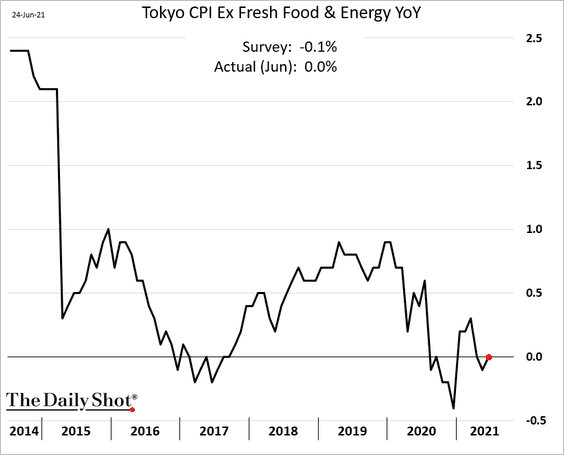
Asia – Pacific
1. The June Tokyo core CPI is back at 0%.
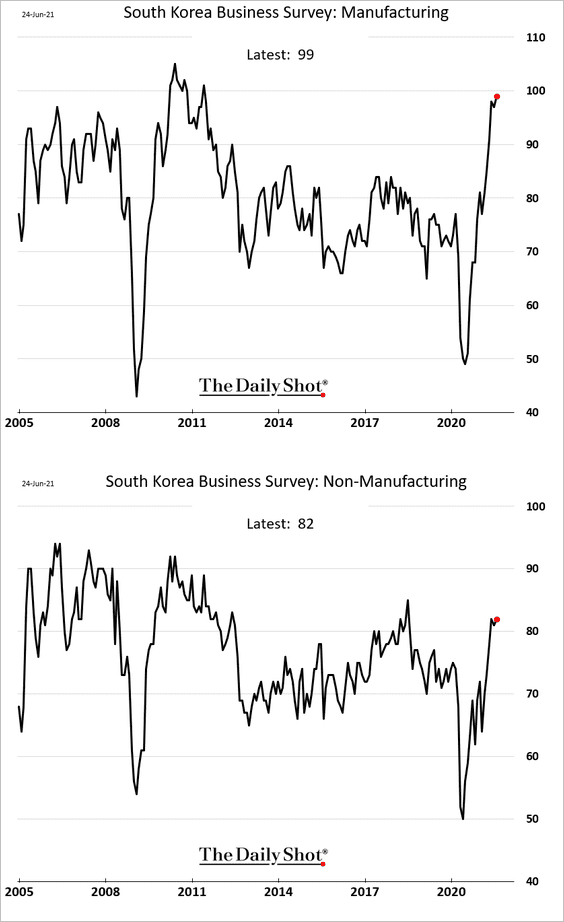
2. South Korea’s business surveys remain strong.
3. Australian households’ interest payments are the lowest in decades (as % of disposable income).
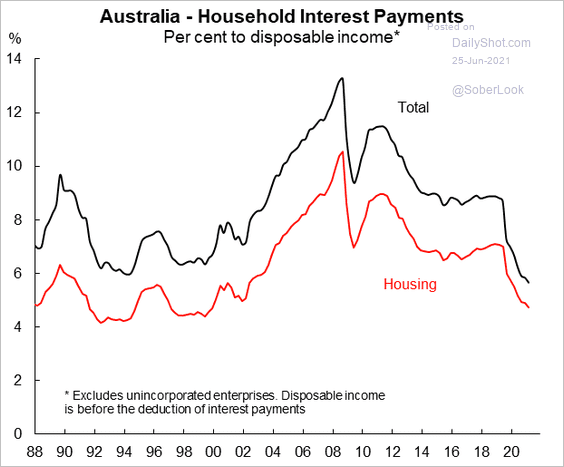 Source: @justinfabo
Australian underemployment is lower than it was before the pandemic.
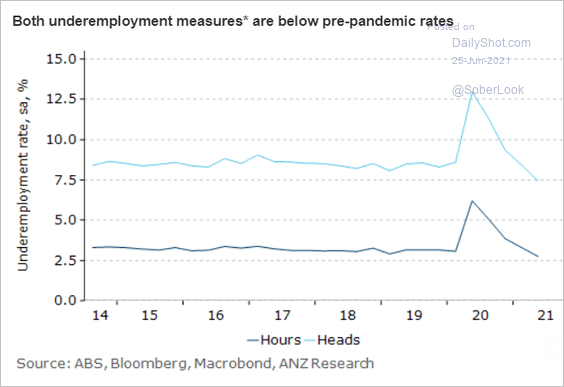 Source: ANZ Research
——————–
3. Higher rates are necessary to slow New Zealand’s property market bubble.
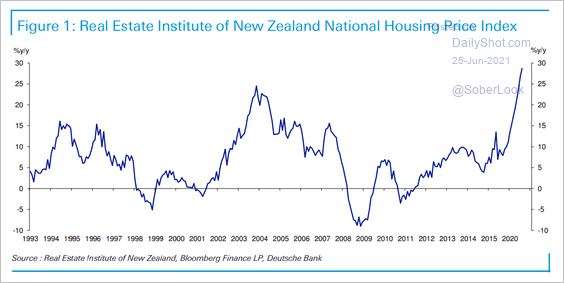 Source: Deutsche Bank Research
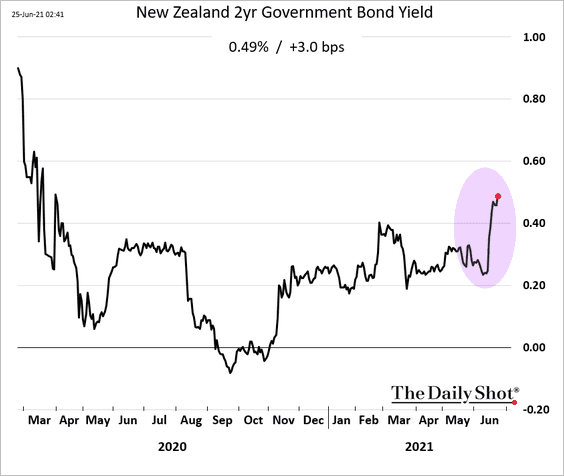
The market is pricing in more rate hikes ahead.
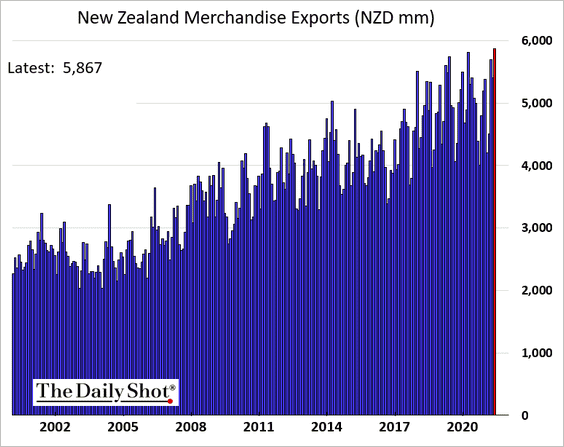
Separately, New Zealand’s exports hit a record high.
Back to Index
China
1. Tier-2 cities’ property price gains are accelerating.
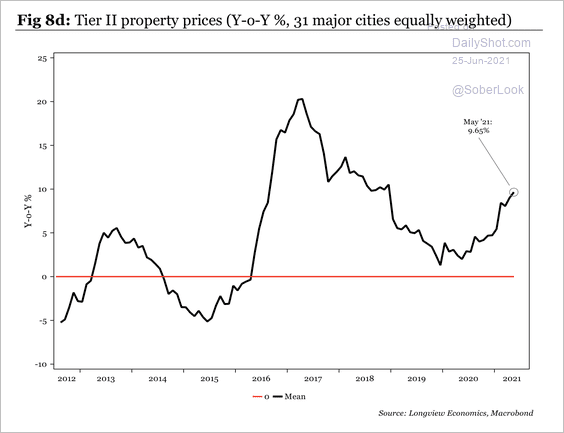 Source: Longview Economics
2. US semiconductor exports to China have been climbing.
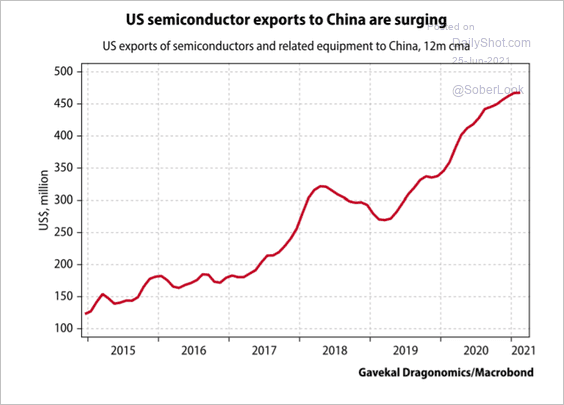 Source: Gavekal Research
3. This chart compares unicorn formation in China and the US (note inverted x-axis).
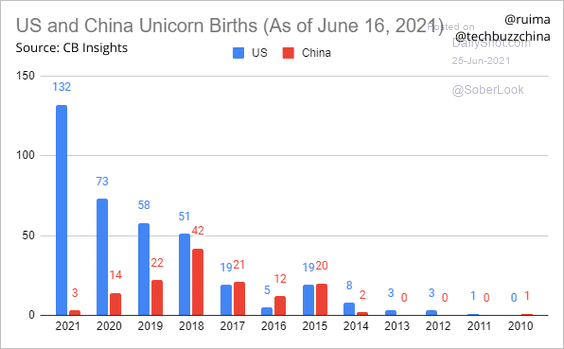 Source: @TechBuzzChina, @CBinsights
4. Tourists/gamblers are not rushing back to Macau.
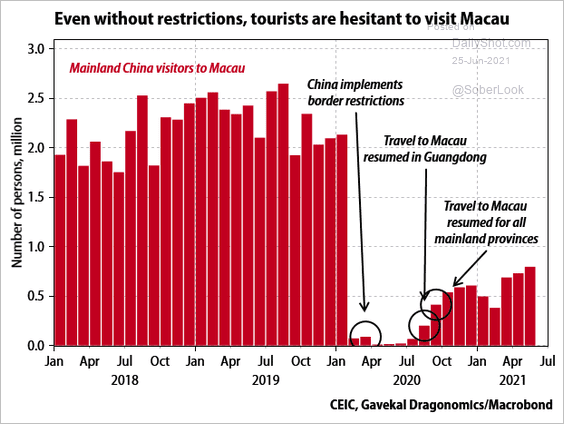 Source: Gavekal Research
Back to Index
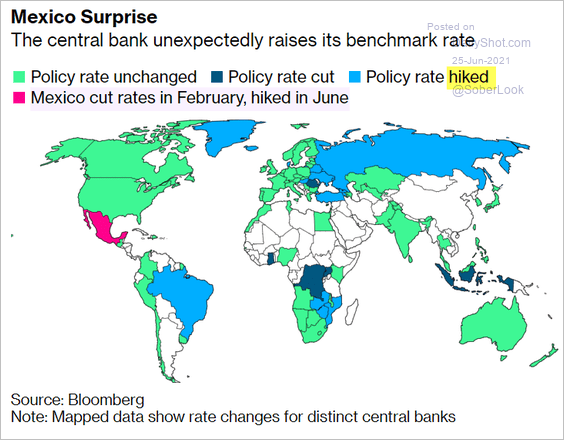
Emerging Markets
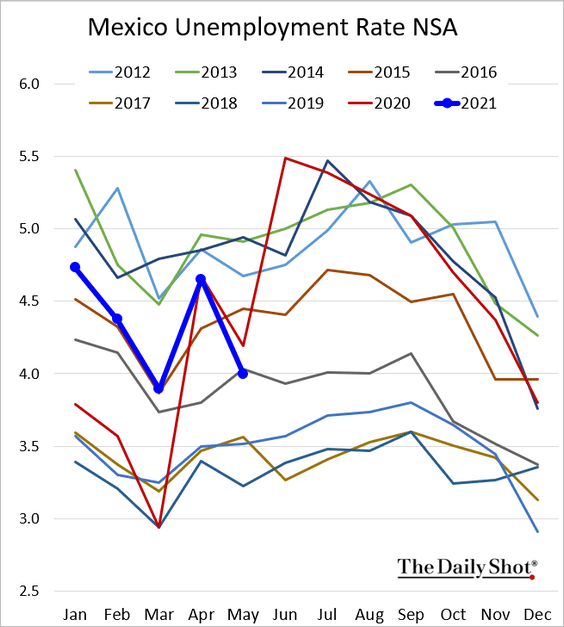
1. The market wasn’t expecting a Banxico rate hike.
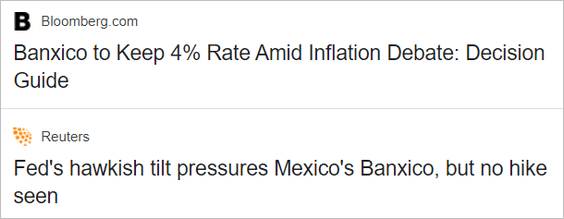
But it got one.
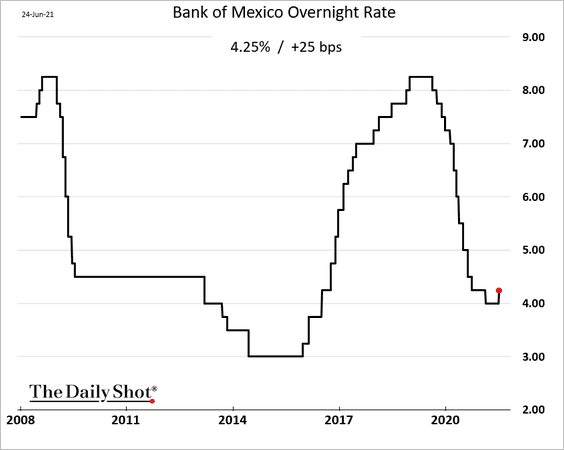
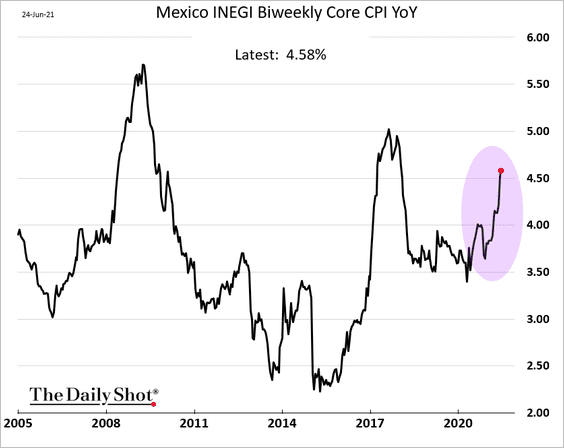
The central bank is becoming uneasy with rising inflation (although the board was divided on the hike).
The unemployment rate is now below last year’s level (but still elevated).
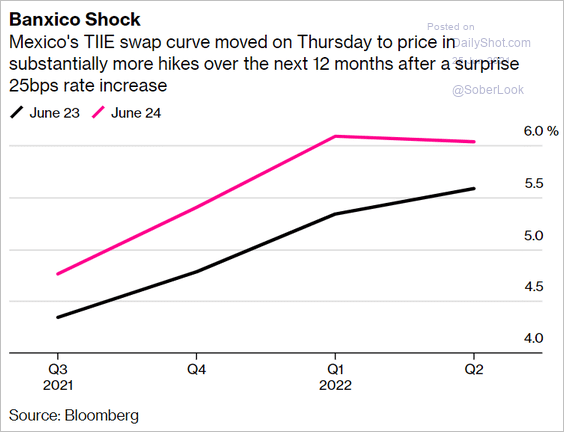
Bond yields jumped. The market expects more hikes ahead.
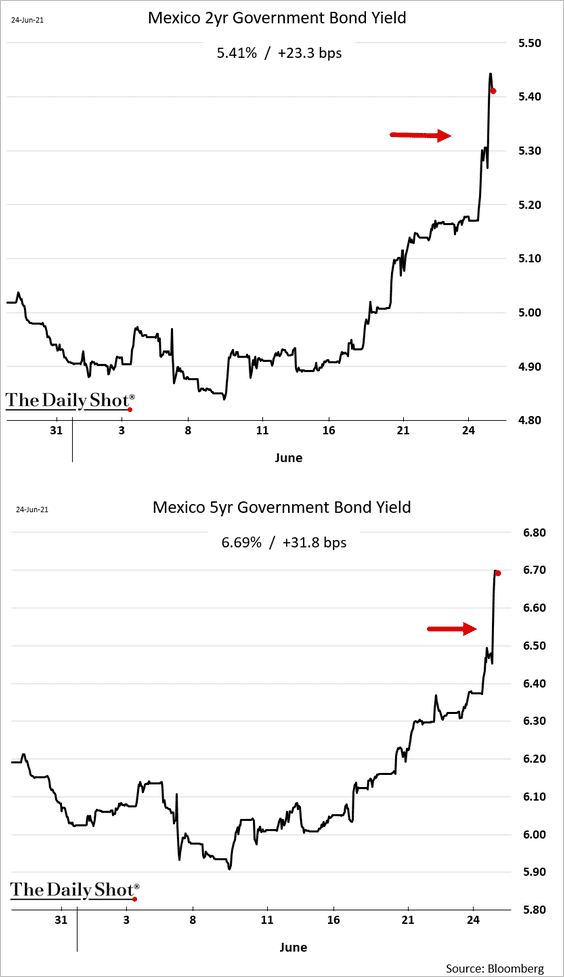
 Source: @markets Read full article
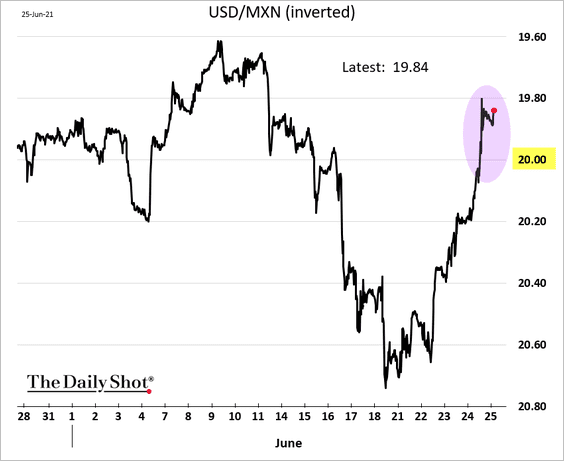
The peso rose against the dollar.
Here is the global monetary policy landscape from Bloomberg.
 Source: @markets Read full article
——————–
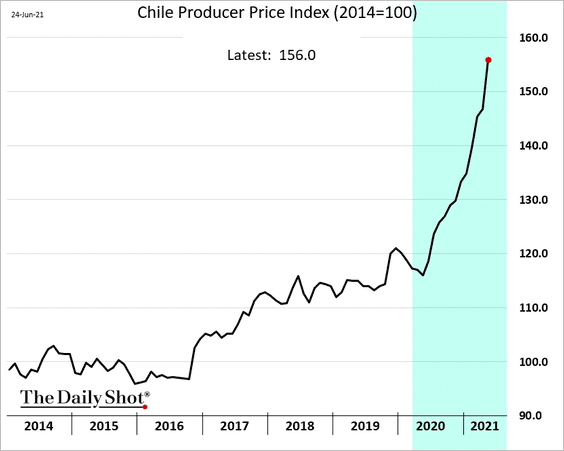
2. Chile’s producer prices are surging.
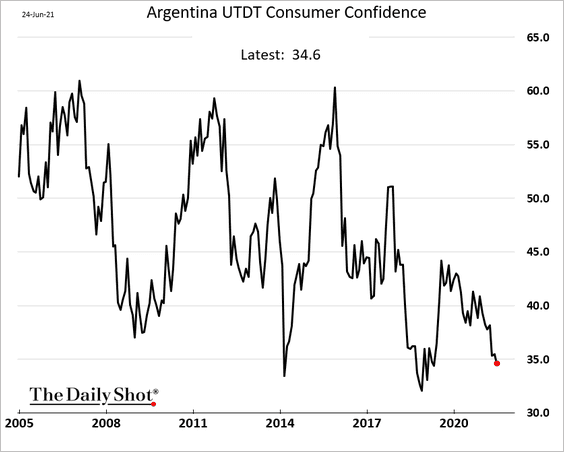
3. Argentina’s consumer confidence continues to deteriorate.
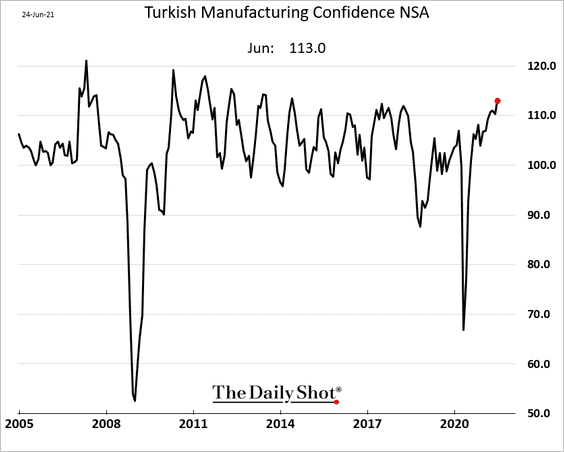
4. Turkey’s manufacturing confidence keeps climbing.
5. A rise in EM USD-denominated corporate and sovereign bond yields typically coincides with lower EM share prices.
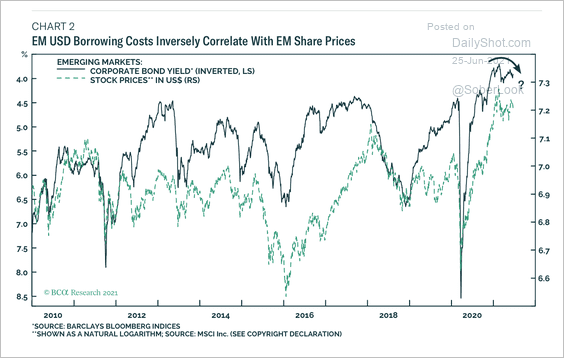 Source: BCA Research
Back to Index
Cryptocurrency
1. In recent weeks, Ethereum has been losing ground to Bitcoin in terms of market cap.
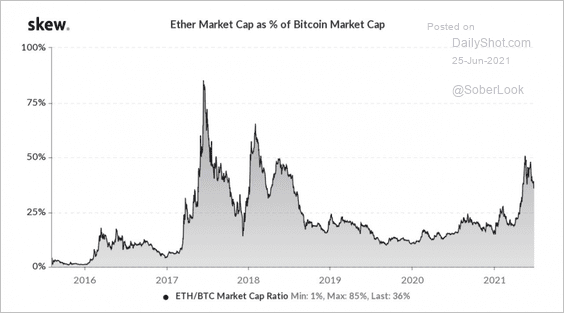 Source: Skew
2. ETH/BTC has declined from resistance over the past month.
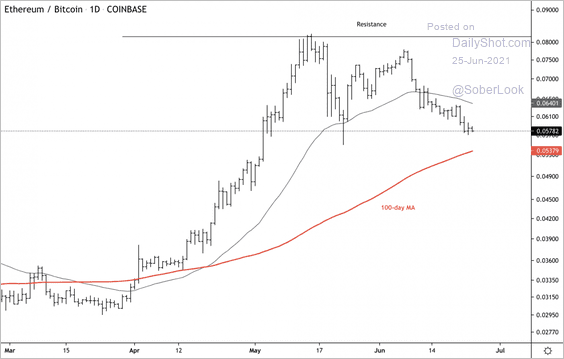 Source: Dantes Outlook
3. In terms of proceeds, the global security token market is expected to reach $3 billion by 2025.
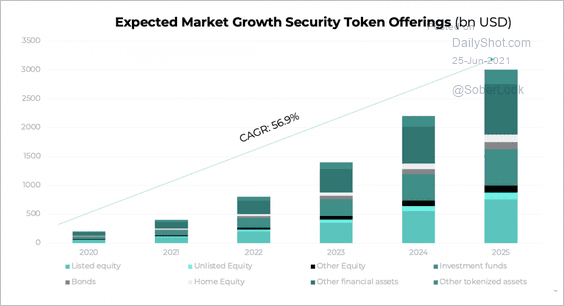 Source: Area2Invest Read full article
Back to Index
Commodities
The backwardation in lumber is nearly gone.
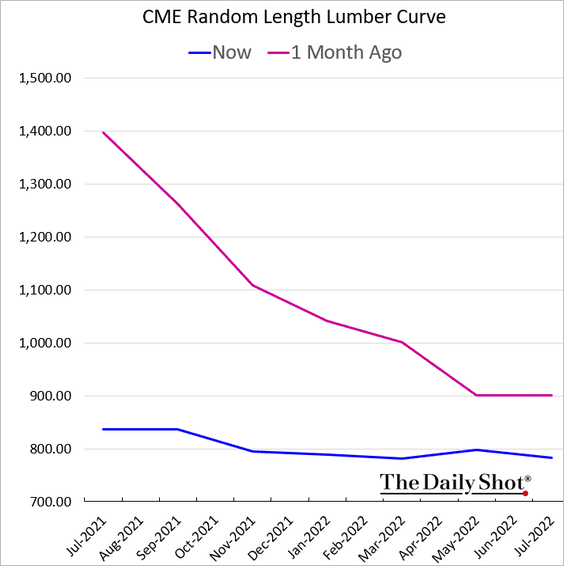 h/t @Marcy_Nicholson
Despite the correction in lumber futures, oriented strand board prices keep surging (a headache for builders).
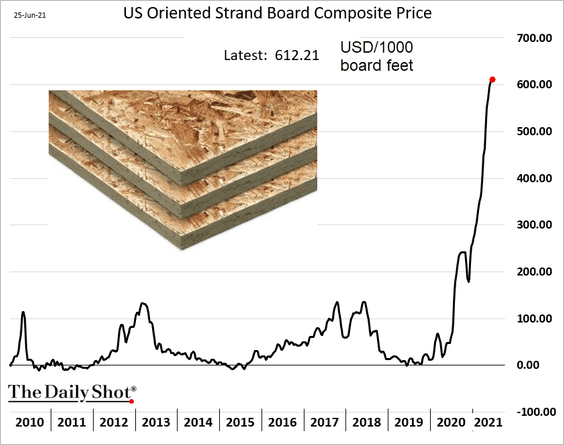 h/t @Marcy_Nicholson
Back to Index
Energy
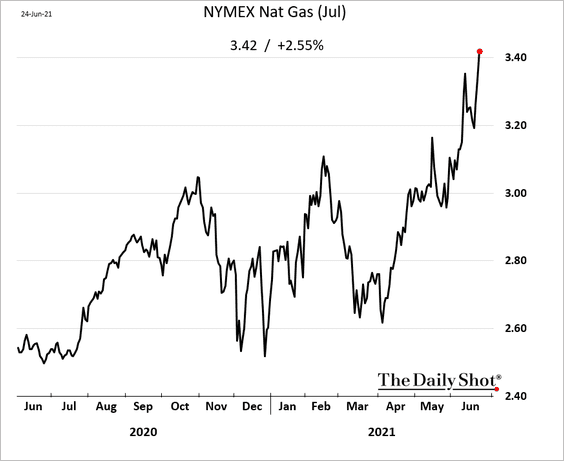
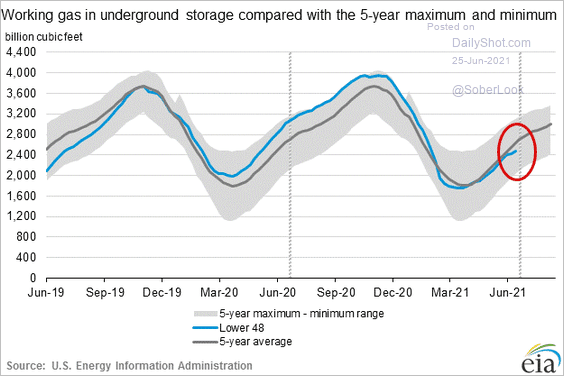
1. US natural gas prices are surging, boosted by forecasts for sweltering weather in the Pacific Northwest, lower-than-average inventories (2nd chart), and rising LNG prices.
——————–
2. The US crude oil curve is moving deeper into backwardation.
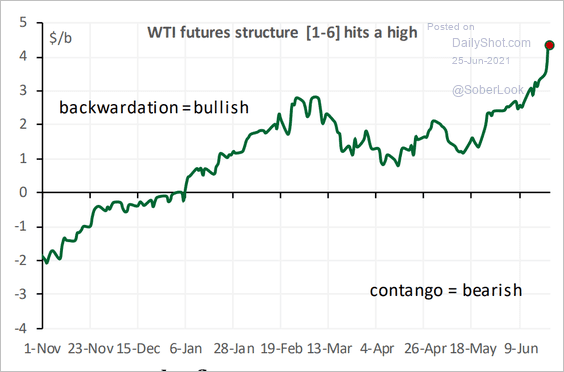 Source: Cornerstone Macro
3. OECD oil inventories are below OPEC’s target level.
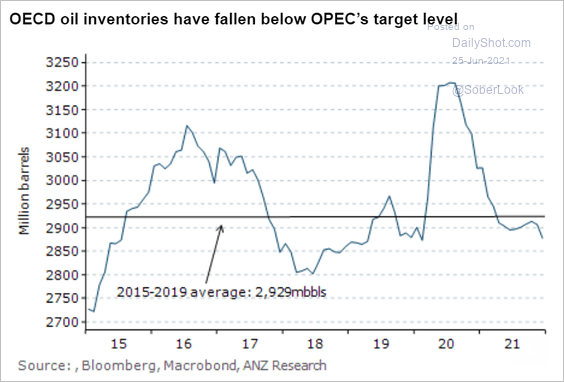 Source: ANZ Research
Back to Index
Equities
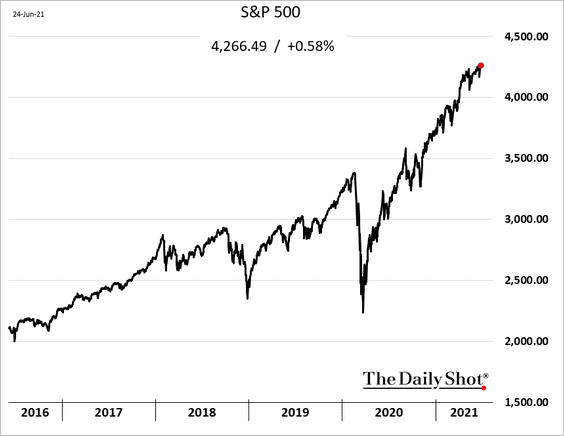
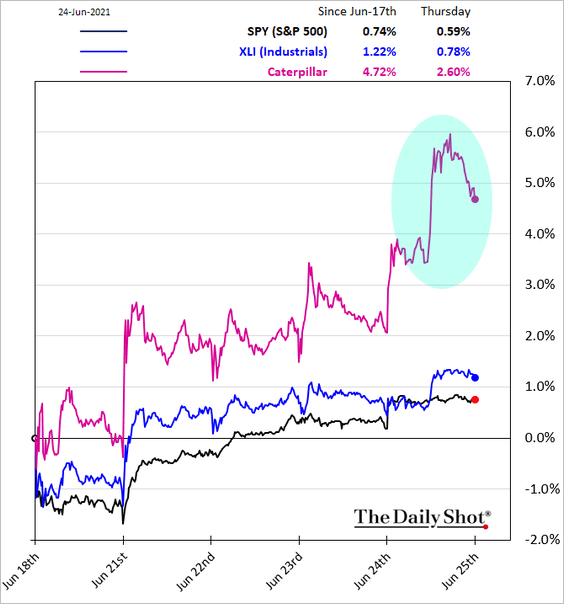
1. News of a potential infrastructure compromise sent stocks higher, with indices hitting new records.
 Source: Fox Business Read full article
Caterpillar jumped 2.6%.
2. The market also got a boost from the banking system’s successful stress tests.
 Source: CNBC Read full article
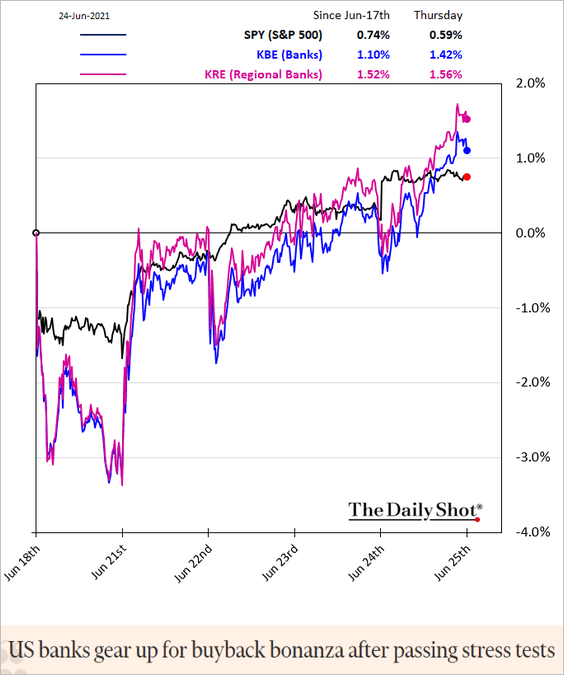 Source: @financialtimes Read full article
——————–
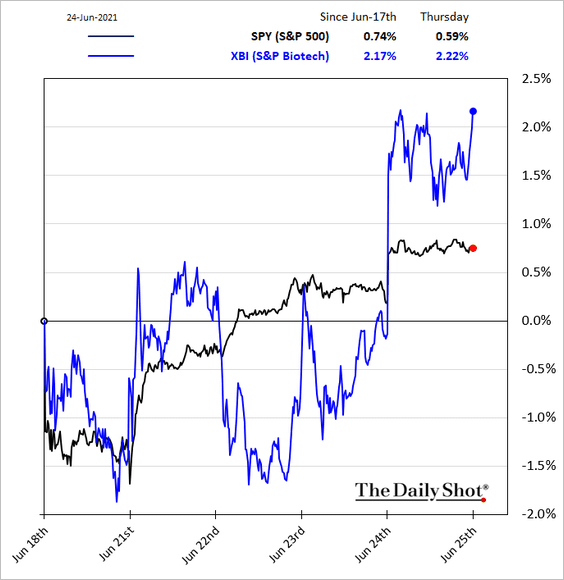
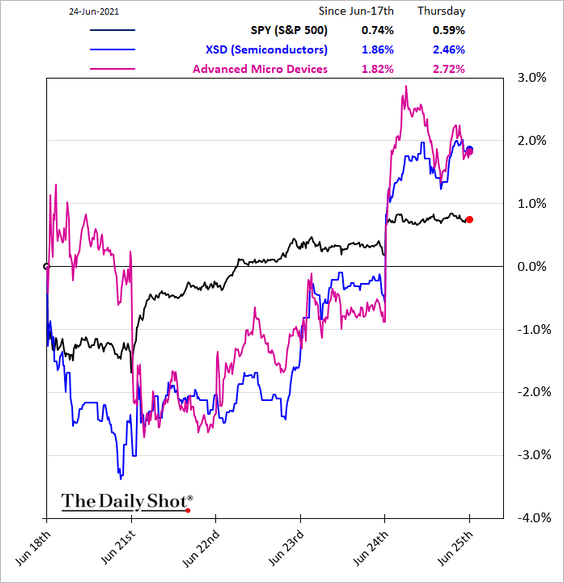
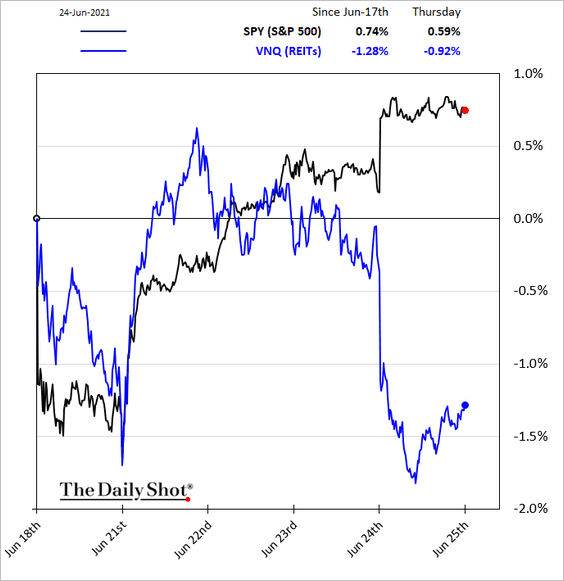
2. Here are some additional sector trends.
• Biotech:
• Semiconductors:
• REITs:
• This chart shows year-to-date sector returns.
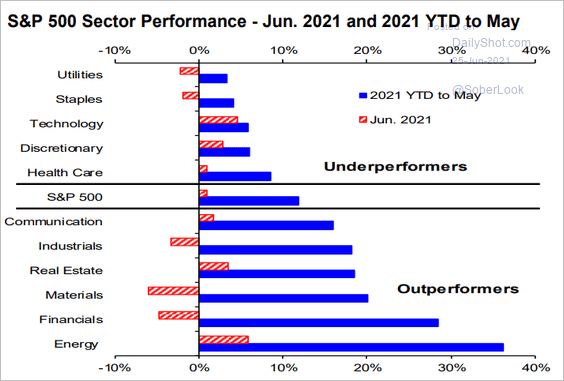 Source: Hugo Ste-Marie, Portfolio & Quantitative Strategy Global Equity Research, Scotia Capital
——————–
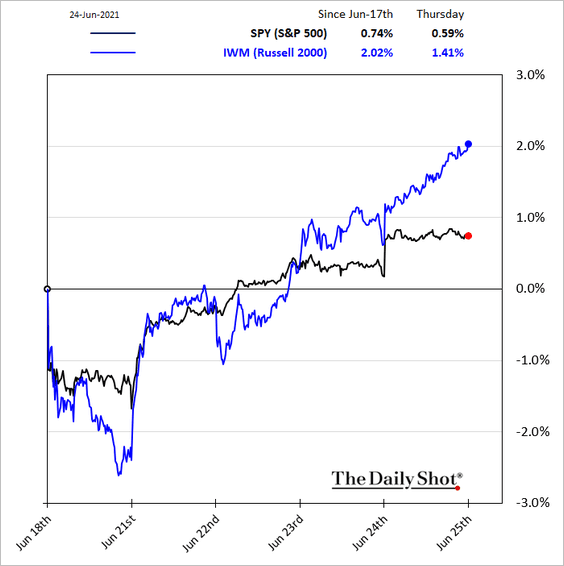
3. Small caps outperformed the S&P 500 this week.
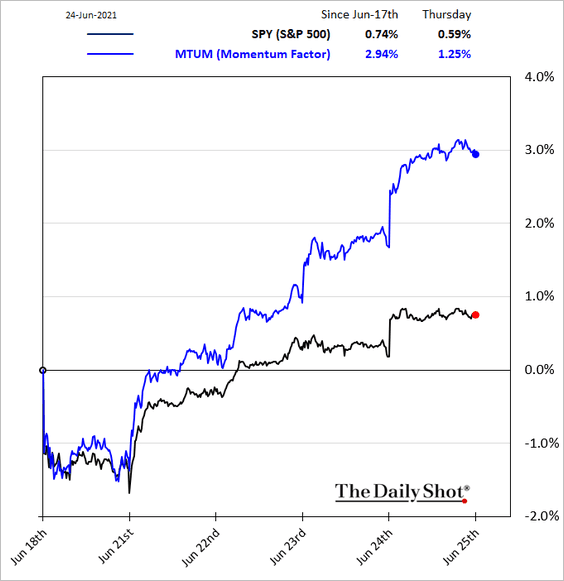
4. The momentum factor finally had a strong few days.
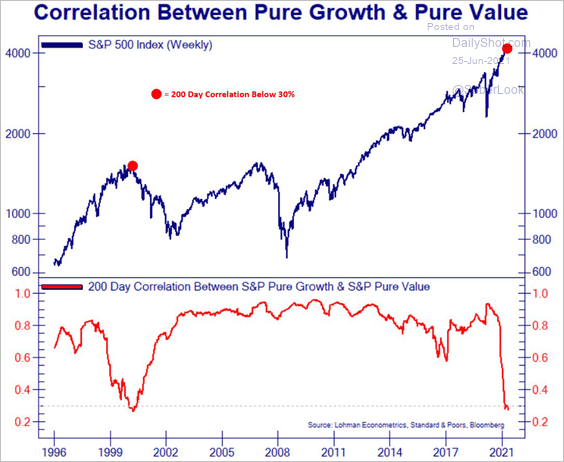
5. The correlation between growth and value remains extremely low.
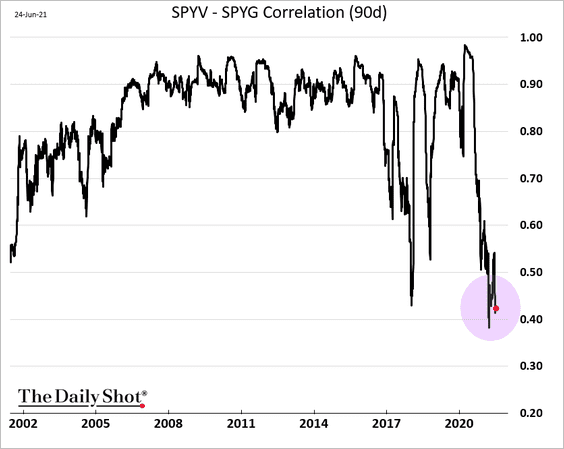
The dot-com crash coincided with the bottoming in this correlation.
 Source: @Not_Jim_Cramer
——————–
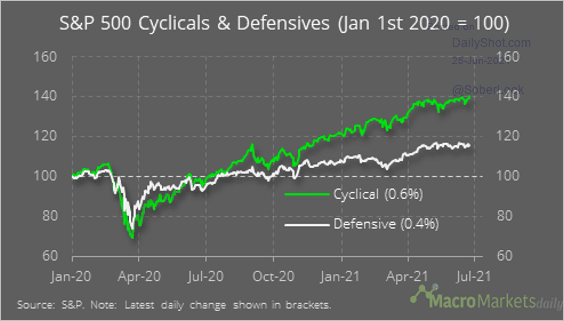
6. This chart shows the relative performance of cyclical and defensive sectors.
 Source: @macro_daily
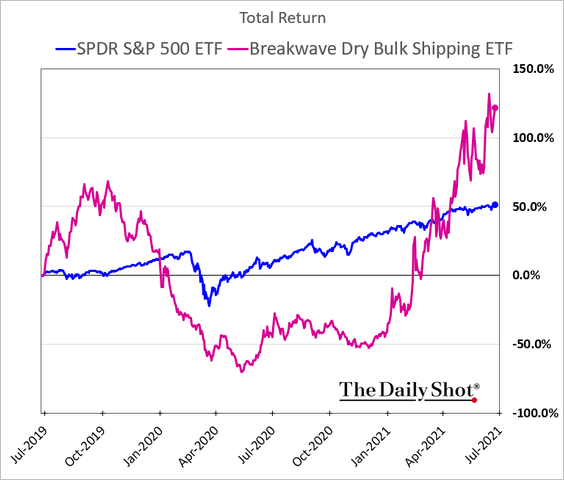
7. Here is a two-year chart of dry bulk shipping companies’ relative performance.
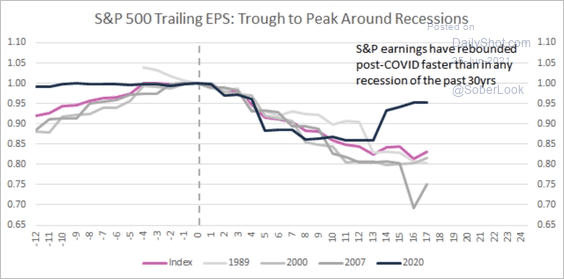
8. S&P 500 earnings have rebounded faster than in previous recessions.
 Source: Evercore ISI
9. Evercore ISI expects further margin expansion for S&P 500 companies.
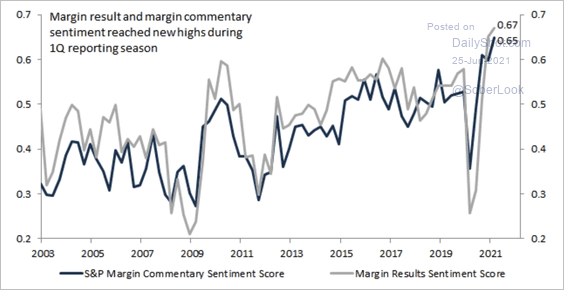 Source: Evercore ISI
10. Quantity-on-loan for SPY (S&P 500) ETF has been rising, suggesting increased shorting/hedging activity.
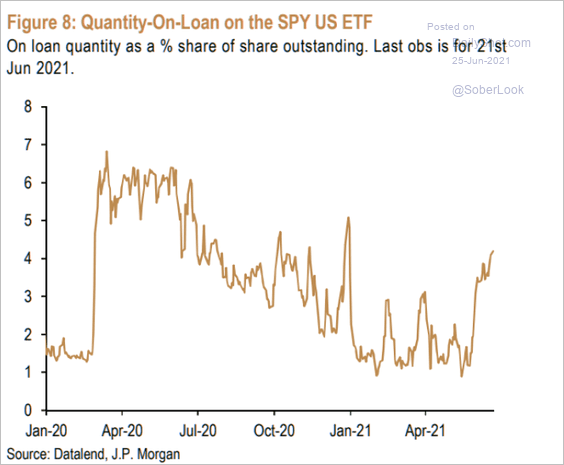 Source: JP Morgan, @themarketear
11. Asset managers have reduced their net-long VIX futures positions this year.
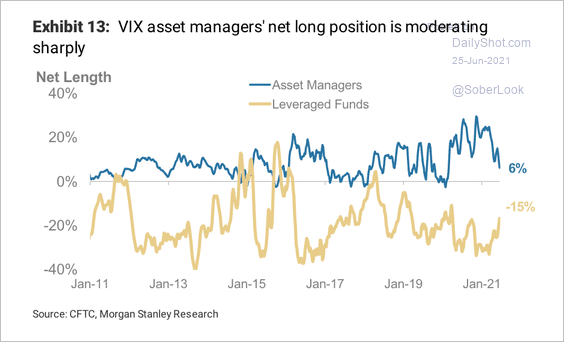 Source: Morgan Stanley Research
Back to Index
Credit
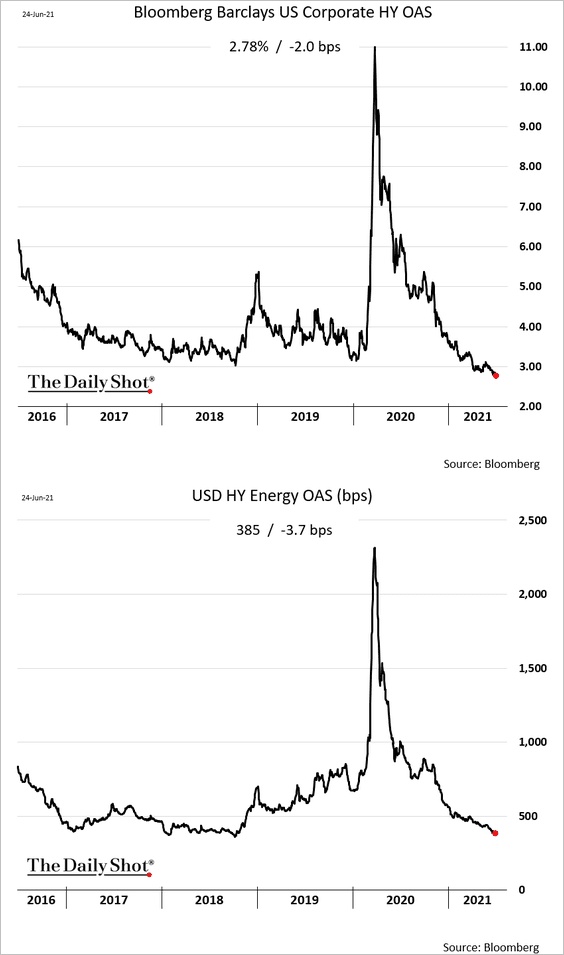
1. High-yield debt spreads continue to hit record lows as rising oil prices boost energy-sector bonds (2nd chart).
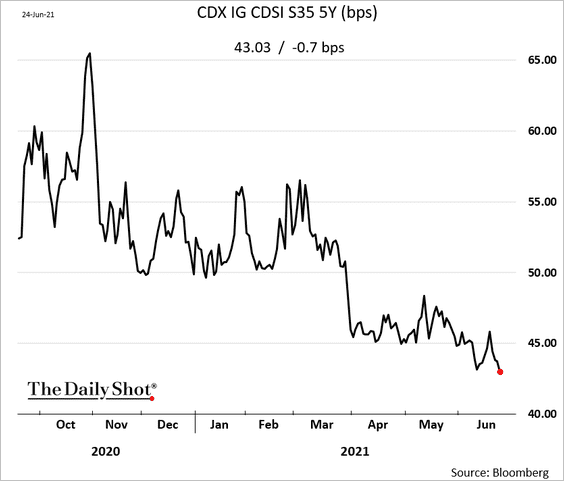
2. Investment-grade credit default swap spreads are also tightening.
3. High-yield bonds sharply outperformed leveraged loans in recent weeks.
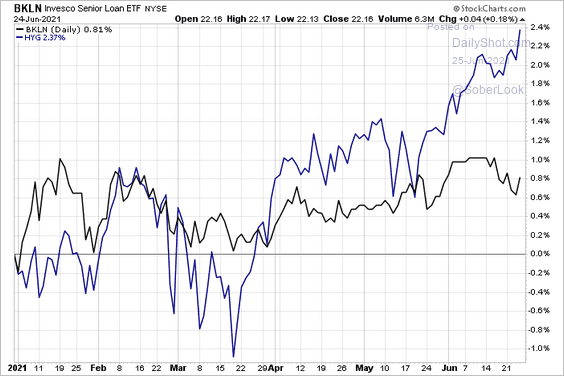 Source: @sunchartist
4. This chart shows leveraged loan price distribution over time.
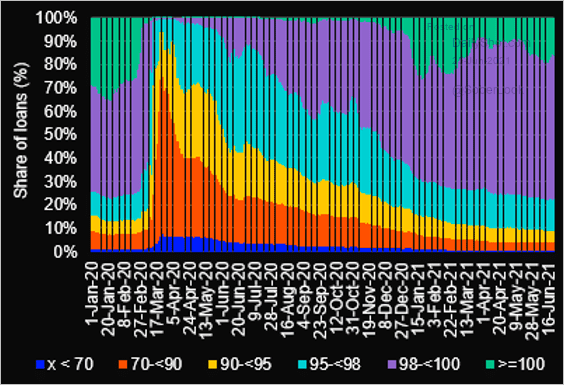 Source: @LPCLoans
5. US largest banks easily cleared the Fed’s key capital ratio requirement.
![]() Source: @markets Read full article
Source: @markets Read full article
6. The replacement of the Federal Housing Finance Agency’s boss is bad news for the Fannie and Freddie equity investors (see story).
 Source: CNBC Read full article
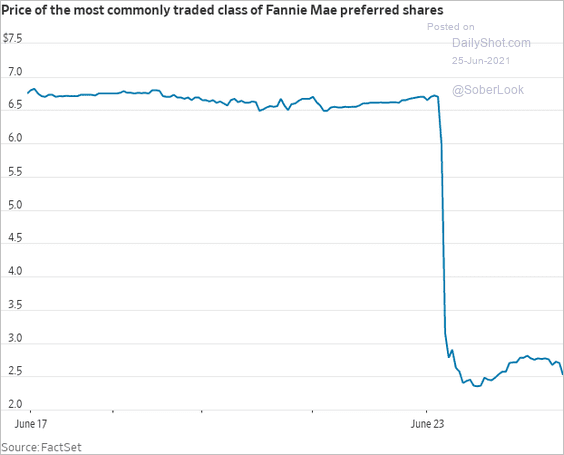 Source: @WSJ Read full article
——————–
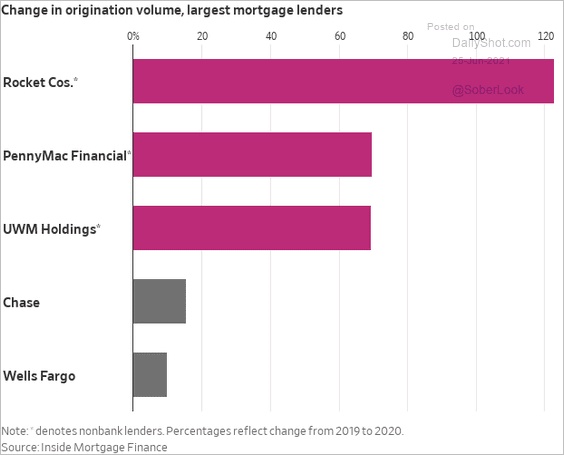
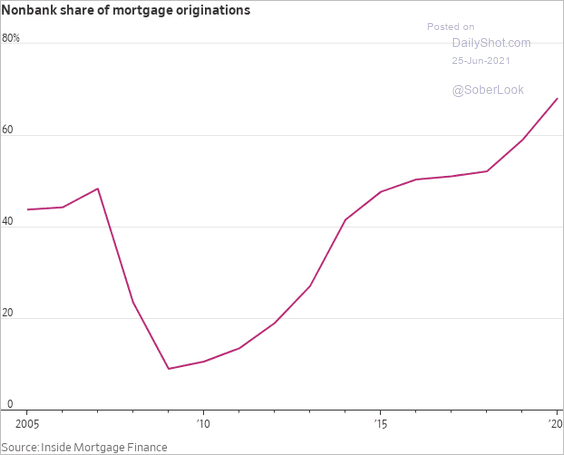
7. Shadow banking firms continue to dominate US mortgage origination (2 charts).
 Source: @WSJ Read full article
 Source: @WSJ Read full article
——————–
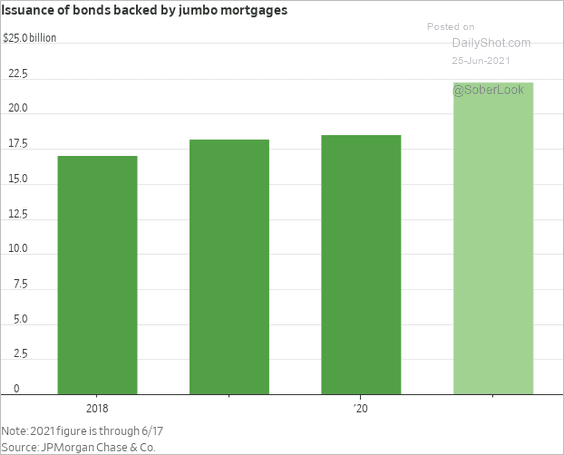
8. Debt backed by jumbo mortgages has been popular this year.
 Source: @WSJ Read full article
Back to Index
Rates
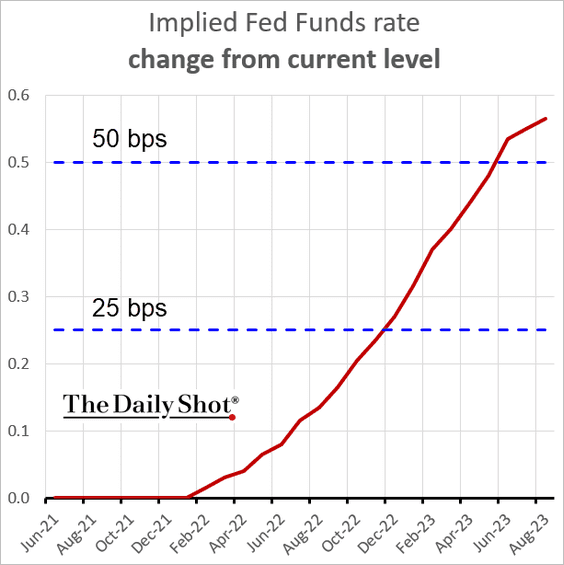
1. Here is the market-implied fed funds rate trajectory (relative to the current level).
2. Below is the projected path for the US Treasury’s cash balances (as the debt ceiling snaps back).
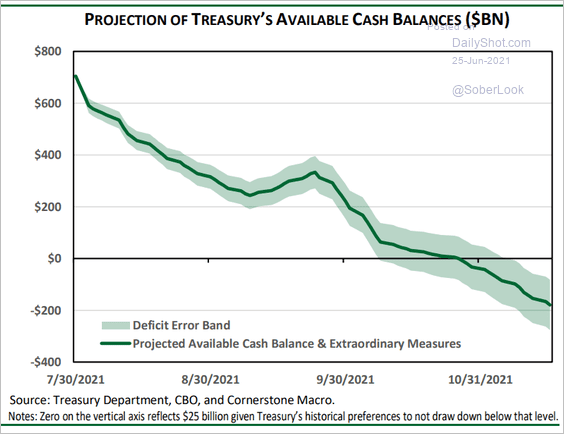 Source: Cornerstone Macro
3. Will the G-5 credit impulse decline become a drag on US inflation expectations?
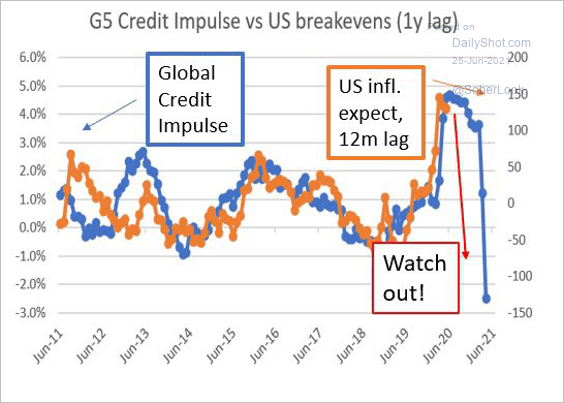 Source: @AndreasDagasan
4. Next, we have a long-term chart showing US 10yr real yields vs. federal government debt.
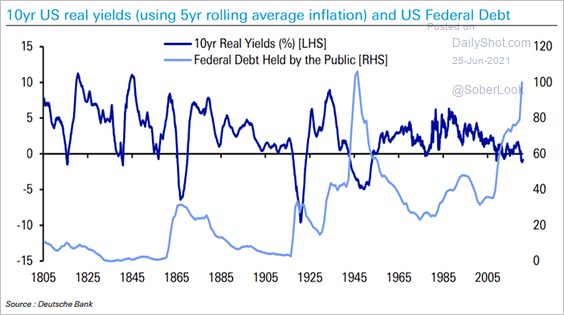 Source: @ISABELNET_SA, @DeutscheBank
Back to Index
Global Developments
1. Most large economies’ GDPs are still below pre-pandemic levels
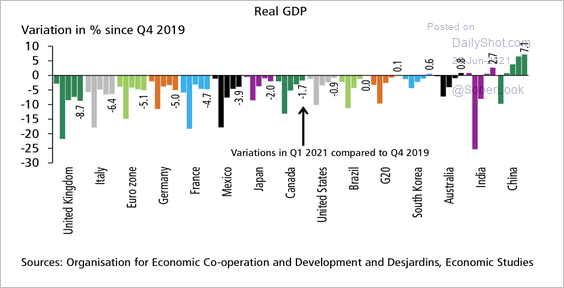 Source: Desjardins
2. Will China’s loss of economic momentum become a drag on the G10 economies?
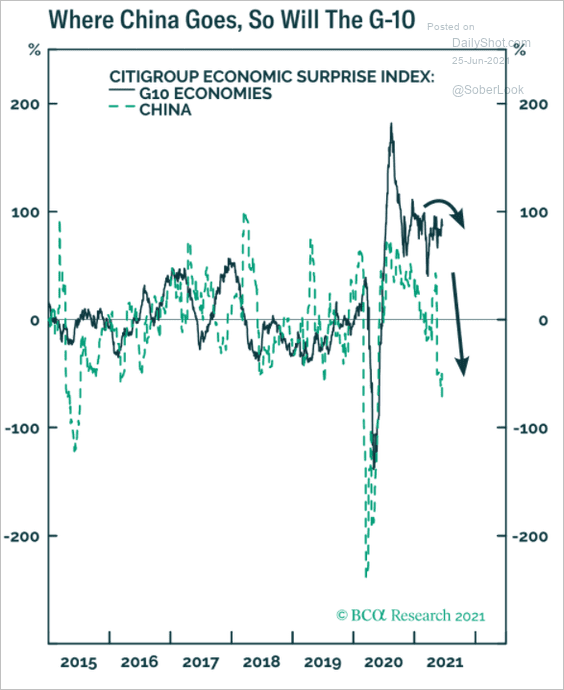 Source: BCA Research
3. The most recent acceleration in inflation is mostly seen in North America.
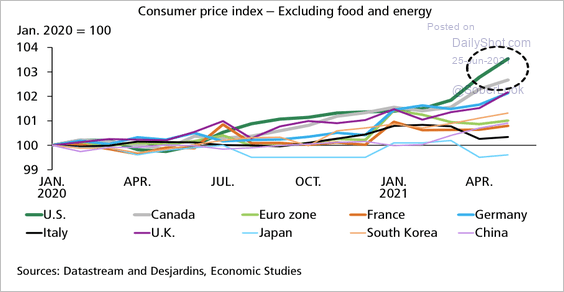 Source: Desjardins
4. Next, we have the core CPI forecasts for the largest advanced economies (from Capital Economics).
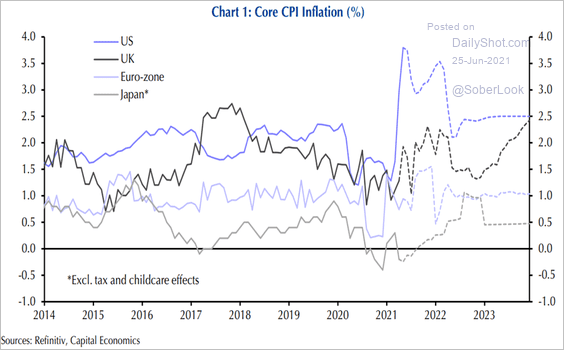 Source: Capital Economics
5. Which regional stock markets have the most exposure to tech?
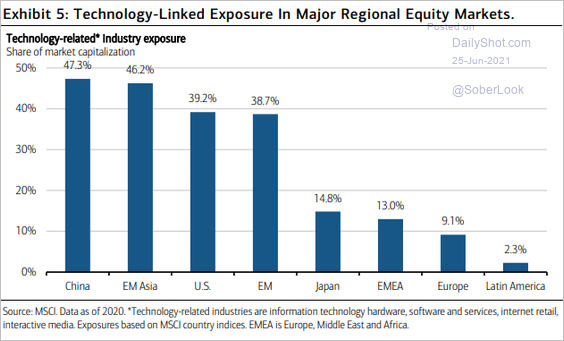 Source: BofA Global Research
——————–
Food for Thought
1. Labor intensity of S&P 500 companies over time:
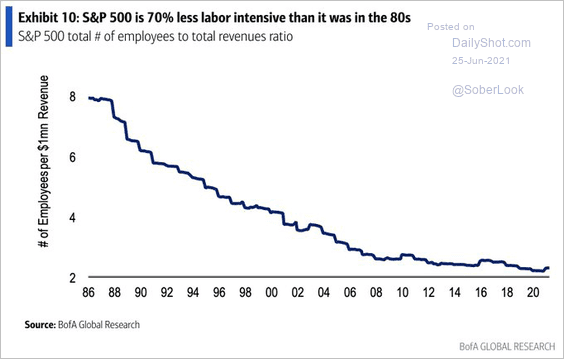 Source: BofA Global Research, @SamRo
2. Americans are quitting their jobs in record numbers.
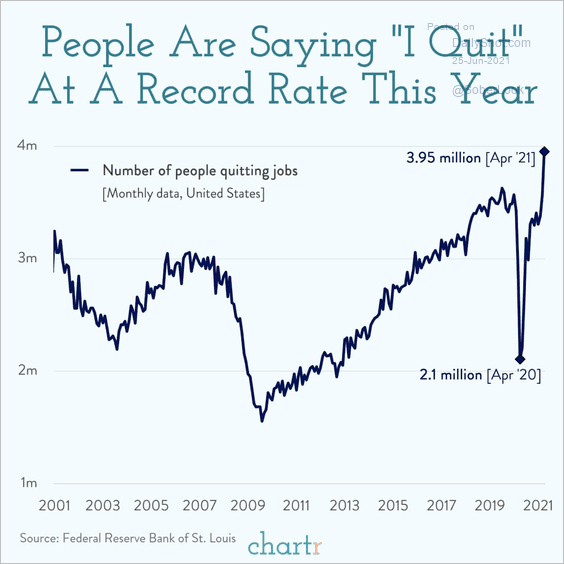 Source: @chartrdaily
3. How countries set their minimum wage:
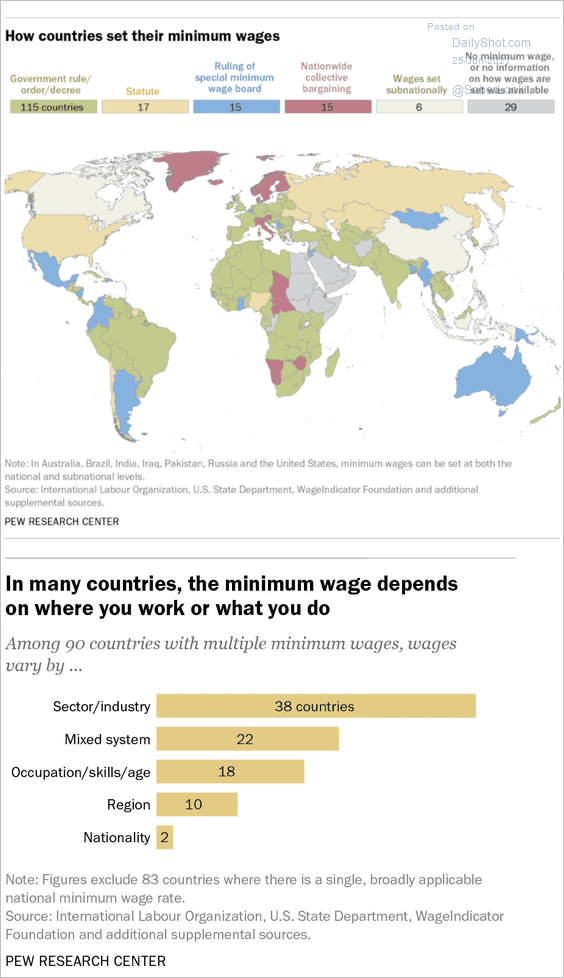 Source: Pew Research Center Read full article
4. Windows operating system market share:
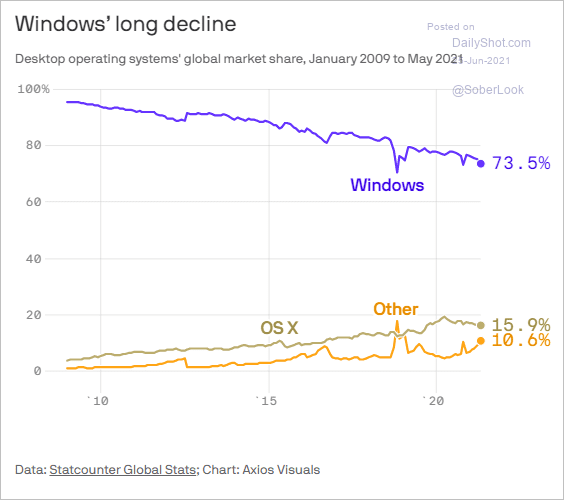 Source: @axios Read full article
5. Interest in self-driving cars:
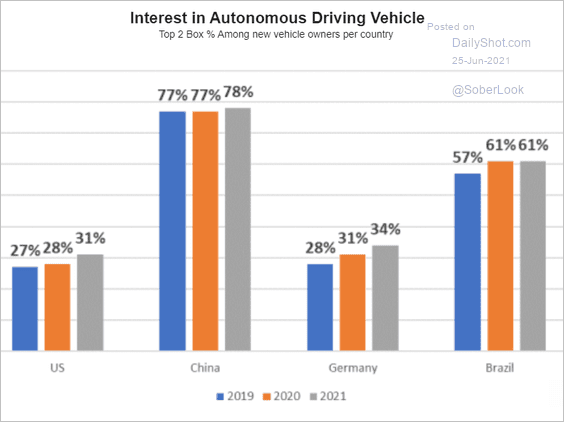 Source: Ipsos
7. E-commerce sales growth (2 charts):
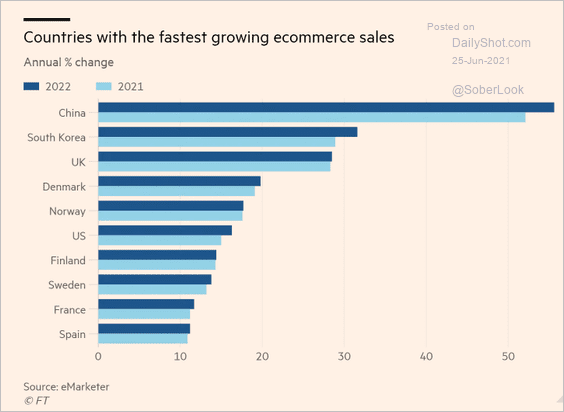 Source: @financialtimes Read full article
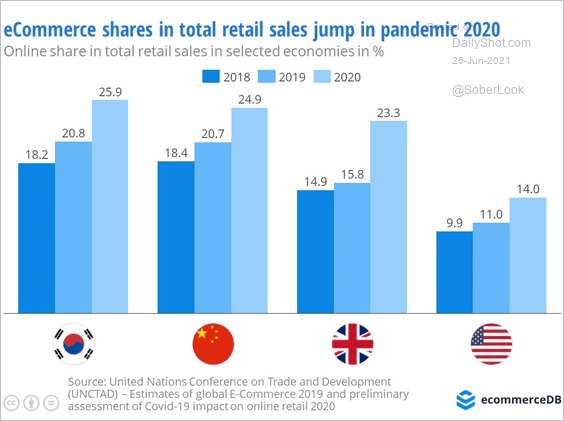 Source: eCommerceDB Read full article
——————–
8. Resume ratings by age:
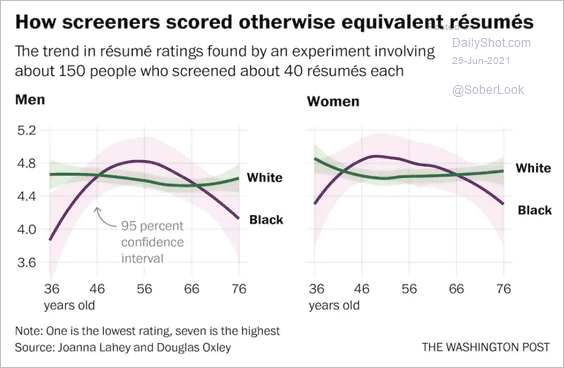 Source: The Washington Post Read full article
9. Homeless people in the US:
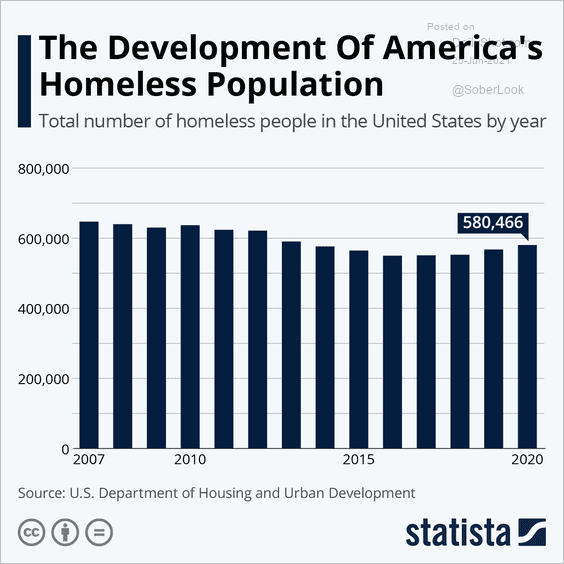 Source: Statista
10. US gun deaths:
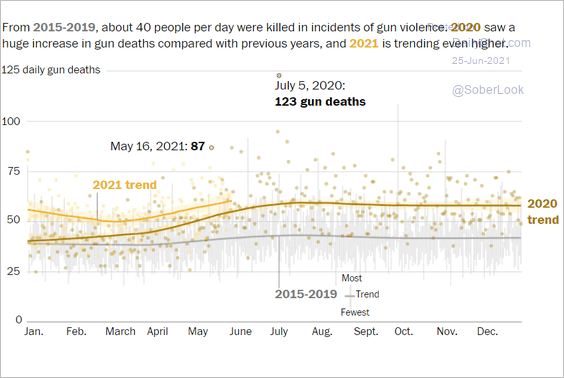 Source: The Washington Post Read full article
11. Euro 2020 football (soccer) championship predictions:
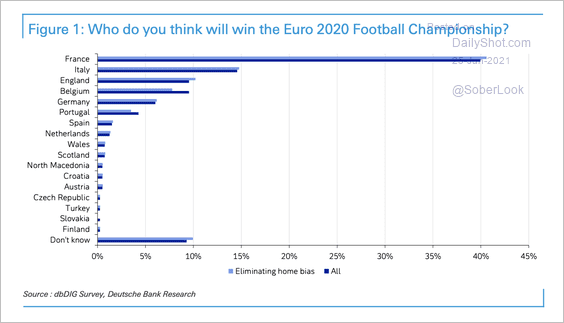 Source: Deutsche Bank Research
12. UFO sightings over time:
 Source: Statista
——————–
Have a great weekend!
Back to Index