The Daily Shot: 01-Jul-21
• Administrative Update
• The United States
• Canada
• The United Kingdom
• The Eurozone
• Japan
• Asia – Pacific
• China
• Emerging Markets
• Cryptocurrency
• Commodities
• Energy
• Equities
• Credit
• Rates
• Global Developments
• Food for Thought
Administrative Update
1. Please note that the next Daily Shot will be published on Monday, July 5th.
2. Please see this summary for information on updating your account status (for example, if you don’t want your subscription to renew automatically).
Back to Index
The United States
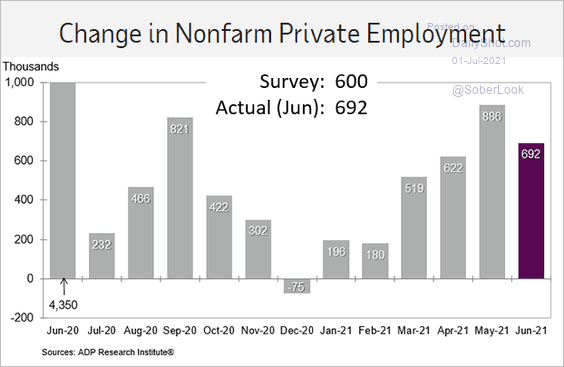
1. The ADP report showed strong gains in private payrolls in June, topping forecasts.
 Source: ADP Research Institute
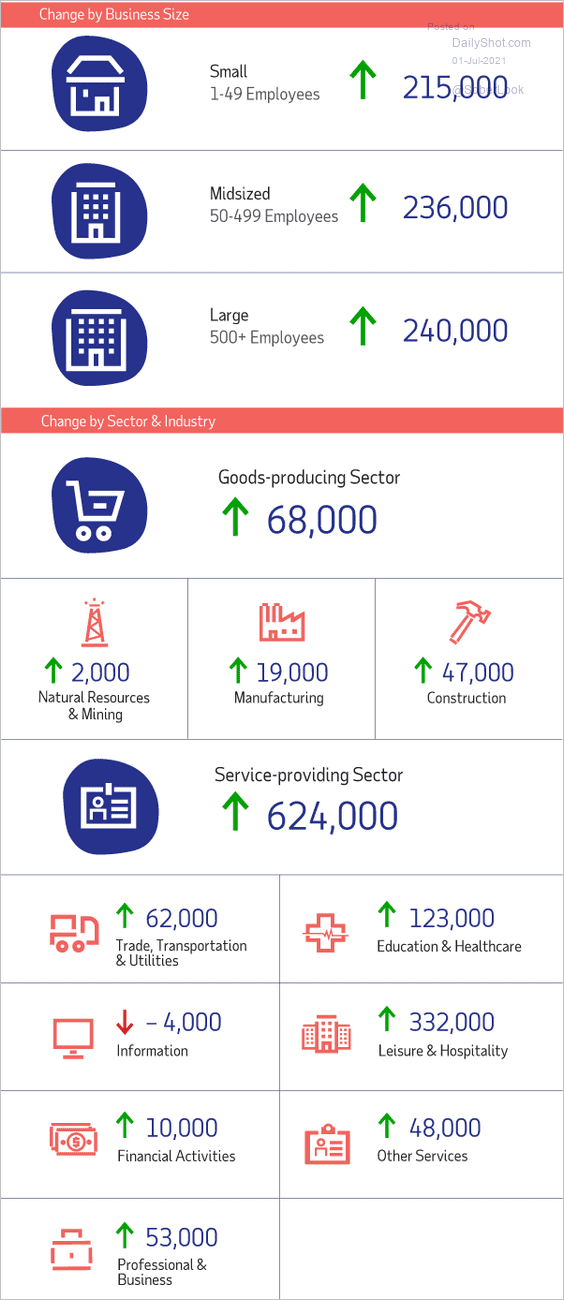
Employment gains were broad, with Leisure and Hospitality picking up 332k jobs.
 Source: ADP Research Institute
——————–
2. The Chicago PMI pulled back from the May highs. The report indicated that input price gains sped up in June, and hiring slowed.
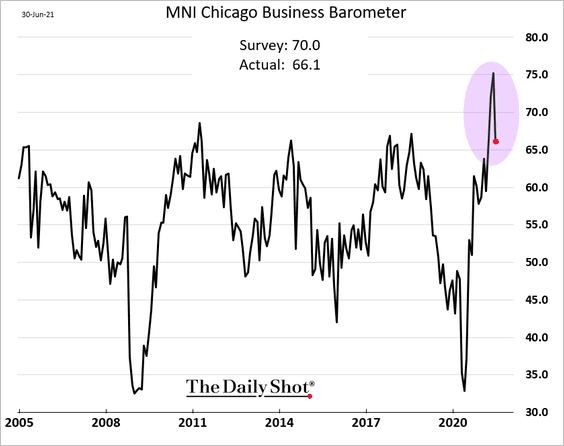
Regional surveys point to a strong ISM Manufacturing report at the national level (10 AM this morning).
 Source: @MikaelSarwe
——————–
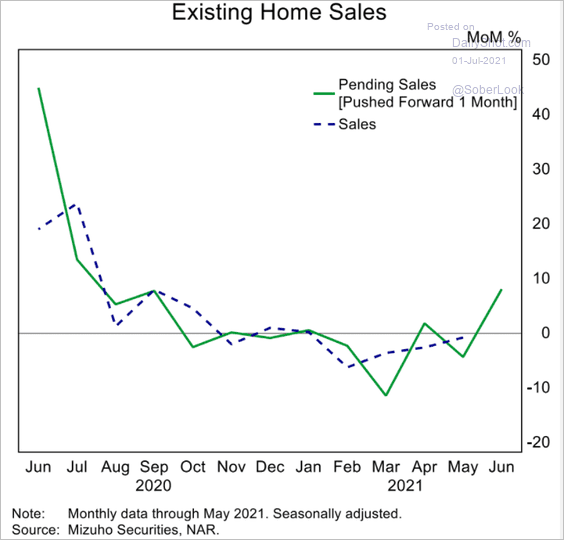
3. Pending home sales surprised to the upside. Despite sharp price increases, housing demand remains robust.
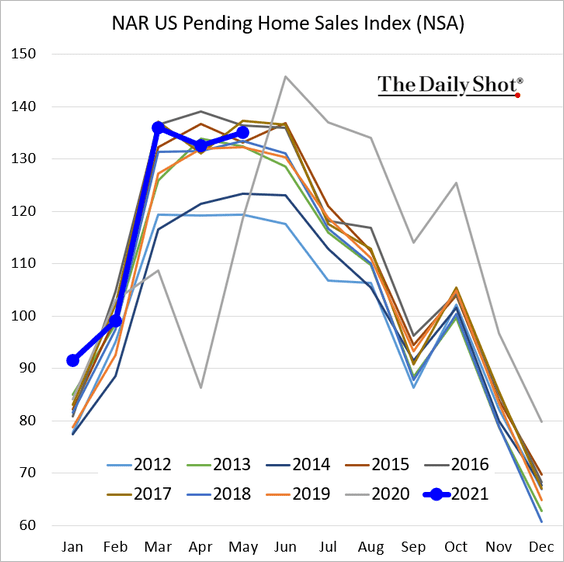
We are likely to see a jump in existing home sales in June.
 Source: Mizuho Securities USA
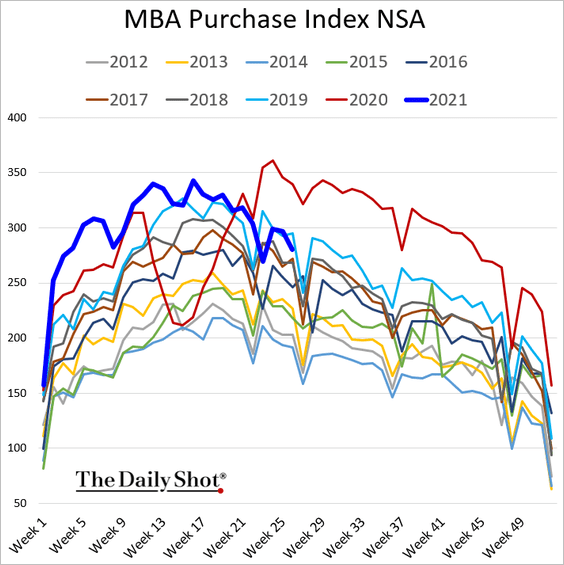
However, mortgage applications are now running below 2019 levels.
——————–
4. Here are a couple of updates on inflation.
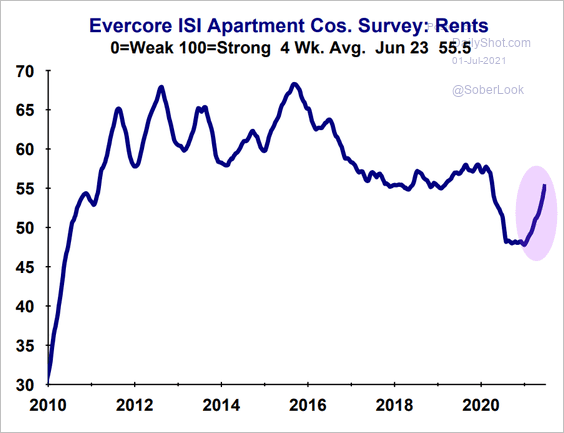
• The Evercore ISI Apartment Survey shows rents rebounding quickly. We should see this recovery boosting the core CPI in the months ahead.
 Source: Evercore ISI
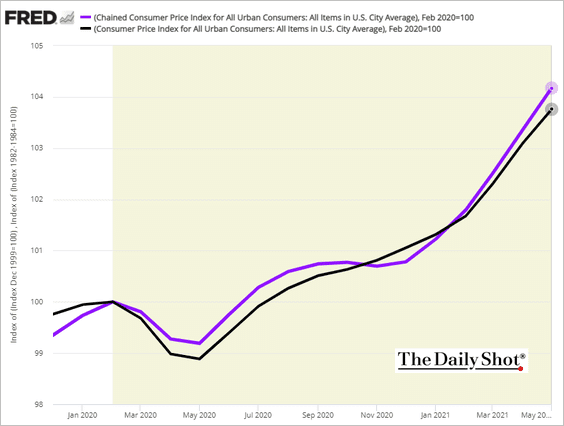
• The chained CPI index outperformed the official inflation measure since the start of the pandemic because it takes into account changing spending patterns.
 Further reading
——————–
5. Next, let’s take a look at some trends in the labor markets.
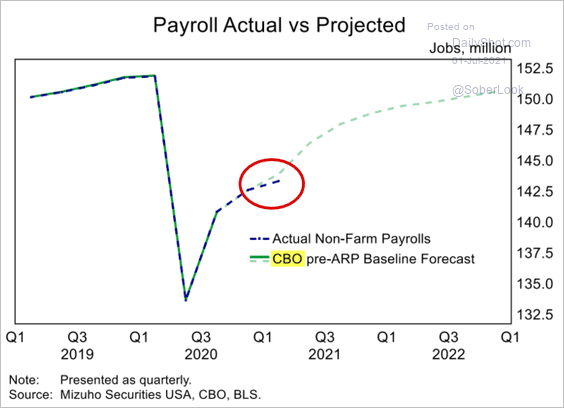
• The CBO expected Americans who are out of work to get jobs faster than they have been.
 Source: Mizuho Securities USA
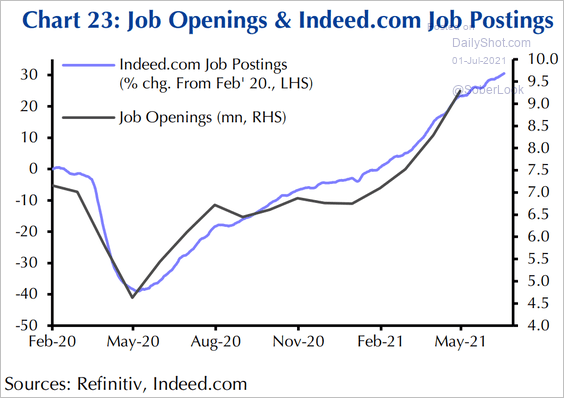
And there are plenty of jobs.
 Source: Capital Economics
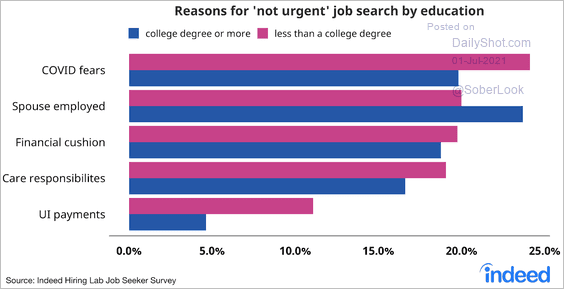
So what are the reasons?
– COVID concerns, savings, other sources of income, childcare …
 Source: Indeed Read full article
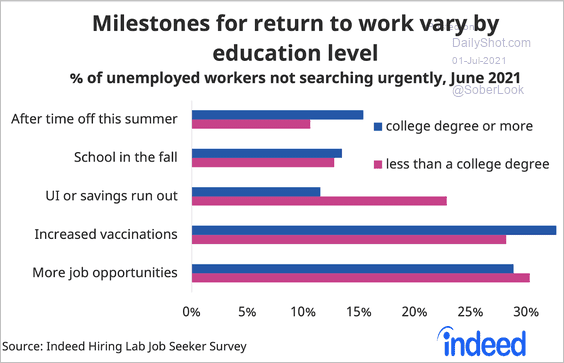
– Milestones to return to work:
 Source: Indeed Read full article
– Reduced mobility (not willing/able to move for a job):
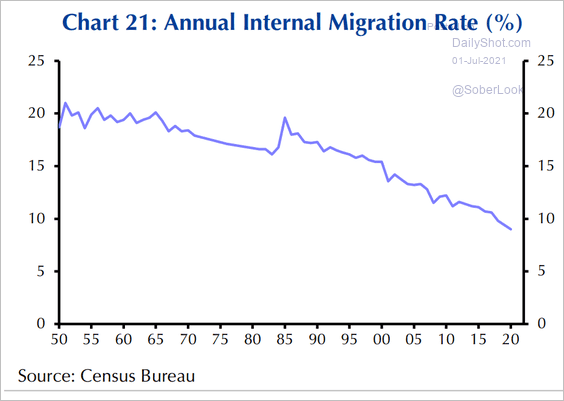 Source: Capital Economics
– Much higher retirement rates:
 Source: Capital Economics
• Here is the breakdown of labor shortages by sector.
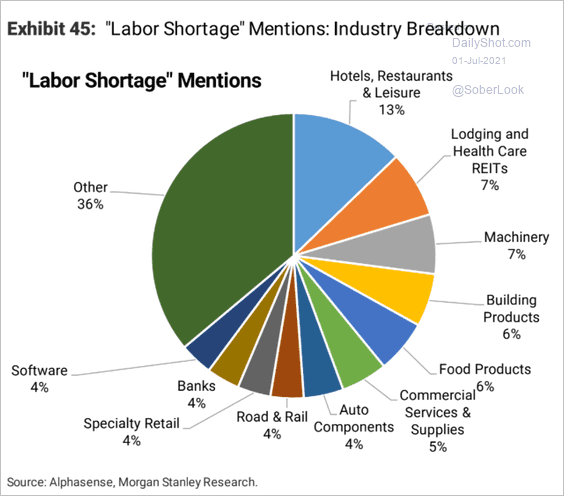 Source: Morgan Stanley Research
• The quit rate points to rapid increases in wage growth.
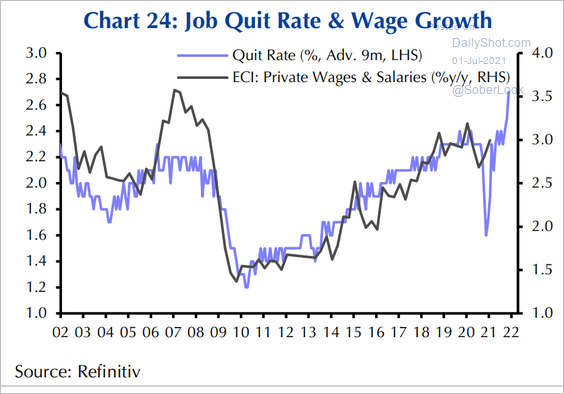 Source: Capital Economics
• These charts show the rebound in labor costs by wage category.
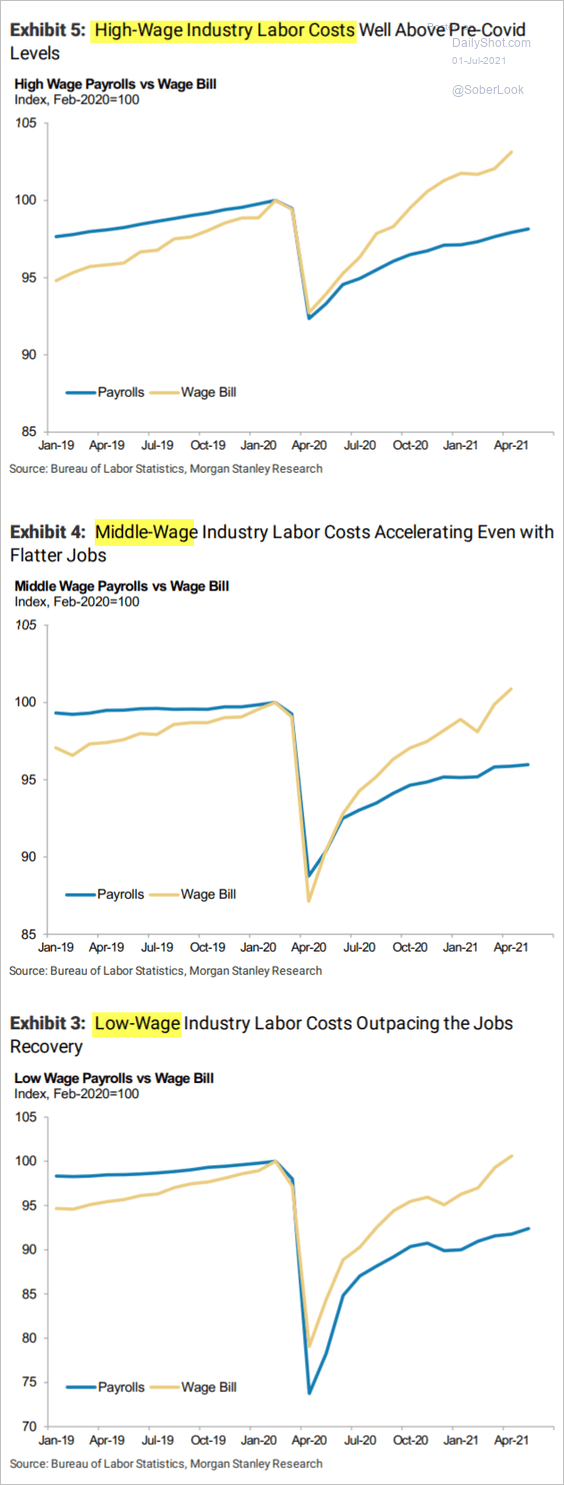 Source: Morgan Stanley Research
——————–
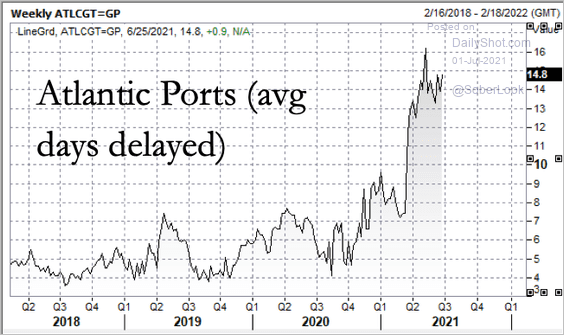
6. US West Coast port delays persist.
 Source: @StockBoardAsset
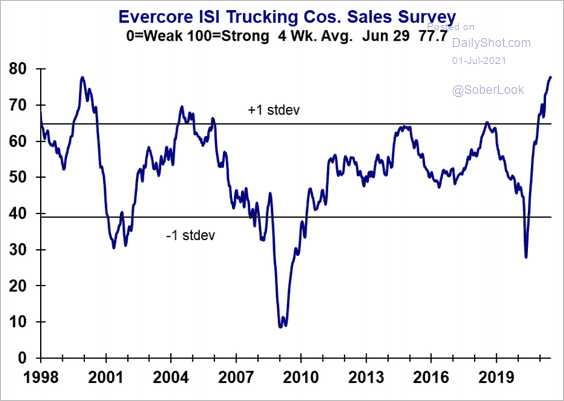
Trucking companies haven’t seen such strong sales growth in over two decades, according to Evercore ISI.
 Source: Evercore ISI
Back to Index
Canada
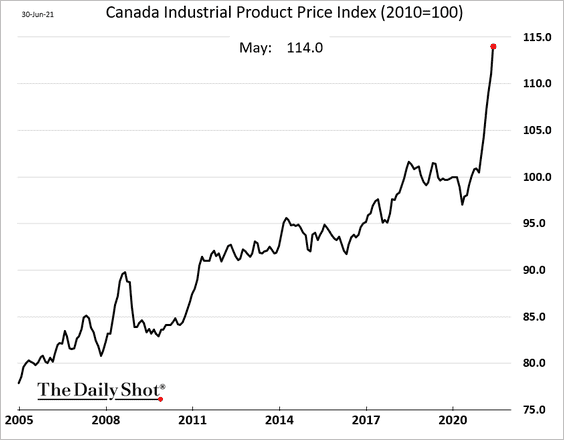
1. Industrial producer prices are soaring.
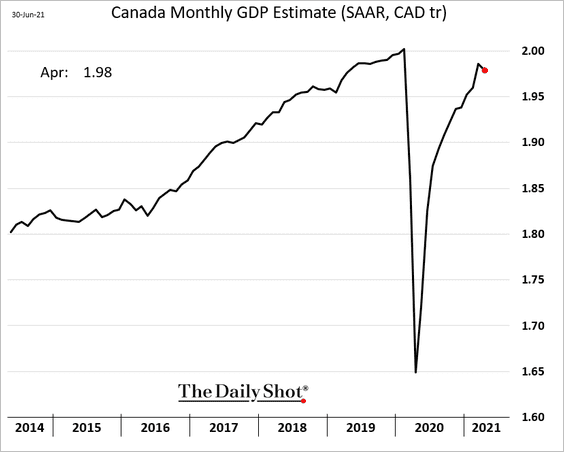
2. The April GDP decline was smaller than expected.
——————–
The United Kingdom
1. The Q1 decline in household spending was more severe than the earlier estimate.
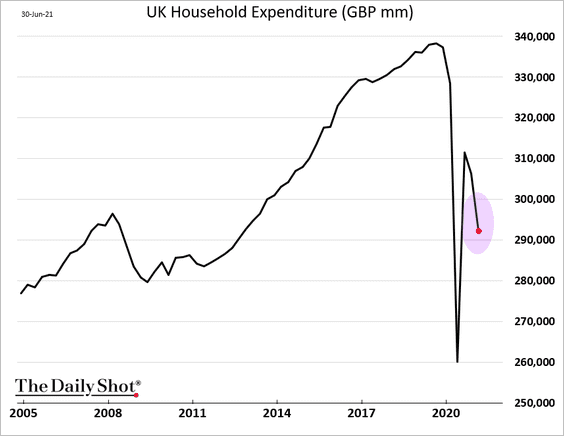
The massive drop in household spending since the start of the pandemic was the reason the UK GDP underperformed (2 charts).
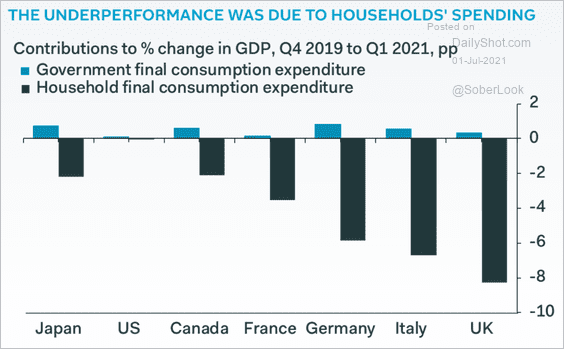 Source: Pantheon Macroeconomics
 Source: Pantheon Macroeconomics
——————–
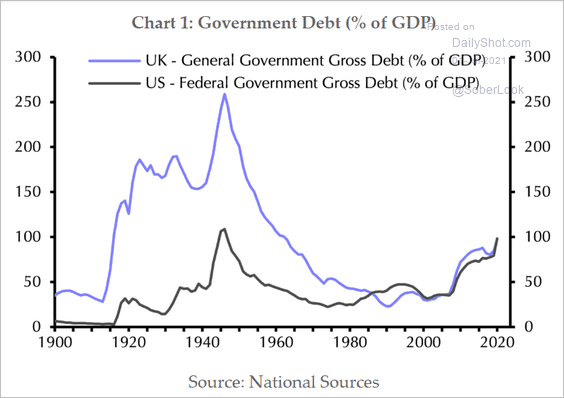
2. The UK and US debt-to-GDP ratios have converged again.
 Source: Capital Economics
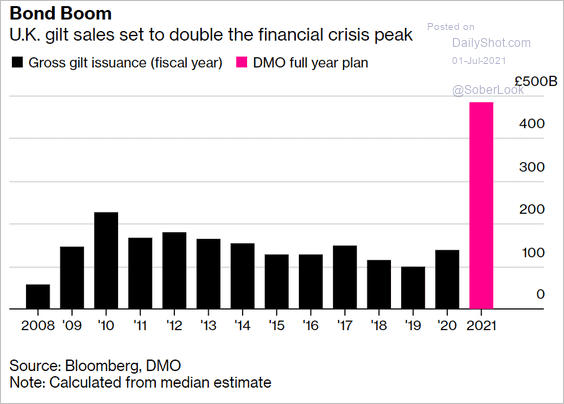
3. Gilt sales this year will double the post-crisis peak in 2010.
 Source: Bloomberg Read full article
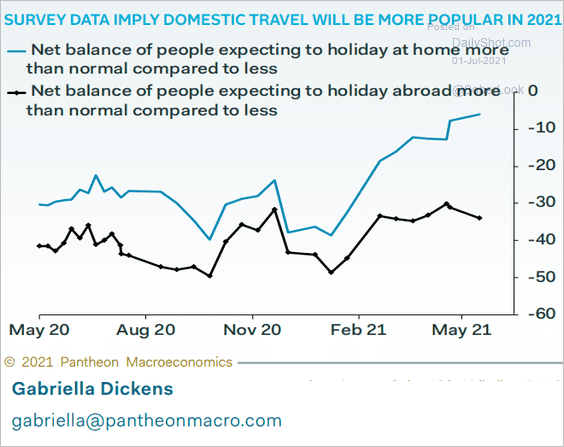
4. Domestic travel is rebounding, but trips abroad remain well below pre-COVID levels.
 Source: Pantheon Macroeconomics
Back to Index
The Eurozone
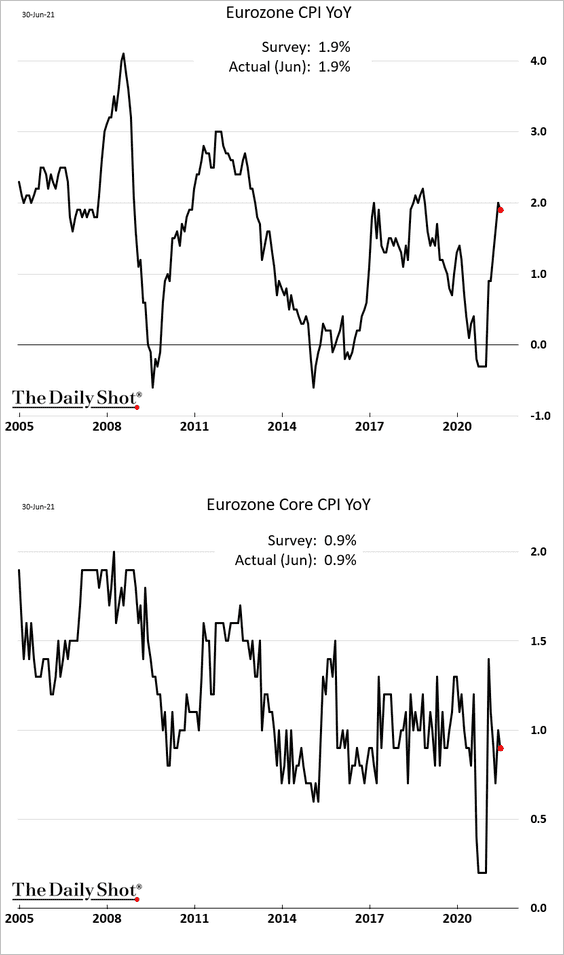
1. The CPI dipped below 2%, and the core CPI is back below 1%.
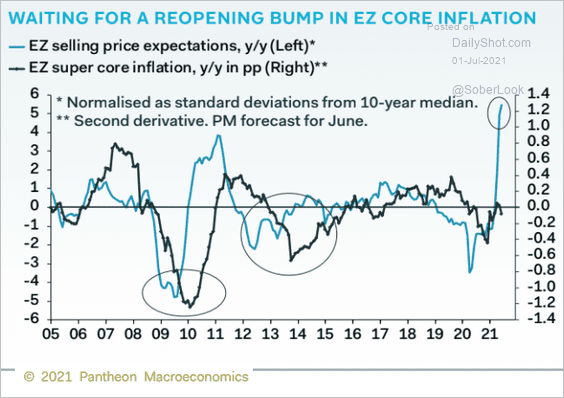
But we should see gains in core inflation in the months ahead.
 Source: Pantheon Macroeconomics
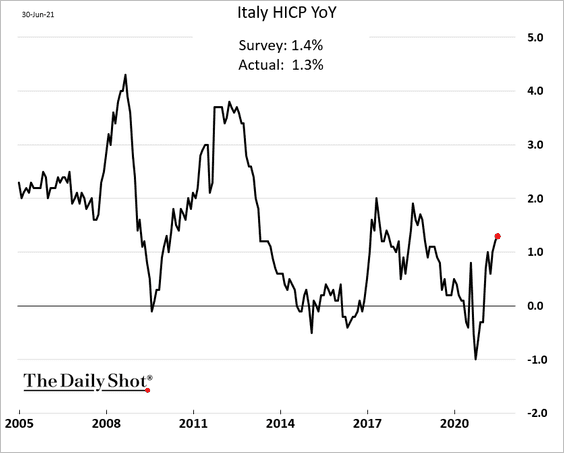
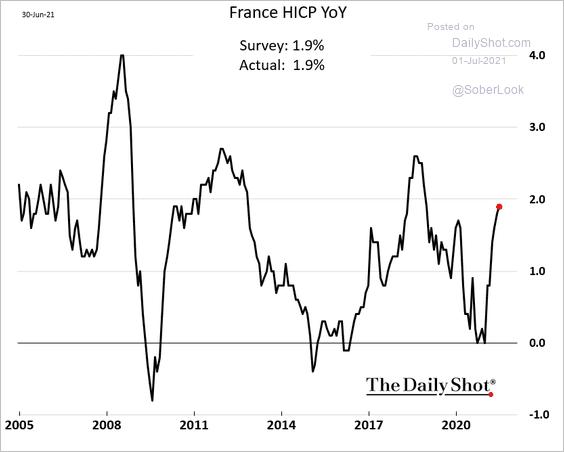
Here are the CPI trends for Italy and France.
——————–
2. Germany’s labor market is rapidly recovering.
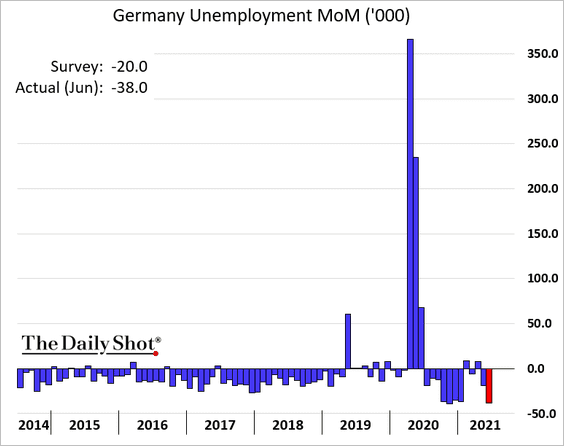
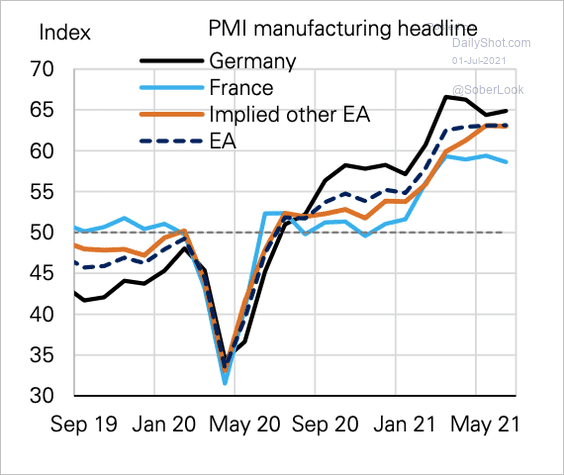
Separately, Germany’s manufacturing PMI has been outperforming its peers over the past year.
 Source: Deutsche Bank Research
——————–
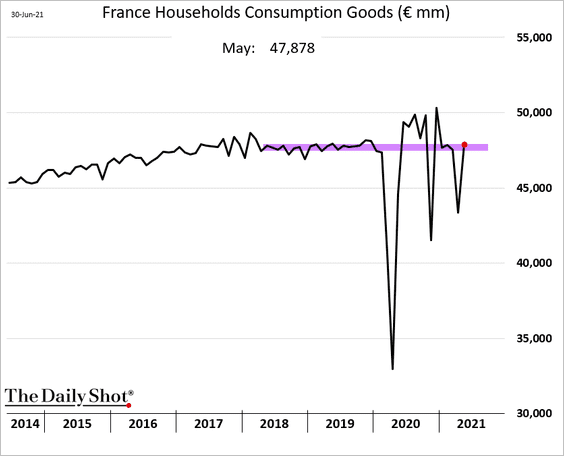
3. French consumer spending is back at pre-COVID levels.
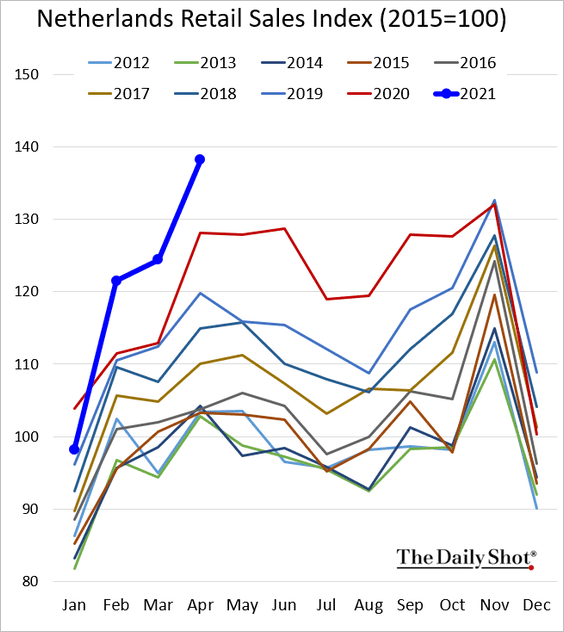
4. Dutch retail sales are surging.
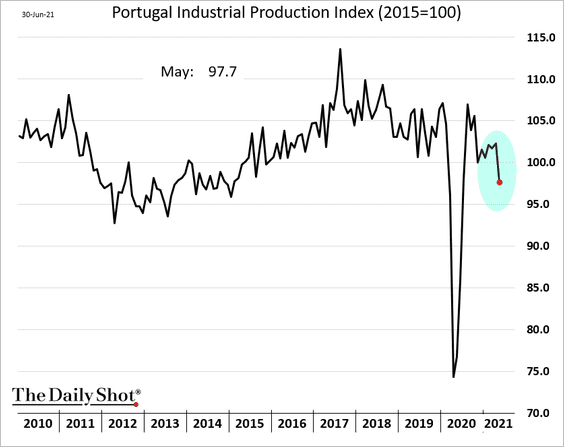
5. Portugal’s industrial production tumbled in May.
6. Greek sovereign credit default swap spreads hit a new low.
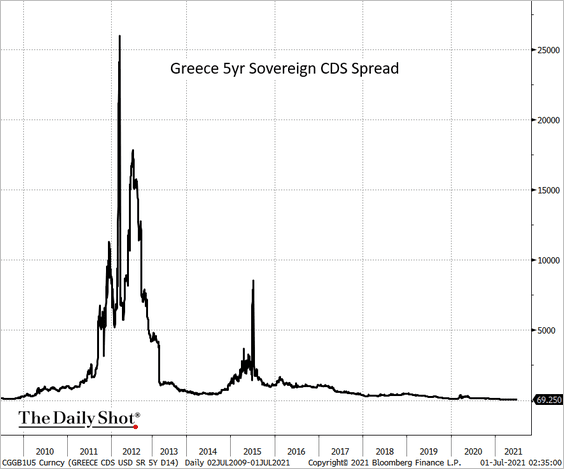 Source: @TheTerminal, Bloomberg Finance L.P.
7. Who owns euro-area equities?
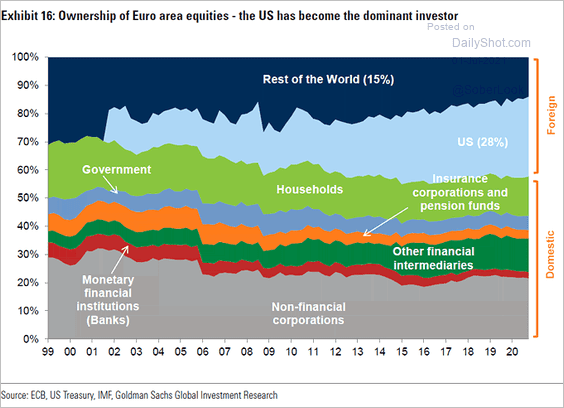 Source: @ISABELNET_SA, @GoldmanSachs
Back to Index
Japan
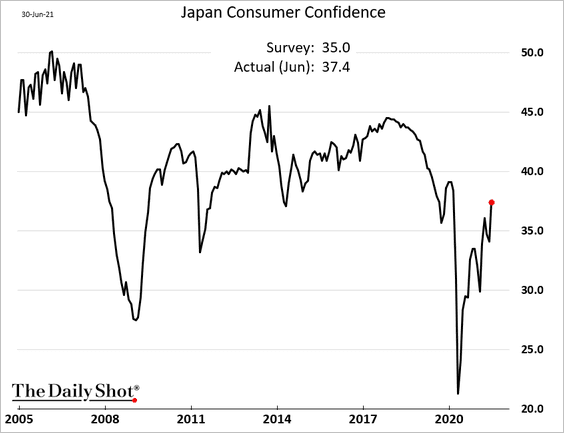
1. Consumer confidence is recovering.
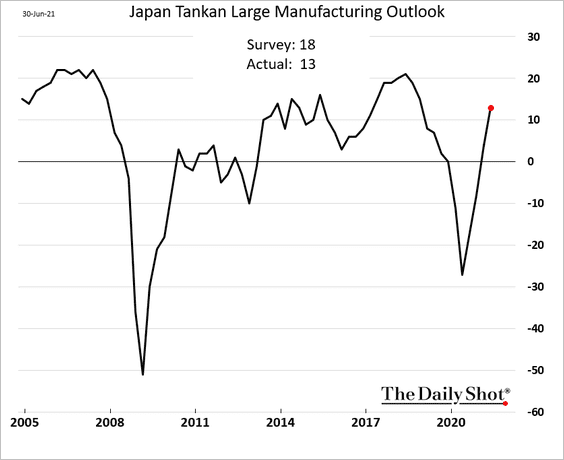
2. The Q2 Tankan business surveys came in below market expectations.
• Manufacturing:
• Non-manufacturing:

——————–
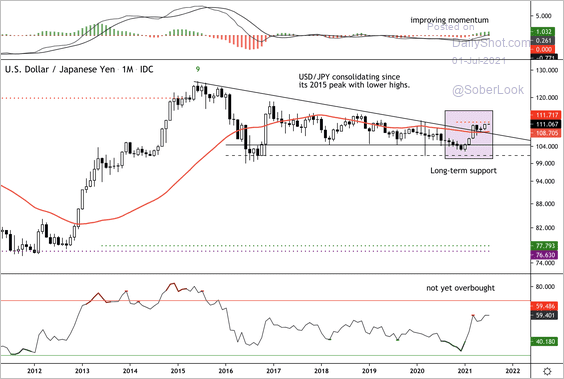
3. USD/JPY is attempting to break above a five-year downtrend.
 Source: Dantes Outlook
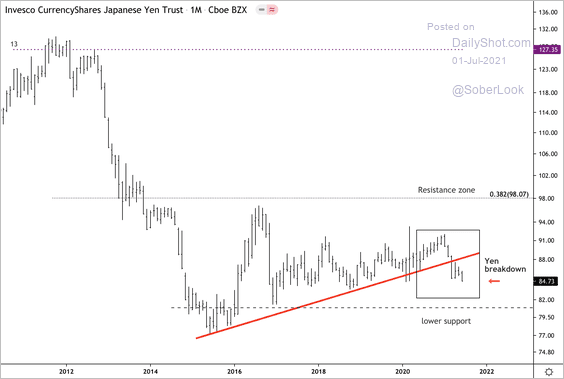
The Invesco Japanese Yen ETF (FXY) is breaking down.
 Source: Dantes Outlook
——————–
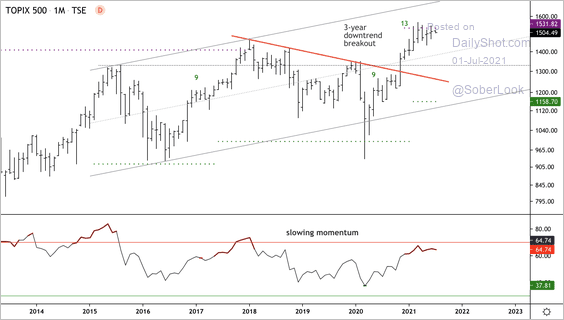
4. The Topix 500 Index appears overbought with slowing upside momentum.
 Source: Dantes Outlook
Back to Index
Asia – Pacific
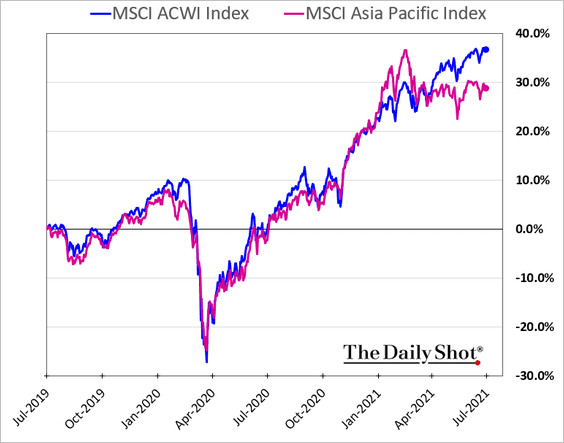
1. Asian stocks have been underperforming global peers.
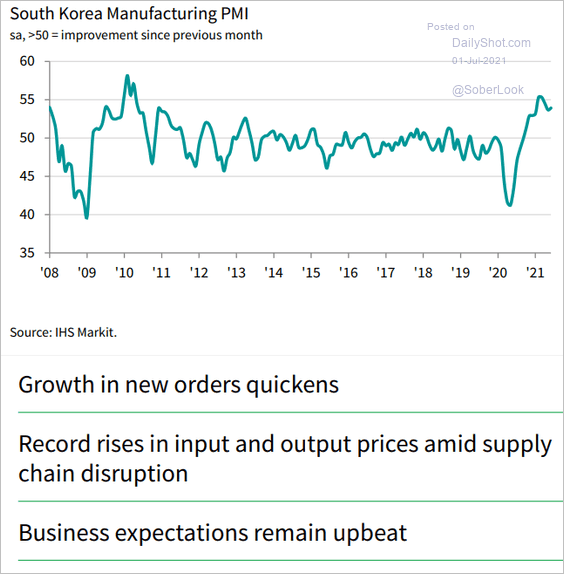
2. South Korea’s manufacturing PMI continues to show robust growth.
 Source: IHS Markit
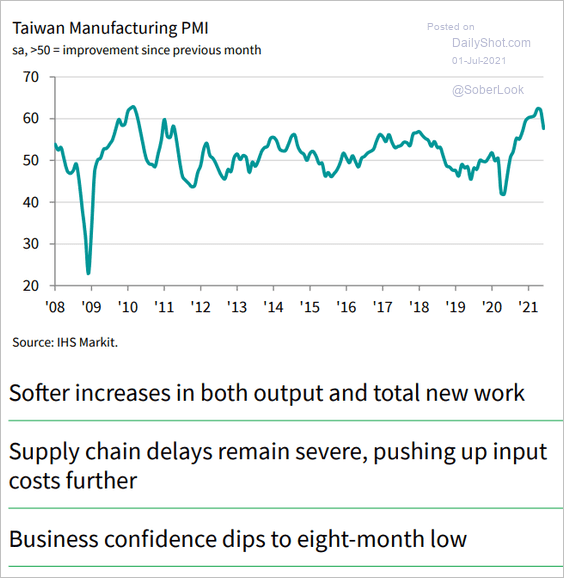
3. Taiwan’s June PMI is off the peak but remains strong.
 Source: IHS Markit
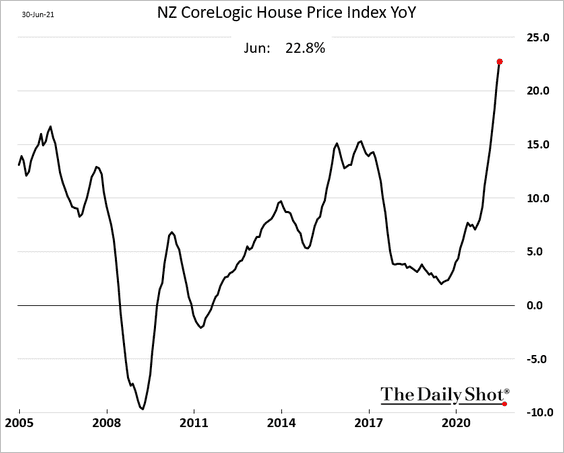
4. New Zealand’s housing bubble has been spectacular. The RBNZ needs to act soon.
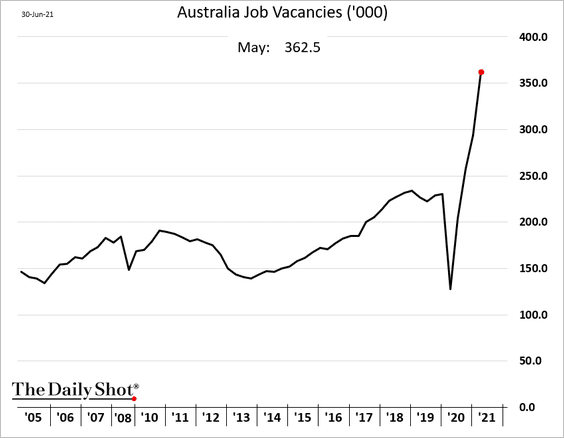
5. Australia’s job vacancies are surging.
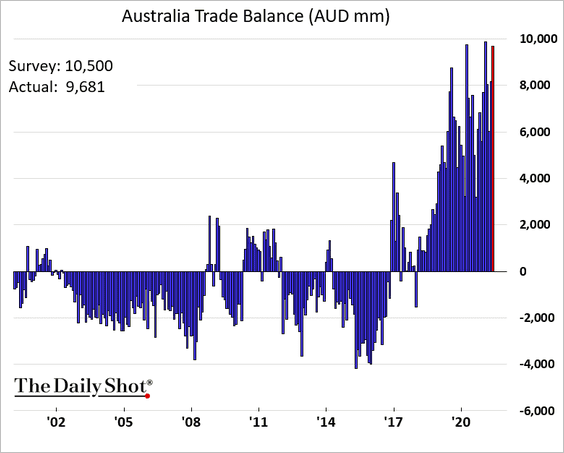
The nation’s trade surplus is near record highs.
Back to Index
China
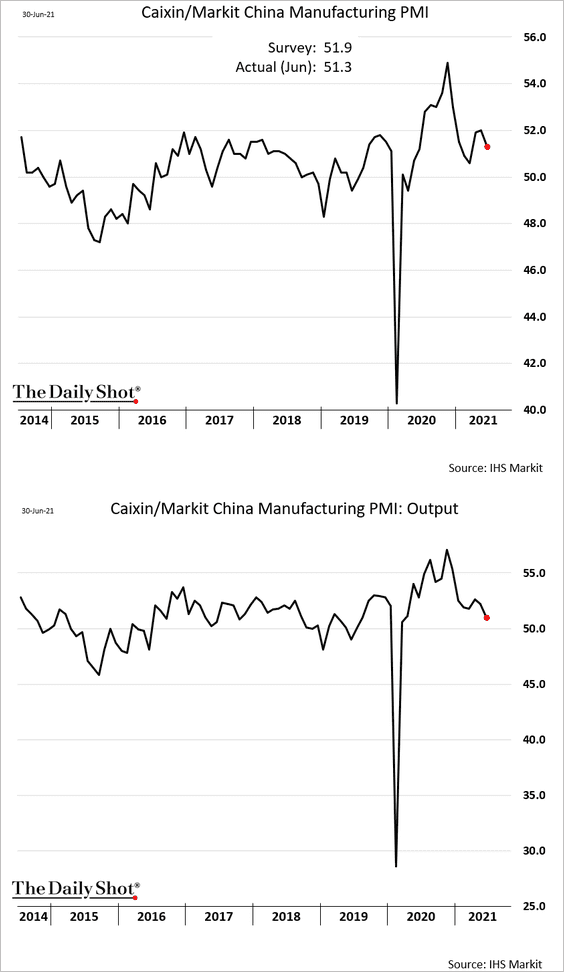
1. The Markit manufacturing PMI was softer than expected as production growth slowed.
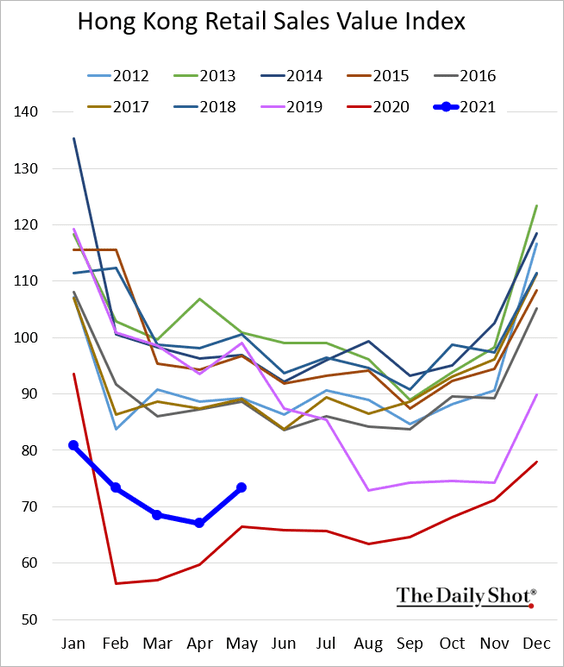
2. Hong Kong’s retail sales remain weak.
Back to Index
Emerging Markets
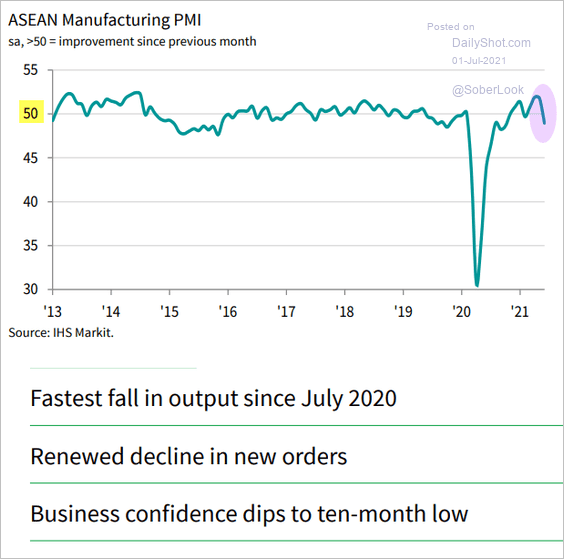
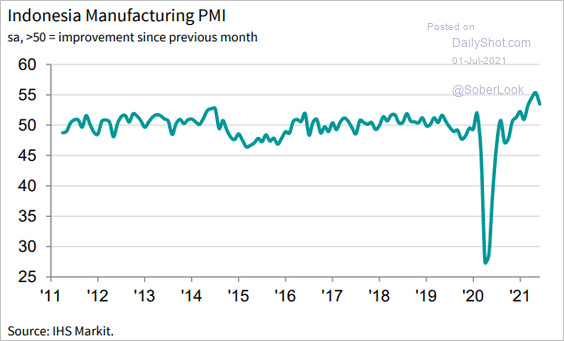
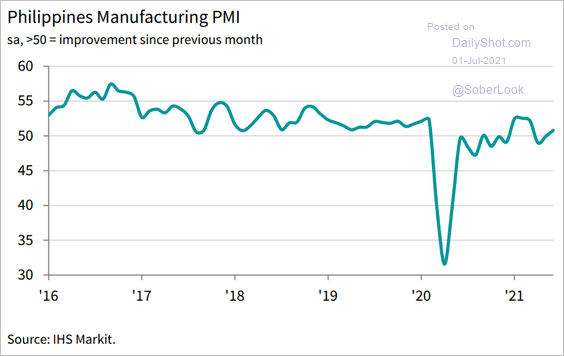
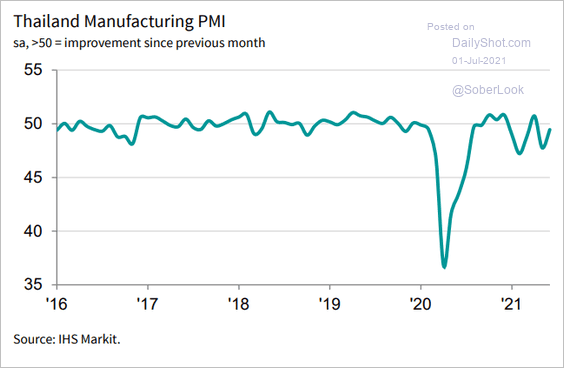
1. Houston, we have a problem. The ASEAN manufacturing PMI is back in contraction territory as the pandemic takes its toll.
 Source: IHS Markit
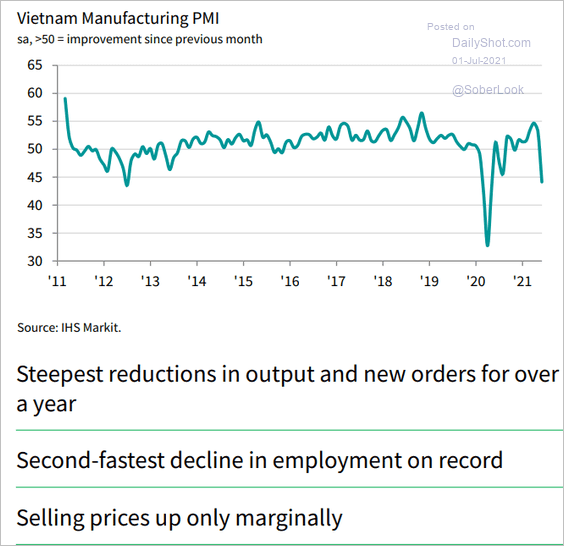
Vietnam’s factory activity tumbled in June.
 Source: IHS Markit
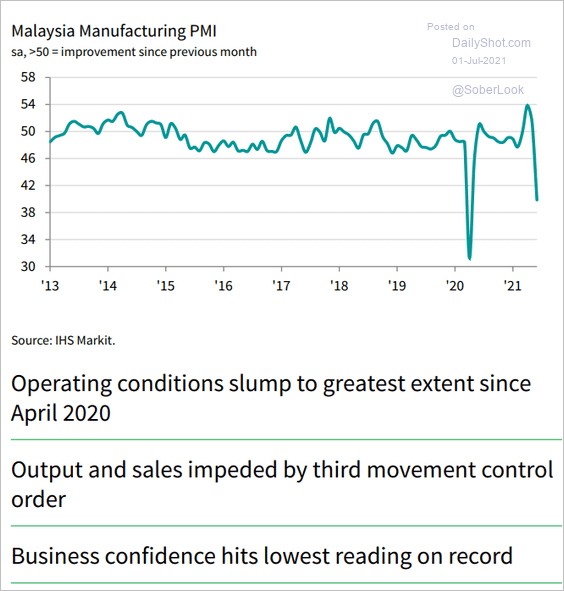
Malaysia’s manufacturing took a massive hit.
 Source: IHS Markit
Below are some additional PMI trends.
• Indonesia (still growing):
 Source: IHS Markit
• The Philippines (slight growth):
 Source: IHS Markit
• Thailand (slower contraction):
 Source: IHS Markit
——————–
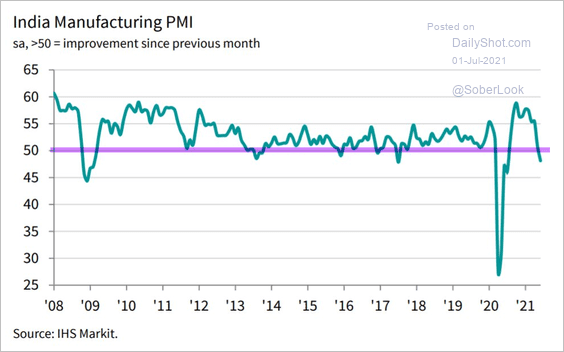
2. India’s manufacturing activity shrunk in June.
 Source: IHS Markit
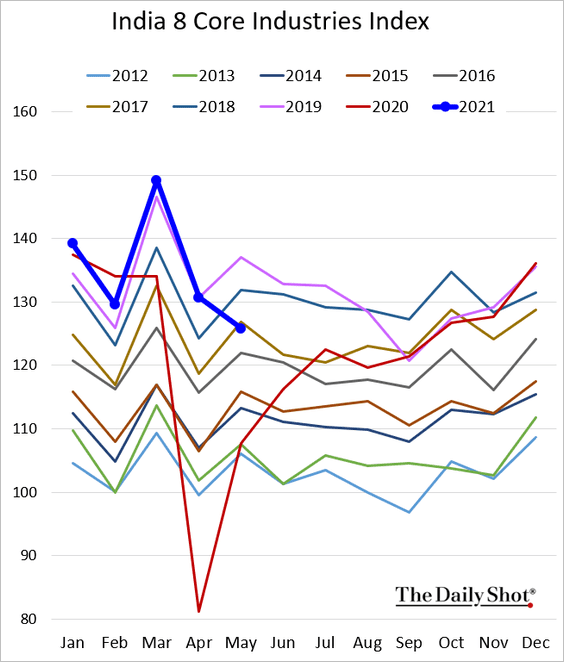
The core industries’ output tumbled in May.
——————–
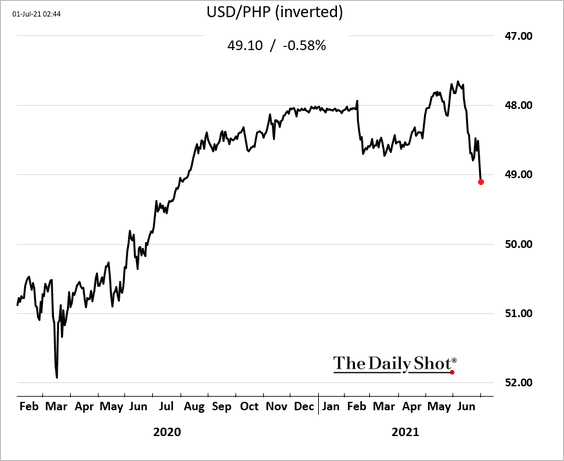
3. The Philippine peso is under pressure.
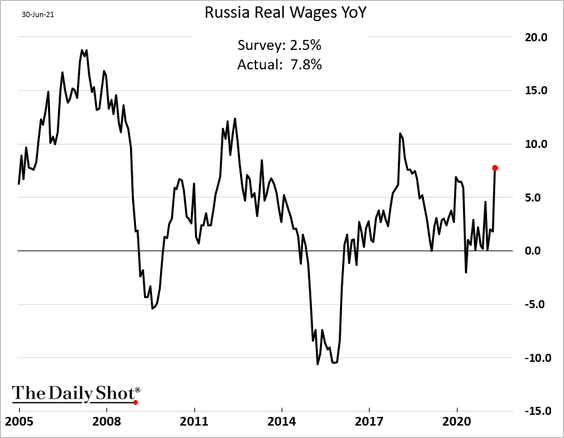
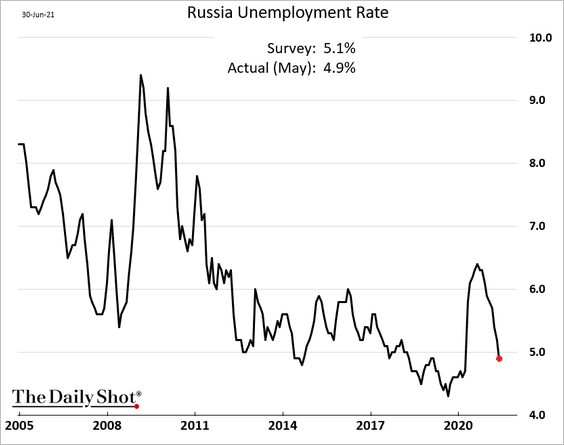
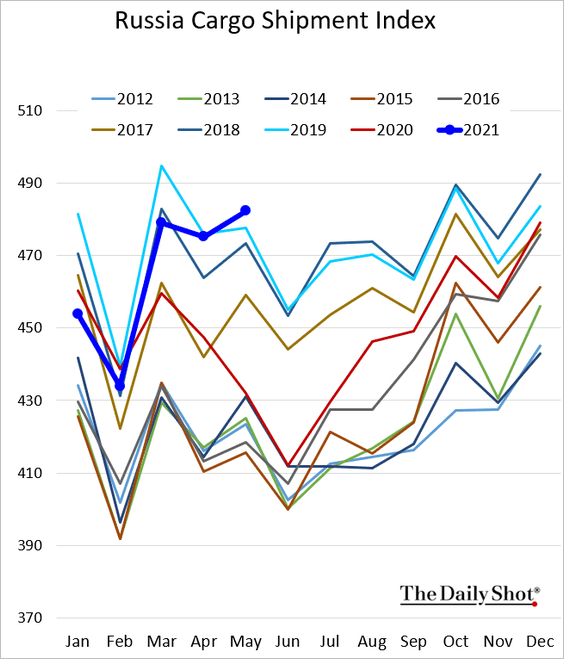
4. Russia’s economy is rebounding.
• Wages:
• Unemployment:
• Cargo shipments:
——————–
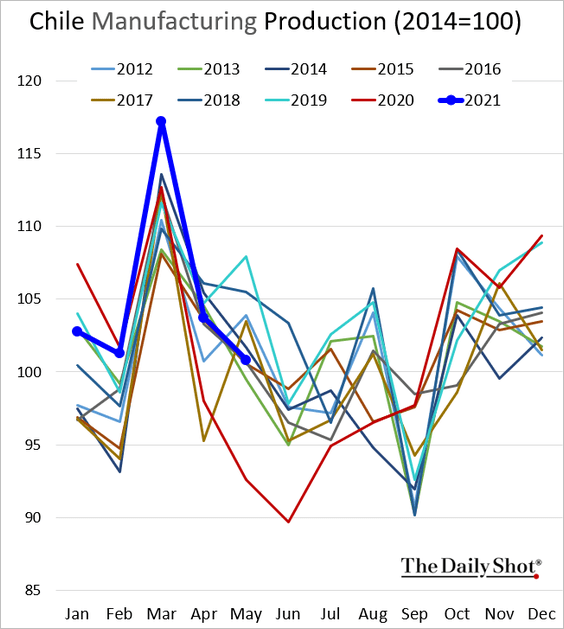
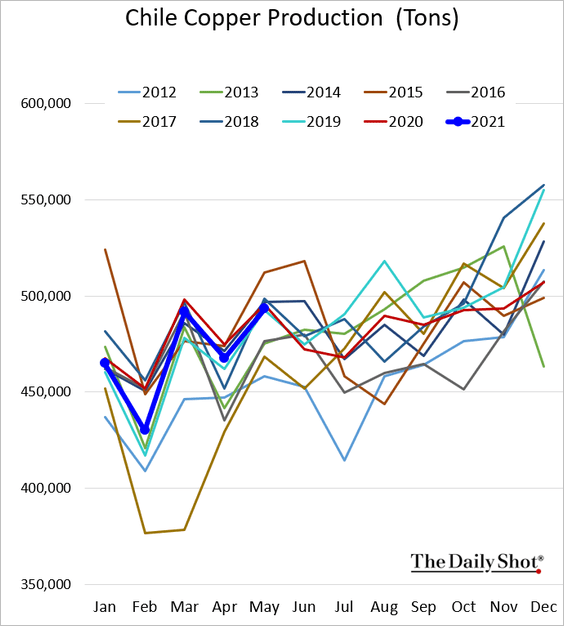
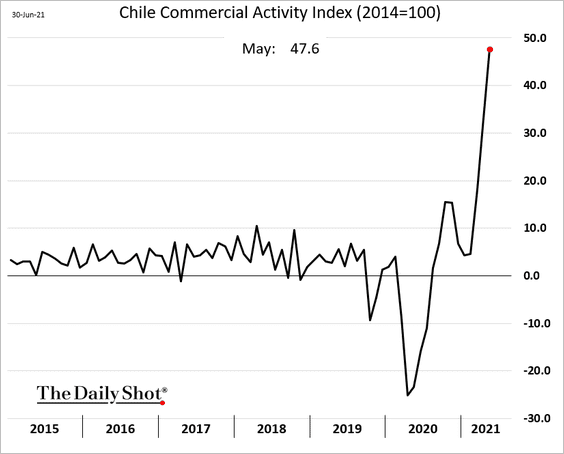
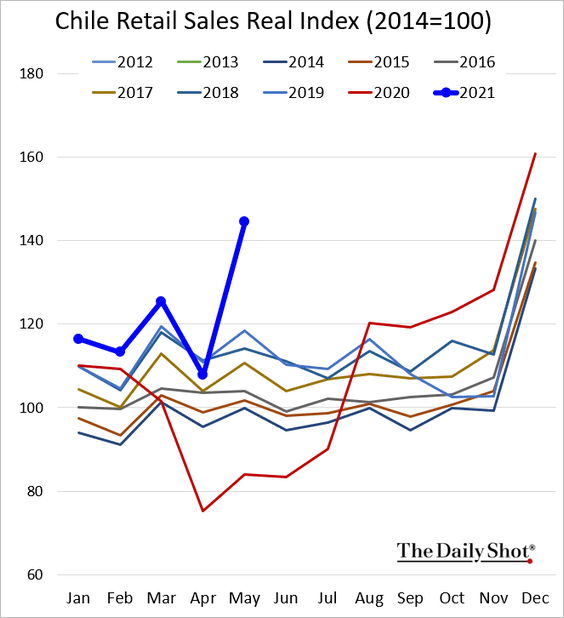
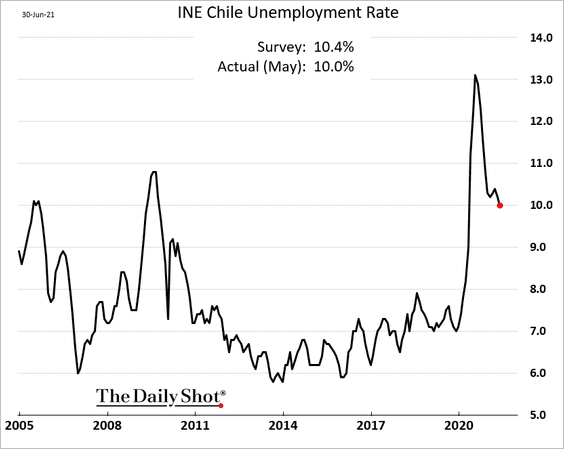
5. Finally, we have some updates on Chile.
• May manufacturing production (well below pre-COVID levels):
• Copper output (similar to last year’s level):
• Business activity (surging):
• Retail sales (surging):
• The unemployment rate:
Back to Index
Cryptocurrency
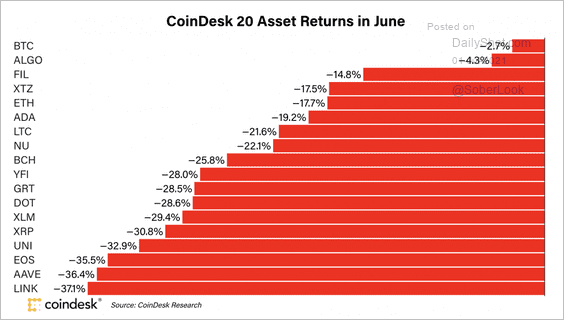
1. Despite a negative month, Bitcoin outperformed other large market-cap cryptocurrencies in June.
 Source: CoinDesk Read full article
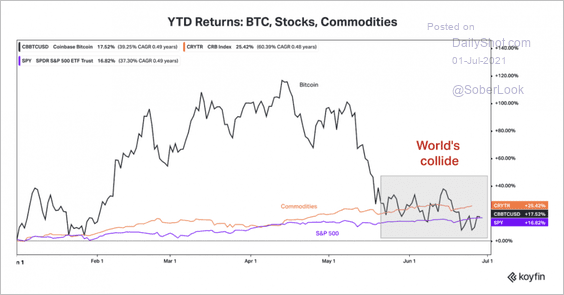
2. Bitcoin’s year-to-date return is beating the S&P 500 but trailing the Thomson Reuters Core Commodity Index.
 Source: Koyfin
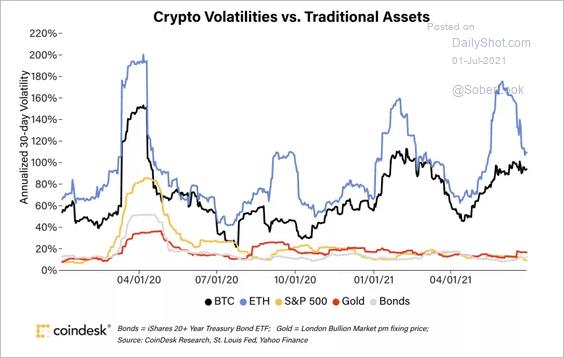
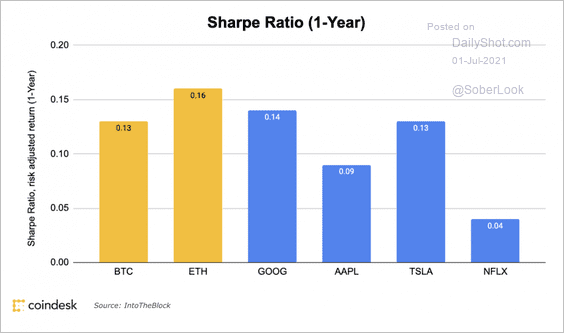
3. While Bitcoin and Ethereum experienced extreme volatile swings over the past month, traditional markets have remained relatively calm.
 Source: CoinDesk Read full article
But over the past year, Bitcoin’s and Ethereum’s risk-adjusted performance was similar to popular US stocks.
 Source: CoinDesk Read full article
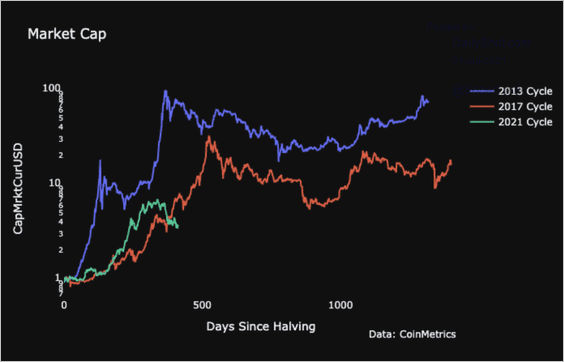
4. The current Bitcoin bull cycle has decoupled from the 2013 and 2017 cycles.
 Source: Coin Metrics
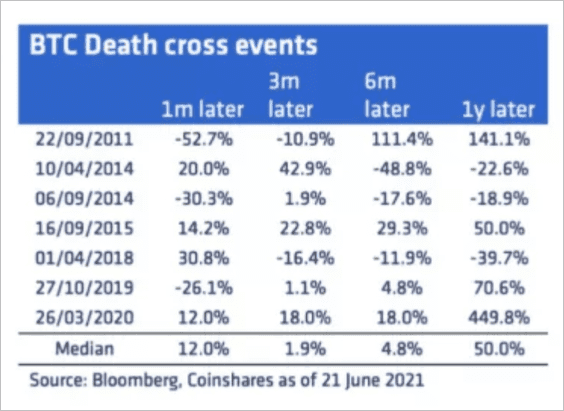
5. Bitcoin returns following a “death cross” event can vary and tend to be low to negative.
 Source: @CoinSharesCo
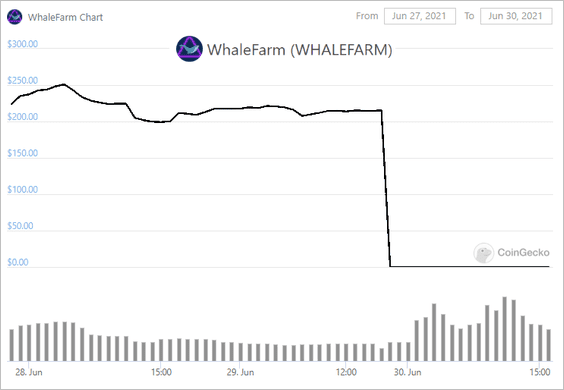
6. We continue to see shocks in the DeFi world.
 Source: Bloomberg Read full article
Back to Index
Commodities
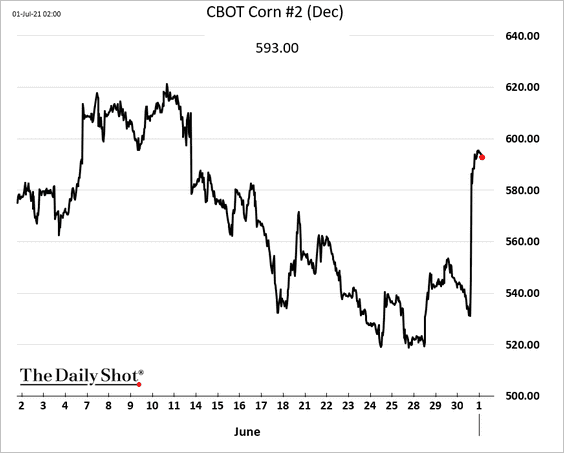
1. Corn futures hit limit-up after US plantings data fell short of market expectations.
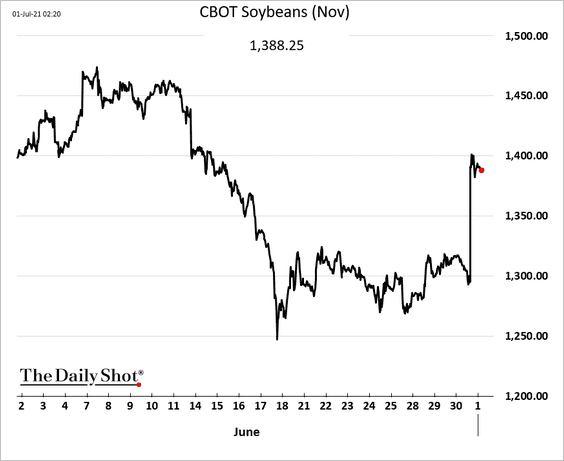
Soybeans surged as well.
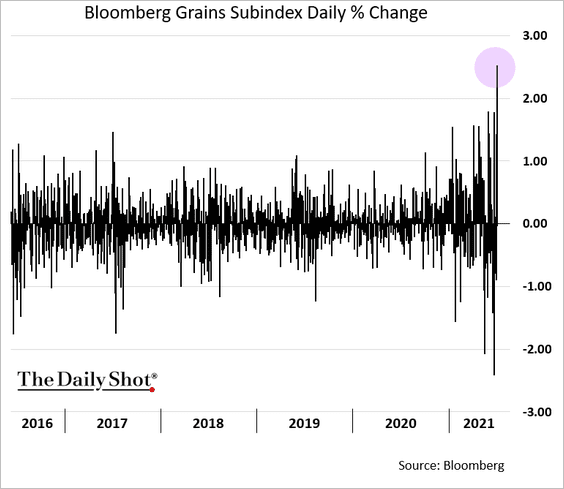
Bloomberg’s grains index hasn’t had a day like this in years.
——————–
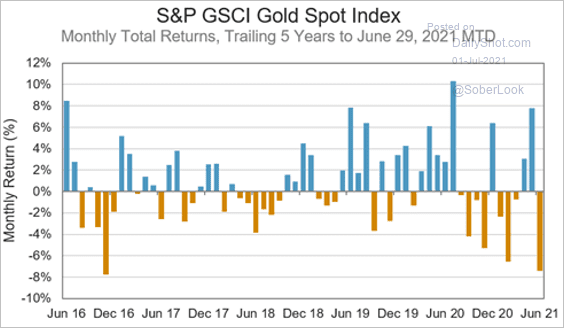
2. June was a tough month for gold due to the Fed’s hawkish shift.
 Source: S&P Global Market Intelligence
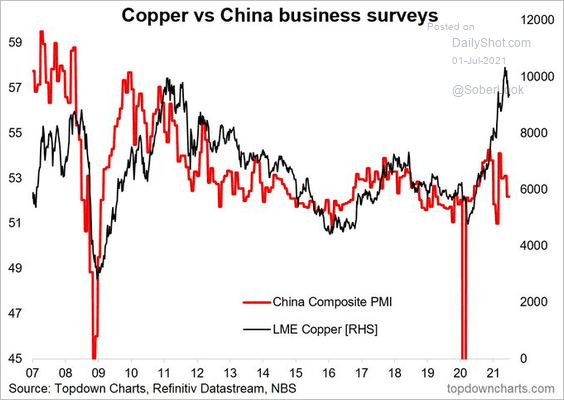
3. China’s soft PMI readings don’t bode well for copper.
 Source: @topdowncharts
Back to Index
Energy
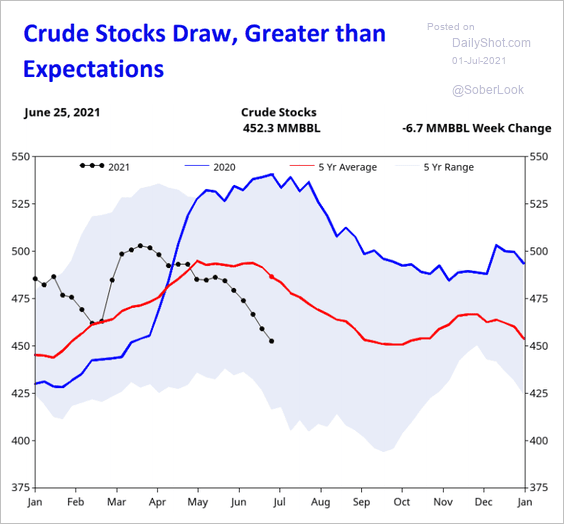
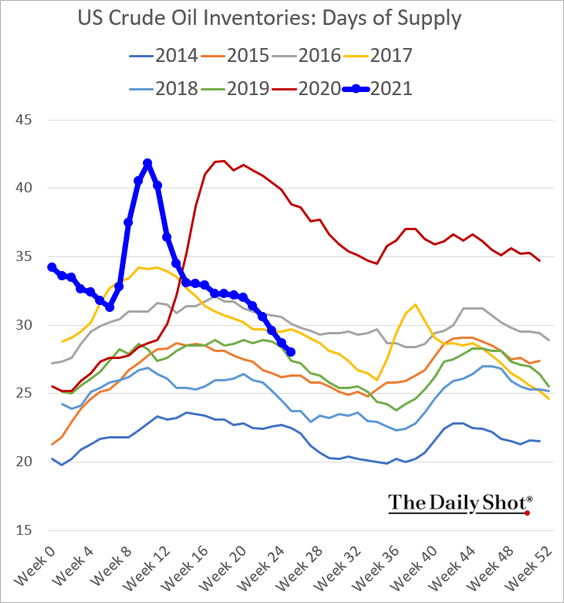
1. US crude oil inventories continue to shrink.
 Source: Fundamental Analytics
——————–
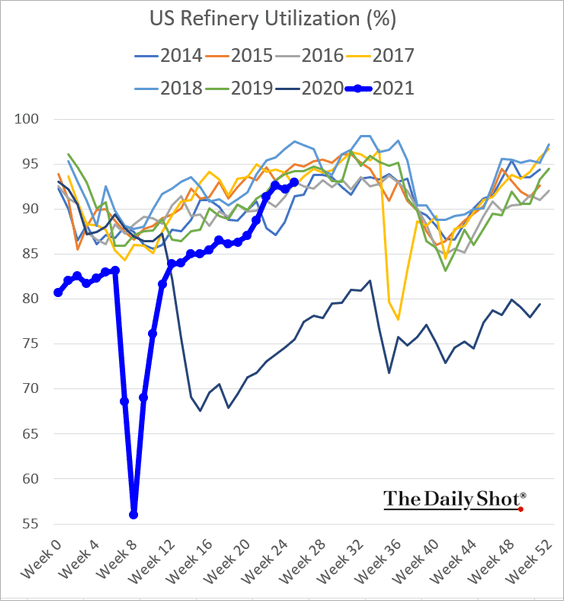
2. Refinery utilization is trending higher.
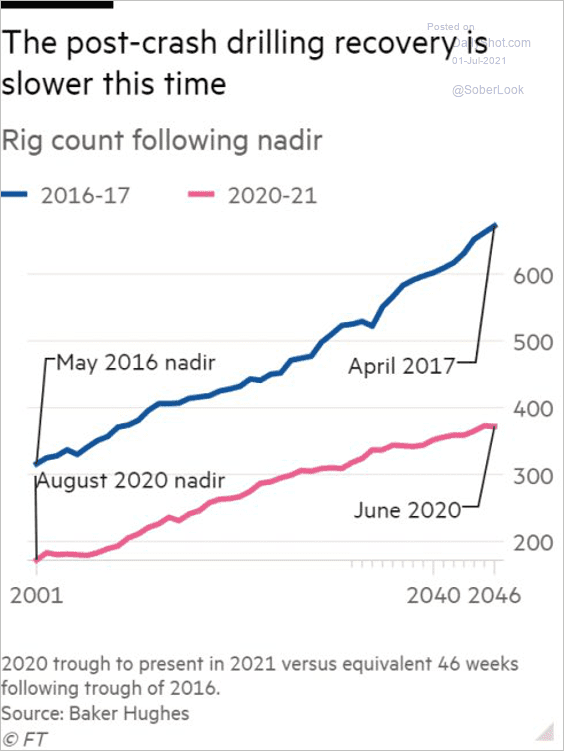
3. US drilling recovery has been slower than in 2016/17.
 Source: @DiMartinoBooth, @jessefelder Read full article
4. Natural gas futures continue to surge.
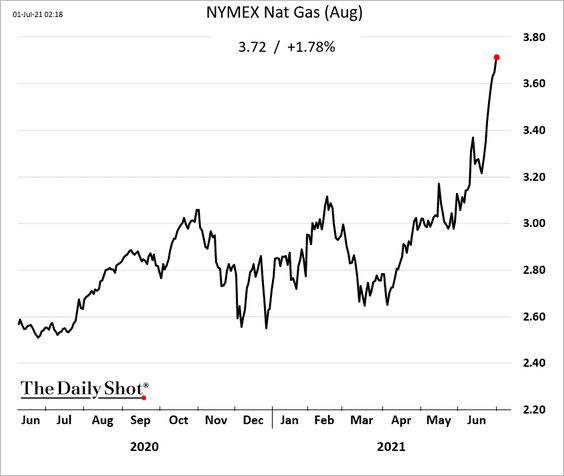
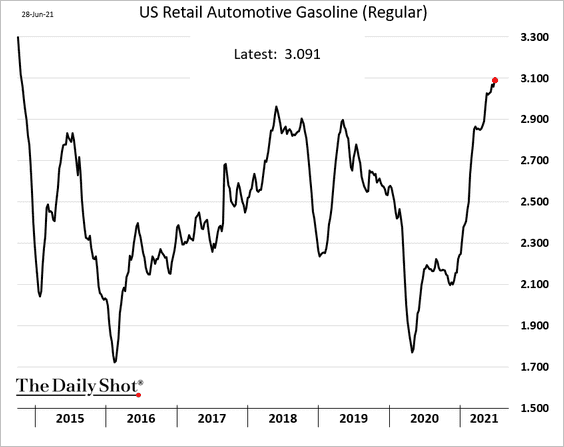
5. US retail gasoline prices hit the highest level since 2014 ahead of the July 4th holiday.
Back to Index
Equities
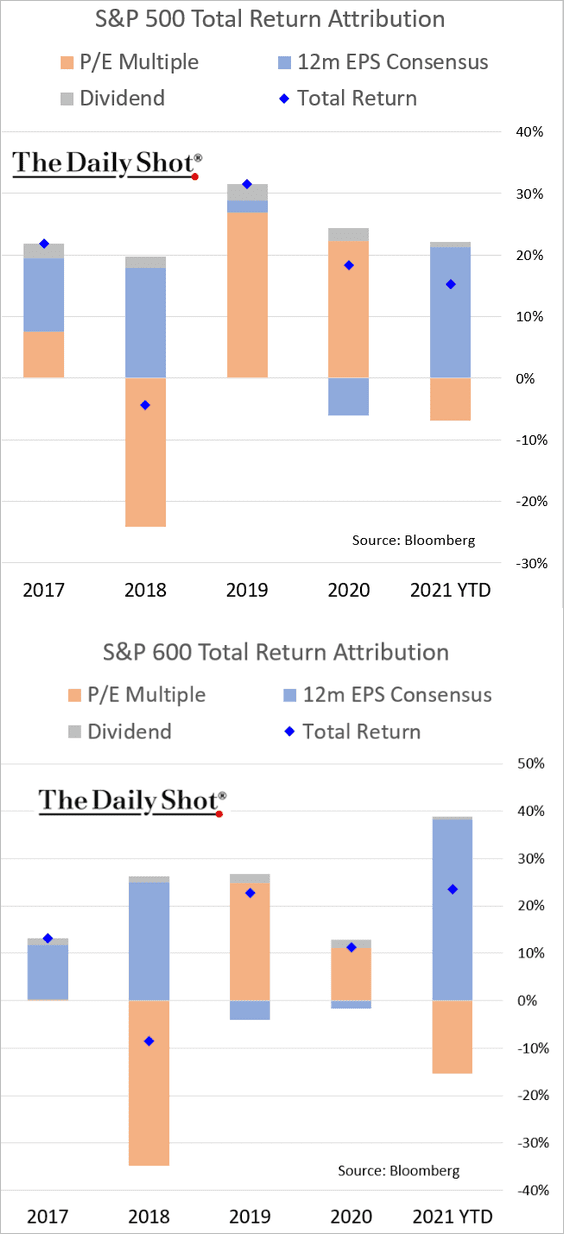
1. Earnings expectations continue to drive stock gains this year.
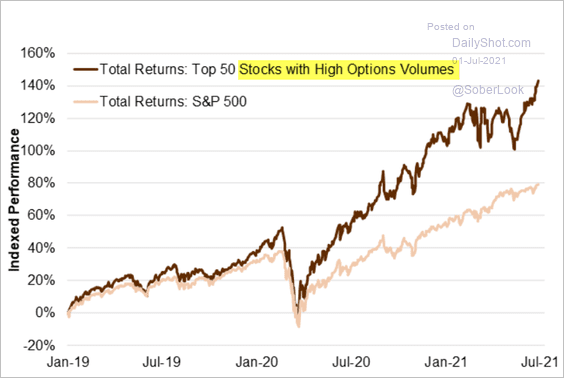
2. Stocks with high options volume keep outperforming.
 Source: Goldman Sachs, @themarketear
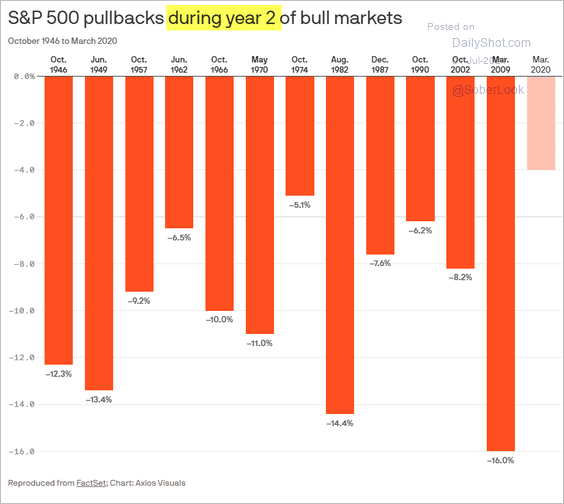
3. Pullbacks during the second year of bull markets can be severe.
 Source: @axios Read full article
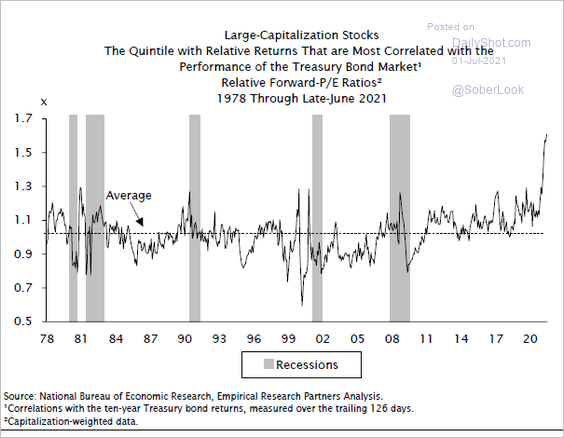
4. Stocks most correlated with Treasuries are the most expensive.
 Source: @RBAdvisors
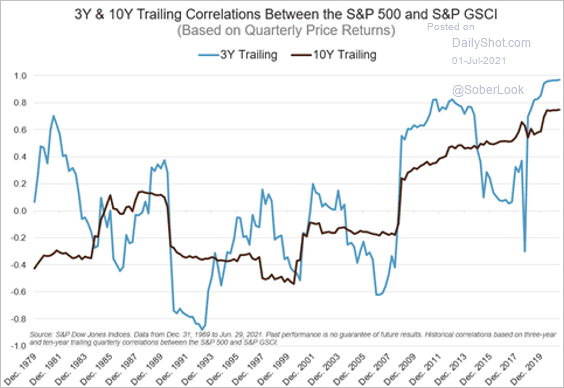
5. Here is the correlation between commodities and stocks.
 Source: S&P Global Market Intelligence
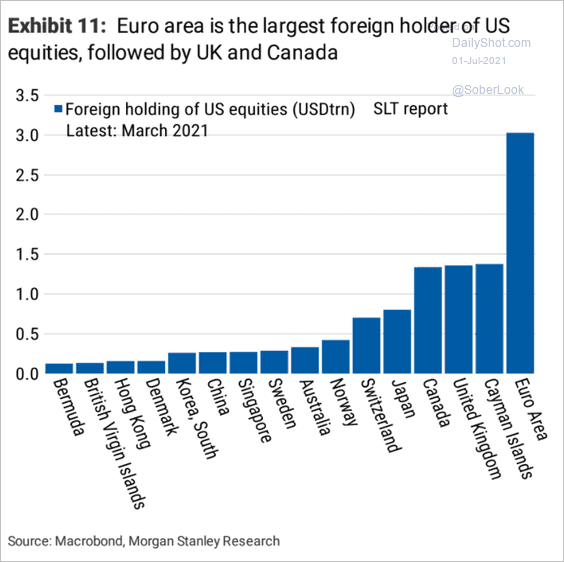
6. The Eurozone is the largest foreign holder of US stocks.
 Source: Morgan Stanley Research
Back to Index
Credit
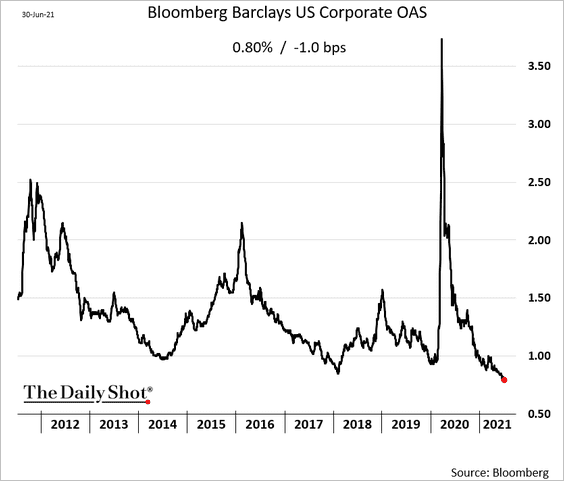
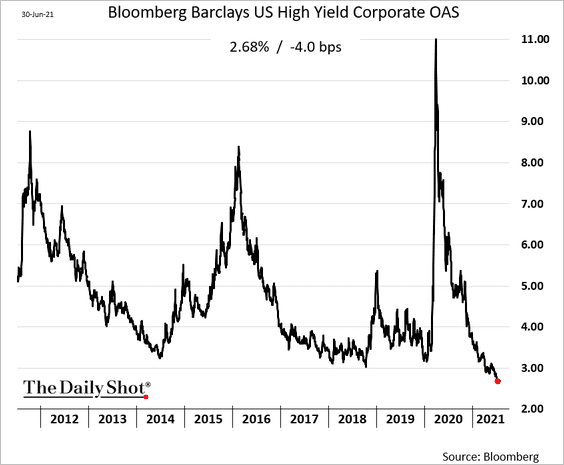
1. US credit spreads keep hitting new lows.
• Investment-grade:
• High-yield:
——————–
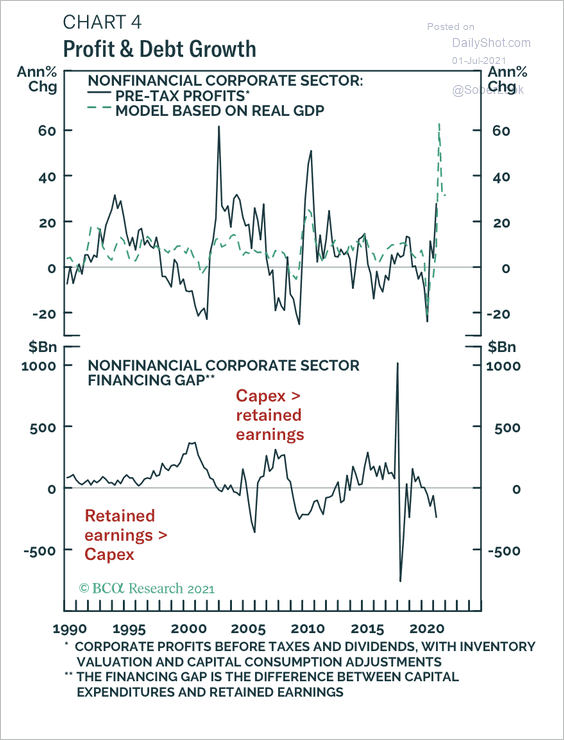
2. The nonfinancial corporate sector financing gap has been negative in each of the past four quarters. This means that retained earnings have exceeded capital expenditures. And as a result, BCA Research expects corporate debt growth to slow going forward as firms have built up excess capital that can be deployed in place of debt.
 Source: BCA Research
Back to Index
Rates
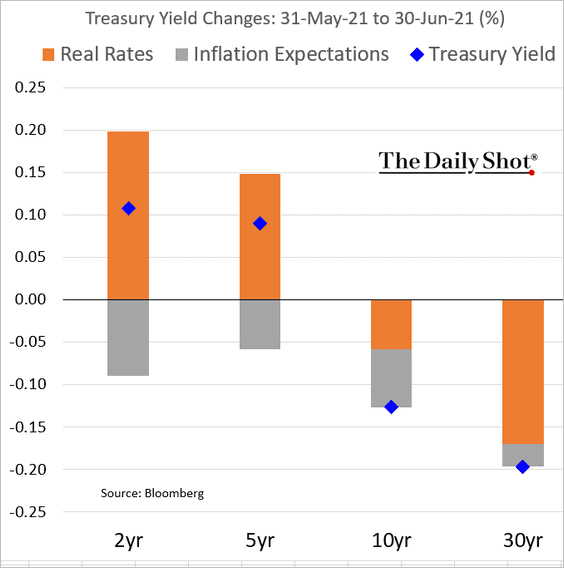
1. Here is the attribution of Treasury yield changes in June.
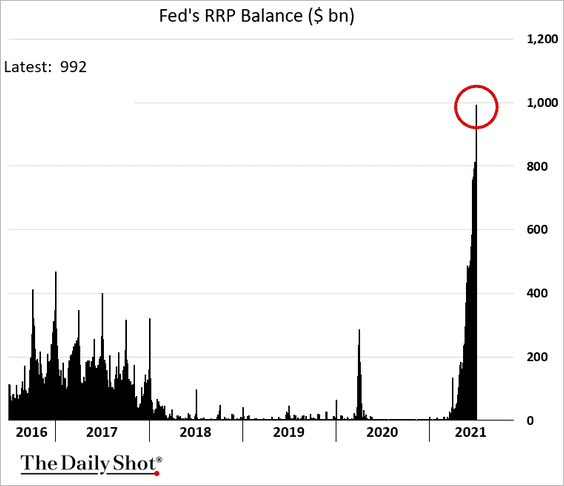
2. The Fed’s RRP is approaching $1 trillion, allowing the central bank to drain some liquidity.
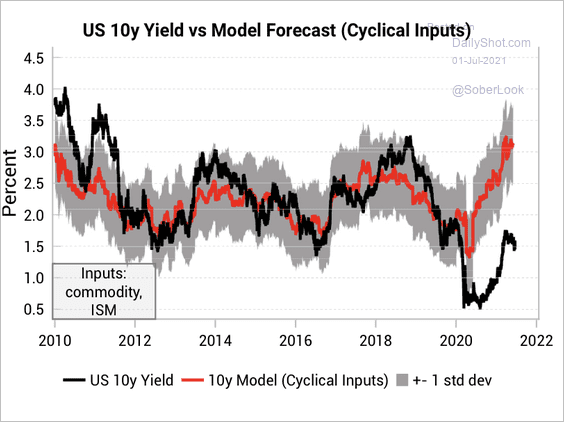
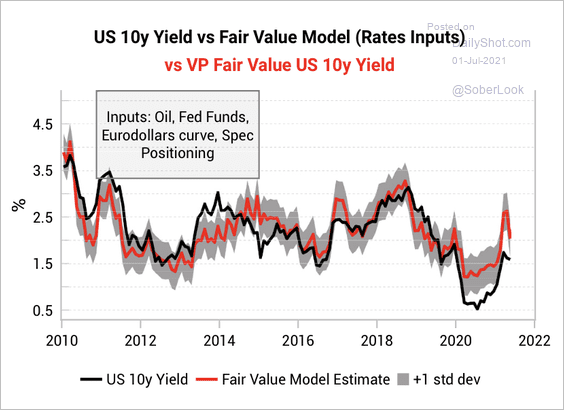
3. The 10-year Treasury yield is much lower than forecasts based on cyclical inputs such as ISM and commodity prices, according to Variant Perception (2 charts).
 Source: Variant Perception
 Source: Variant Perception
——————–
4. Fed officials are becoming uneasy with the recent surge in home prices.
 Source: @WSJ Read full article
Back to Index
Global Developments
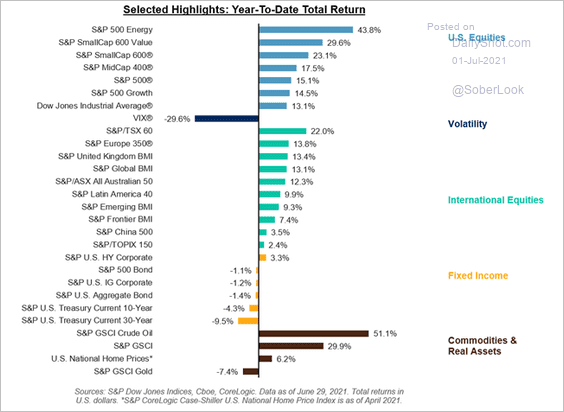
1. Below are the year-to-date returns across various asset classes.
 Source: S&P Global Market Intelligence
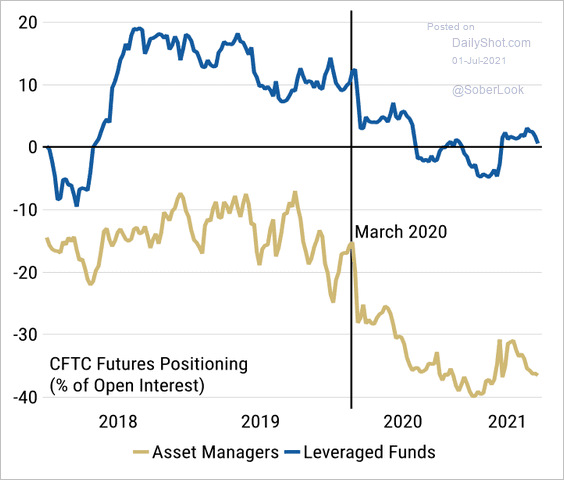
2. Asset managers remain net-short the dollar despite the recent rebound.
 Source: Morgan Stanley Research
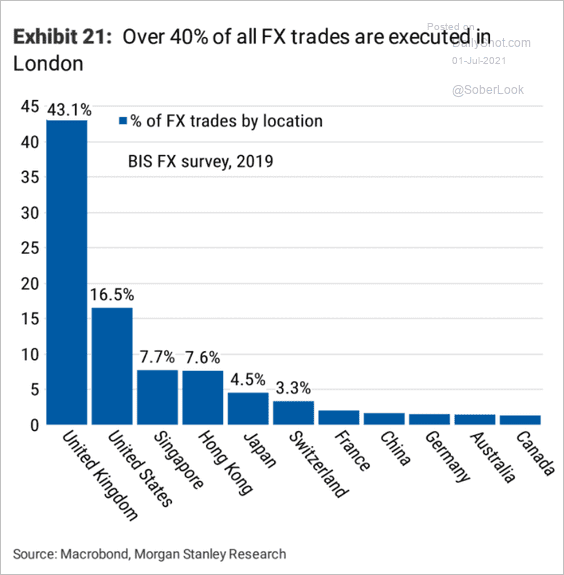
3. London is still the center of F/X trading.
 Source: Morgan Stanley Research
——————–
Food for Thought
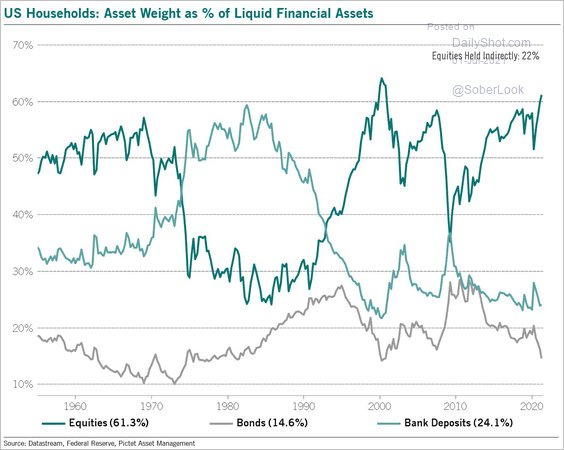
1. US households’ liquid assets:
 Source: @BittelJulien
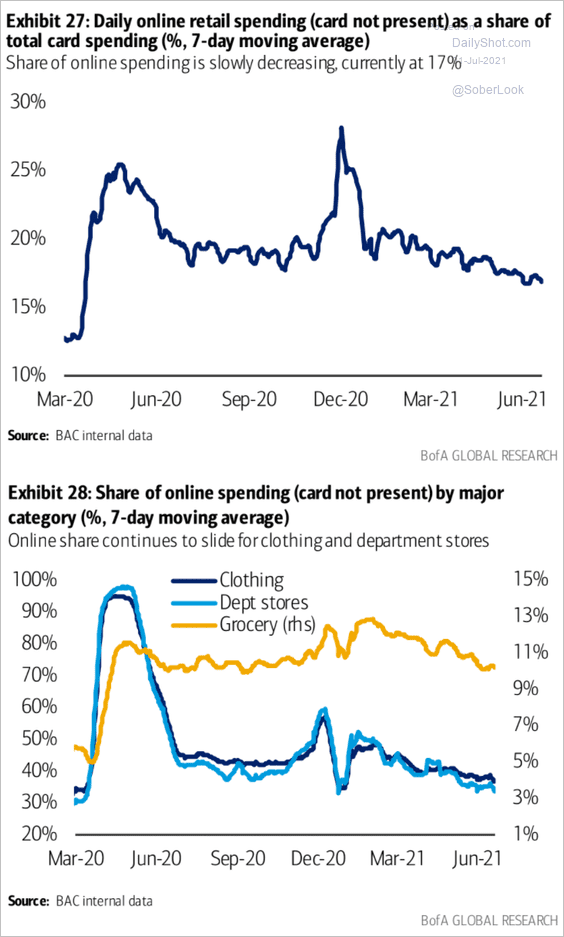
2. Credit/debit card spending online:
 Source: BofA Global Research
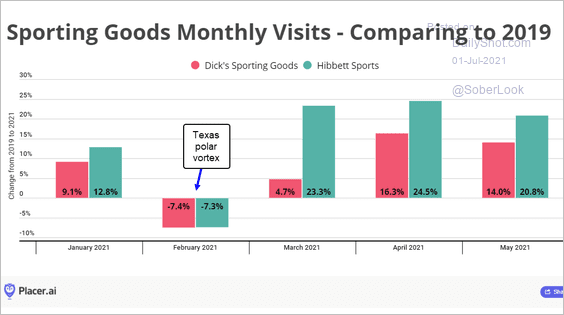
3. Sporting goods stores monthly visits:
 Source: Placer.ai Read full article
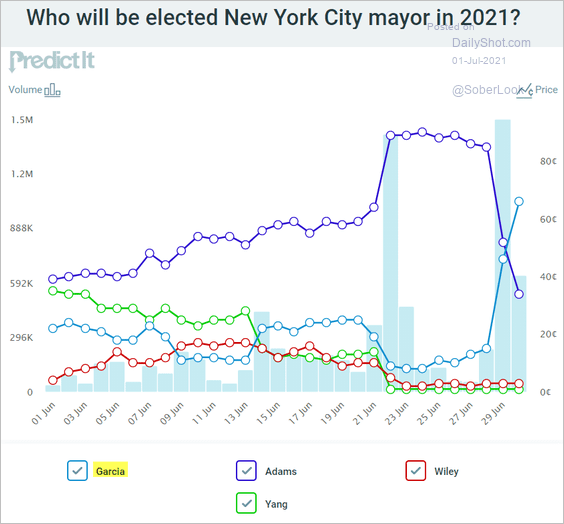
4. New York City mayoral election odds in the betting markets:
 Source: @PredictIt
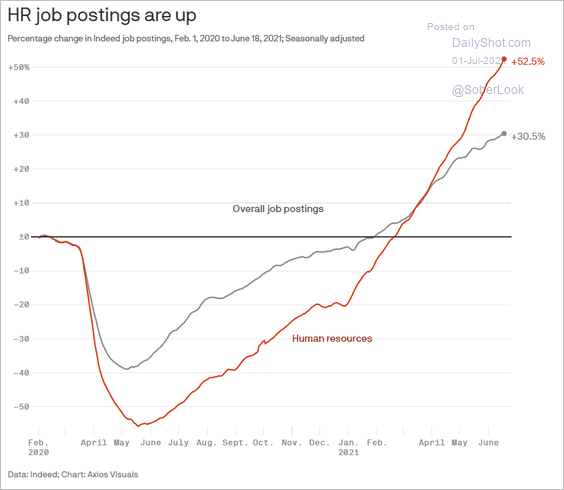
5. Demand for HR staff:
 Source: @axios
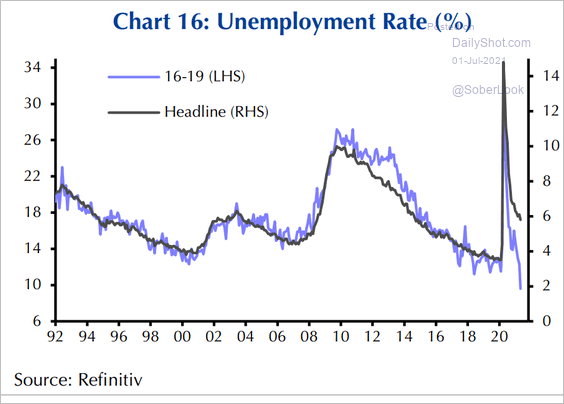
6. US teen unemployment:
 Source: Capital Economics
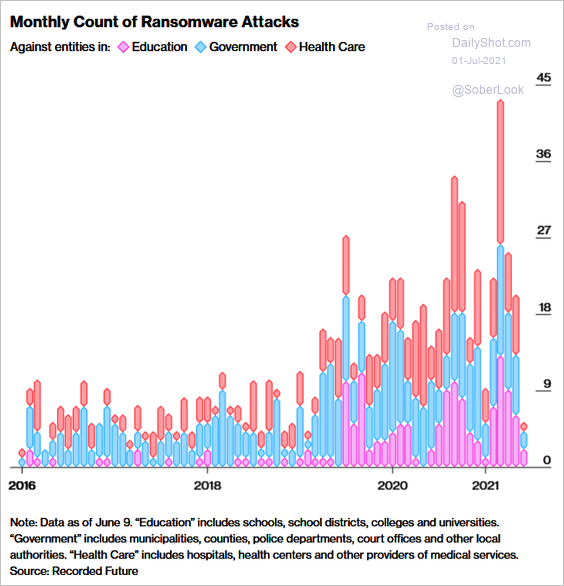
7. Ransomware attacks:
 Source: @bbgvisualdata Read full article
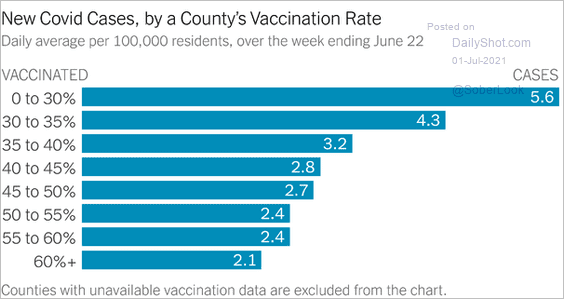
8. New COVID cases vs. vaccination rates:
 Source: @DLeonhardt
9. US seaborne imports of fireworks:
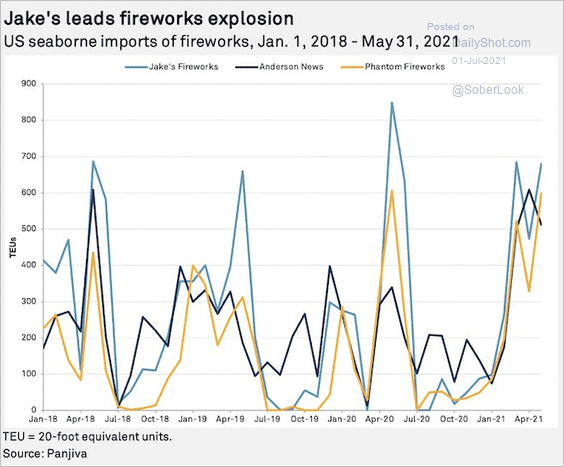 Source: S&P Global Market Intelligence
• Celebrating Independence Day:
 Source: Statista
——————–
Have a great weekend!
Back to Index
