
The Daily Shot: 05-Jul-21
• The United States
• Canada
• The Eurozone
• Aisa – Pacific
• China
• Emerging Markets
• Cryptocurrency
• Commodities
• Energy
• Equities
• Credit
• Rates
• Food for Thought
The United States
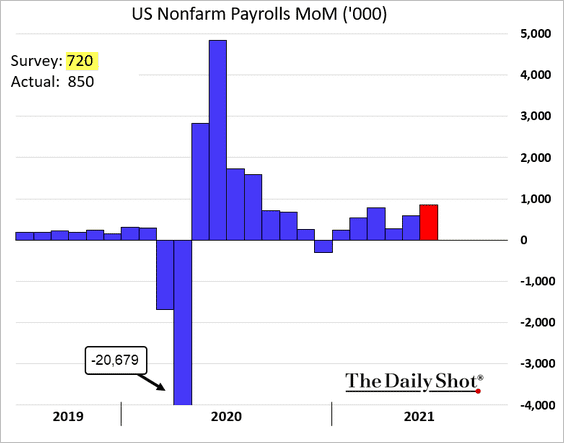
1. The June jobs report showed continuing recovery in the labor market, but it wasn’t strong enough to quicken the Fed’s plans for reducing monetary accommodation.
• The headline figure exceeded forecasts.
Here are the sector contributions to job gains since September.
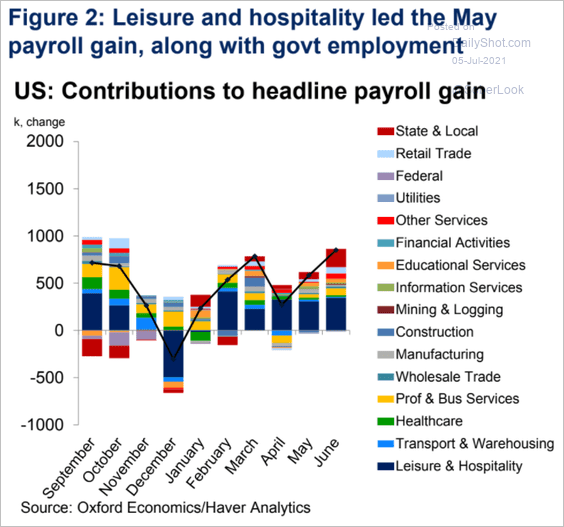 Source: Oxford Economics
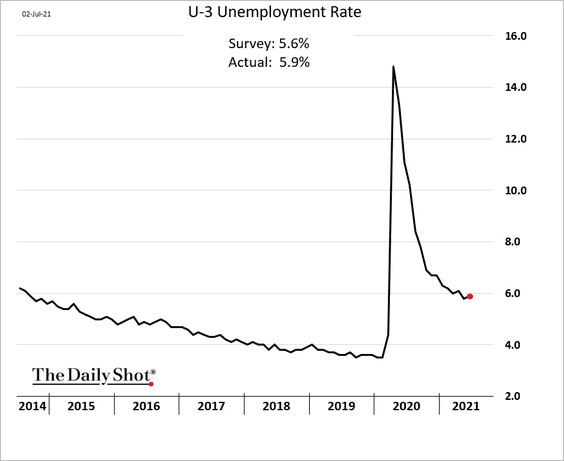
• The unemployment rate unexpectedly increased.
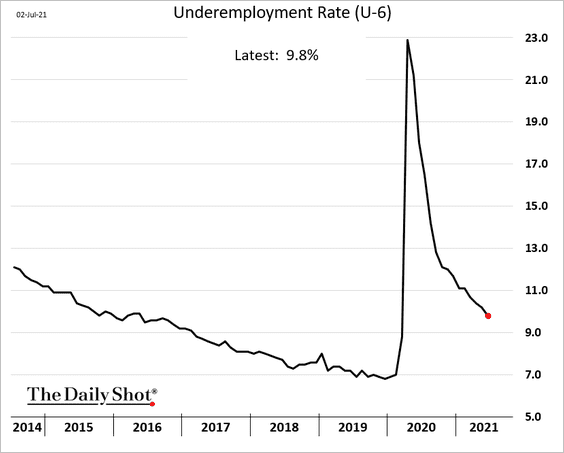
But underemploymnet (U-6) continues to move lower.
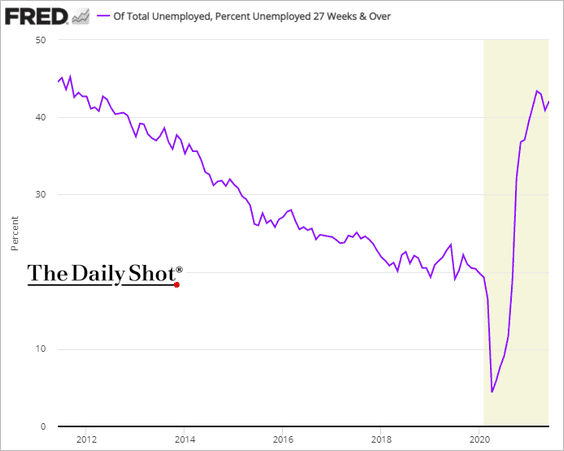
• Long-term unemployment remains elevated:
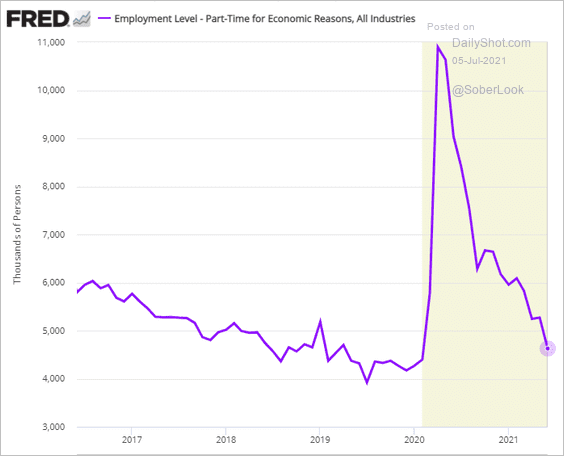
• Part-time work for “economic” reasons is almost back to pre-COVID levels.
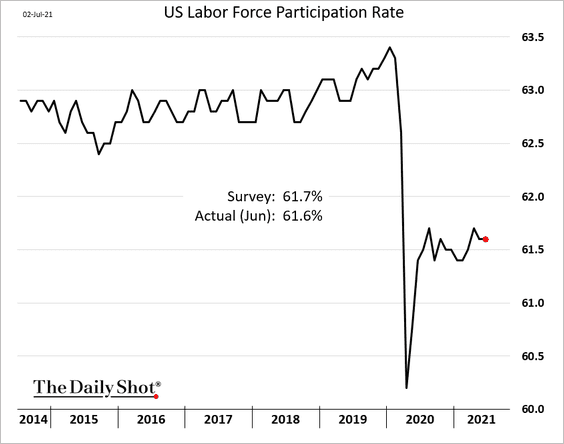
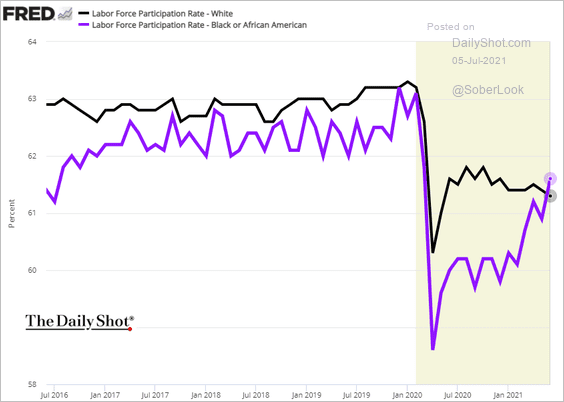
• Labor force participation has flatlined.
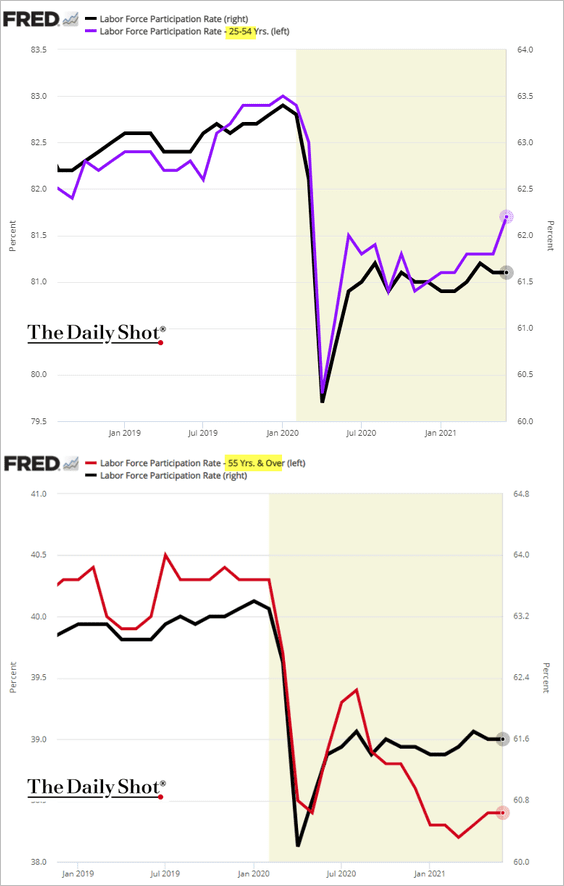
Prime-age participation is improving, but many older Americans are not getting back into the labor force.
Labor force participation among African Americans is rebounding rapidly and is now above that of white Americans.
 h/t Sophie Caronello
——————–
• Here are some additional updates on the jobs report.
– Total payrolls deficit vs. pre-COVID levels:
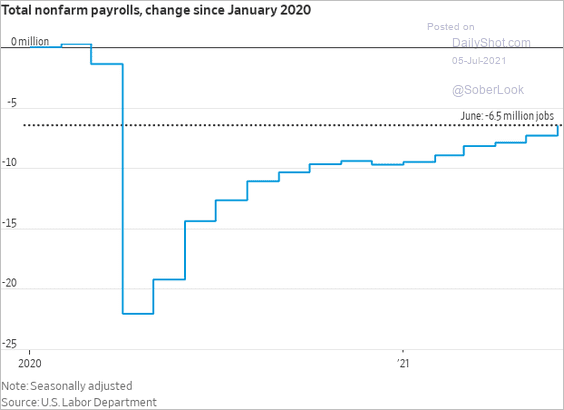 Source: @WSJ Read full article
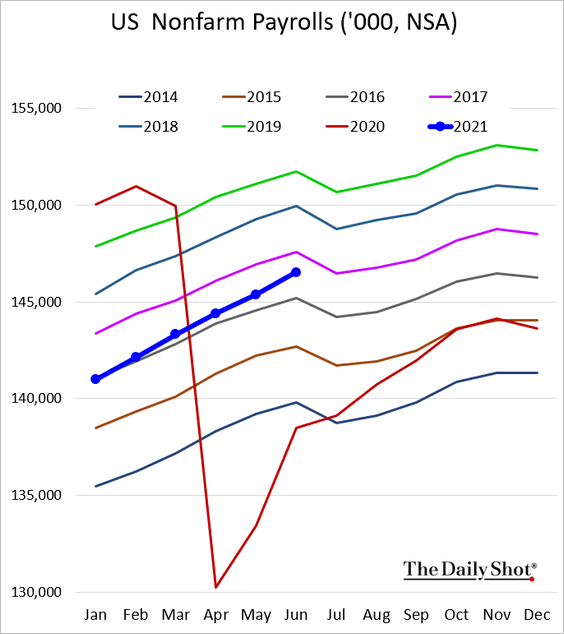
– Payrolls without seasonal adjustments (just below 2017 levels):
– Jobs recovery vs. the post-2008 trend:
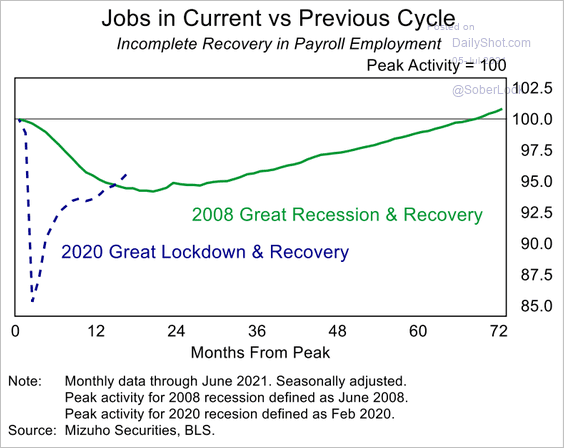 Source: Mizuho Securities USA
– Divergence between jobs and retail sales:
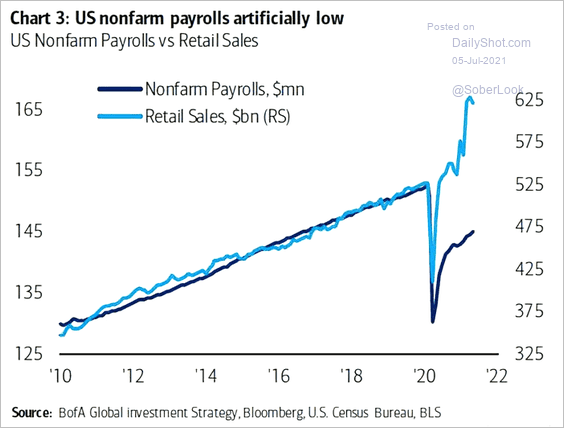 Source: @ISABELNET_SA, @BofAML
– Recovery by wage cohort:
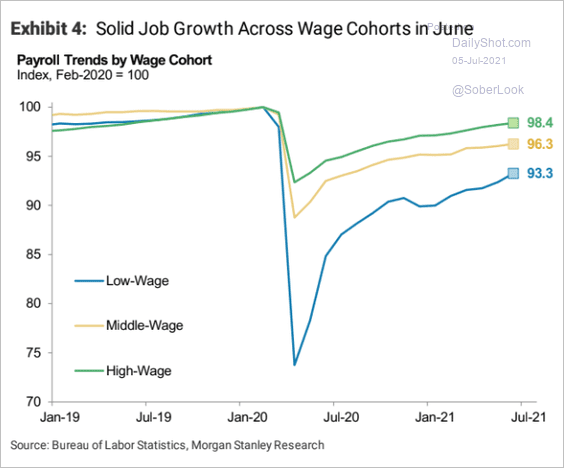 Source: Morgan Stanley Research
– Temp vs. permanent unemployment:
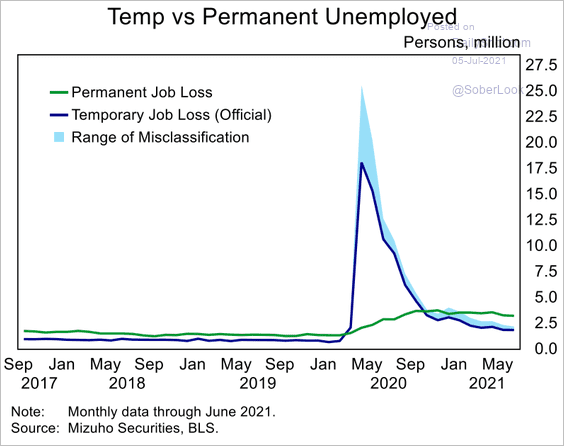 Source: Mizuho Securities USA
– Wage growth:
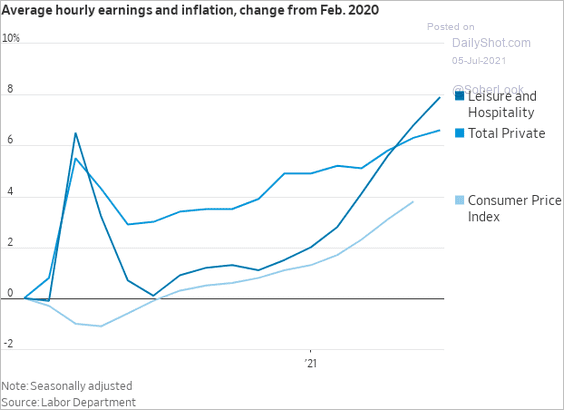 Source: @WSJ Read full article
– Best- and worst-performing sectors:
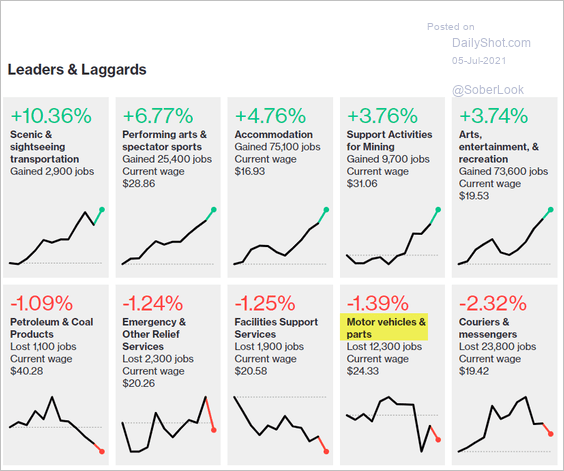 Source: @bbgvisualdata Read full article
– Employment metrics closely tracked by the Federal Reserve:
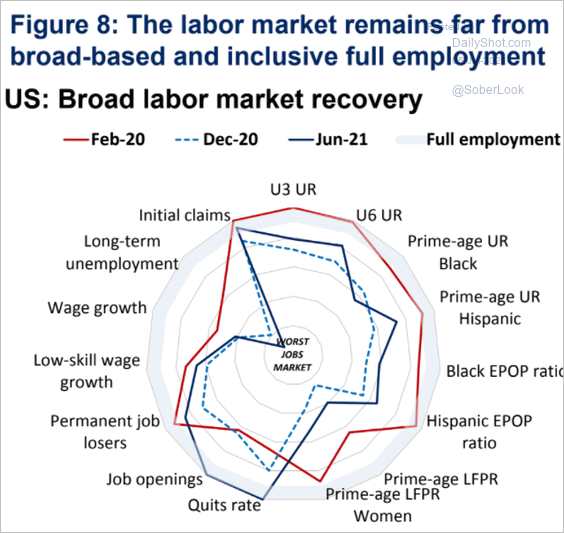 Source: Oxford Economics
——————–
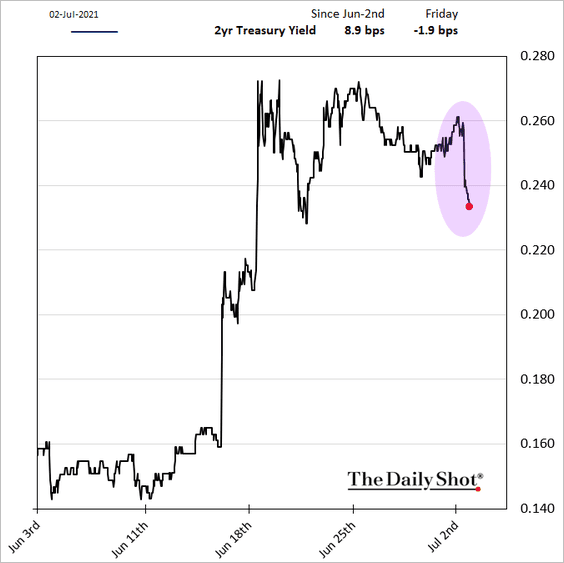
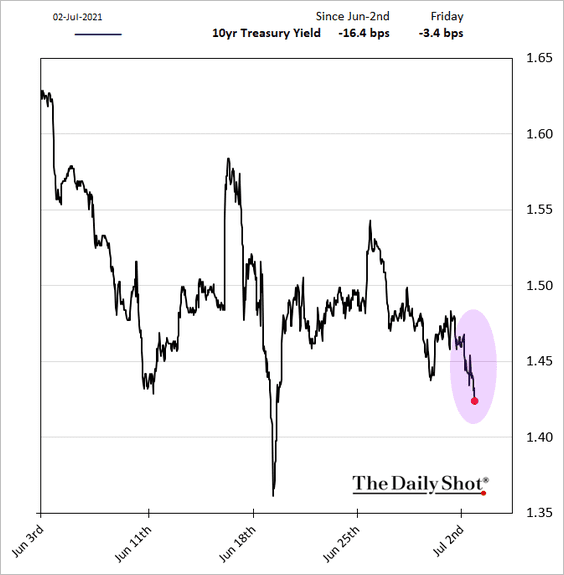
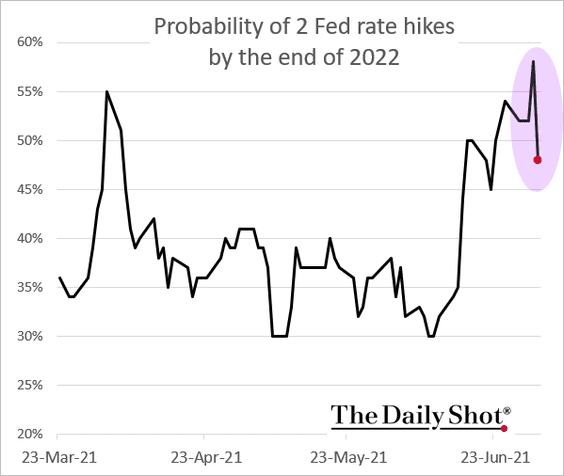
2. With the Fed unlikely to change direction based on this jobs report, the market sent Treasury yields lower.
The probability of two rate hikes in 2022 declined.
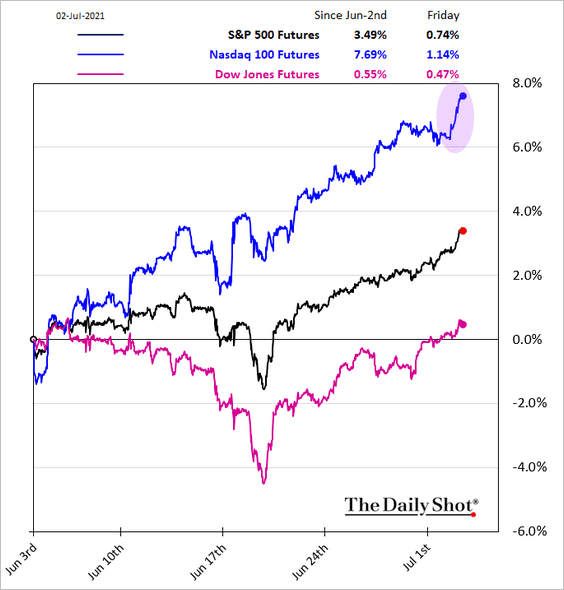
Stocks jumped, with Nasdaq 100 outperforming (tech stocks have been more correlated with bonds).
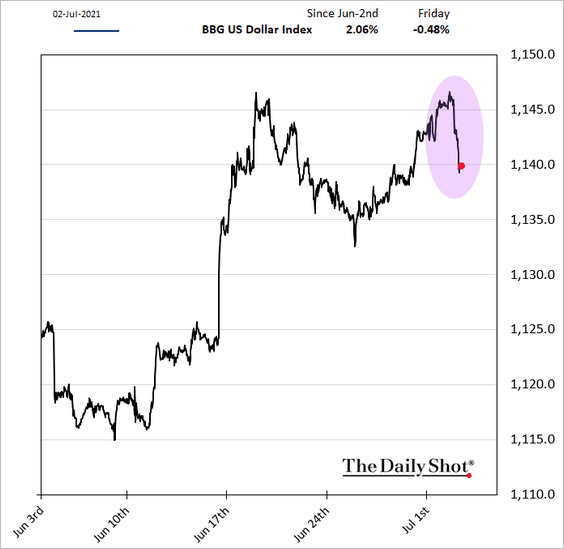
And the dollar weakened.
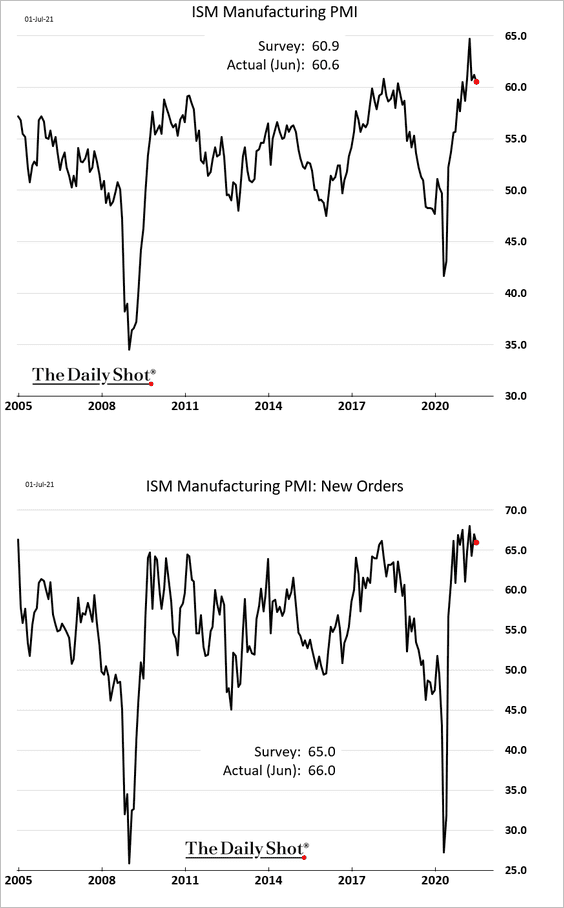
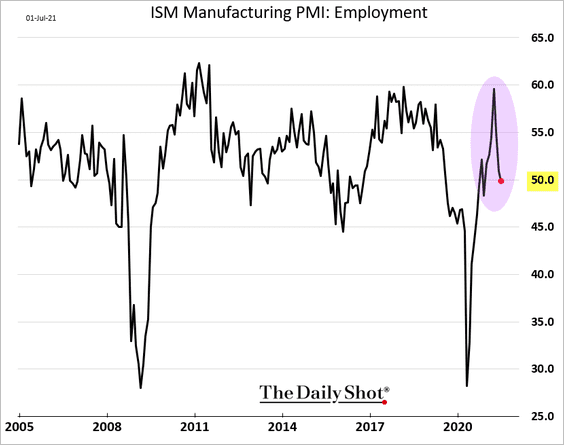
3. The June ISM Manufacturing PMI was roughly in line with consensus.
• The employment index dipped below 50 (which means contraction) amid widespread raw materials and labor shortages.
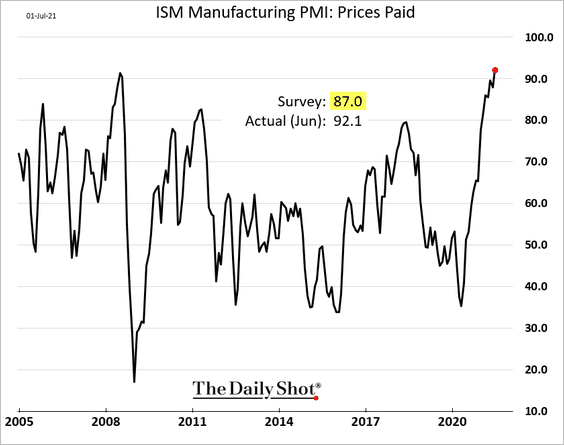
• The ISM index of input prices hit a record high.
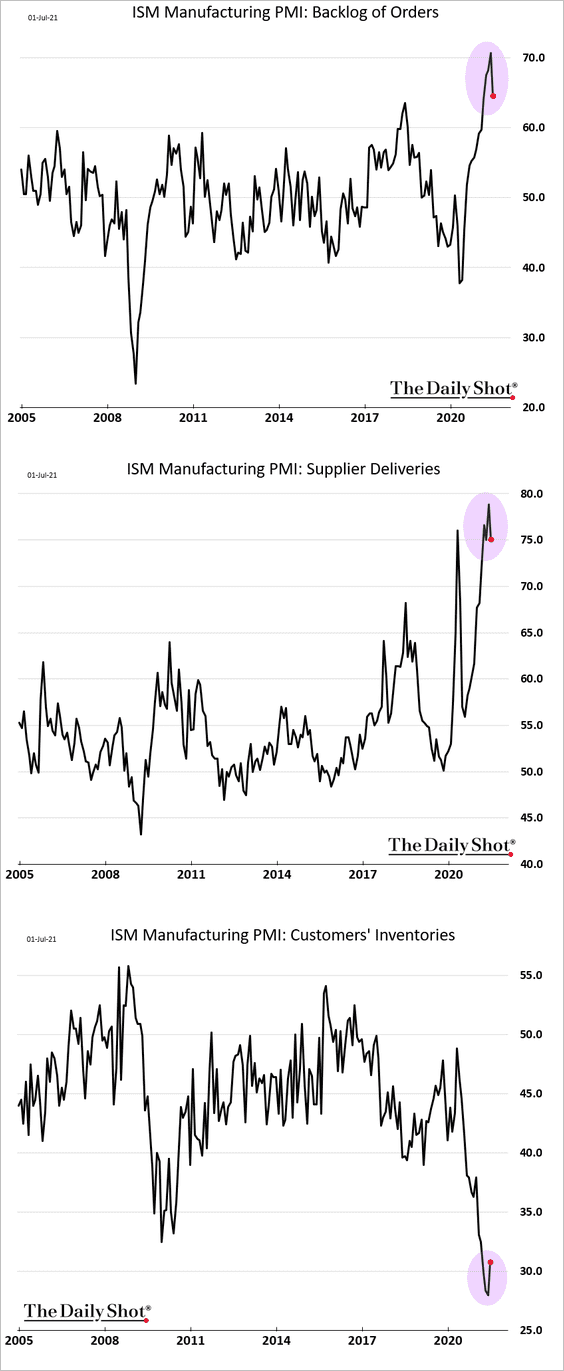
• Indicators of supply-chain bottlenecks remain extreme but appear to be leveling off. Below we have the backlog of orders, supplier delivery times, and customers’ inventories.
——————–
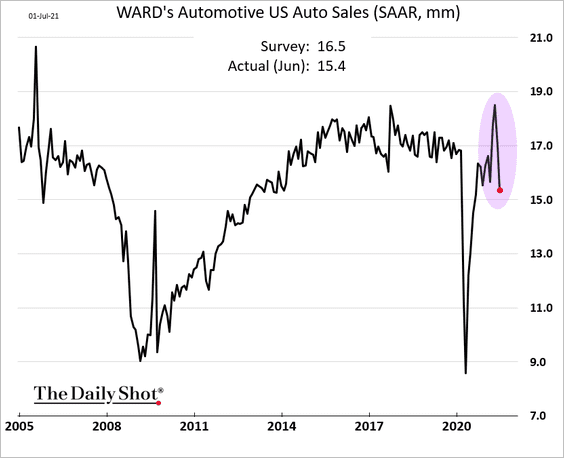
4. June automobile sales declined sharply due to tight inventories.
 Source: The Detroit Bureau Read full article
But it was a good quarter for auto sales.
 Source: Reuters Read full article
——————–
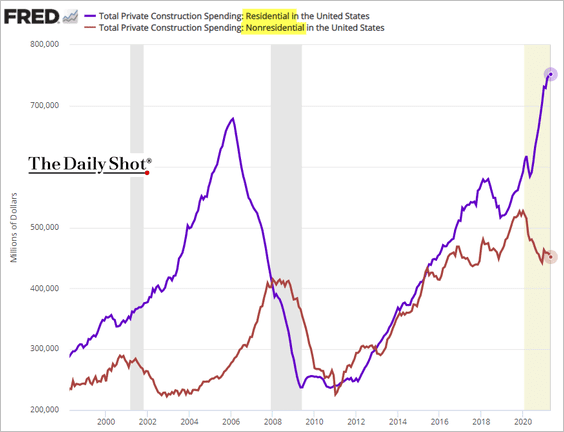
5. The divergence between residential and non-residential construction spending persists.
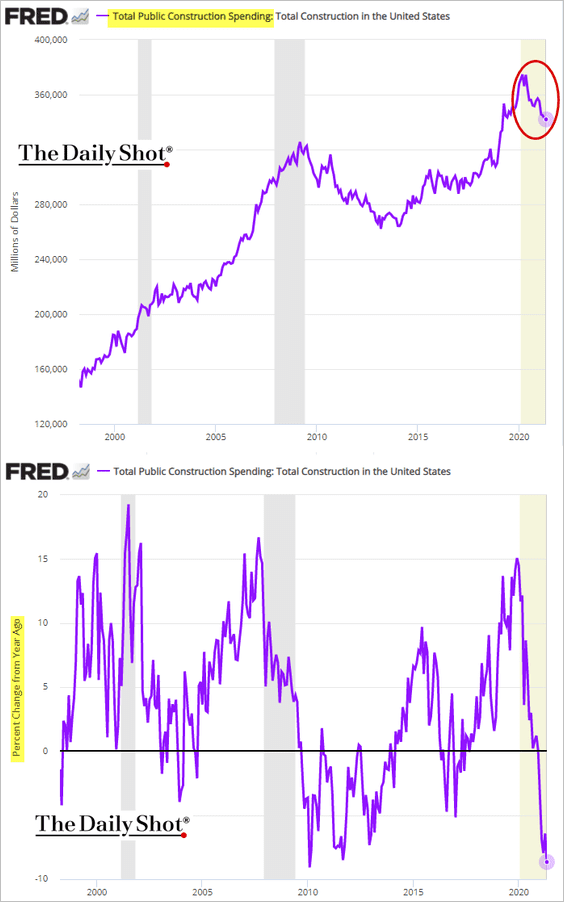
Public construction spending continues to deteriorate.
——————–
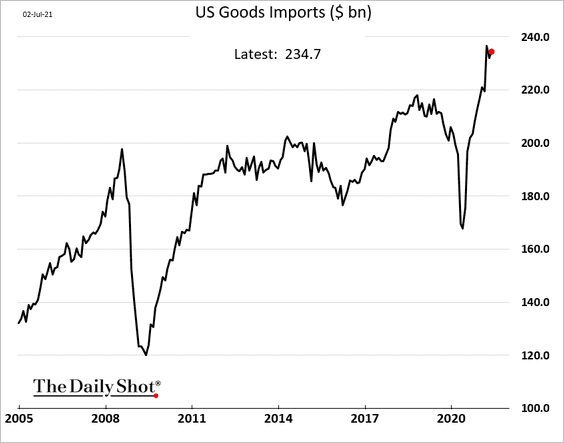
6. US goods imports remain near record highs.
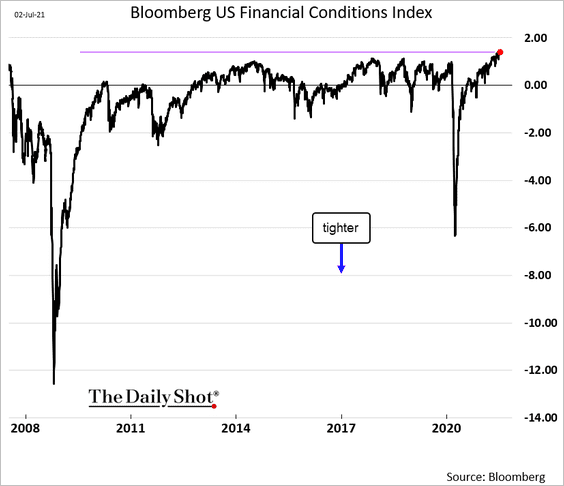
7. Financial conditions are the easiest in years, according to Bloomberg’s indicator.
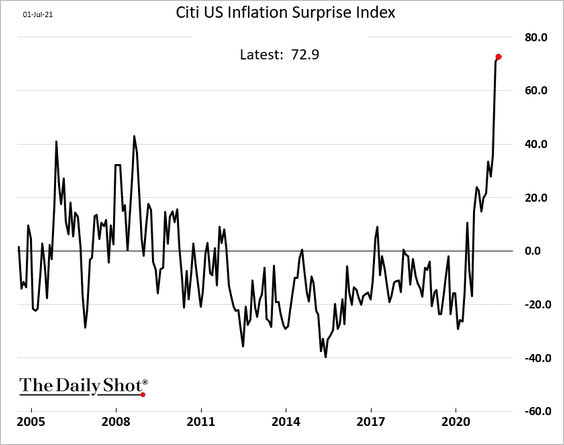
8. The Citi US inflation surprise index hit another record high.
Back to Index
Canada
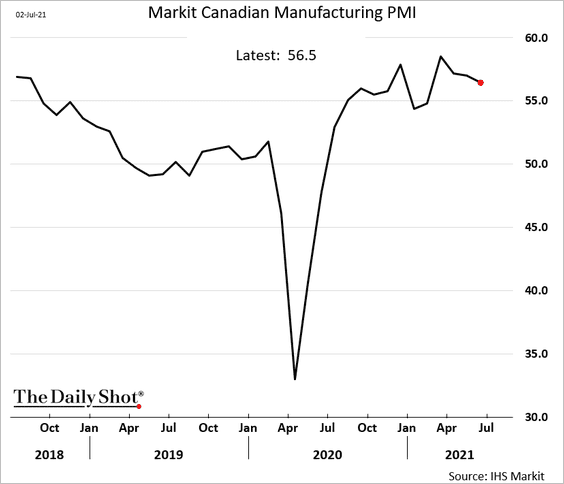
1. Factory activity remained robust last month, but growth is off the highs.
2. Building permits unexpectedly tumbled in May due to softer condo demand in Ontario.
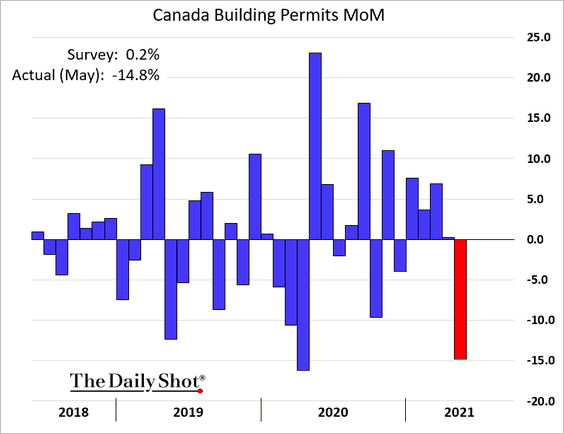
 Source: MarketWatch Read full article
Back to Index
The Eurozone
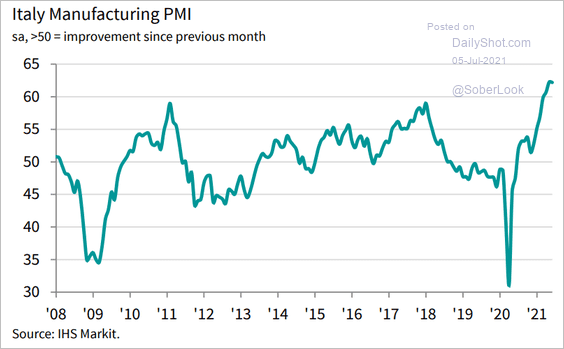
1. Factory activity accelerated in recent months. Here are some PMI trends.
• Italy:
 Source: IHS Markit
• Spain:
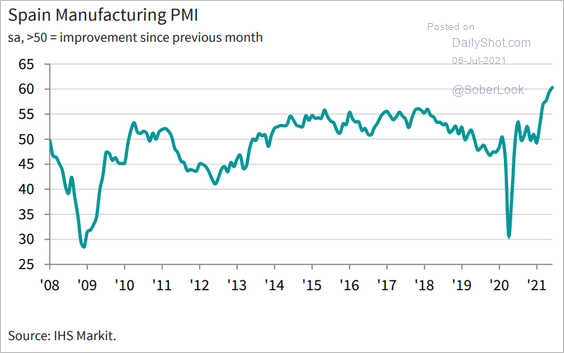 Source: IHS Markit
• Ireland:
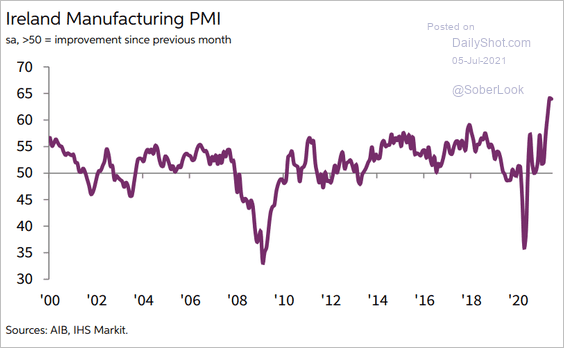 Source: IHS Markit
• Greece:
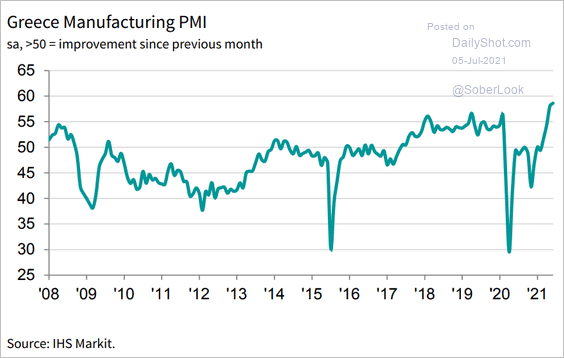 Source: IHS Markit
Here is the manufacturing PMI at the Eurozone level.
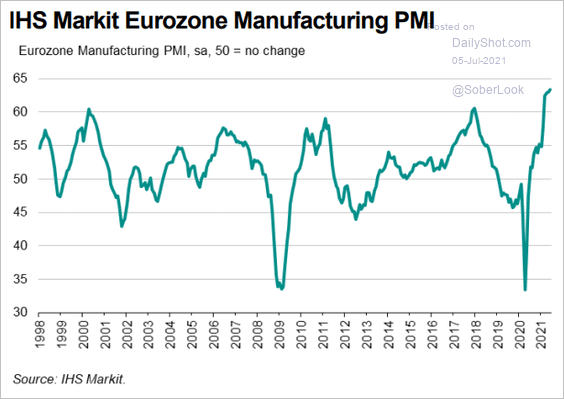 Source: IHS Markit
——————–
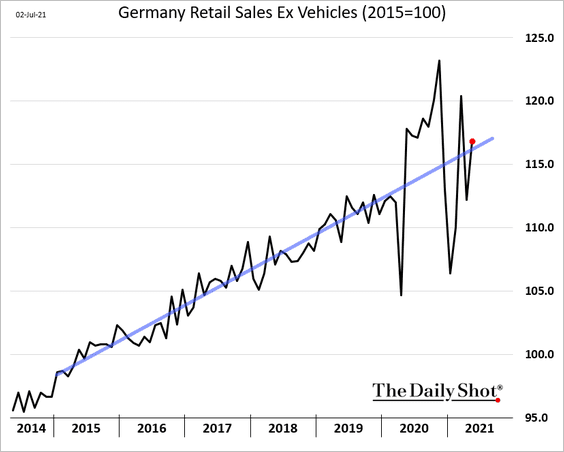
2. Germany’s retail sales are back at the pre-COVID trend.
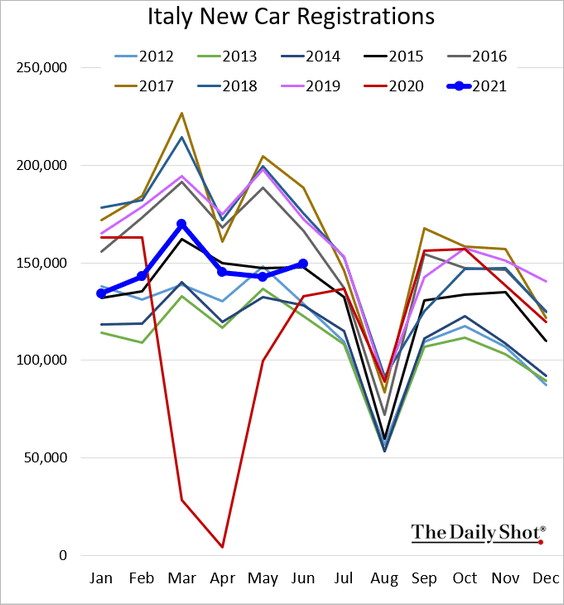
3. Italian new car registrations showed improvement in June but remain well below 2019 levels.
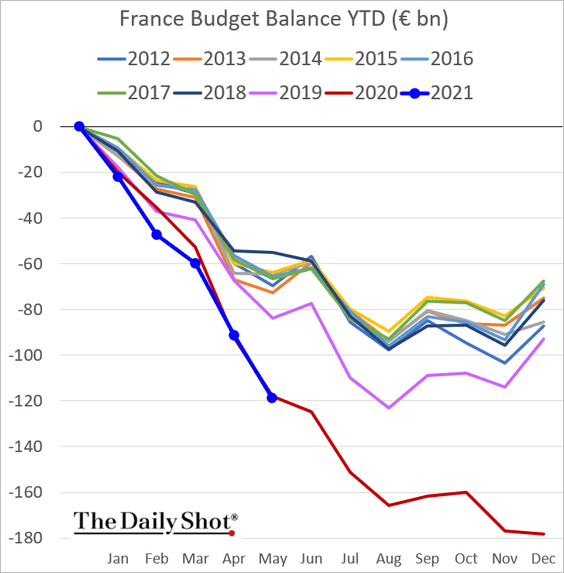
4. The French budget deficit is following the 2020 trend.
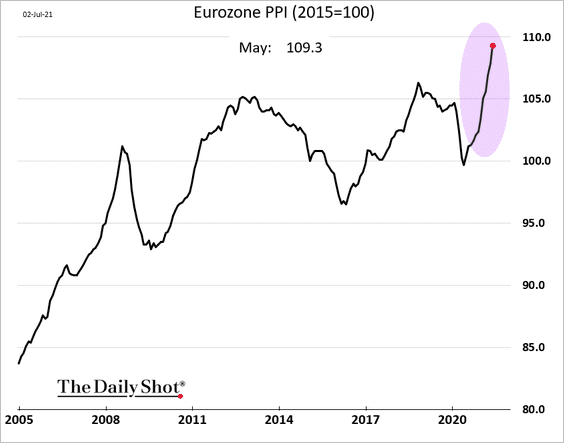
5. Euro-area producer prices are surging.
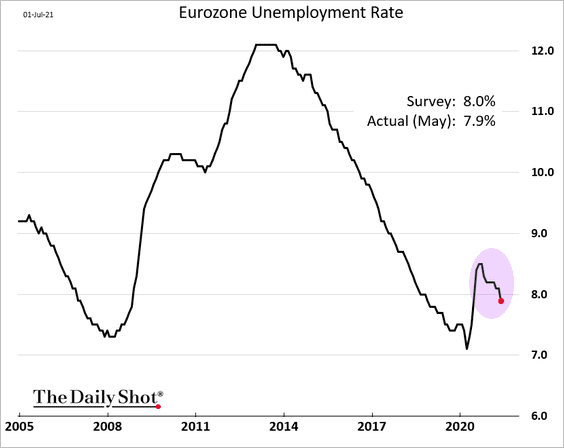
6. The unemployment rate continues to moderate.
Surveys suggest that employment should increase substantially going forward.
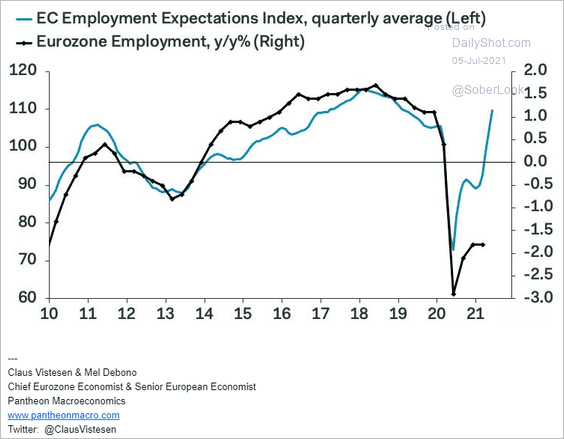 Source: Pantheon Macroeconomics
Back to Index
Aisa – Pacific
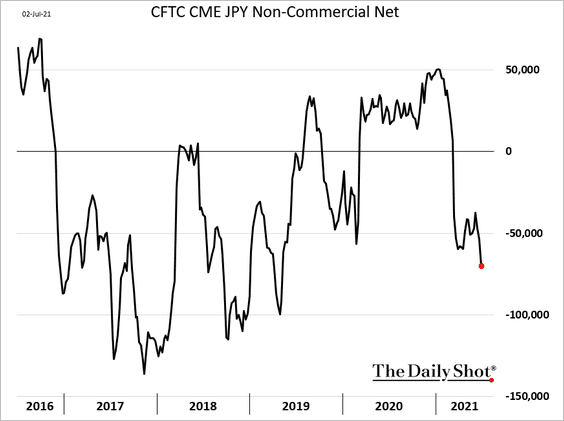
1. Speculative accounts continue to increase their bets against the yen (partially due to more carry trades).
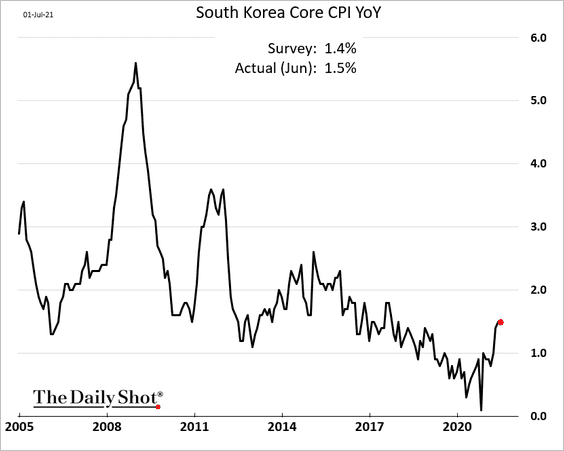
2. South Korea’s inflation is recovering.
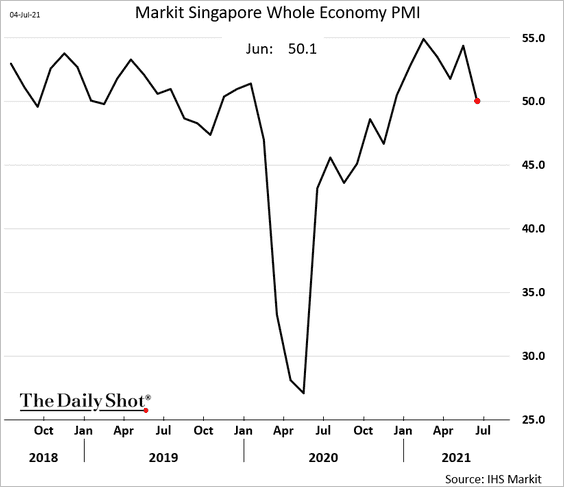
3. Growth in Singapore’s business activity has stalled.
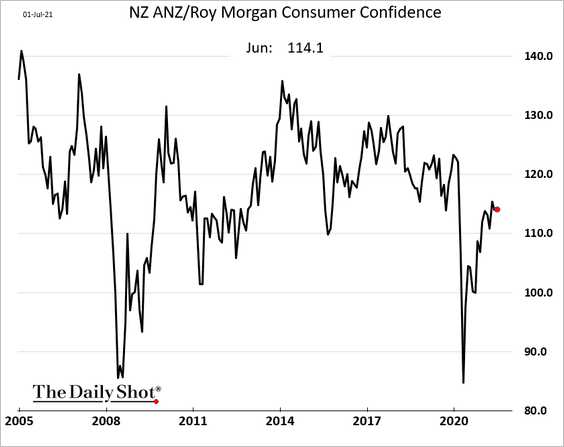
4. New Zealand’s consumer confidence remains below pre-COVID levels.
The market increasingly sees multiple RBNZ rate hikes over the next couple of years.
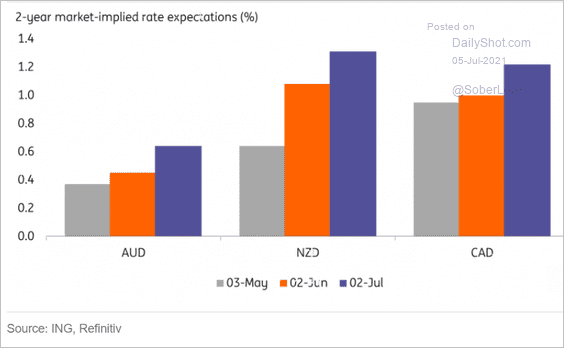 Source: ING
——————–
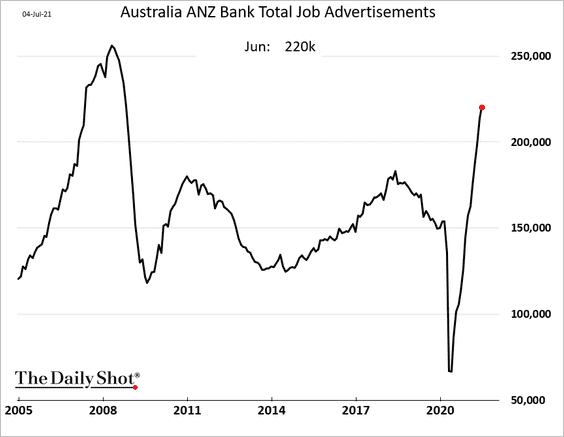
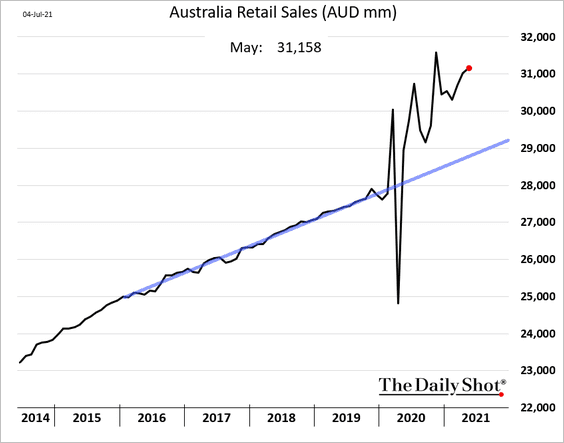
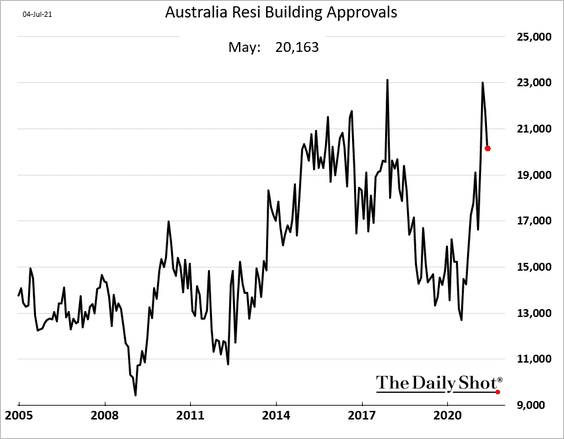
5. Next, we have some updates on Australia.
• Job ads continue to surge.
• Retail sales are well above the pre-COVID trend.
• Building approvals eased in May.
Back to Index
China
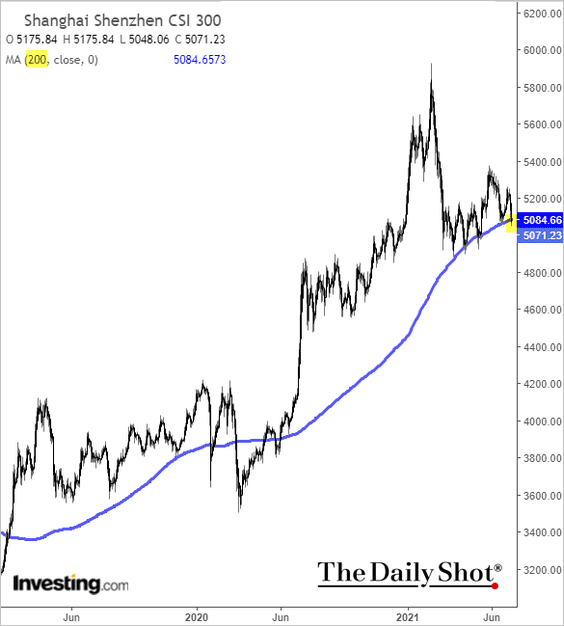
1. The stock market benchmark is testing support at the 200-day moving average – again.
Foreigners have been selling.
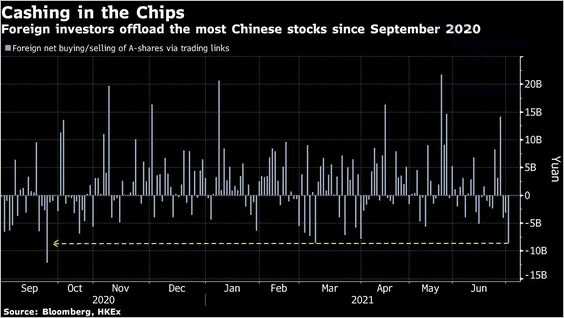 Source: @market, @Schuldensuehner
——————–
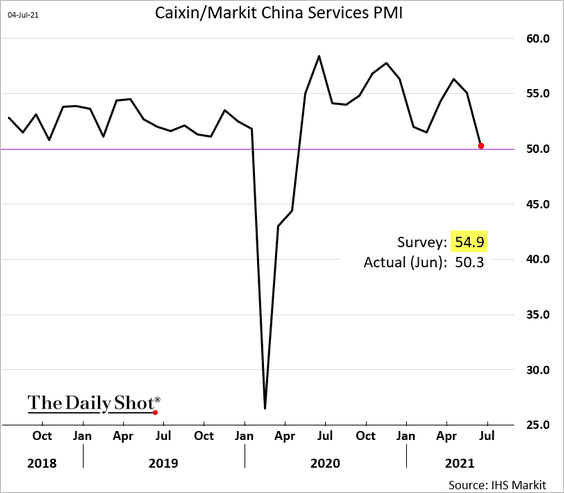
2. Growth in service-sector activity has stalled.
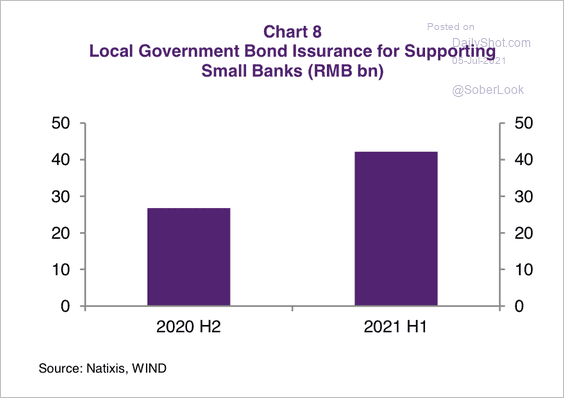
3. Tier-1 bank capital ratios have been falling for two consecutive years.
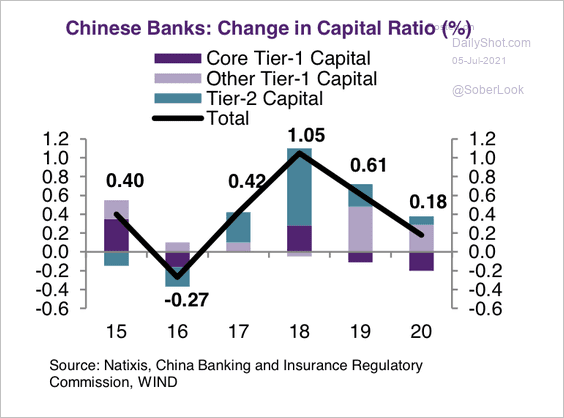 Source: Natixis
Organic capital growth has been weak, especially for small banks.
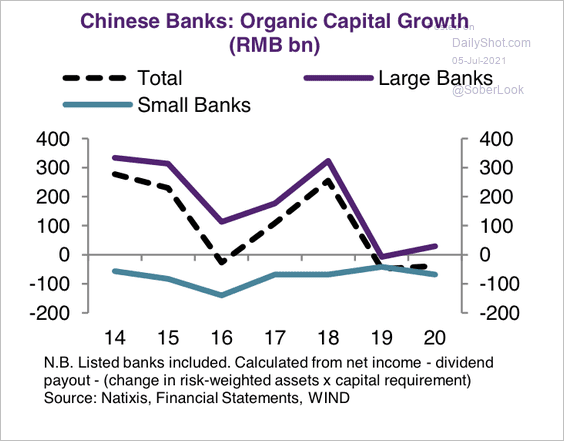 Source: Natixis
Small banks have been involved in riskier businesses as perceived by regulators, which has led to growth in risk-weighted assets outpacing total assets, according to Natixis.
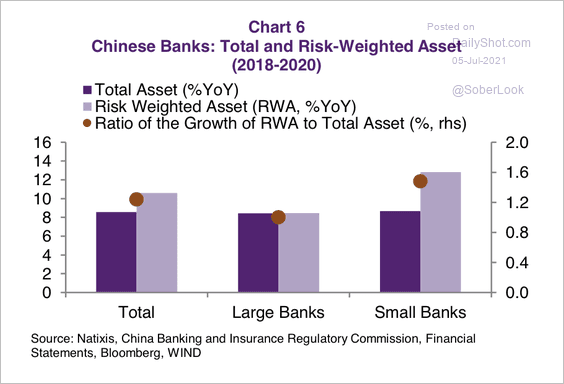 Source: Natixis
The difficulties of small banks to raise capital has forced local governments to step in and issue bonds.
 Source: Natixis
——————–
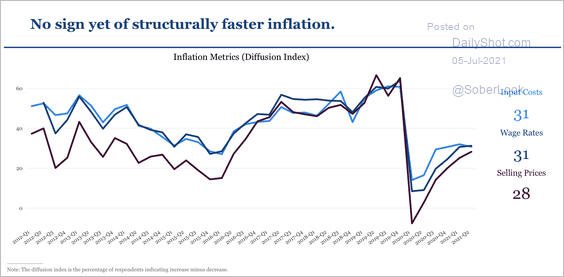
4. Inflation metrics remain soft, according to the China Beige Book.
 Source: China Beige Book
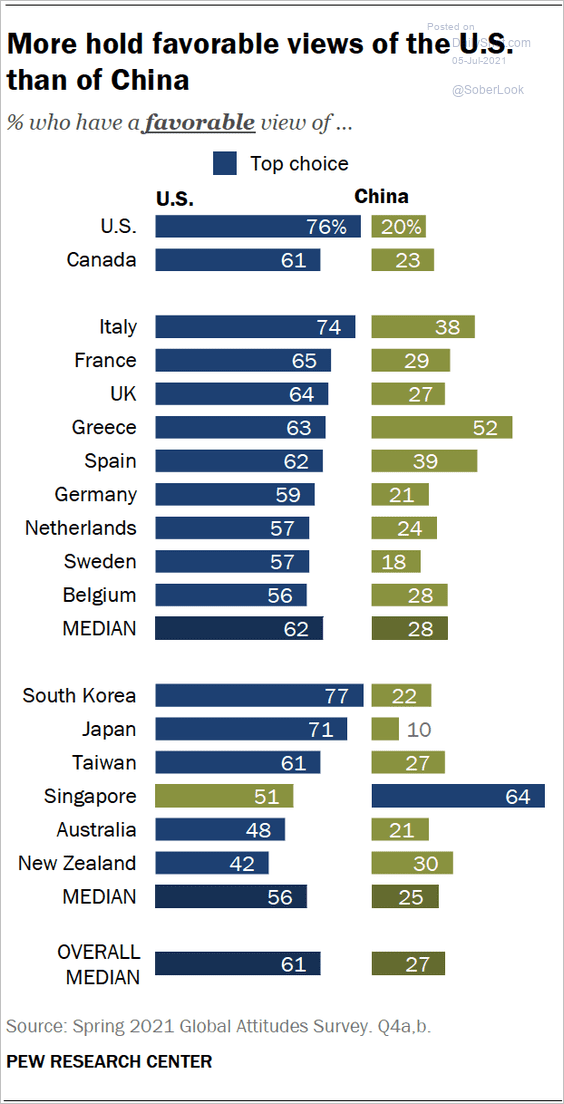
5. How does the world view China and the US?
 Source: Pew Research Center
Back to Index
Emerging Markets
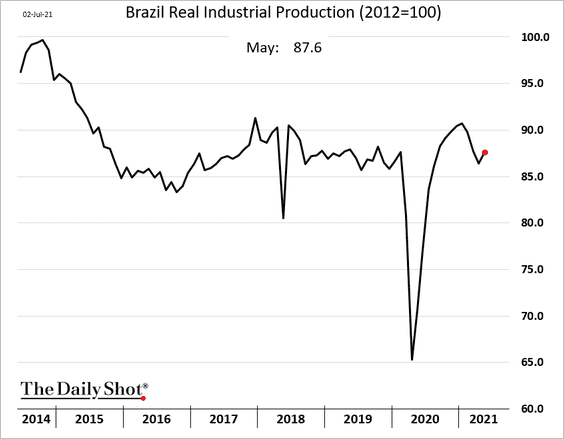
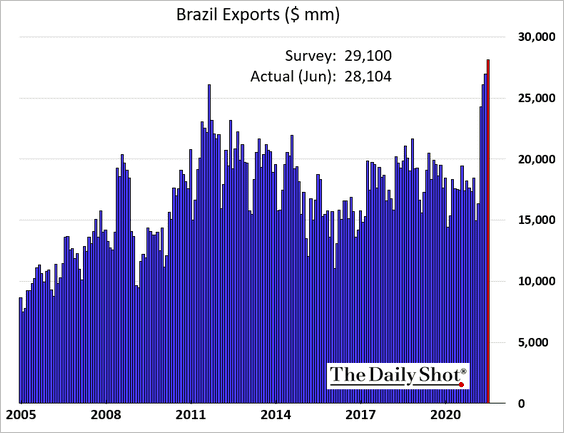
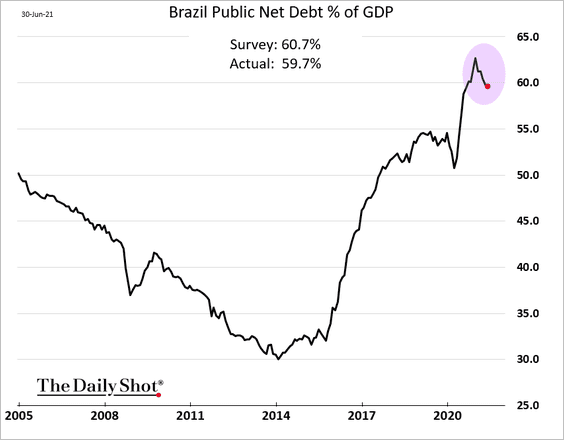
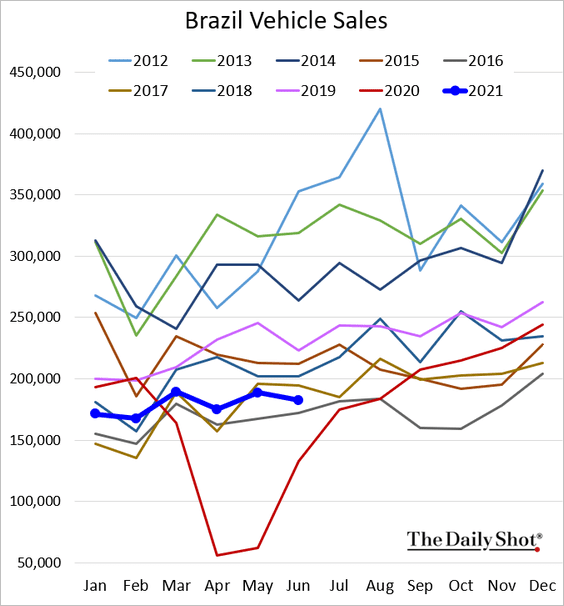
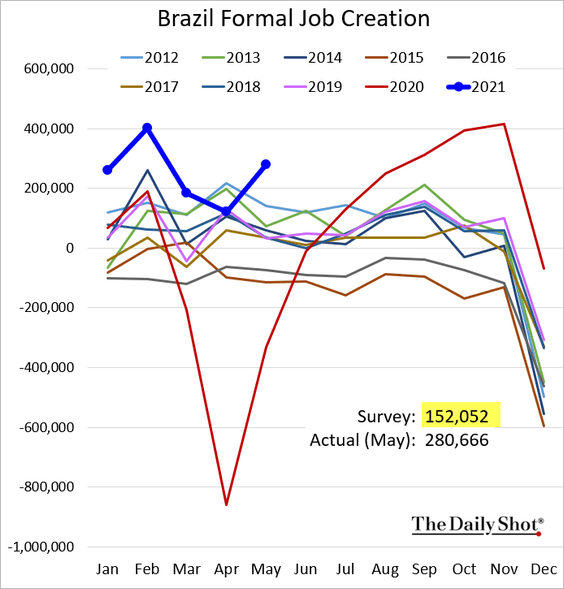
1. Let’s begin with Brazil.
• Industrial production (an uptick in May):
• Manufacturing PMI (an uptick in June):
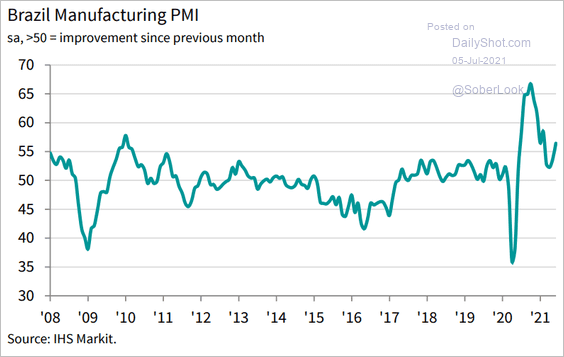 Source: IHS Markit
• Exports (record high):
• Debt-to-GDP ratio (peaked?):
• Car sales (still soft):
• Formal job creation (topped expectations):
——————–
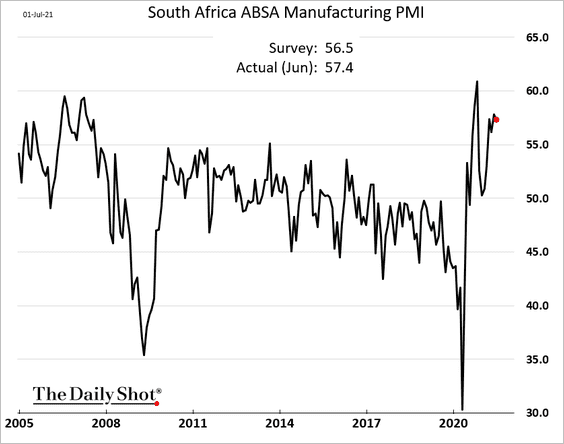
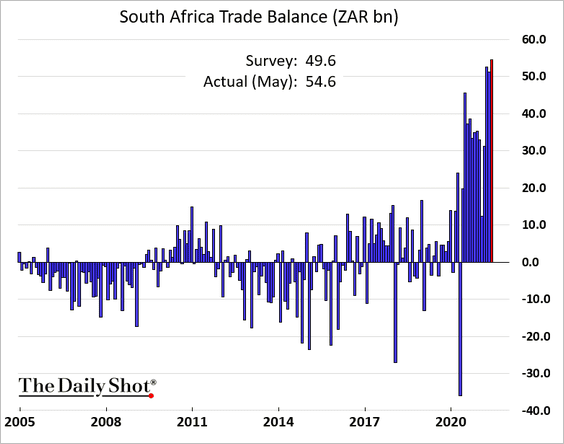
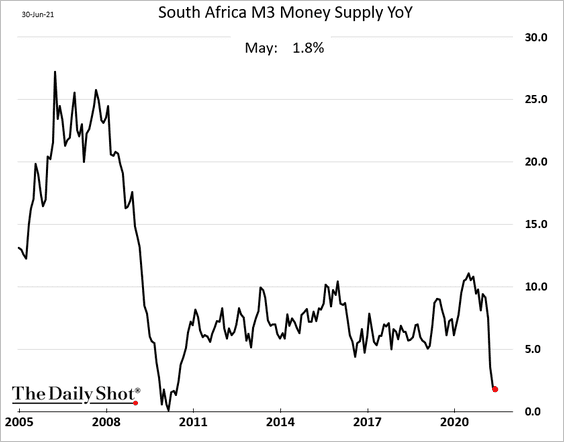
2. Next, we have some updates on South Africa.
• Manufacturing PMI (strong):
• Trade balance (record surplus):
• Broad money supply growth (bottoming?):
——————–
3. Russia’s factory activity is back in contraction mode (PMI < 50).
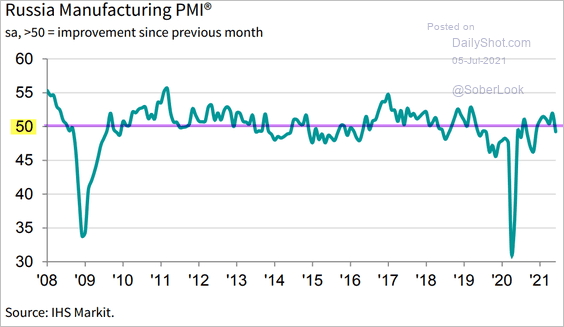 Source: IHS Markit
Separately, this chart shows the composition of Russia’s F/X reserves.
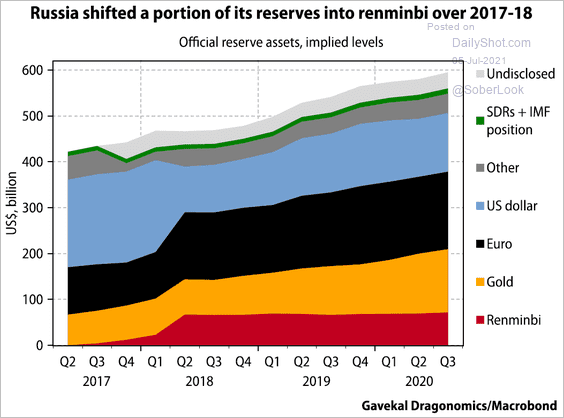 Source: Gavekal Research
——————–
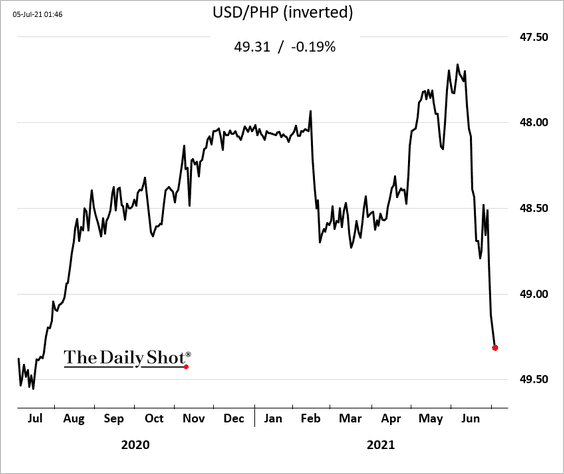
4. The Philippine peso continues to weaken.
5. Here are the drivers of inflation in select economies.
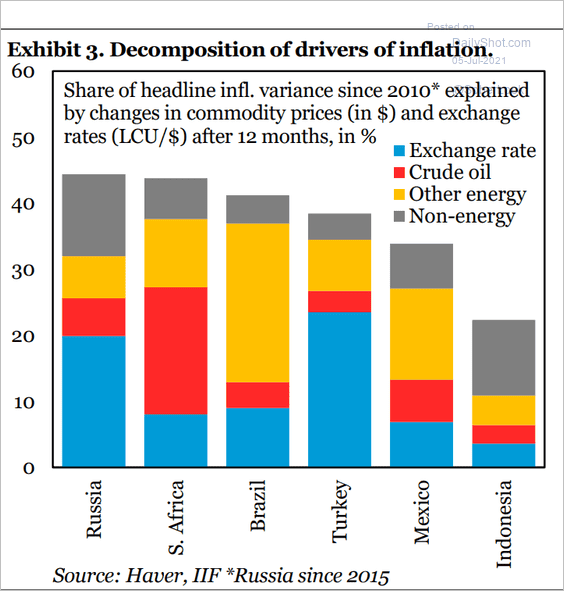 Source: IIF
Back to Index
Cryptocurrency
1. Cryptocurrencies have rebounded over the past week.
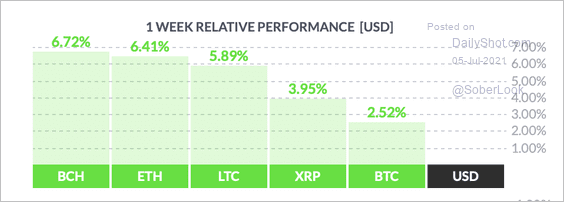 Source: FinViz
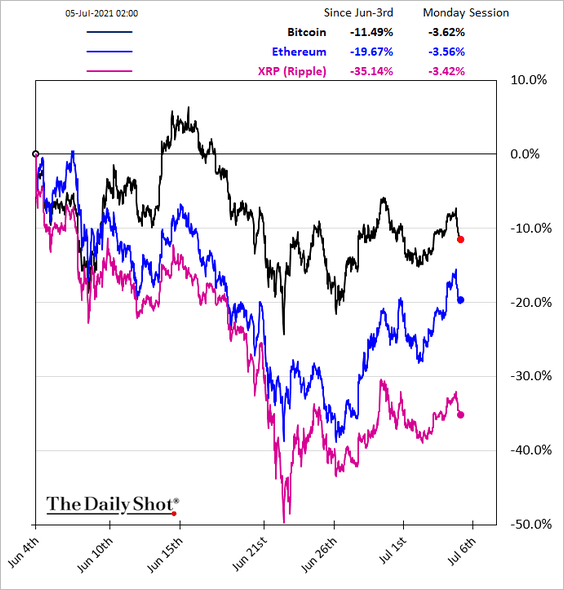
Here is the relative performance over the past month.
——————–
2. Bitcoin implied volatility remains elevated despite rangebound trading since mid-May.
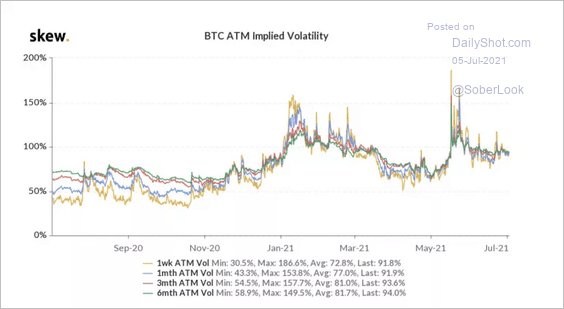 Source: Skew
3. Crypto stocks such as Coinbase and Riot Blockchain have outperformed Bitcoin over the past few months.
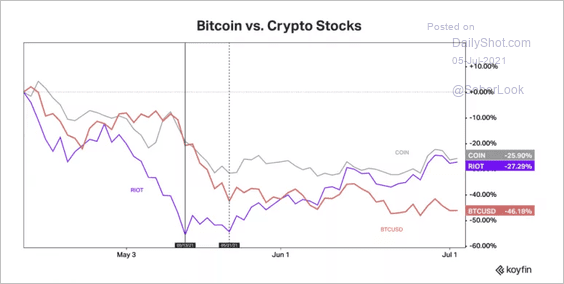 Source: Koyfin
4. Bitcoin’s blockchain has undergone its biggest-ever drop in mining difficulty, as the network’s automatic stabilizing mechanism kicked in following China’s crackdown. The difficulty drop should make it easier for miners to find blocks at a faster rate, which could translate into higher revenues.
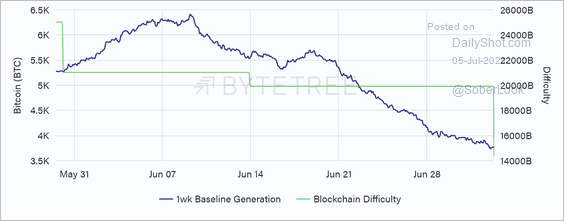 Source: ByteTree Asset Management
5. NFT activity remains elevated.
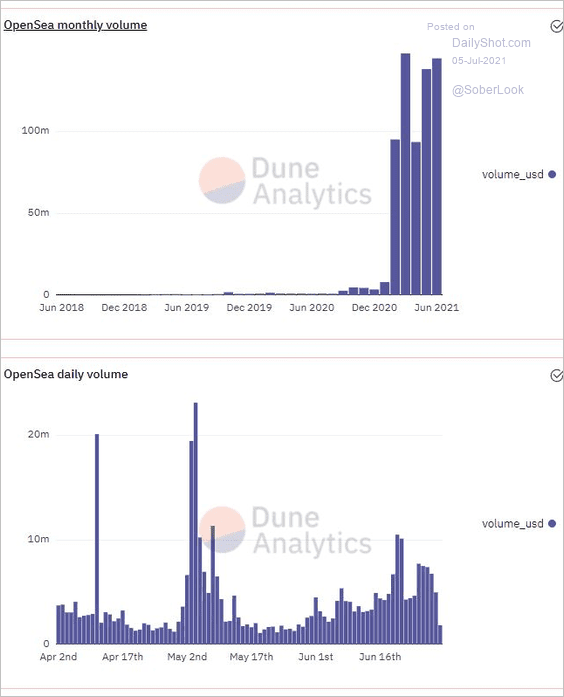 Source: @TheStalwart Read full article
Back to Index
Commodities
1. Australia and Canada are leading the way in new copper mine projects.
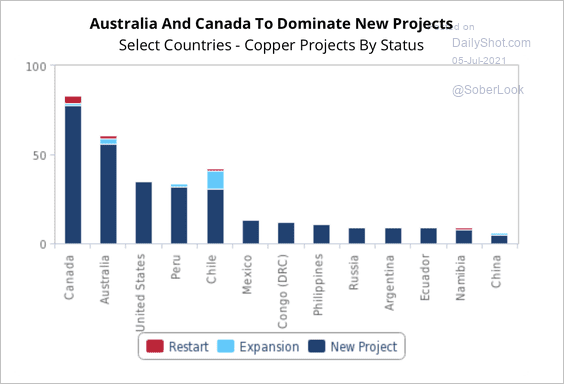 Source: Fitch Solutions Macro Research
The US has a strong pipeline of new copper projects, incentivized by higher prices.
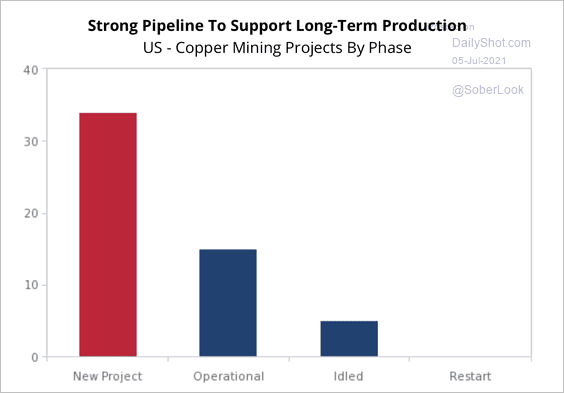 Source: Fitch Solutions Macro Research
——————–
2. It was a good couple of quarters for commodities.
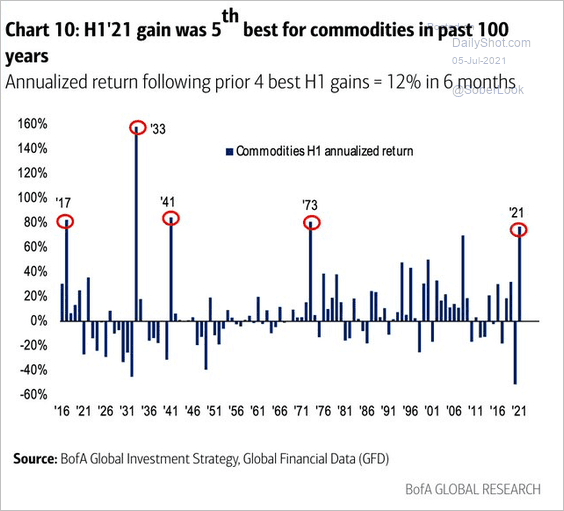 Source: BofA Global Research; @RobinWigg
3. Commodity ETFs suffered outflows over the past month after posting the greatest inflows on record.
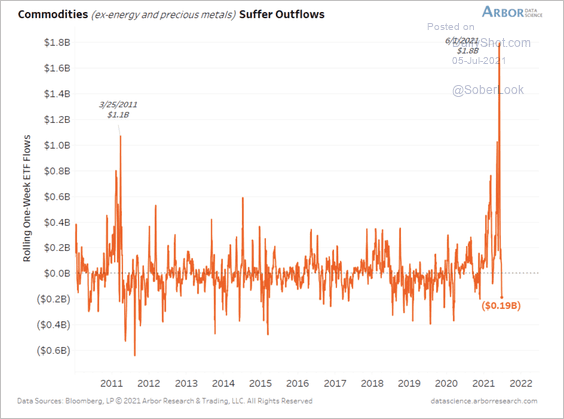 Source: Arbor Research & Trading
4. The decline in inflation expectations could point to lower commodity prices.
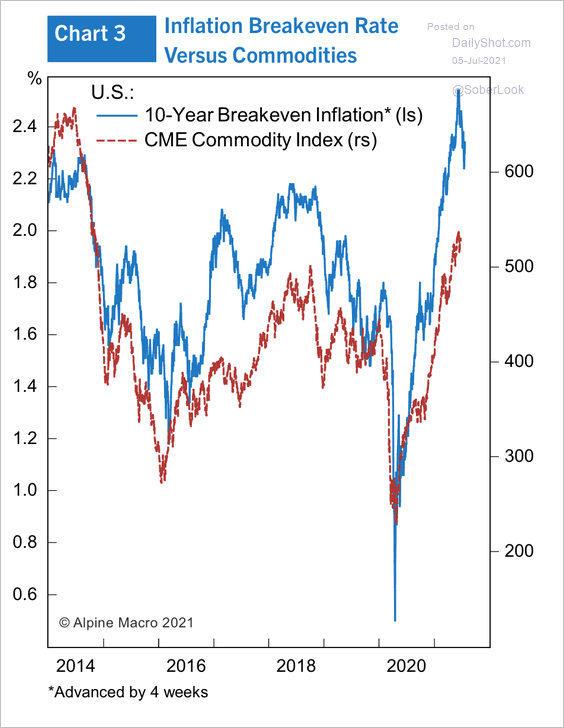 Source: Alpine Macro
5. Most gains in gold have been outside of the US trading hours.
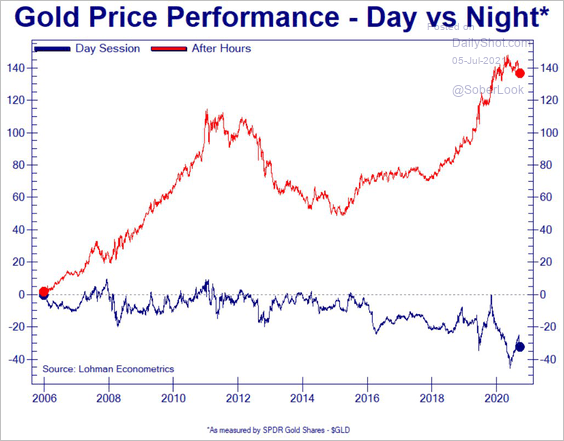 Source: @Not_Jim_Cramer
Back to Index
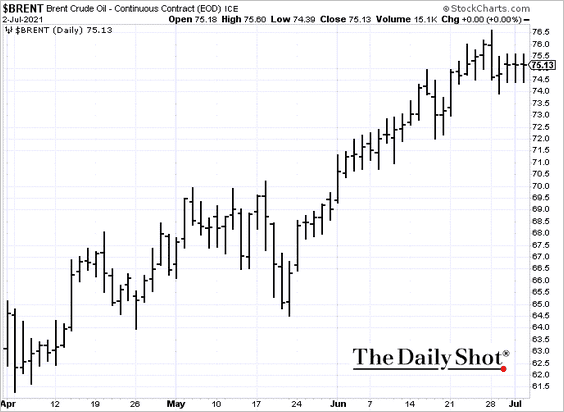
Energy
1. Energy markets are waiting to see if OPEC+ can resolve the current impasse. The upside risk is no production increases, while the downside risk is an all-out output war.
 Source: Reuters Read full article
——————–
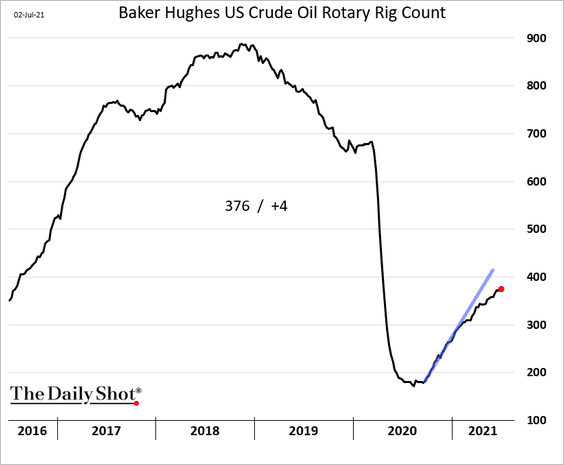
2. Increases in US oil rigs have been slowing.
3. US propane prices are surging.
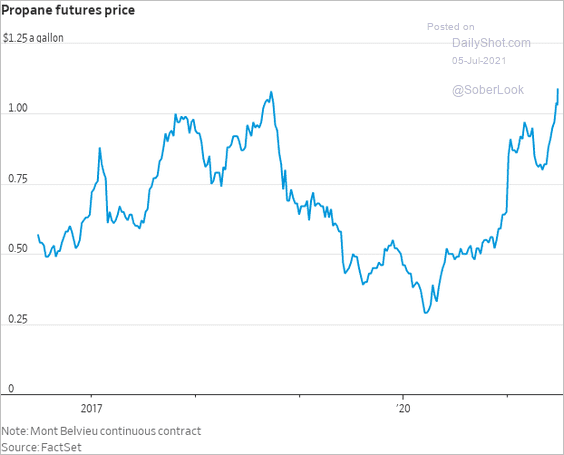 Source: @WSJ Read full article
4. This chart shows levelized electricity costs by source in select countries.
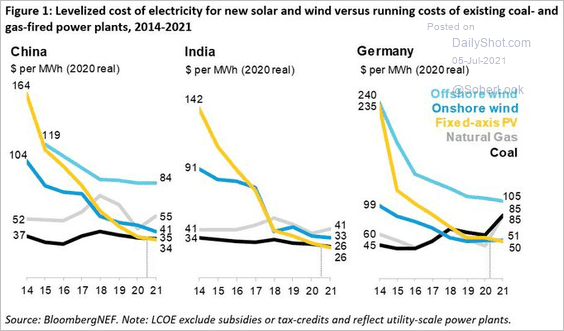 Source: @DrSimEvans, @BloombergNEF
Back to Index
Equities
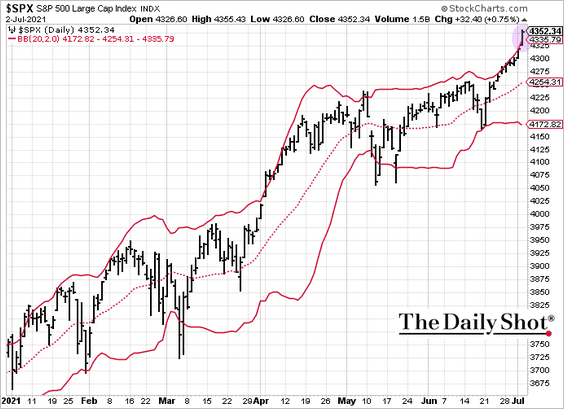
1. Technicals suggest that the S&P 500 rally is stretched.
2. July in post-election years is historically a good month for stocks.
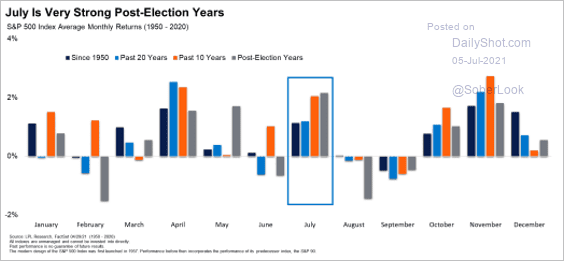 Source: LPL Research
But Q3 can be challenging.
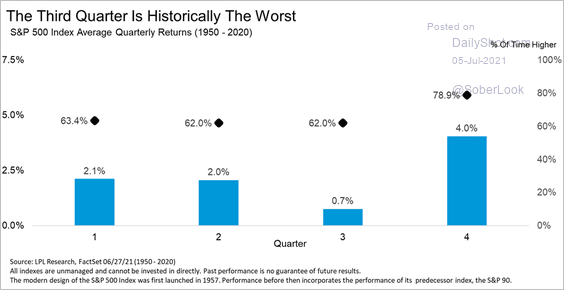 Source: LPL Research
——————–
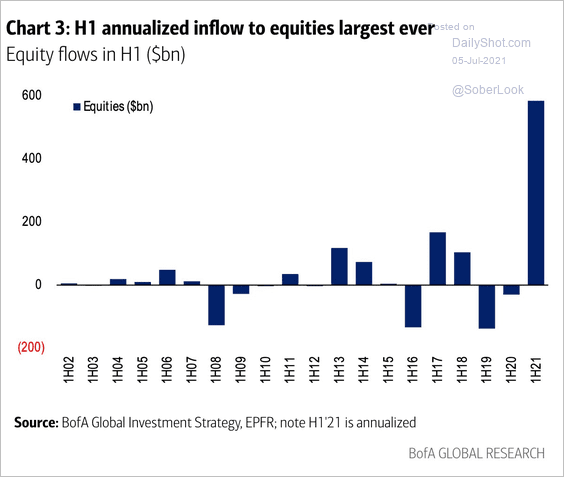
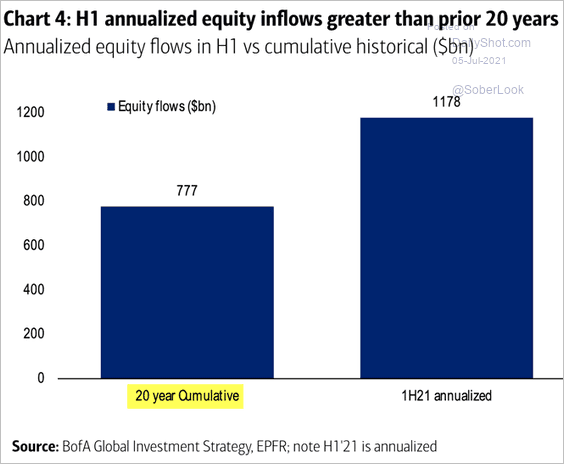
3. Equity inflows have been remarkable in the first half, …
 Source: BofA Global Research; @RobinWigg
… exceeding the past 20 years (combined).
 Source: @ISABELNET_SA, @BofAML
——————–
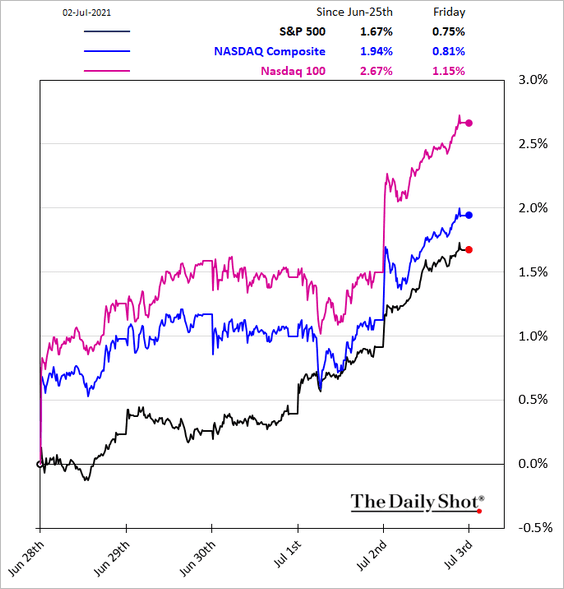
4. The relatively “benign” US employment report sent bond yields lower, boosting Nasdaq 100 stocks.
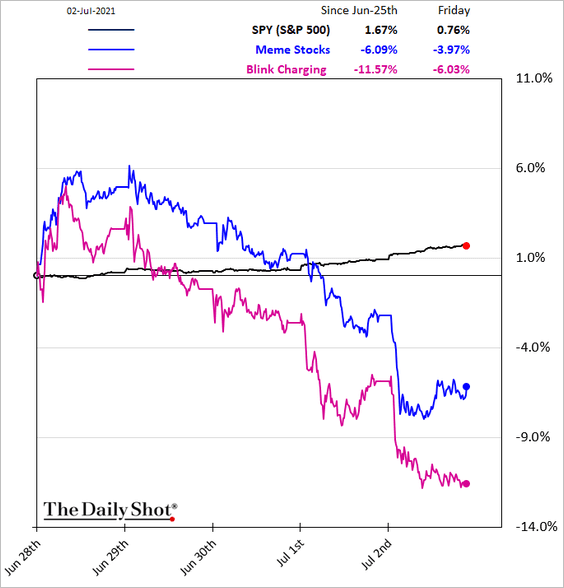
5. It was a tough week for meme stocks.
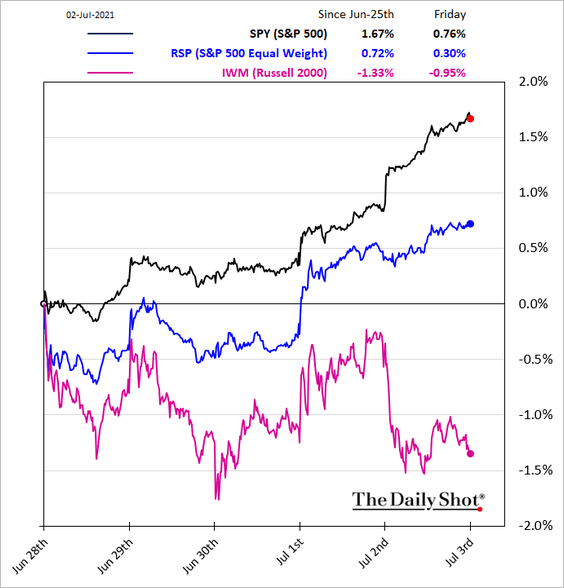
6. Smaller stocks have underperformed.
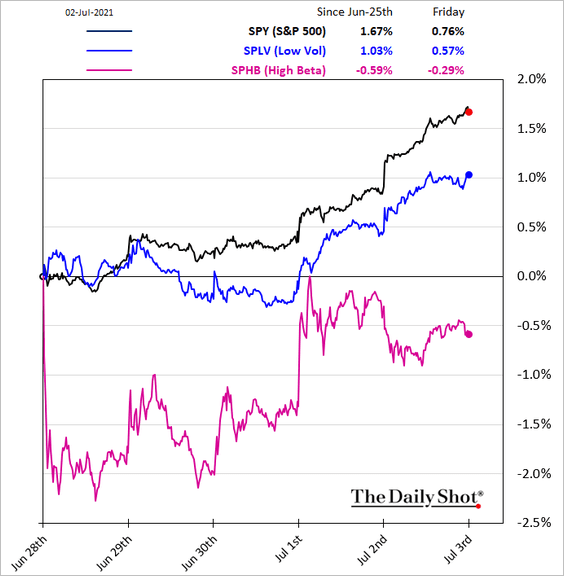
7. Next, we have some updates on factor/style trends.
• Low-vol and high-beta:
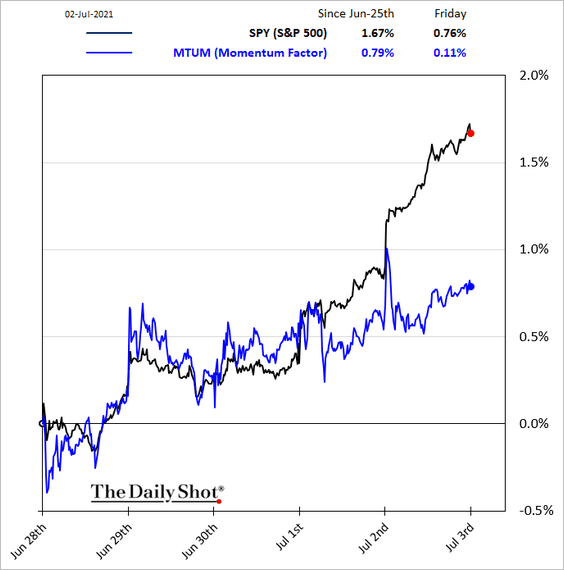
• Momenum:
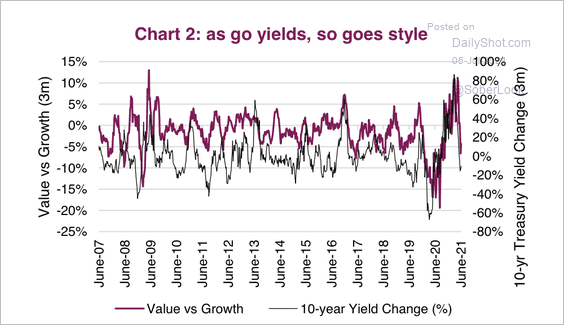
• Value vs. growth:
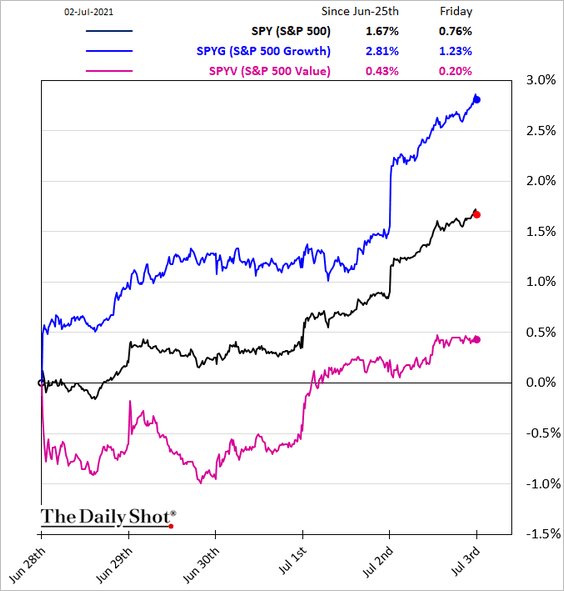
Value stocks have been underperforming growth stocks over the past two months as yields pullback (2 charts).
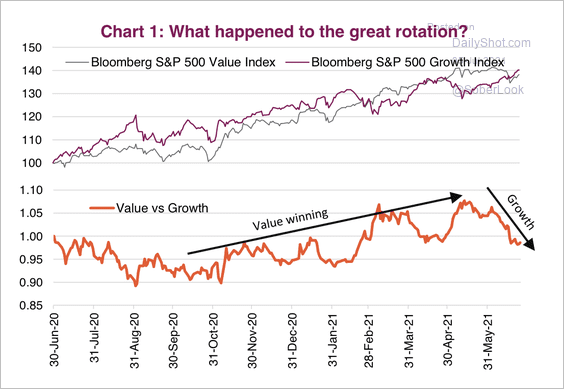 Source: Market Ethos, Richardson GMP
 Source: Market Ethos, Richardson GMP
Growth stocks still appear stretched versus value over the long term.
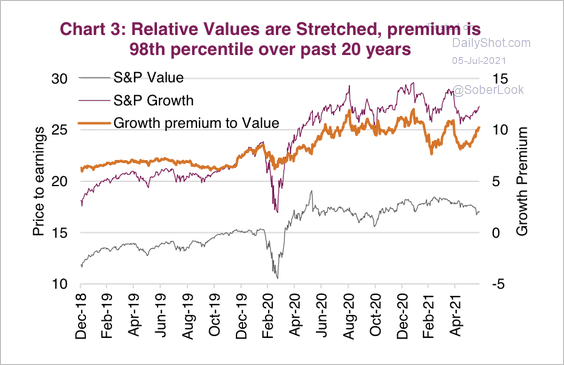 Source: Market Ethos, Richardson GMP
——————–
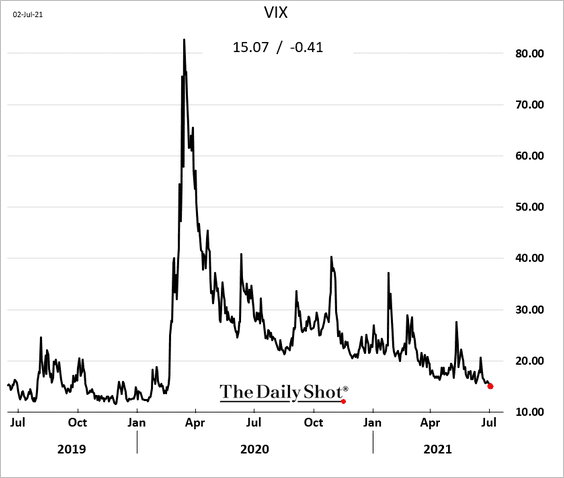
8. VIX is near 15, the lowest level since the start of the pandemic.
Back to Index
Credit
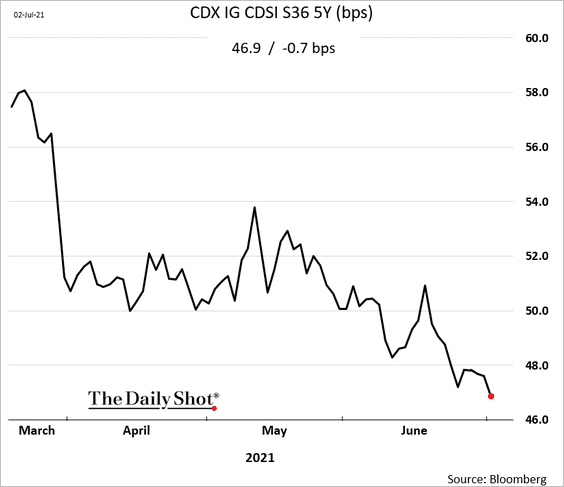
1. Investment-grade credit default swap spreads continue to tighten.
2. Non-financial corporate leverage has returned to trend as earnings rebounded.
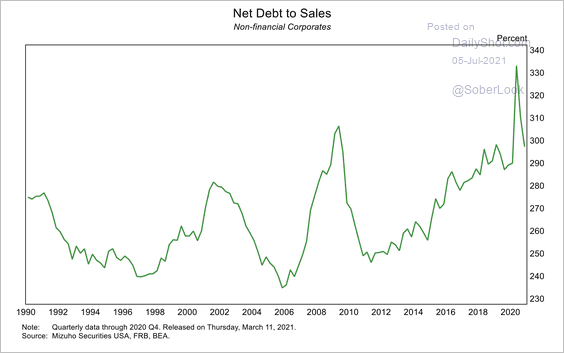 Source: Mizuho Securities USA
3. The US speculative-grade default rate is declining.
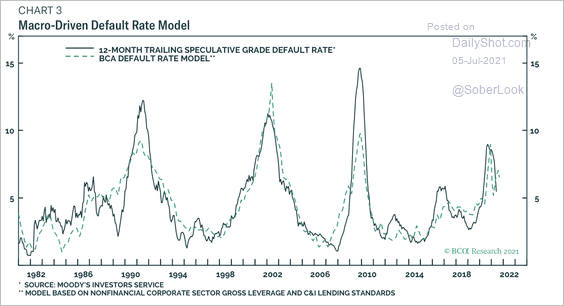 Source: BCA Research
Back to Index
Rates
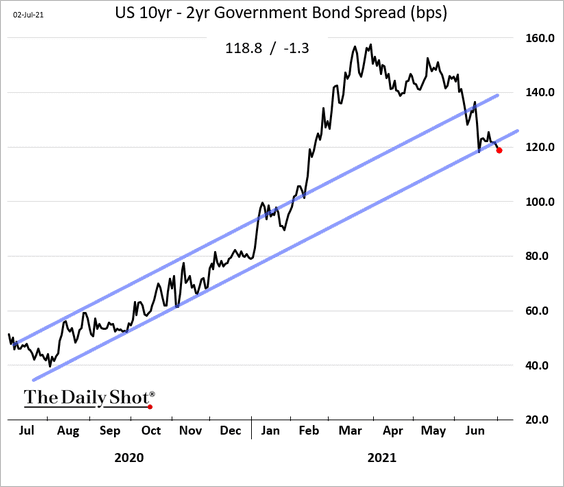
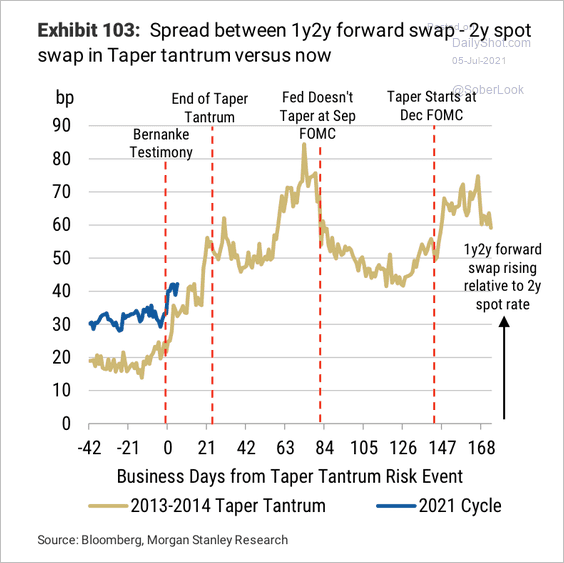
1. The yield curve refuses to steepen.
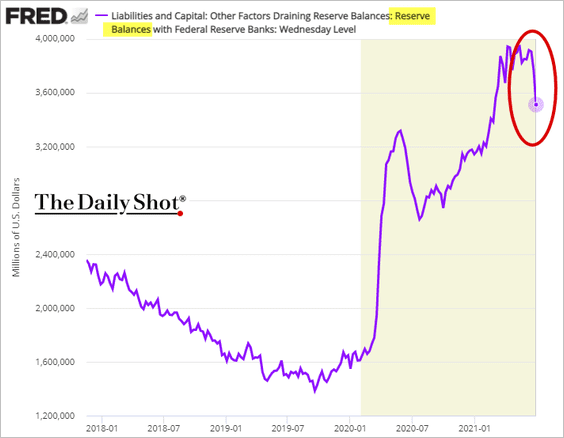
2. The sharp spike in the Fed’s RRP balances …
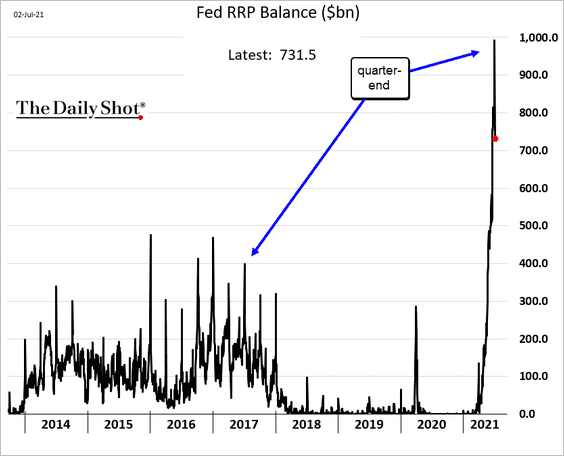
… helped the central bank drain reserves further.
——————–
3. How quickly will the Fed taper its QE purchases? Will the central bank start with MBS?
 Source: Morgan Stanley Research
——————–
Food for Thought
1. Online search activity for “labor shortage”:
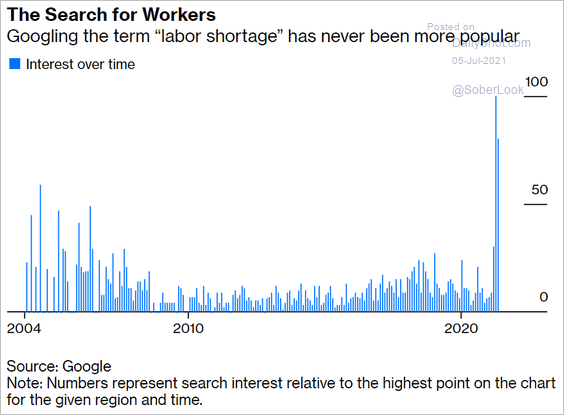 Source: @RosenthalRC, @bopinion Read full article
2. The rise of the “Digital Nomad“:
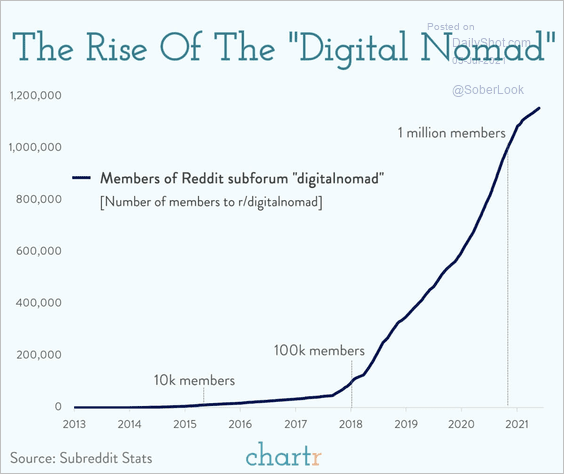 Source: @chartrdaily Read full article
3. Inflows of tech workers:
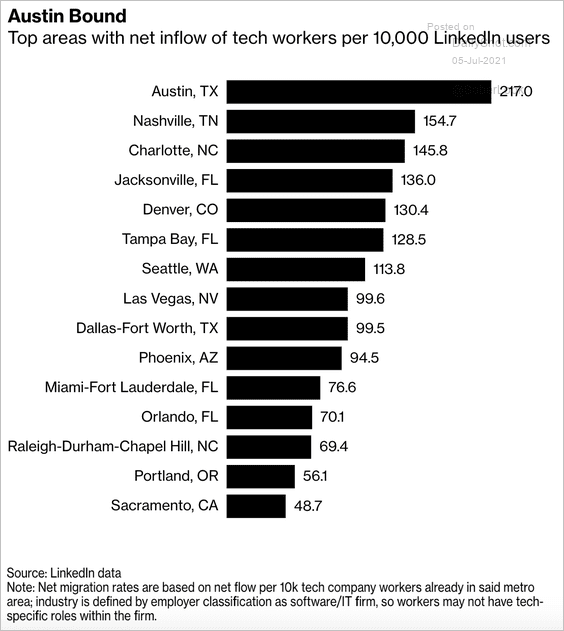 Source: @technology Read full article
4. Fathers getting parental leave:
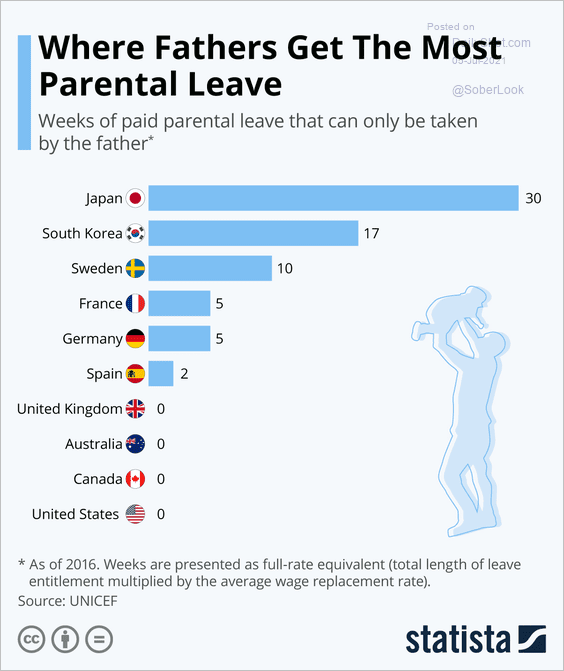 Source: Statista
5. E-commerce growth vs. pre-pandemic levels:
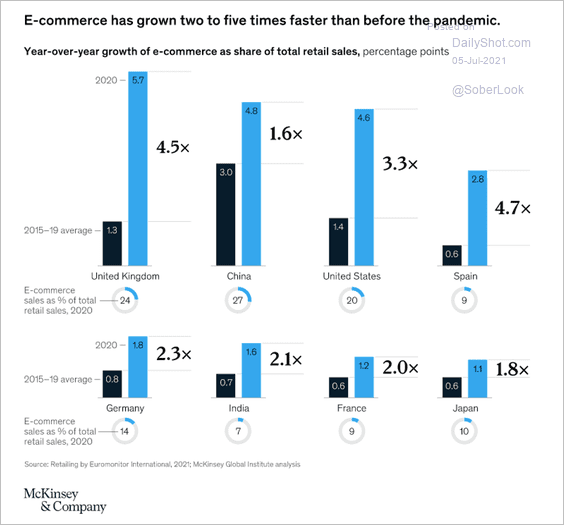 Source: McKinsey & Company
6. US presidential elections turnout rates:
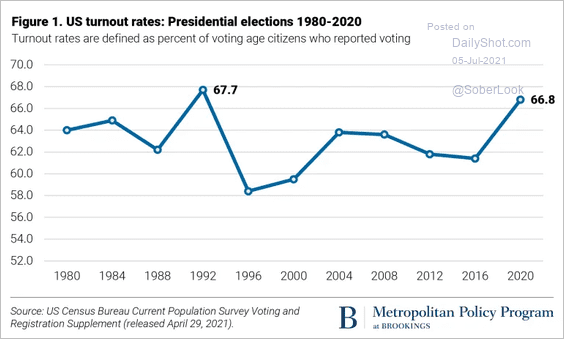 Source: Brookings Read full article
• US vote difficulty vs. turnout:
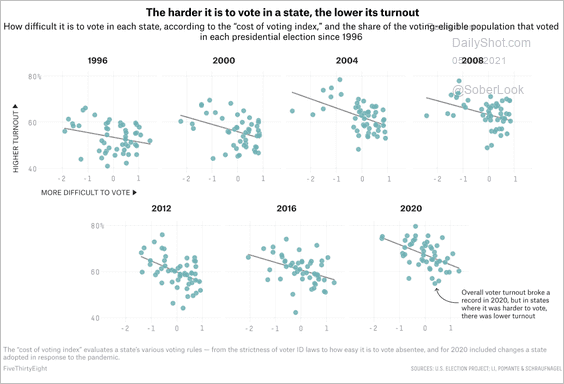 Source: FiveThirtyEight Read full article
——————–
7. Drought in the US:
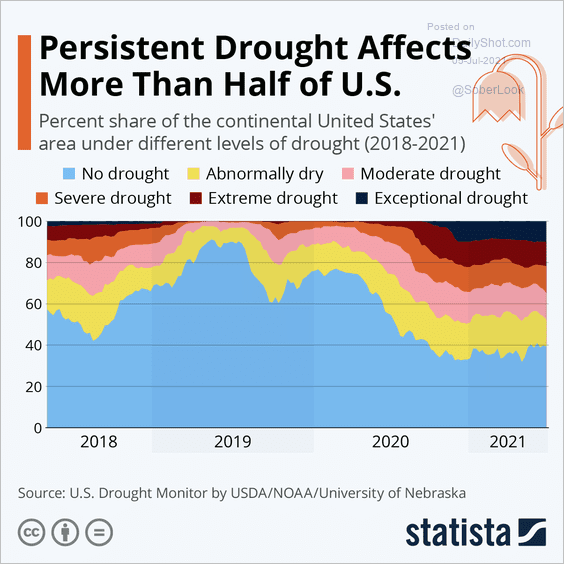 Source: Statista
8. Banning imports of dogs:
 Source: Statista
9. Everest ascents per year:
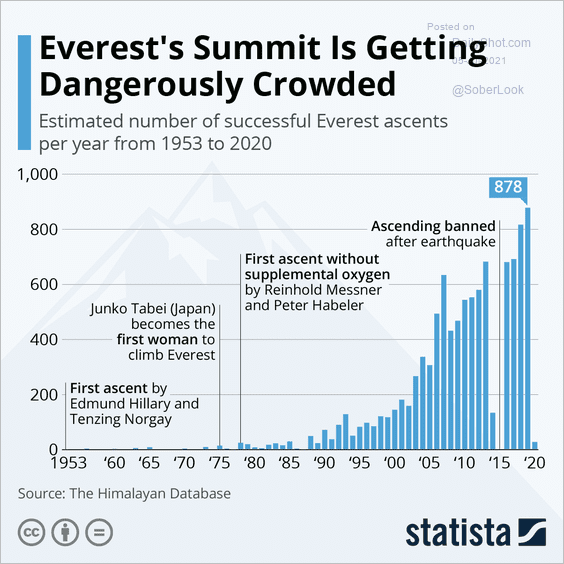 Source: Statista
——————–
Back to Index