
The Daily Shot: 08-Jul-21
• The United States
• Canada
• The United Kingdom
• The Eurozone
• Europe
• Asia – Pacific
• China
• Emerging Markets
• Cryptocurrency
• Energy
• Equities
• Credit
• Rates
• Global Developments
• Food for Thought
The United States
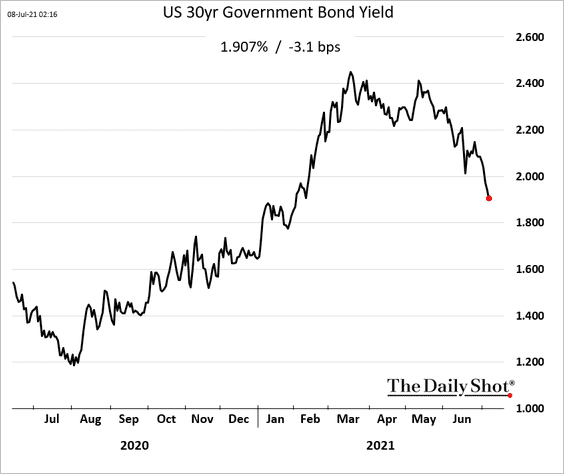
1. The FOMC minutes contained few surprises and were perhaps a bit less hawkish than markets expected. There doesn’t seem to be much urgency to get moving on QE tapering. Some members expressed concerns about MBS purchases contributing to rapid home price gains, but there wasn’t consensus on prioritizing these securities.
Treasury yields keep moving lower, with the 30yr yield now firmly below 2%.
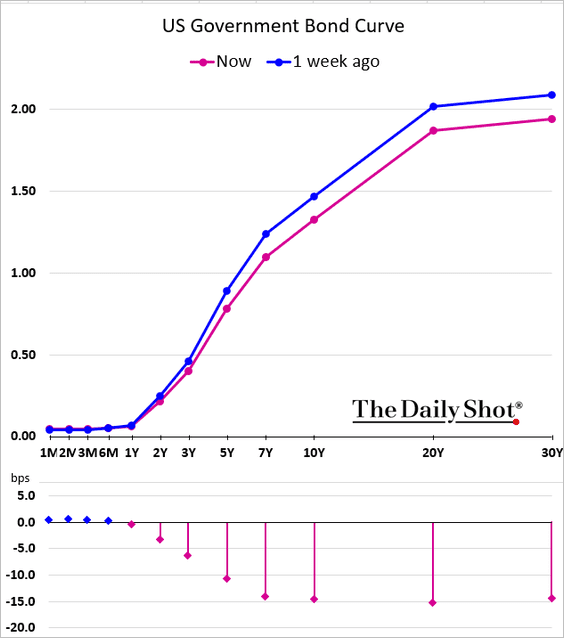
The curve continues to flatten, a trend we see around the world.
——————–
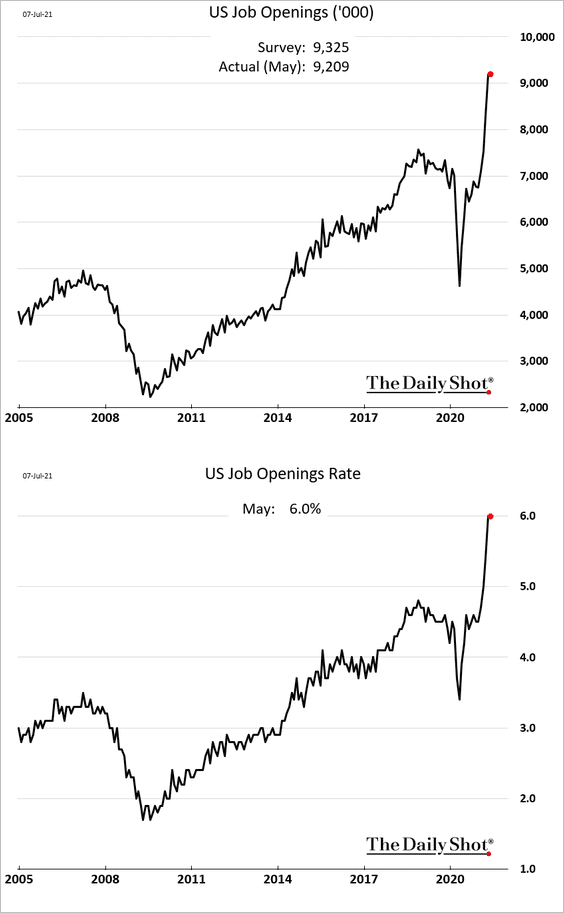
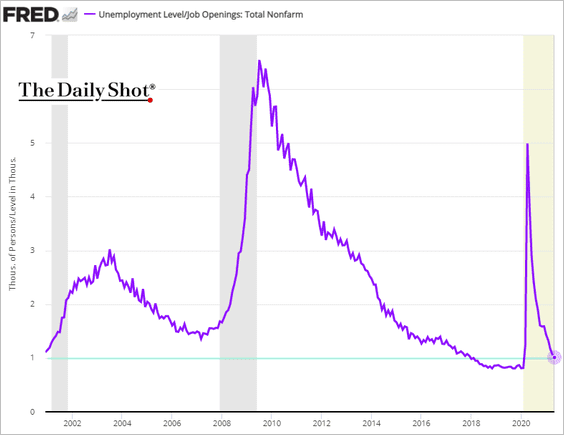
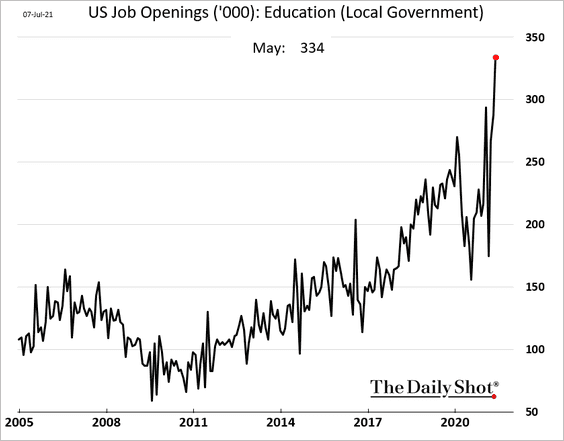
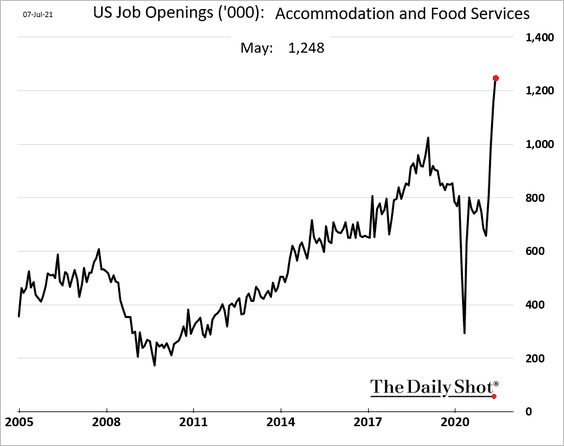
2. Job openings in May were roughly unchanged from the month prior.
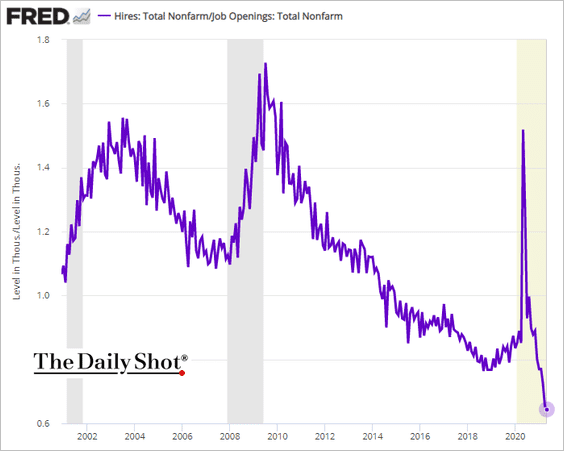
Labor shortages remained acute. Here is the hires-to-openings ratio (record low).
There is now roughly one job opening per one unemployed American.
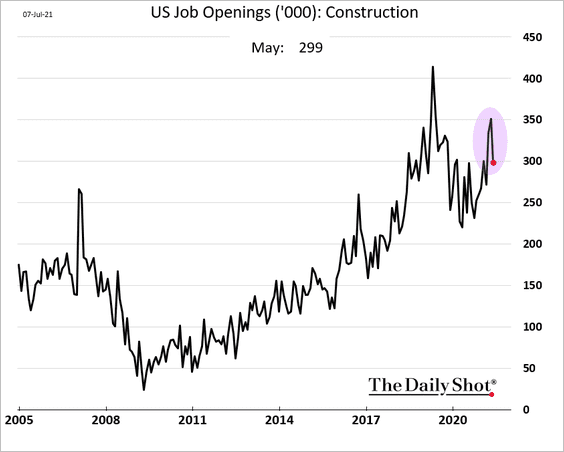
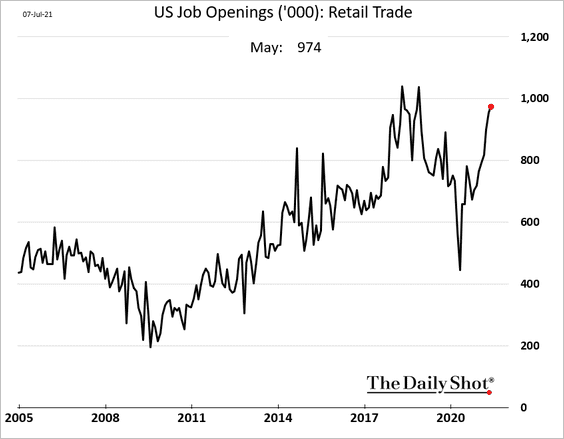
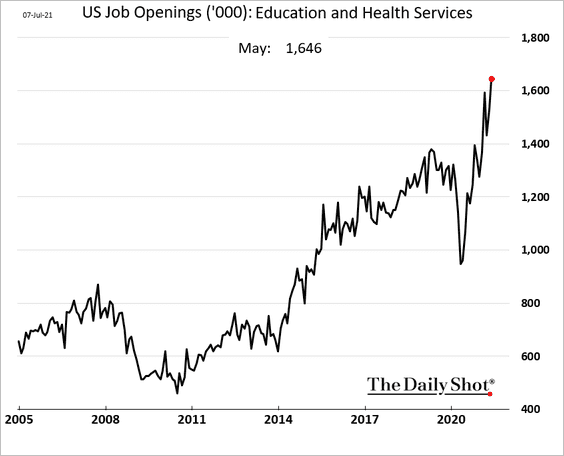
Below are some highlights from the report.
• Construction:
• Retail:
• Education and health:
• Public schools:
• Hotels and restaurants:
——————–
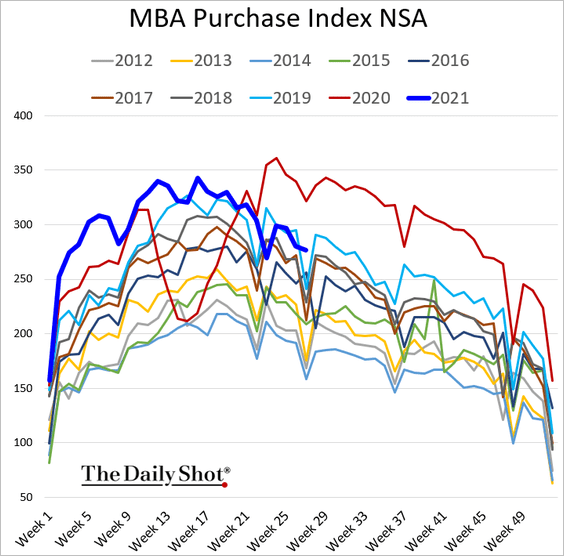
3. Next, we have some updates on the housing market.
• Mortgage applications (roughly in line with 2019 levels):
• Rate locks (stronger than 2019):
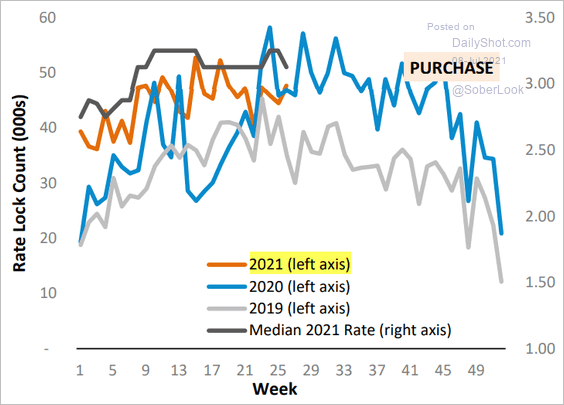 Source: AEI Housing Center Read full article
• Rate locks for select groups of buyers:
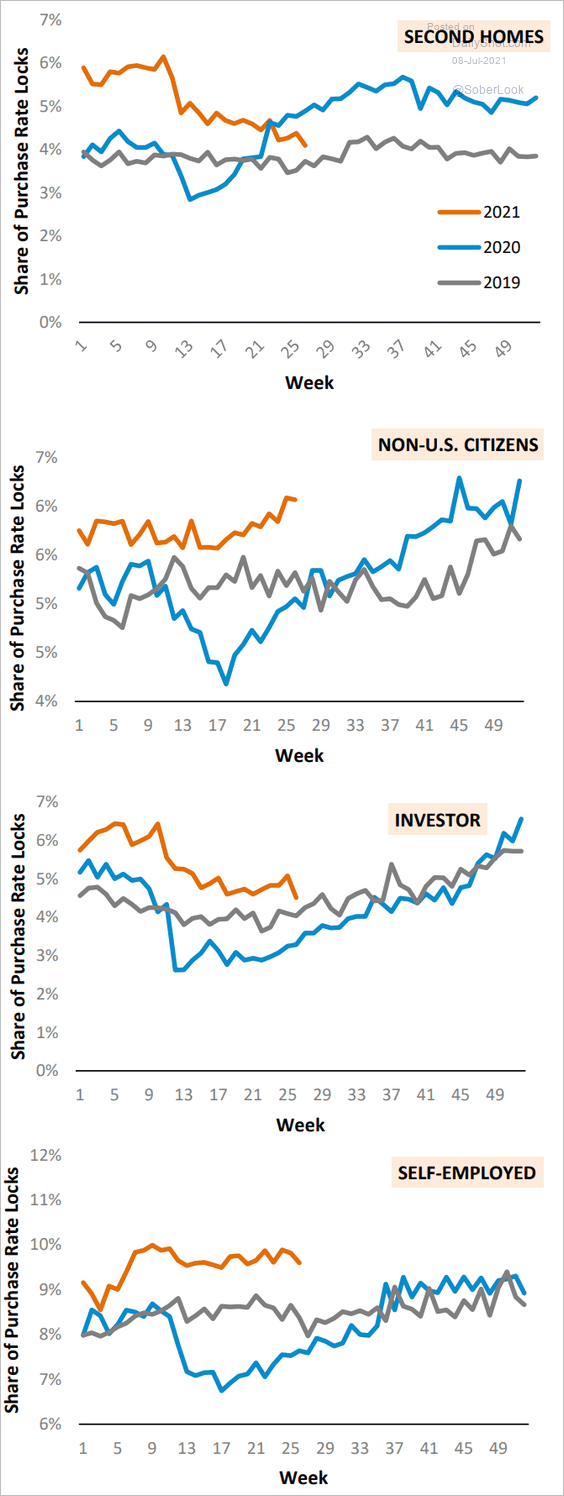 Source: AEI Housing Center Read full article
• The AEI Housing Center’s projection for home price appreciation:
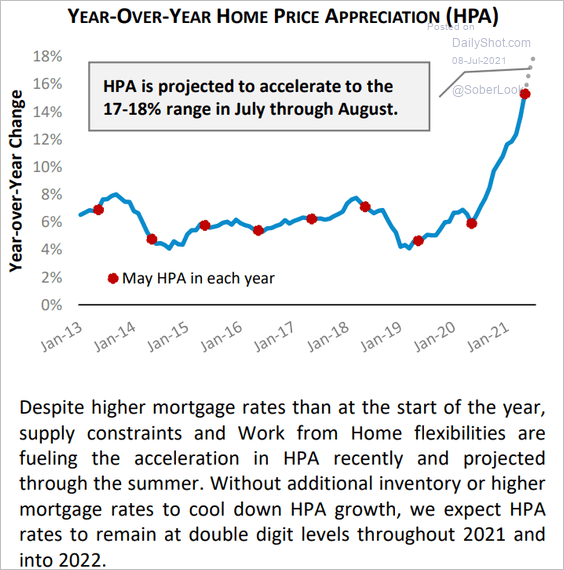 Source: AEI Housing Center Read full article
——————–
4. Many small businesses continue to struggle.
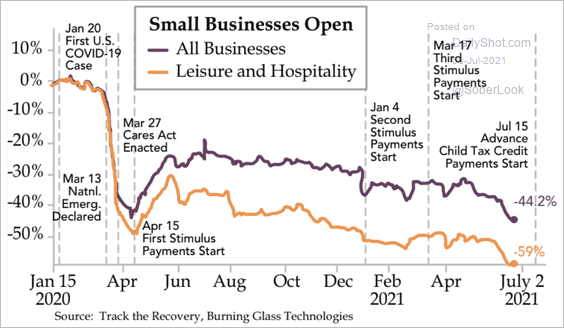 Source: The Daily Feather
• Mall visits haven’t fully recovered.
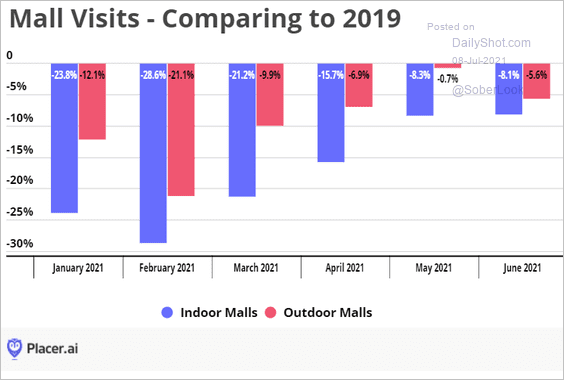 Source: Placer.ai
——————–
5. The Evercore ISI trucking sales index hit the highest level in decades.
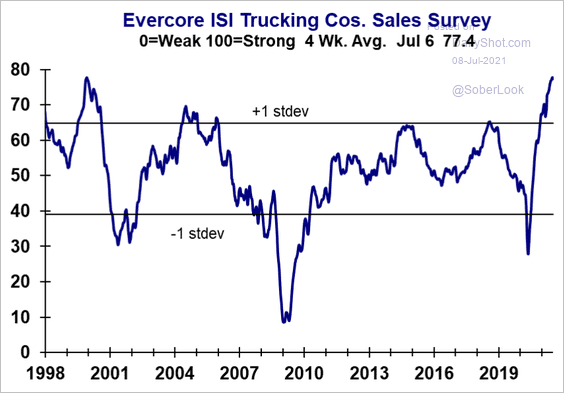 Source: Evercore ISI
6. US growth is set to outperform other advanced economies over the next 18 months.
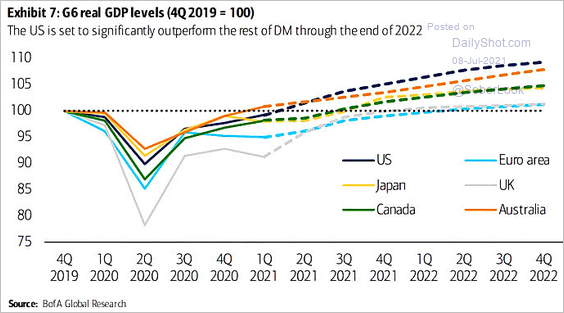 Source: @ISABELNET_SA, @BofAML
Back to Index
Canada
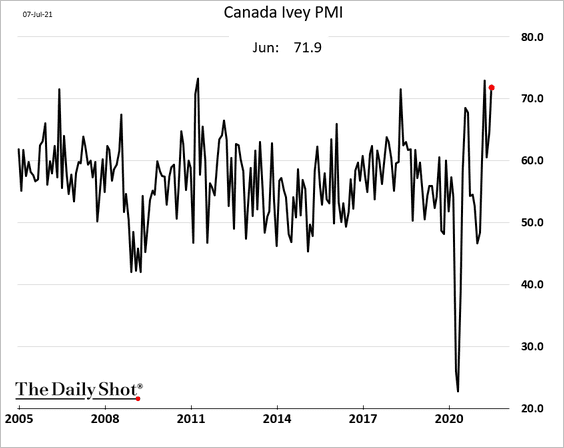
1. Growth in business activity remained robust last month, according to the latest Ivey PMI report.
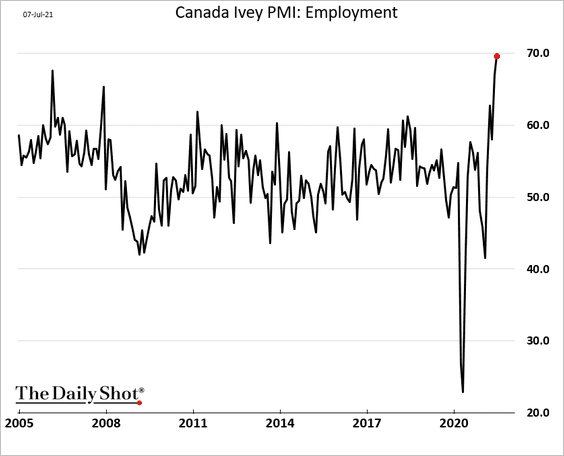
The Ivey employment index hit a new high.
——————–
2. The Oxford Economics recovery tracker is almost back to pre-COVID levels.
![]() Source: Oxford Economics
Source: Oxford Economics
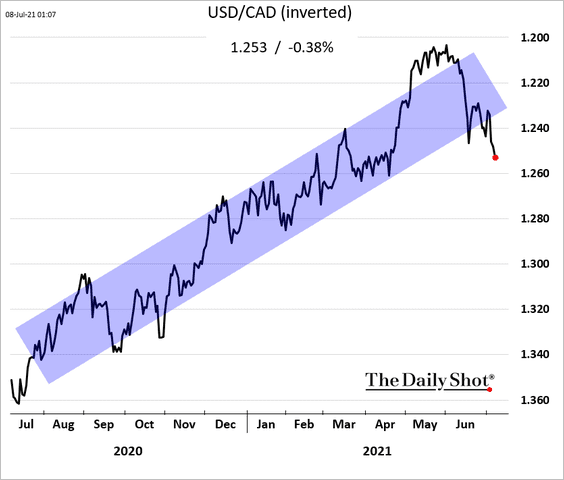
3. The Canadian dollar rally is fading.
Back to Index
The United Kingdom
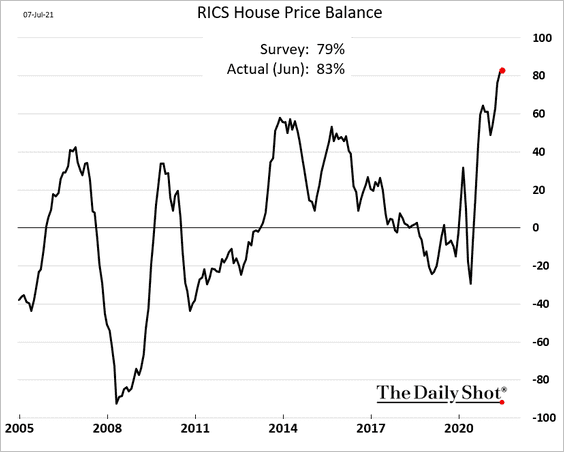
1. Home prices are surging.
 Source: BNN Bloomberg Read full article
——————–
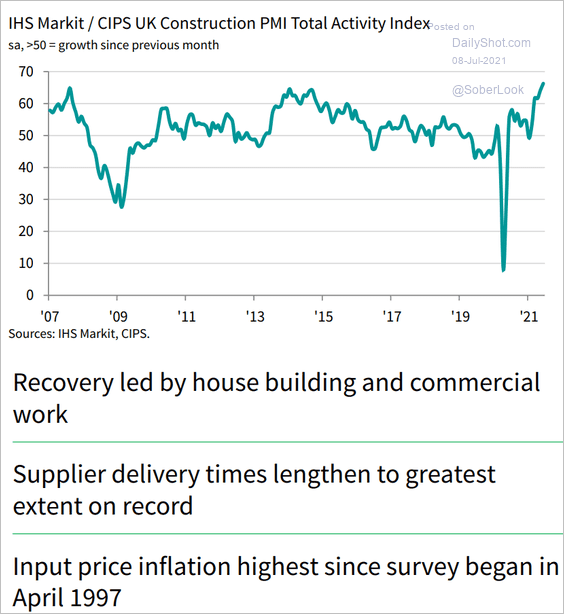
2. Construction growth is at multi-year highs.
 Source: IHS Markit
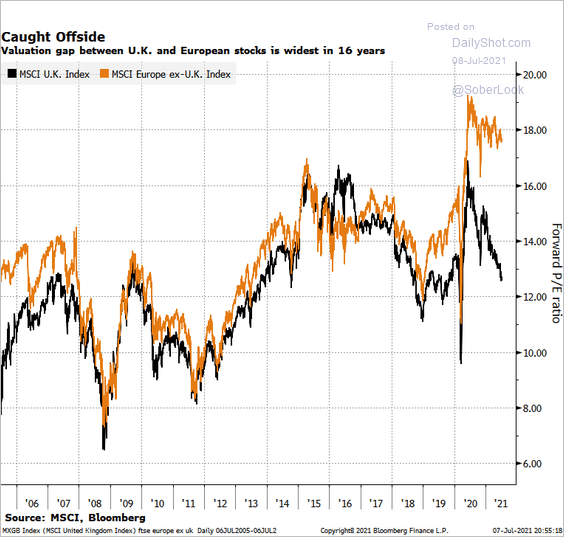
3. The UK stock market valuation discount to European peers keeps widening (2 charts).
 Source: Michael Msika, Bloomberg Finance L.P. Read full article
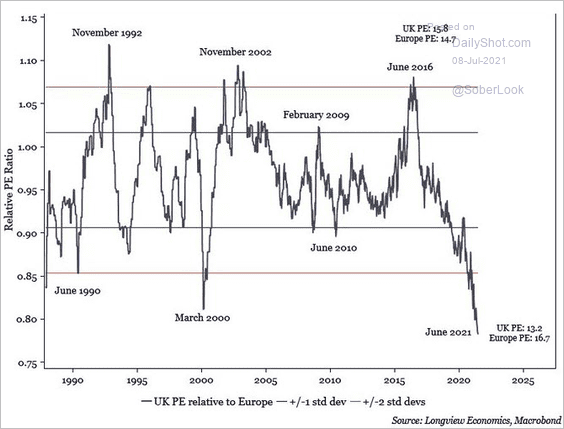 Source: Longview Economics
——————–
4. Immigration is nearly back to pre-Brexit highs, although fewer immigrants are from the EU.
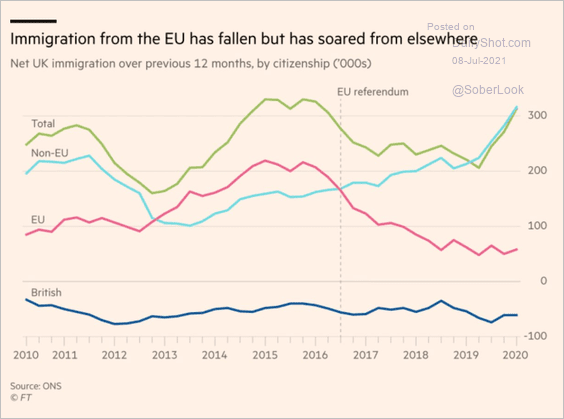 Source: @adam_tooze, @FT Read full article
5. Britons saw significant increases in calorie consumption since the start of the pandemic.
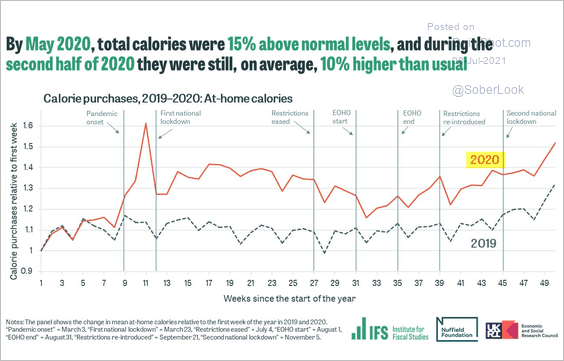 Source: @TheIFS
Back to Index
The Eurozone
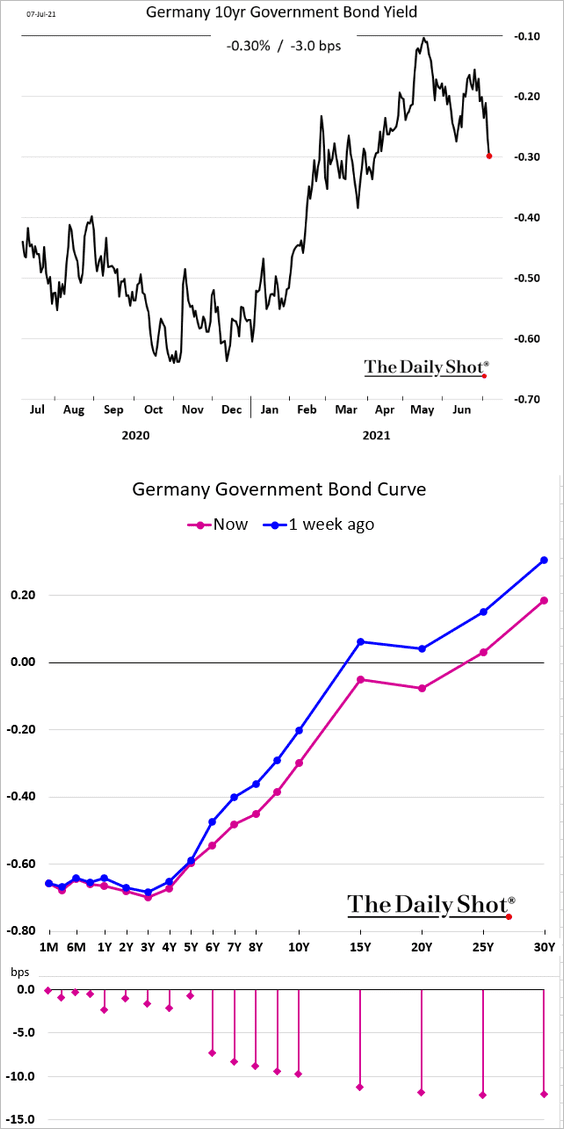
1. Bund yields are moving lower as the curve flattens (similar to other markets).
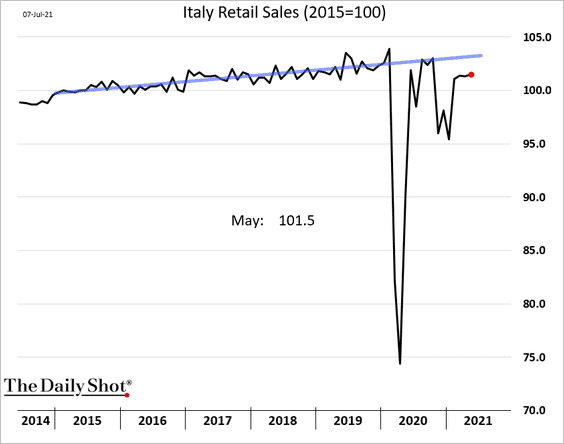
2. Italian retail sales are running below the pre-COVID trend.
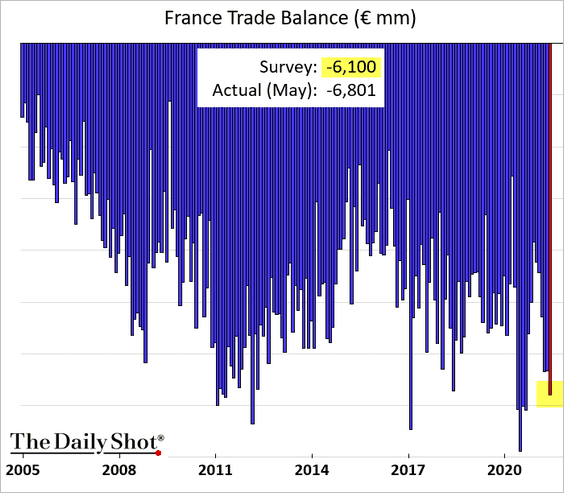
3. The trade deficit in France topped forecasts.
4. This chart shows the corporate (as opposed to labor) profit share over time.
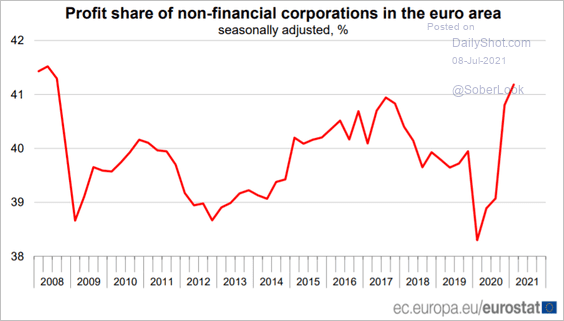 Source: Eurostat Read full article
Back to Index
Europe
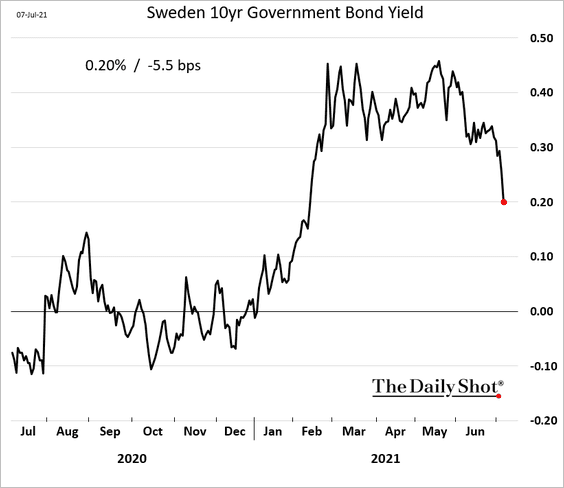
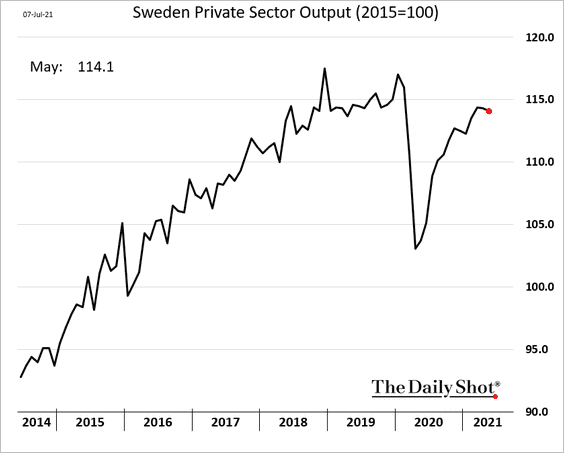
1. Let’s begin with Sweden.
• Bond yields are sharply lower:
• Private-sector output eased in May (still slightly below pre-COVID levels).
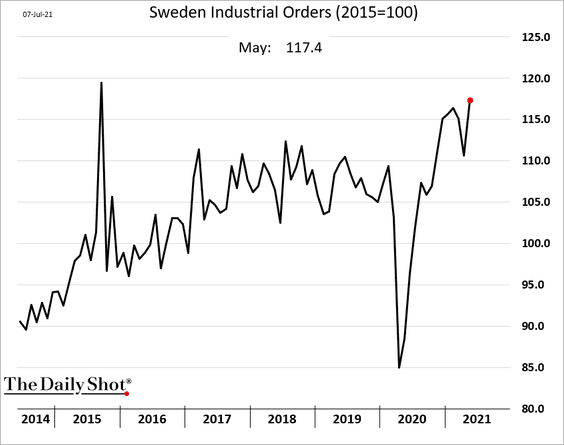
But industrial orders are surging.
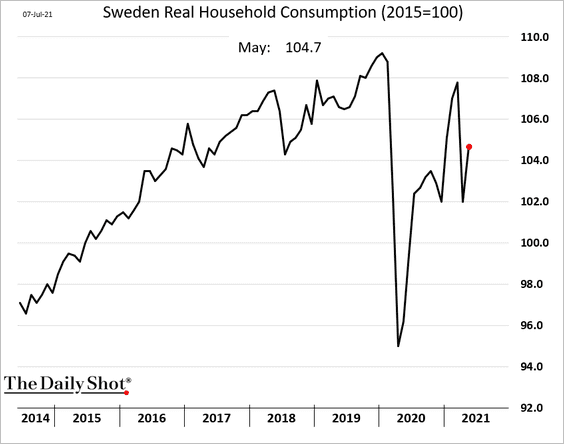
• Household consumption showed improvement in May.
——————–
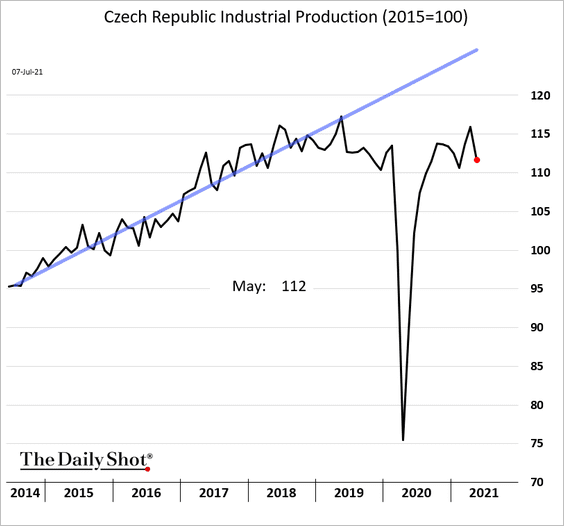
2. Czech industrial production is below the pre-2019 trend.
3. This chart shows fintech adoption by EU banks.
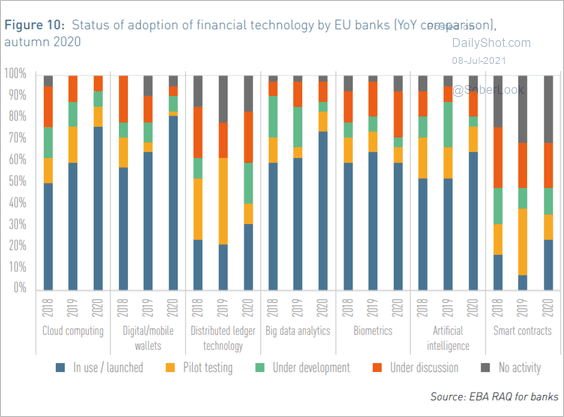 Source: European Banking Authority Read full article
4. The link between inflation and commodity prices has broken down since the 1980s.
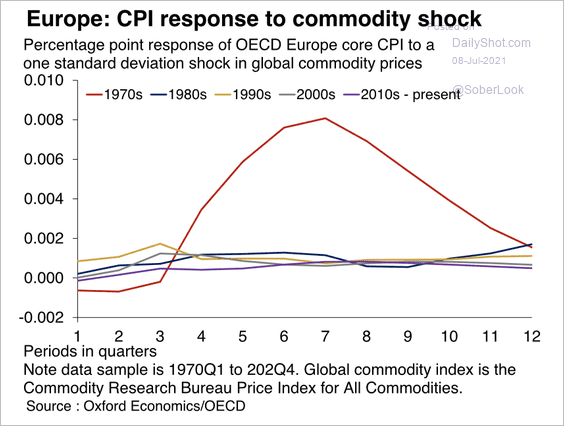 Source: Oxford Economics
Back to Index
Asia – Pacific
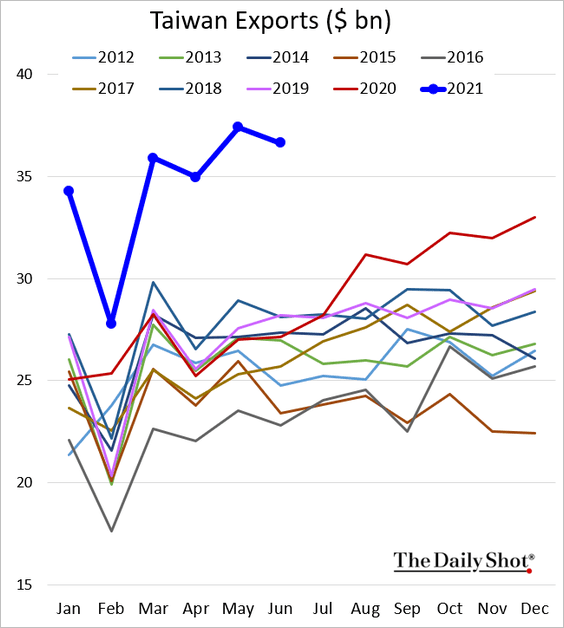
1. Taiwan’s exports remain robust.
2. Australian bond yields are tumbling.
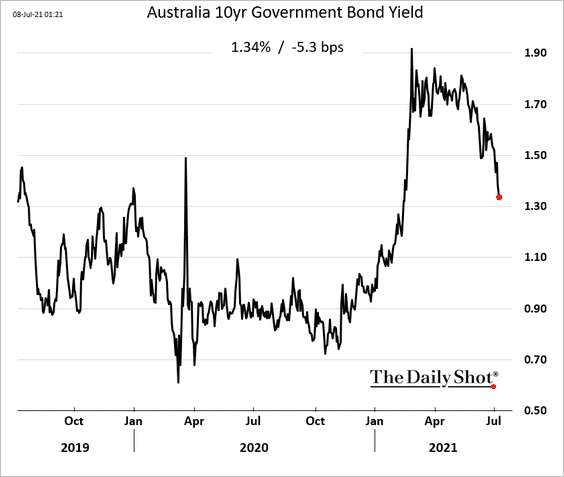
Will we see further acceleration in Australian home price appreciation?
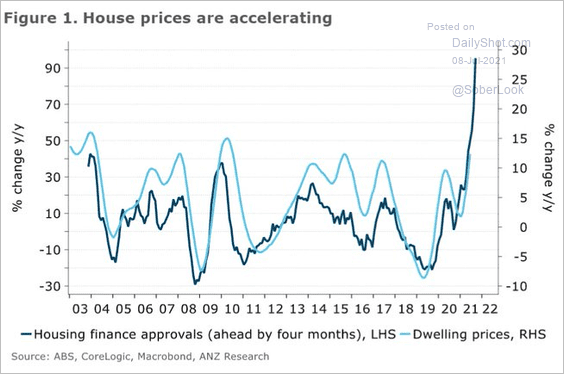 Source: ANZ Research
Back to Index
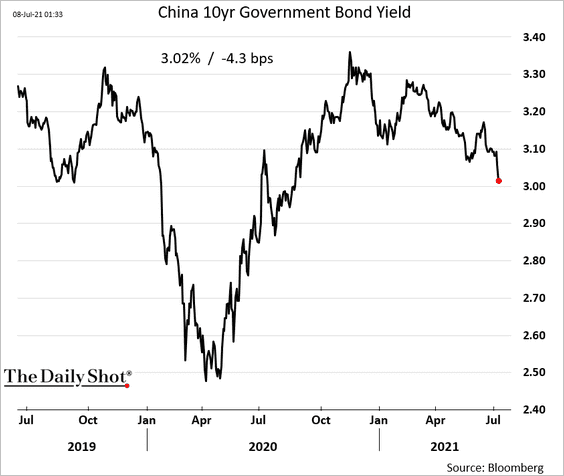
China
1. Bond yields are moving lower.
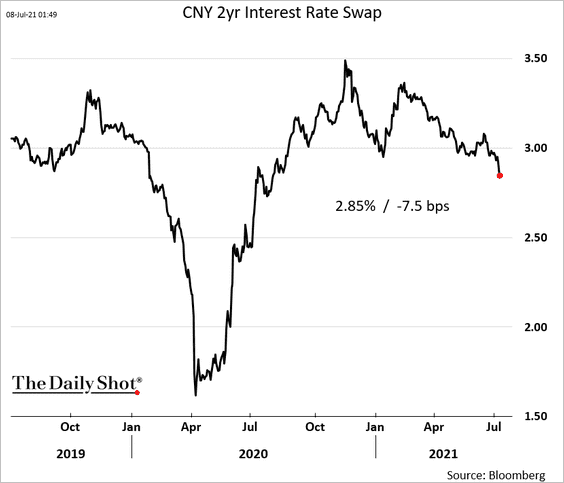
Short-term rates are declining as well.
——————–
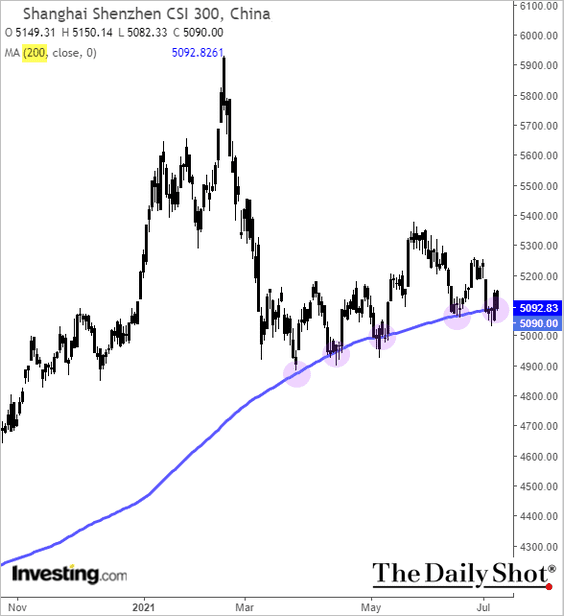
2. The benchmark equity index is at support – again.
3. Bank profits have been under pressure.
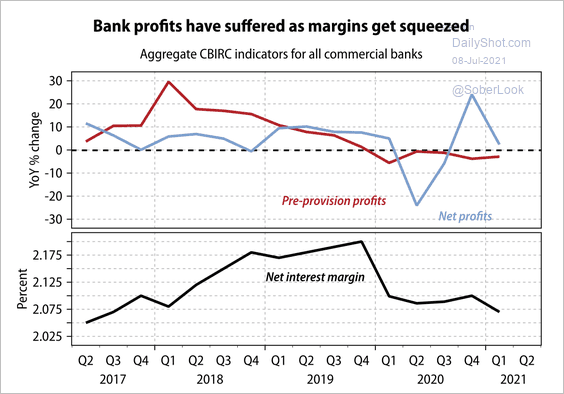 Source: Gavekal Research
4. Household assets continue to climb.
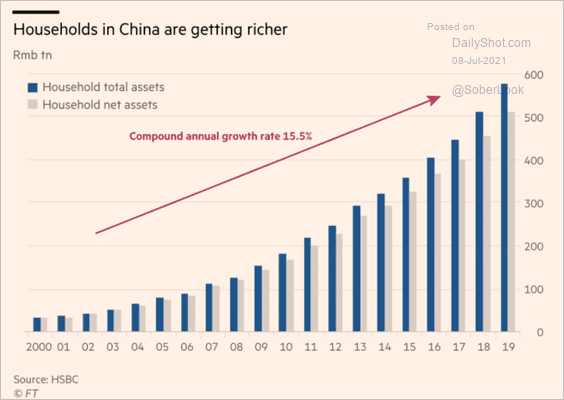 Source: @financialtimes Read full article
Back to Index
Emerging Markets
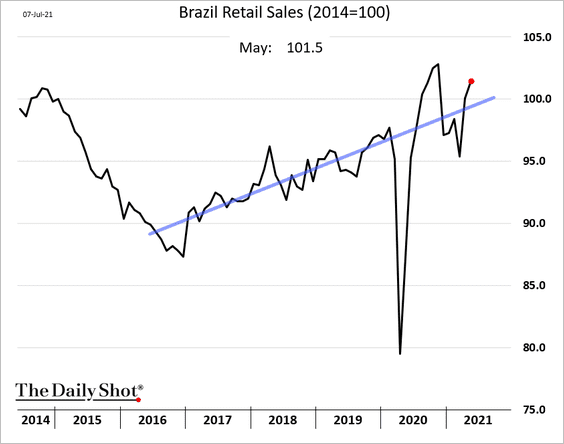
1. Retail sales in Brazil are back above the pre-COVID trend.
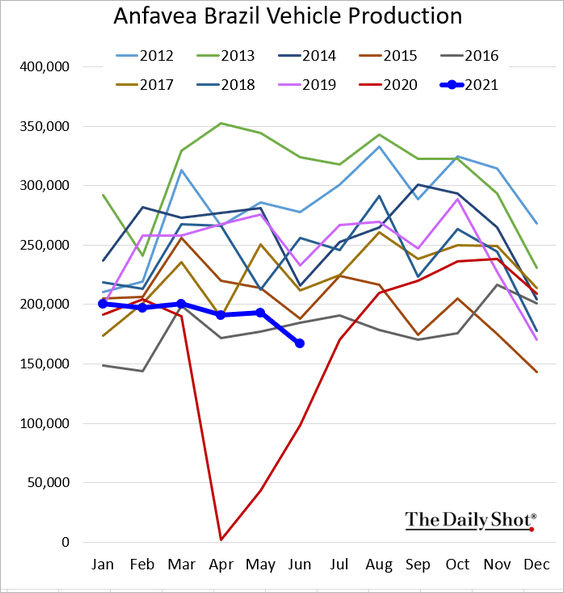
Vehicle production has been soft.
——————–
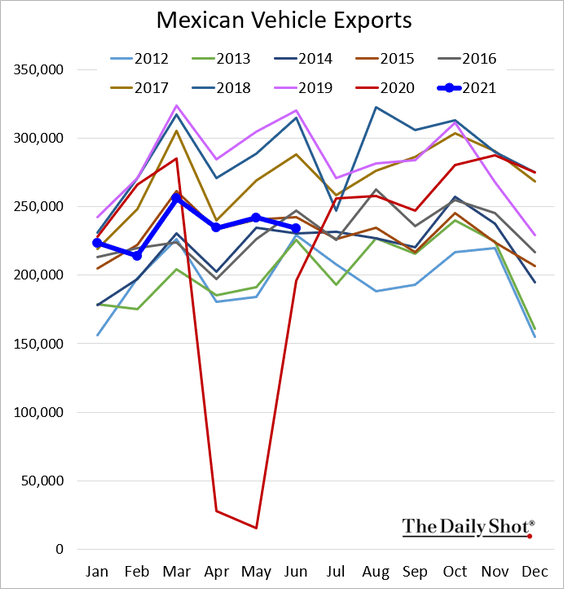
2. Mexican vehicle exports are moving in the wrong direction.
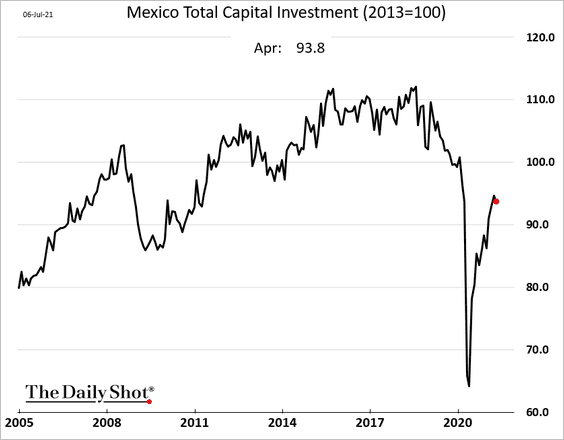
CapEx stalled in April.
——————–
3. Capital is fleeing Peru amid concerns about the incoming leftist government.
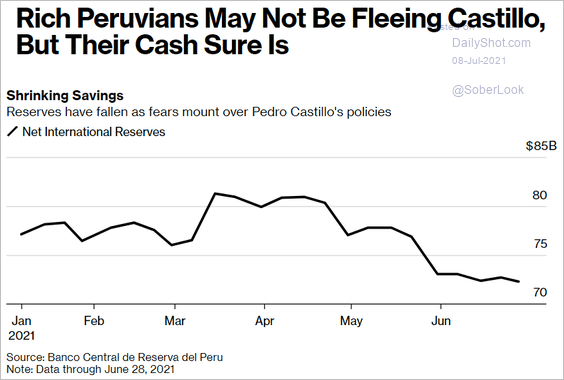 Source: @bpolitics Read full article
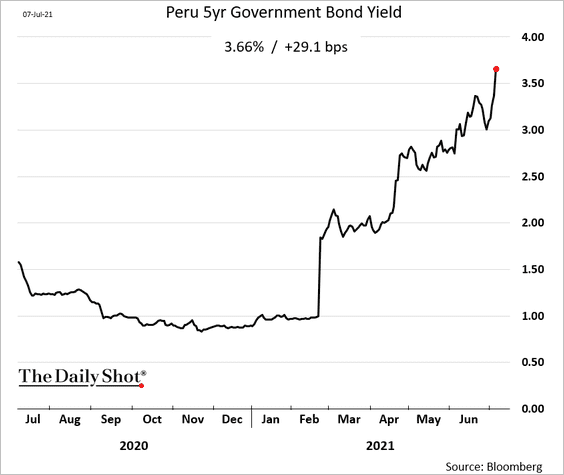
Bond yields are up sharply.
——————–
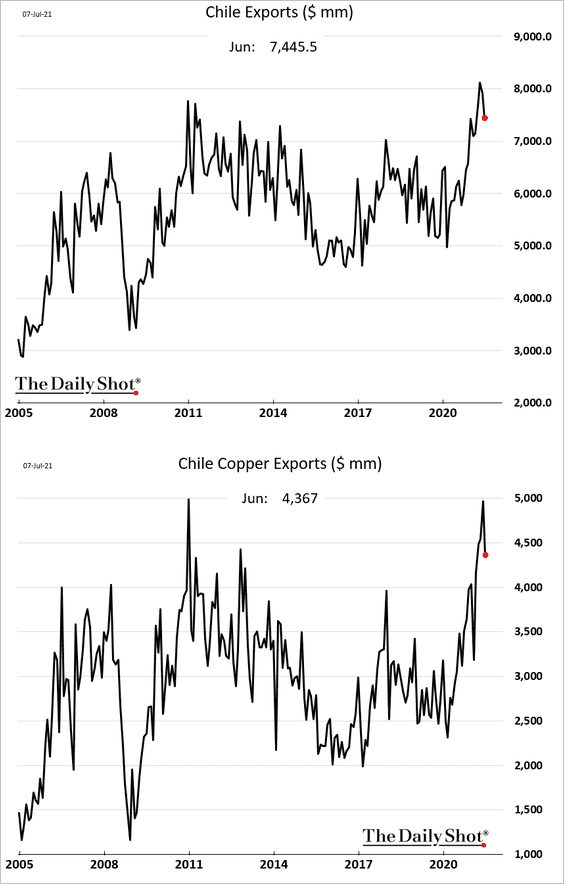
4. Chilean exports pulled back from the highs in June.
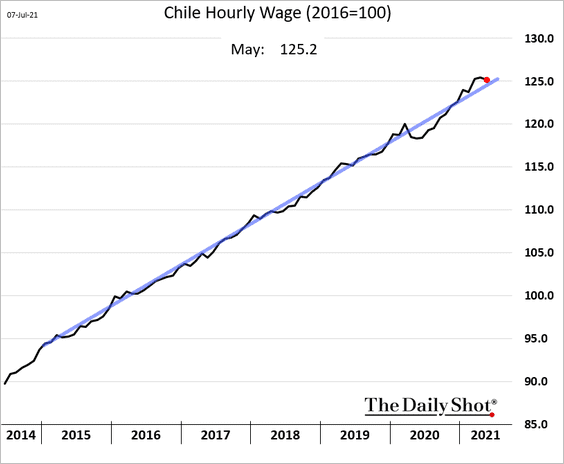
Wage growth remains steady.
——————–
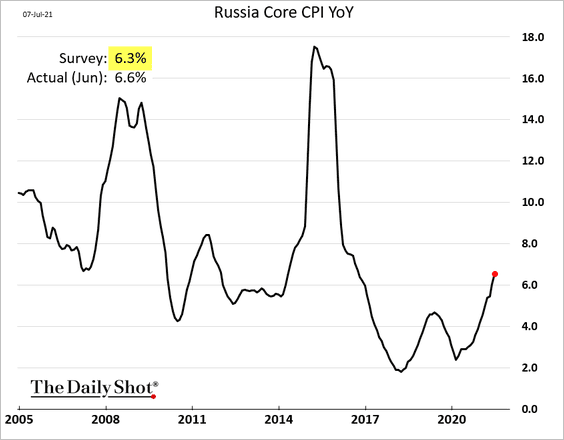
5. Russia’s CPI surprised to the upside again. More rate hikes are on the way.
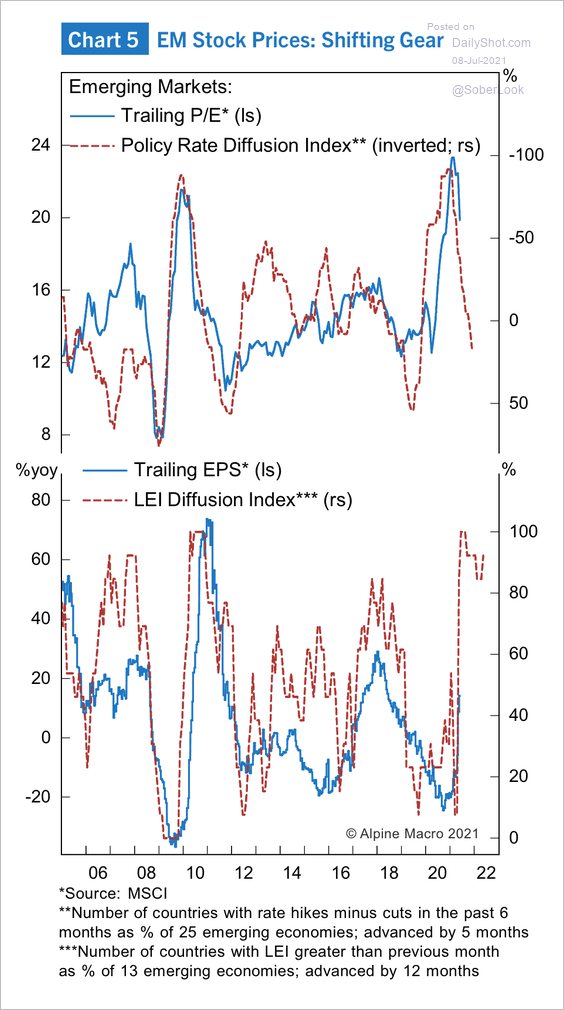
6. EM equity multiples have been contracting as central banks tighten policy. But a strong growth recovery could boost earnings.
 Source: Alpine Macro
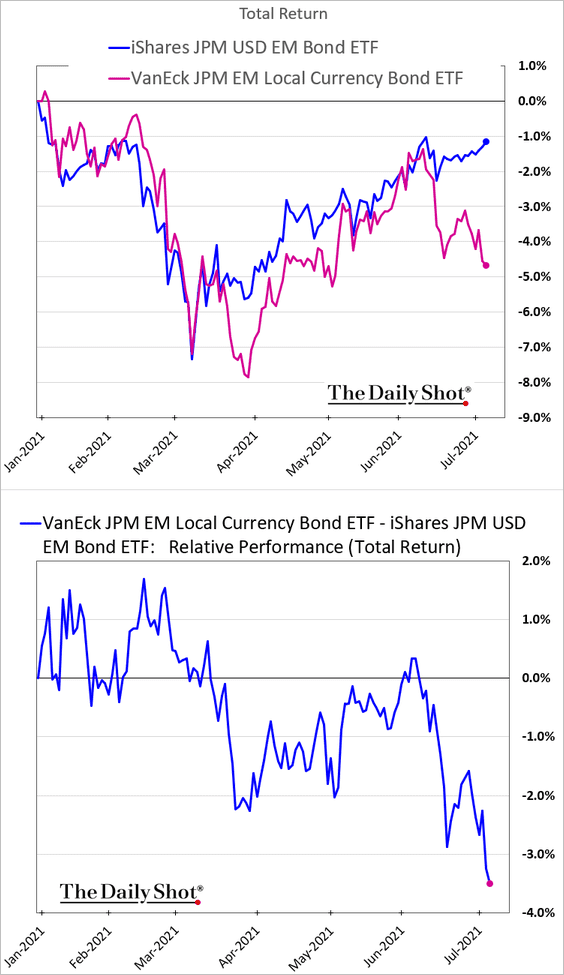
7. Local currency bonds have sharply underperformed USD-denominated debt (in dollar terms).
Back to Index
Cryptocurrency
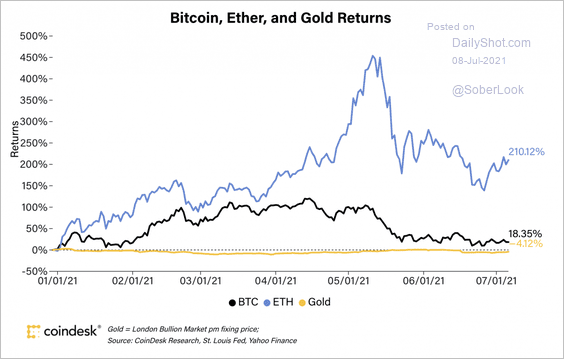
1. Ether has significantly outperformed Bitcoin and gold this year.
 Source: CoinDesk
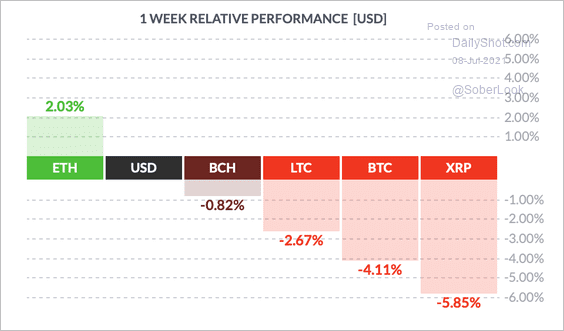
Ether has also outperformed other top cryptos over the past week.
 Source: FinViz
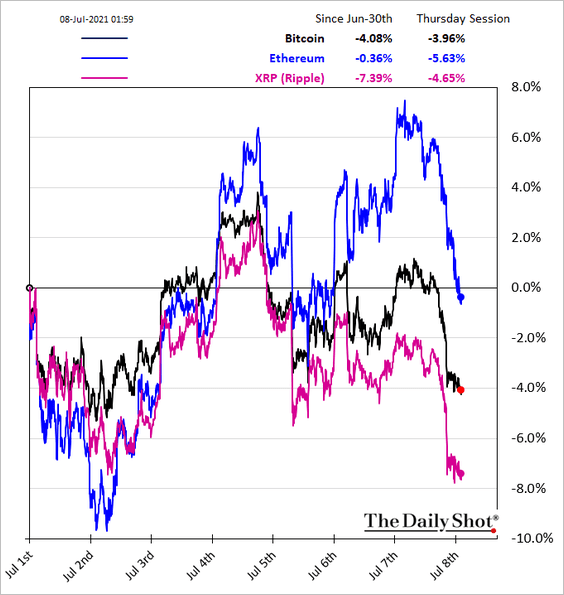
Here is the relative performance month-to-date.
——————–
2. The correlation between Bitcoin and Ethereum has risen this year. However, both cryptocurrencies have become less correlated with the S&P 500.
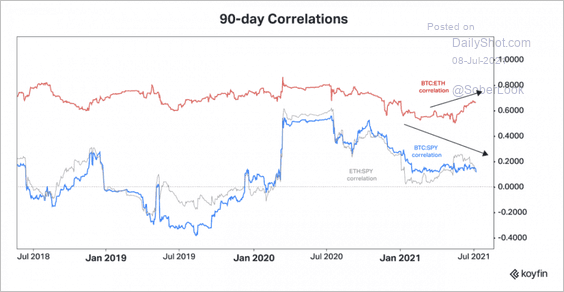 Source: Koyfin
3. Online search activity for crypto has faded.
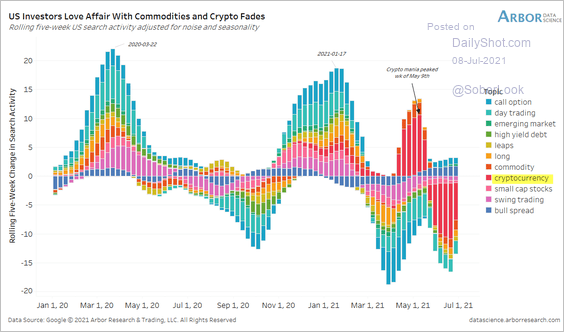 Source: Arbor Research & Trading
Back to Index
Energy
1. If there is no deal to boost production, the market expects increased cheating from OPEC+ members. Oil took another leg down.
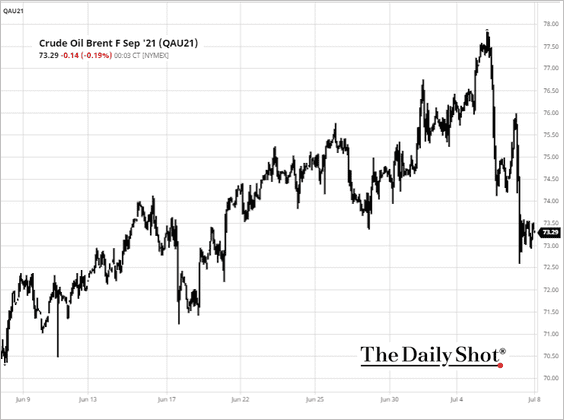 Source: barchart.com
Oil implied volatility is rising.
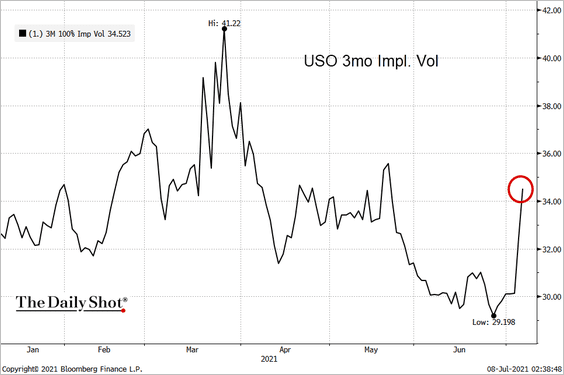 Source: @TheTerminal, Bloomberg Finance L.P.
——————–
2. Energy CapEx has been depressed.
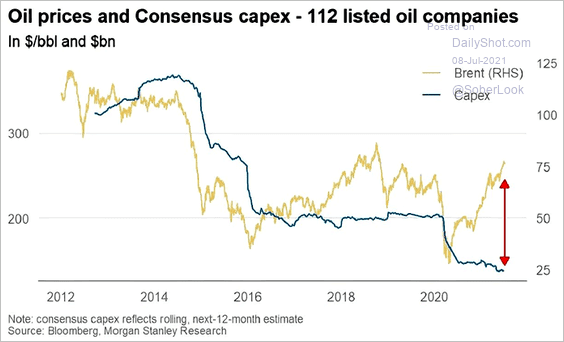 Source: @ISABELNET_SA, @MorganStanley
Back to Index
Equities
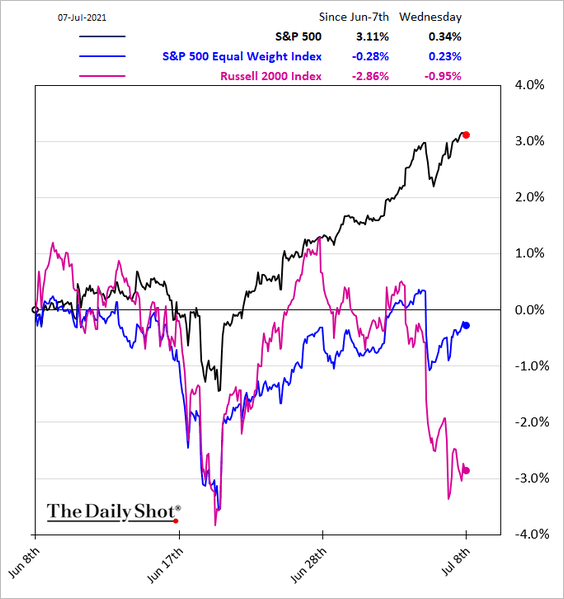
1. The rally in recent weeks has been driven by mega-cap companies – boosted by falling bond yields.
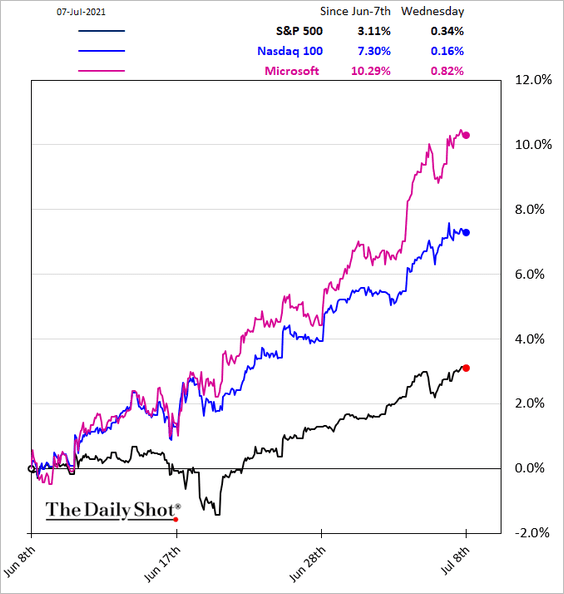
Smaller firms, however, are not participating in the rally. The Russell 2000 has underperformed the S&P 500 by some 6% over the past month.
——————–
2. The top ten firms trade at a massive premium to the rest of the S&P 500.
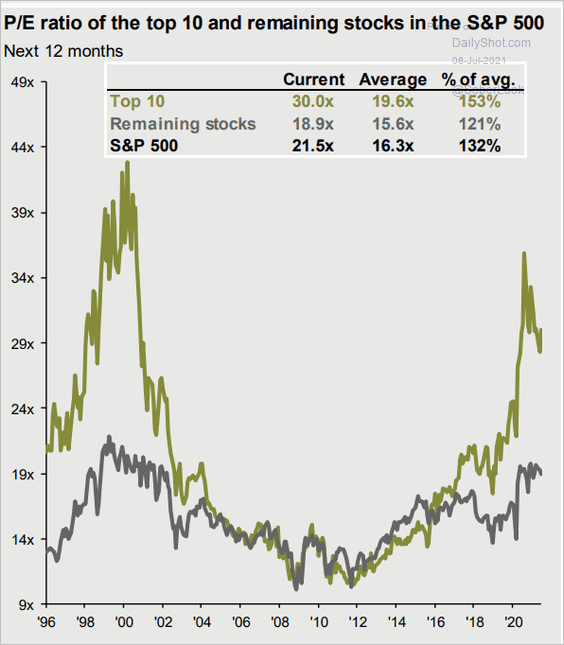 Source: @JPMorganAM
3. A slowdown in US manufacturing orders could signal weakness in high-beta shares relative to low-volatility stocks (risk-off).
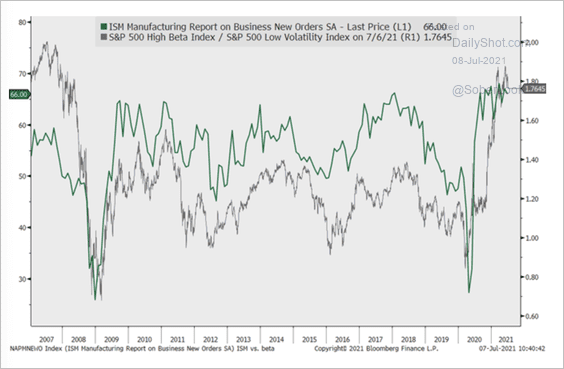 Source: Cornerstone Macro
4. Growth vs. value has been whipped around this year as bond yields pull back.
 Source: Cornerstone Macro
5. Tobin’s Q continues to signal frothy valuations.
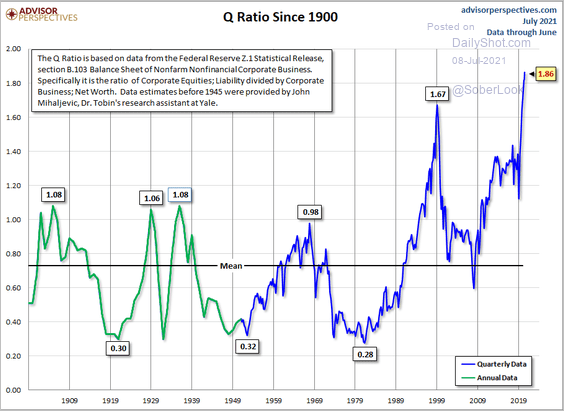 Source: @JillMislinski Read full article
6. The surge in S&P 500 indexed assets has been impressive.
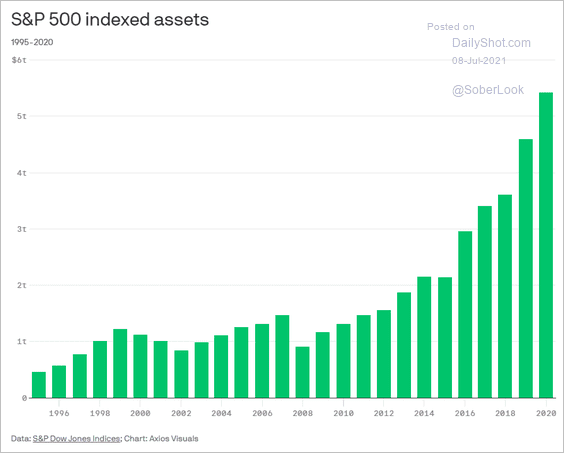 Source: @axios Read full article
7. SPAC IPOs have been smaller lately.
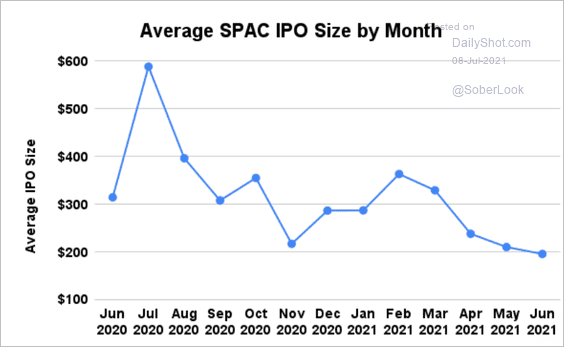 Source: @GunjanJS
Back to Index
Credit
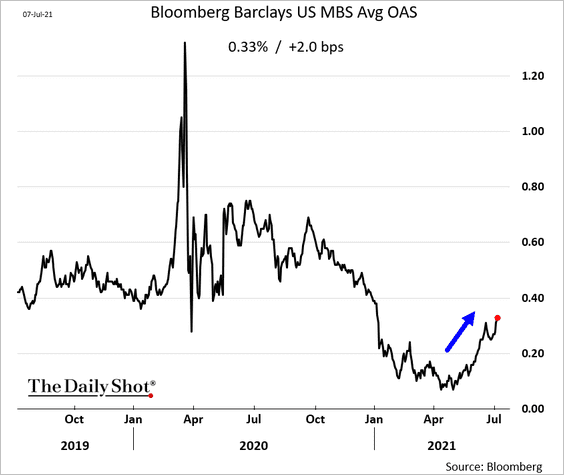
1. MBS spreads have been widening.
2. Investment-grade loan issuance surged this year.
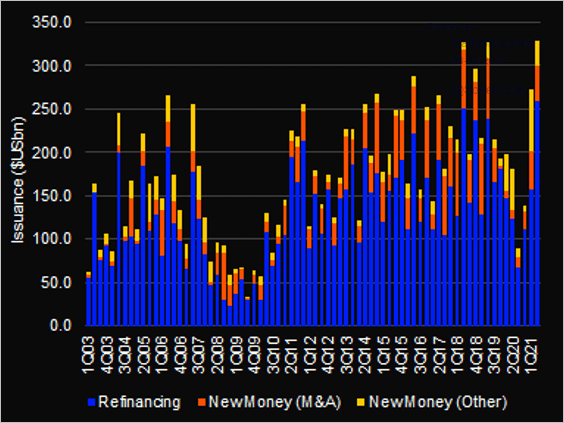 Source: @LPCLoans
3. Investors like bonds with ESG penalties.
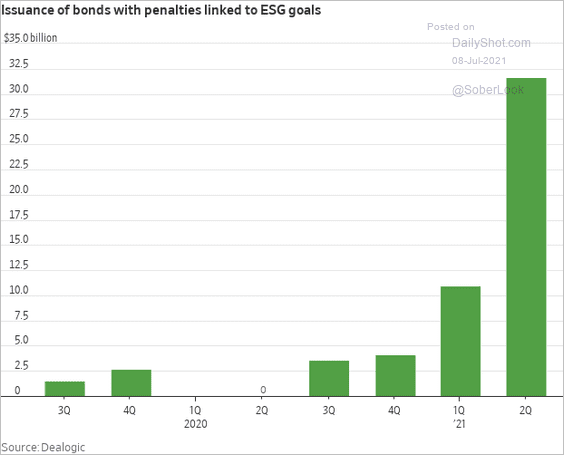 Source: @WSJ Read full article
Back to Index
Rates
1. The 10yr Treasury yield broke below support.
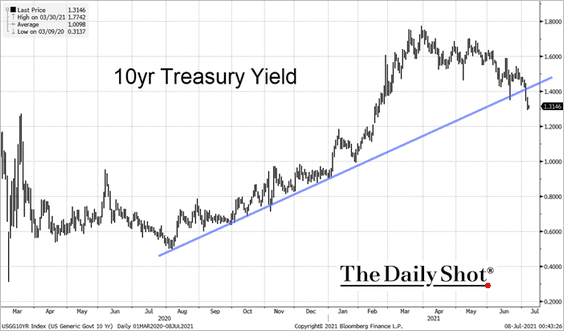 Source: @TheTerminal, Bloomberg Finance L.P.
2. The shadow fed funds rate shows extraordinary monetary accommodation.
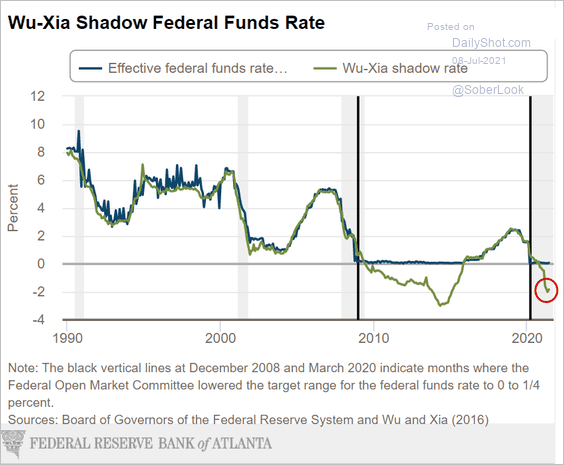 Source: @AtlantaFed Read full article
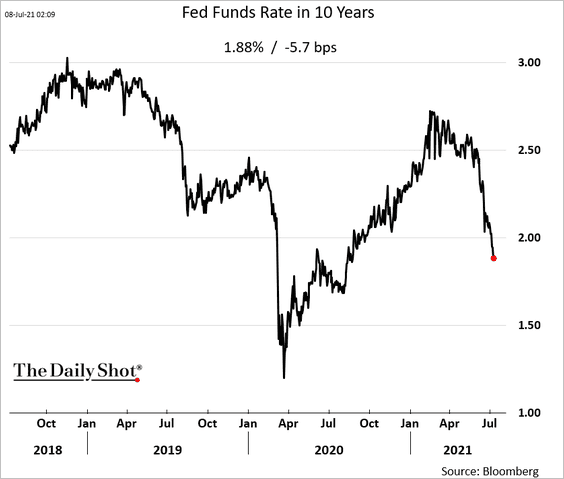
3. Market expectations for the fed funds rate a decade out (“terminal” rate) has been declining rapidly.
Back to Index
Global Developments
1. The US dollar index (DXY) is at resistance.
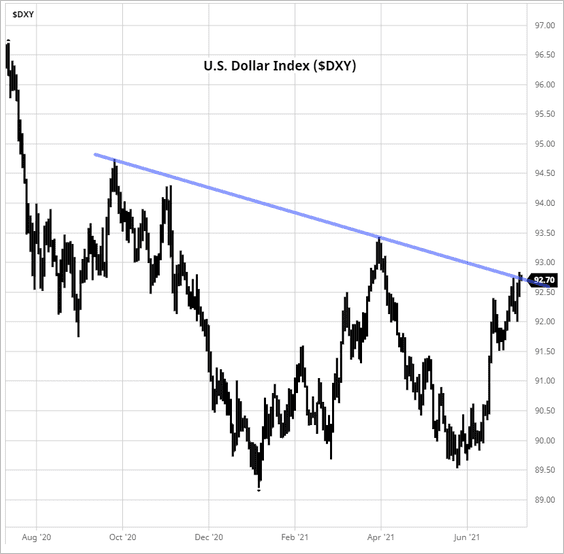 Source: barchart.com
2. Here is the bond market structure in select economies.
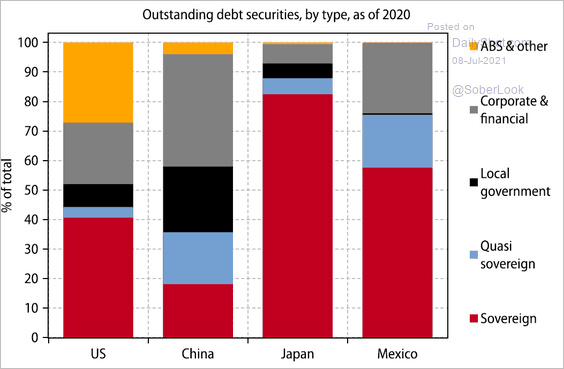 Source: Gavekal Research
3. Equities and bonds diverged during the taper tantrum.
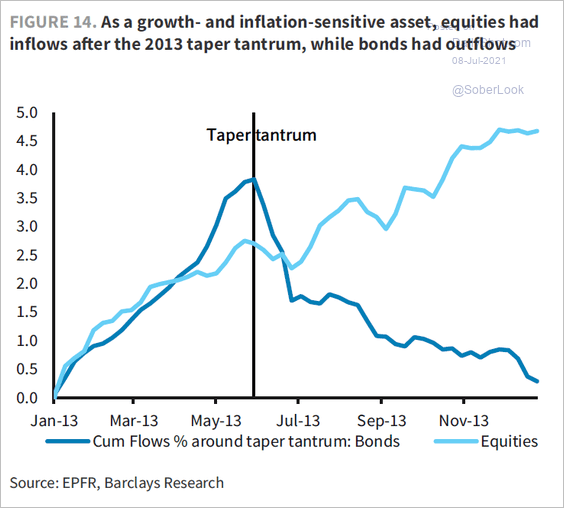 Source: Barclays Research
4. Households in advanced economies are sitting on massive excess savings.
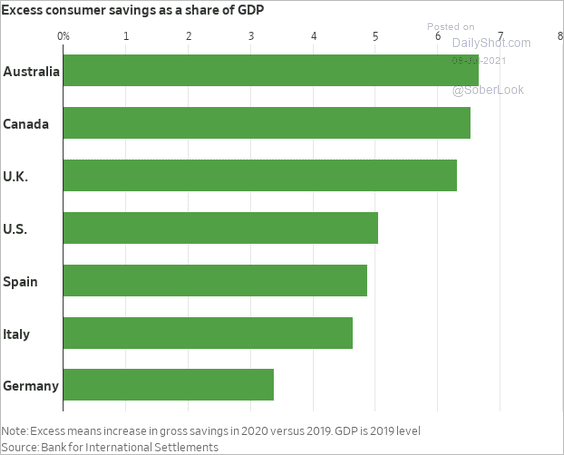 Source: @WSJ Read full article
5. The monetary boom is peaking, but inflation concerns remain.
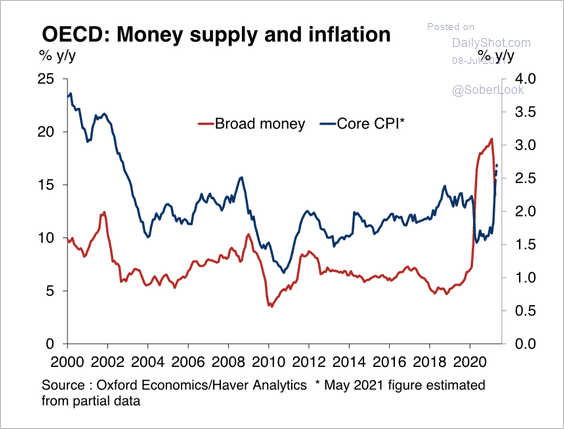 Source: Oxford Economics
——————–
Food for Thought
1. EV sales by region:
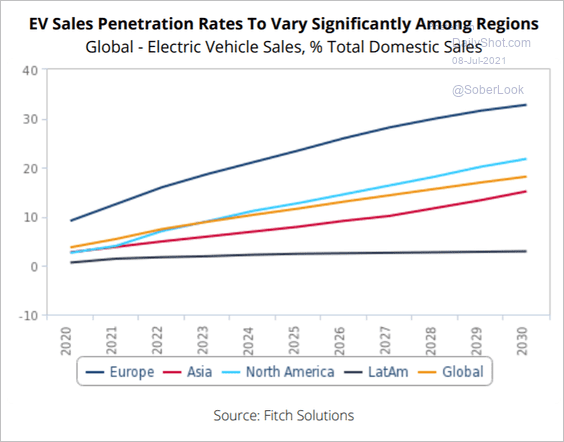 Source: Fitch Solutions Macro Research
2. Media revenues by sector:
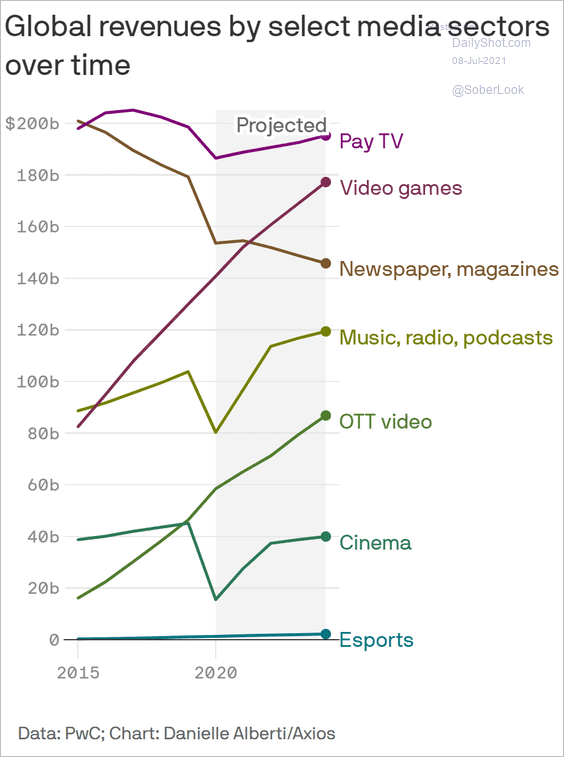 Source: @axios Read full article
3. Overdraft fees (2 charts):
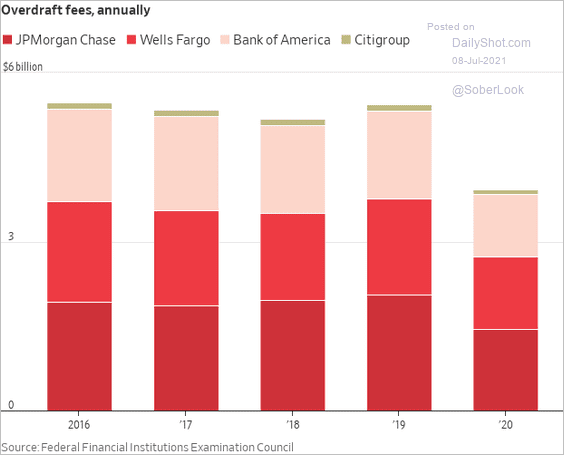 Source: @WSJ Read full article
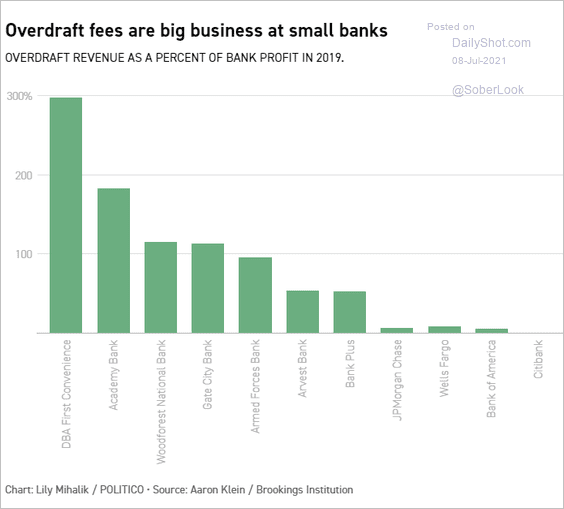 Source: Politico Read full article
——————–
4. Revenues generated from tea:
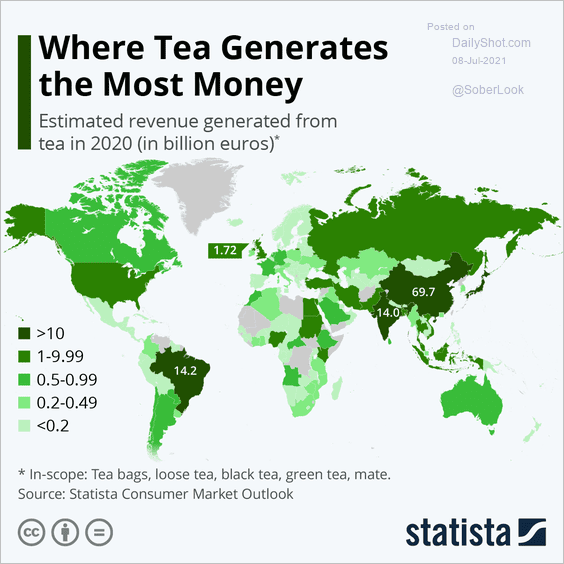 Source: Statista
5. Births and deaths of US companies:
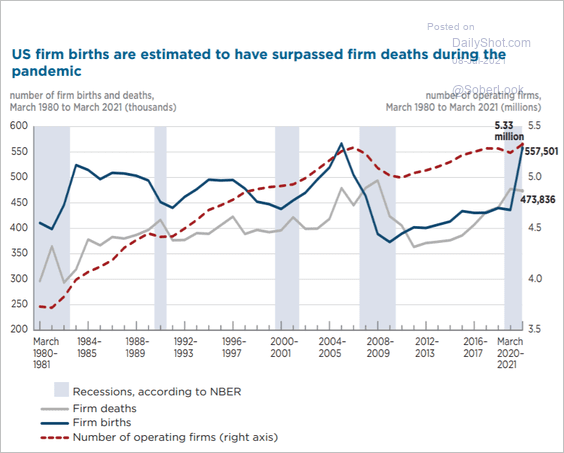 Source: PIIE Read full article
6. Countries that high-net-worth individuals are leaving:
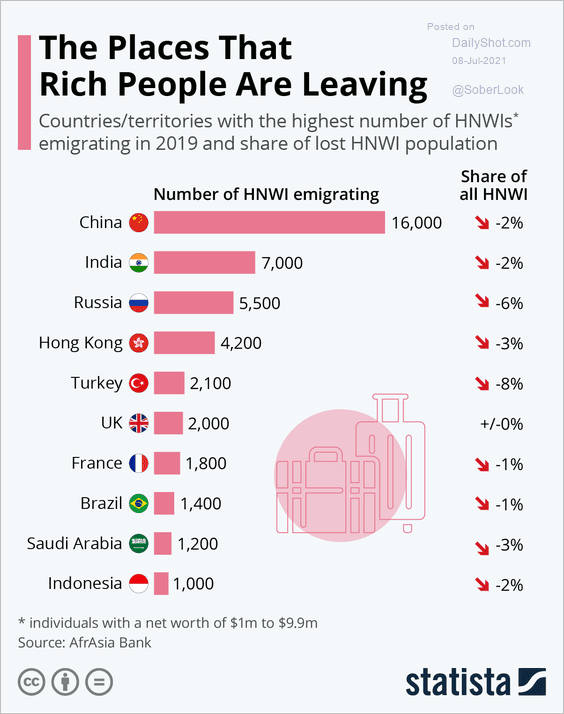 Source: Statista
7. Each state’s main export partner:
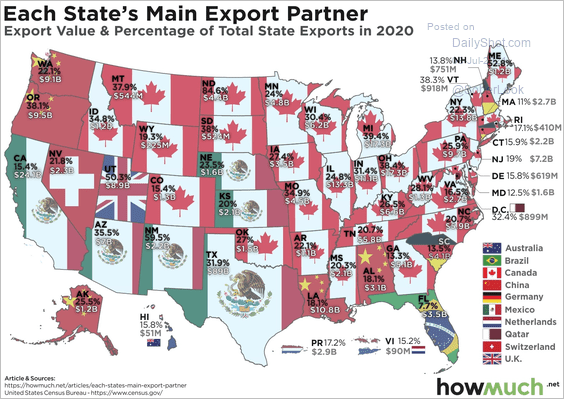 Source: @howmuch_net Read full article
8. US bankruptcies:
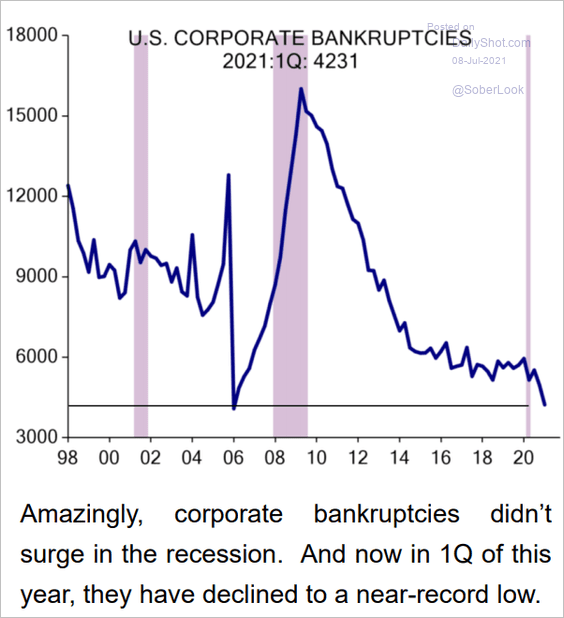 Source: Evercore ISI
9. The total number of 656 feet+ buildings:
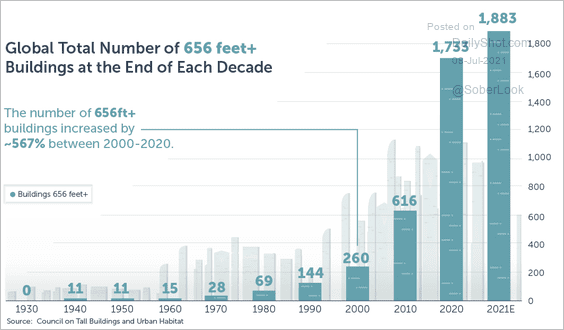 Source: Visual Capitalist Read full article
——————–
Back to Index