
The Daily Shot: 22-Jul-21
• Credit
• Equities
• Energy
• Commodities
• Rates
• Cryptocurrency
• Emerging Markets
• China
• Asia – Pacific
• The Eurozone
• The United Kingdom
• The United States
• Global Developments
• Food for Thought
Credit
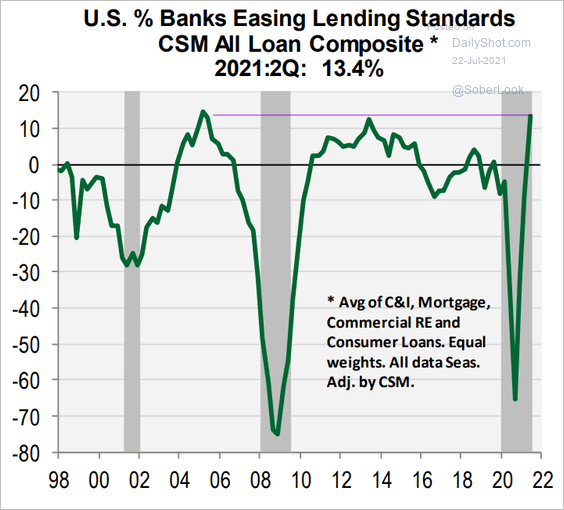
1. US aggregate lending standards haven’t been this easy since 2005.
 Source: Cornerstone Macro
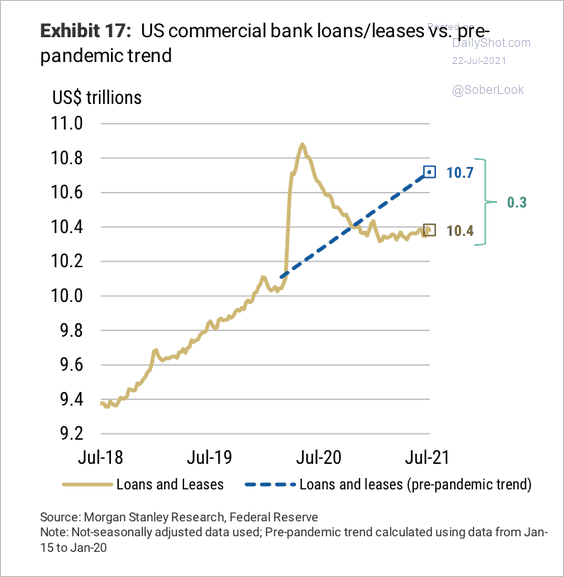
2. Loans on bank balance sheets spiked during the start of the PPP program last year. And as PPP loans were forgiven, debt on bank balance sheets fell below trend, and cash assets rose. Note that a portion of the initial spike was due to corporate accounts tapping revolving credit lines.
 Source: Morgan Stanley Research
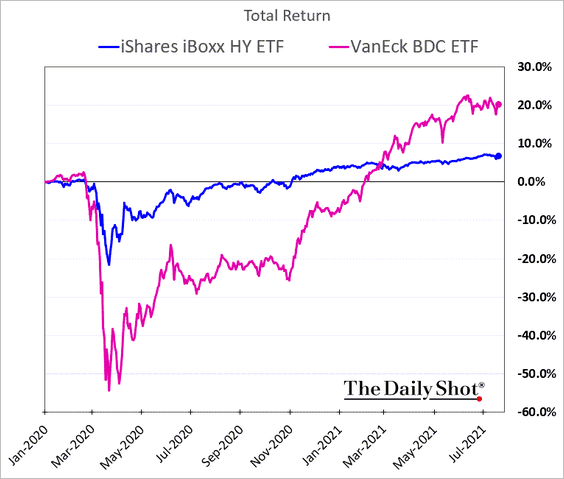
3. BDCs (lenders to smaller companies) went from a 50%+ decline at the start of the pandemic to being up over 20% since the end of 2019.
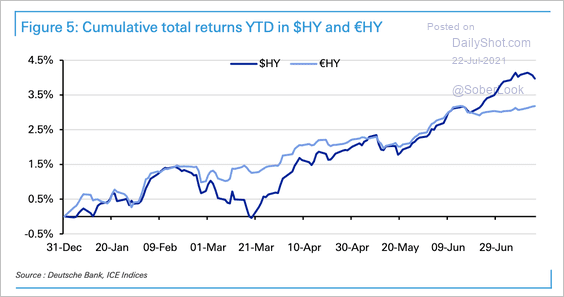
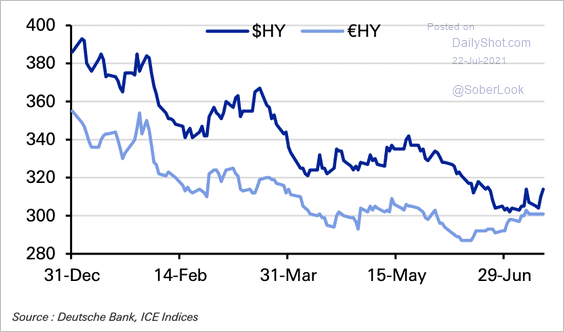
4. US high-yield debt has started to outperform European high-yield over the past month.
 Source: Deutsche Bank Research
Both US and European high-yield spreads have compressed considerably, …
 Source: Deutsche Bank Research
… and the spread differential has tightened over the past year.
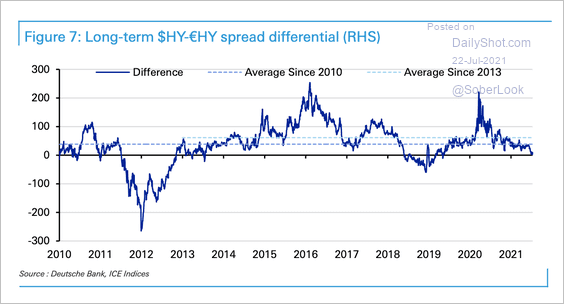 Source: Deutsche Bank Research
Back to Index
Equities
1. Dip buyers continue to provide a put option on the market (it’s become a “Pavlovian” response to market pullbacks).
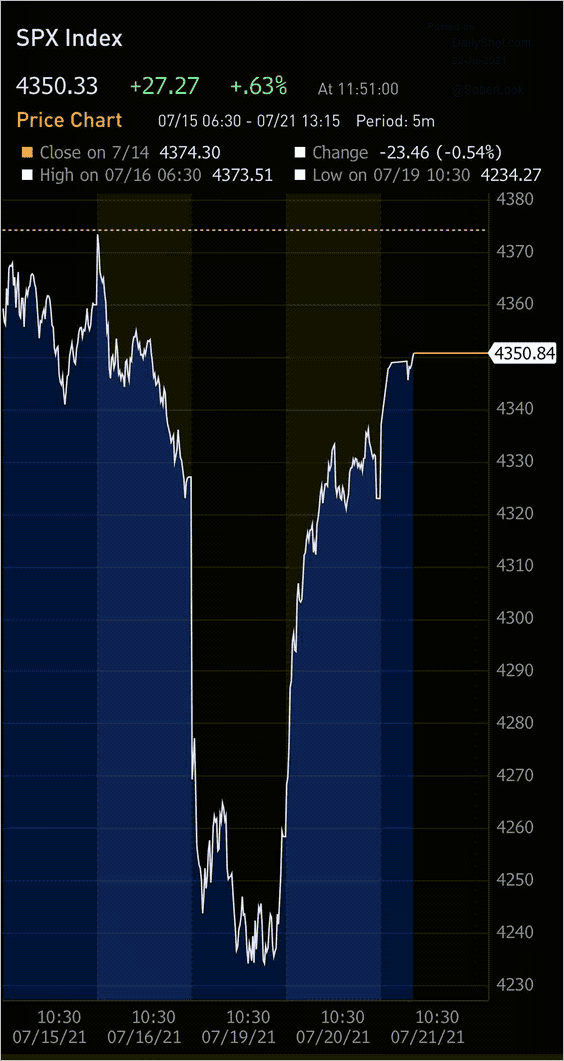 Source: Mohamed El-Erian Read full article
2. The CNN Fear & Greed Index still signals extreme fear, but that’s unlikely to last.
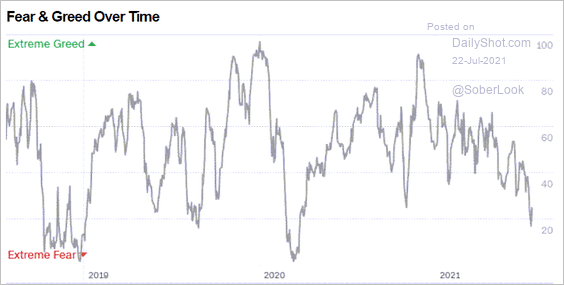 Source: CNN Business
3. Companies are increasingly raising earning guidance.
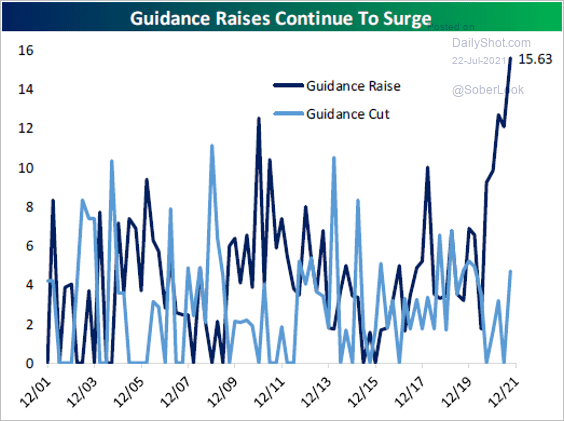 Source: @bespokeinvest Read full article
4. The value-growth relative performance seems to be diverging from the yield curve slope.
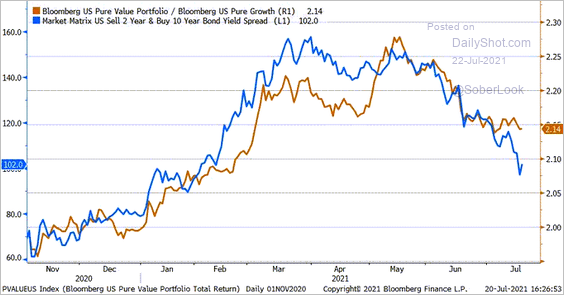 Source: @LizAnnSonders Read full article
5. Ivy League endowments continue to boost their US equity exposure.
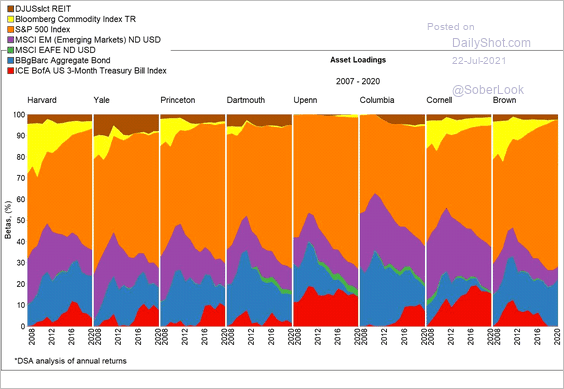 Source: Markov Processes International Read full article
Back to Index
Energy
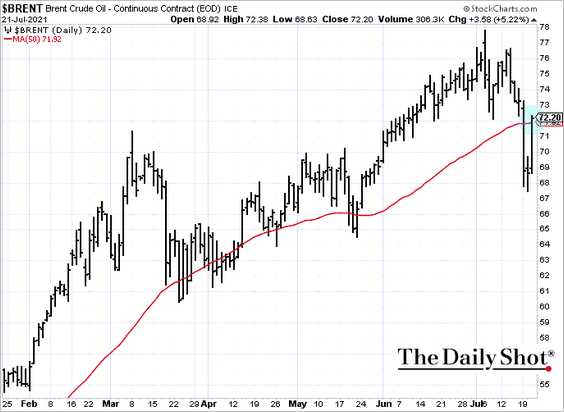
1. Brent crude is back at the 50-day moving average.
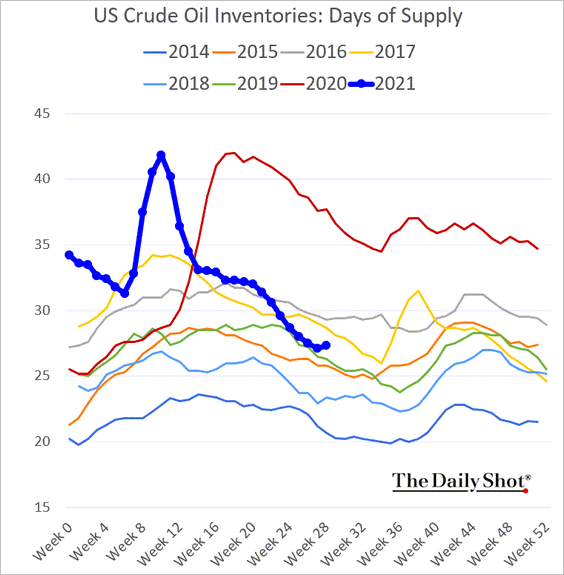
2. US crude oil inventories unexpectedly increased last week.
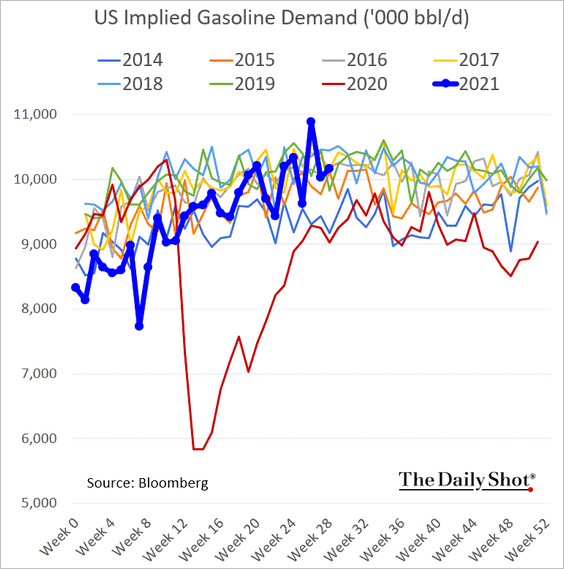
3. US gasoline demand remains robust despite higher prices.
Back to Index
Commodities
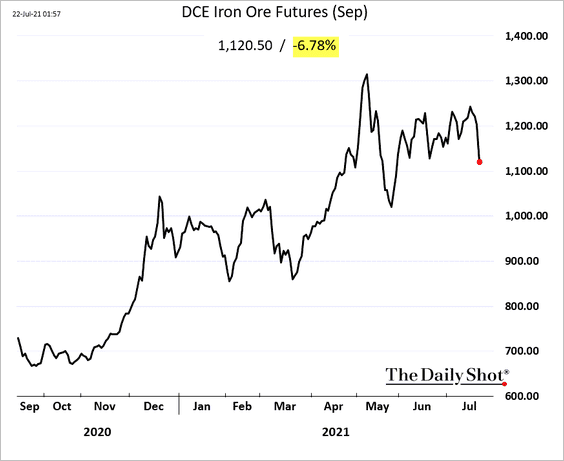
1. Iron ore took a hit this morning.
• Singapore:

• China (Dalian):
——————–
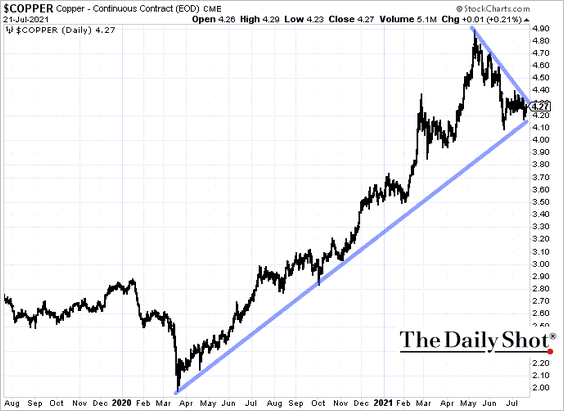
2. Copper has been consolidating.
3. Gold has been holding up well despite a stronger US dollar.
 Source: Longview Economics
4. Oxford Economics expects commodity prices to decline next year.
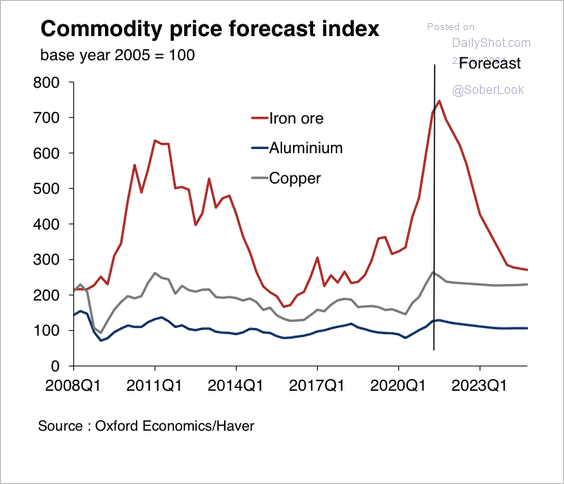 Source: Oxford Economics
5. Next, we have some updates on US lumber.
• Lumber drawdown exceeded 70% from the peak.
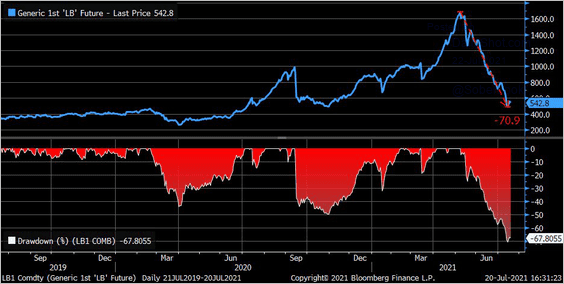 Source: @LizAnnSonders
• Lumber futures positioning turned net-short given the sharp price decline.
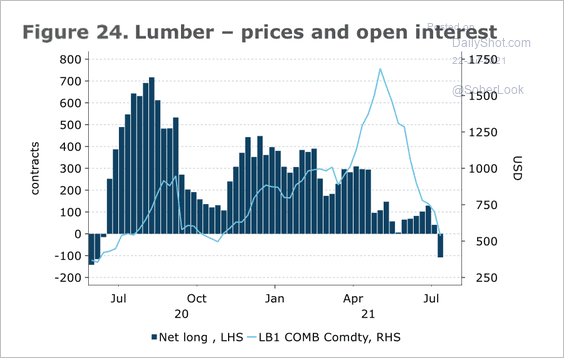 Source: ANZ Research
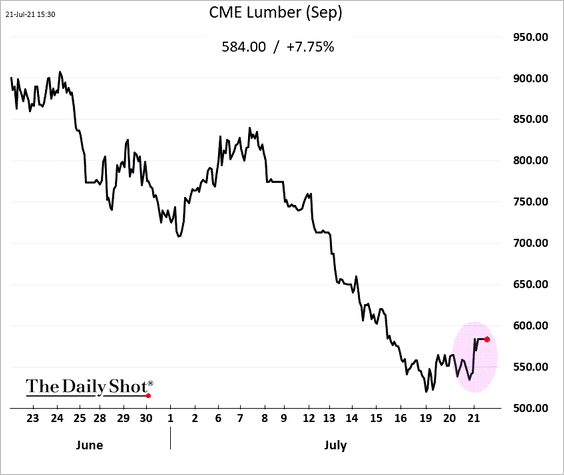
• But short-sellers got punished this week, as Canadian wildfires …
 Source: News 1130 Read full article
… caused a short squeeze.
Back to Index
Rates
JP Morgan’s clients cut back their bets against Treasuries.
 Source: @themarketear
Back to Index
Cryptocurrency
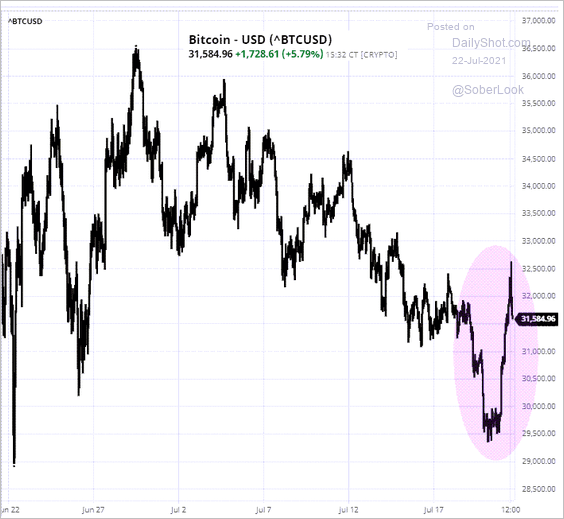
1. Our friend Elon returned to pump Bitcoin.
 Source: CoinDesk Read full article
 Source: barchart.com
——————–
2. The number of open positions in Bitcoin futures continues to rise as some analysts noted a proliferation of short-sellers prior to the $30K price dip.
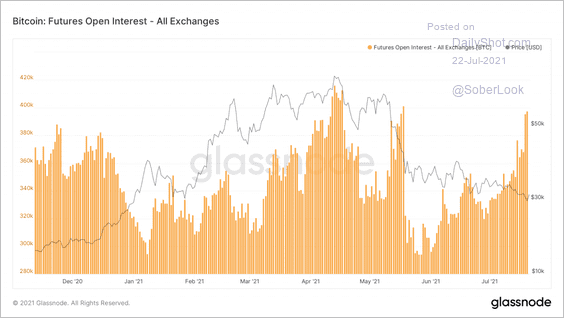 Source: Glassnode Read full article
But Elon’s comments flushed out short-sellers.
 Source: CoinDesk Read full article
——————–
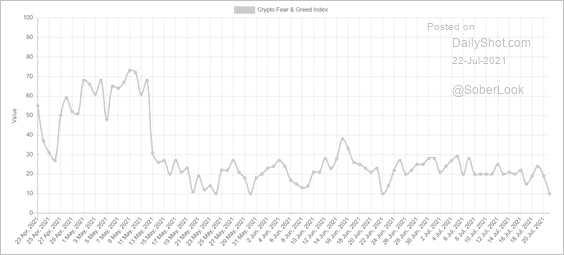
3. The Crypto Fear & Greed index reached its lowest level since June 22 on Tuesday.
 Source: @WuBlockchain
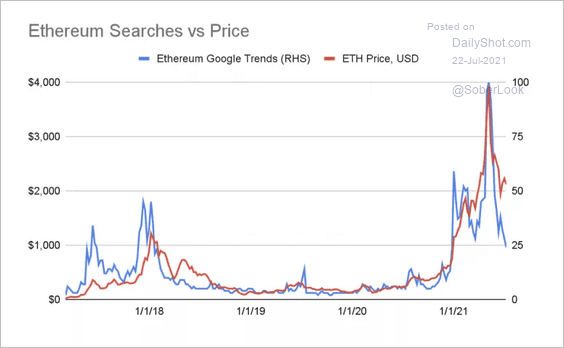
4. Google searches for Bitcoin and Ethereum have declined along with price this year (2 charts).
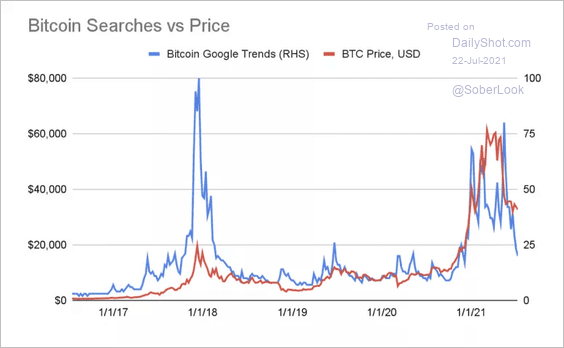 Source: Coin Metrics
 Source: Coin Metrics
Back to Index
Emerging Markets
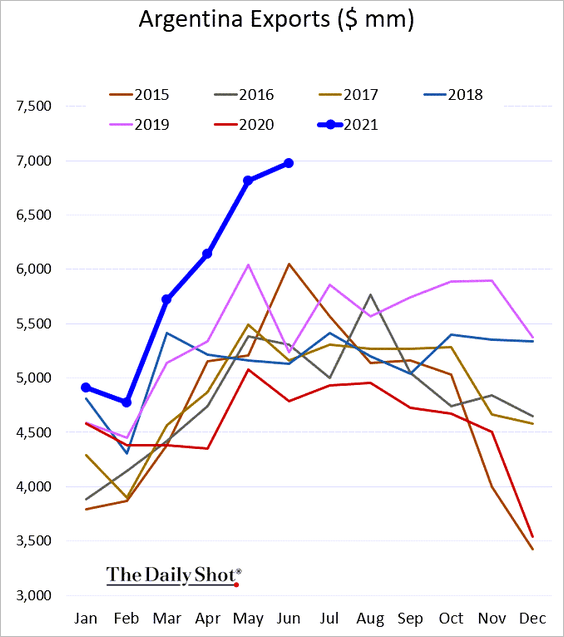
1. Let’s begin with Argentina.
• Exports remain elevated, boosted by high commodity prices.
• Economic activity slumped in May.
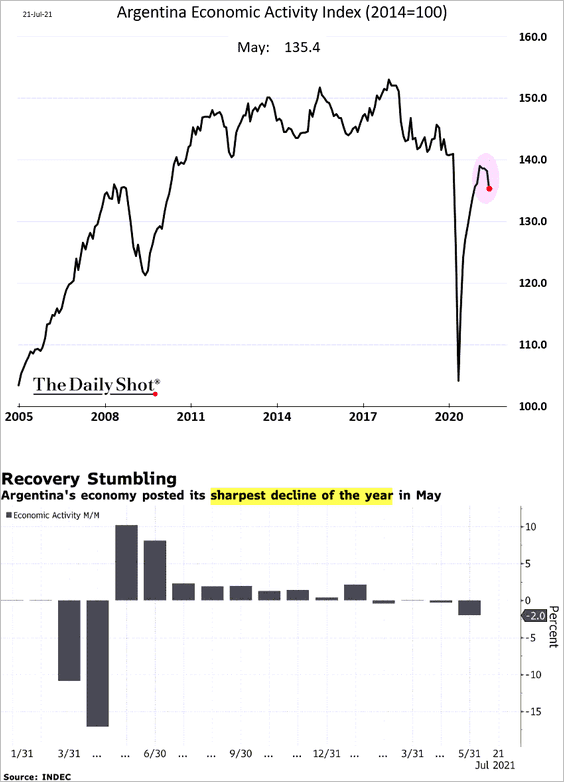 Source: Bloomberg Read full article
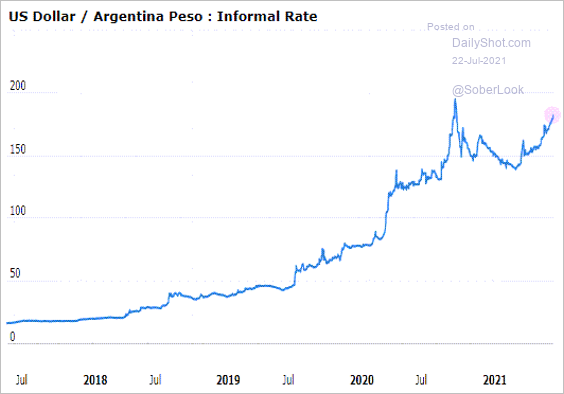
• With midterm elections coming up in November, demand for dollars is surging again. The dollar is approaching record highs (peso near record lows) in the “unofficial” market.
 Source: Blue Dollar
——————–
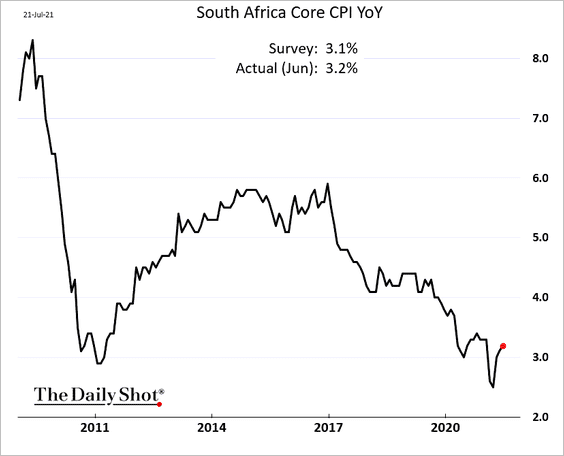
2. South Africa’s inflation is rebounding.
3. How have sovereign bond yields changed since the start of the pandemic?
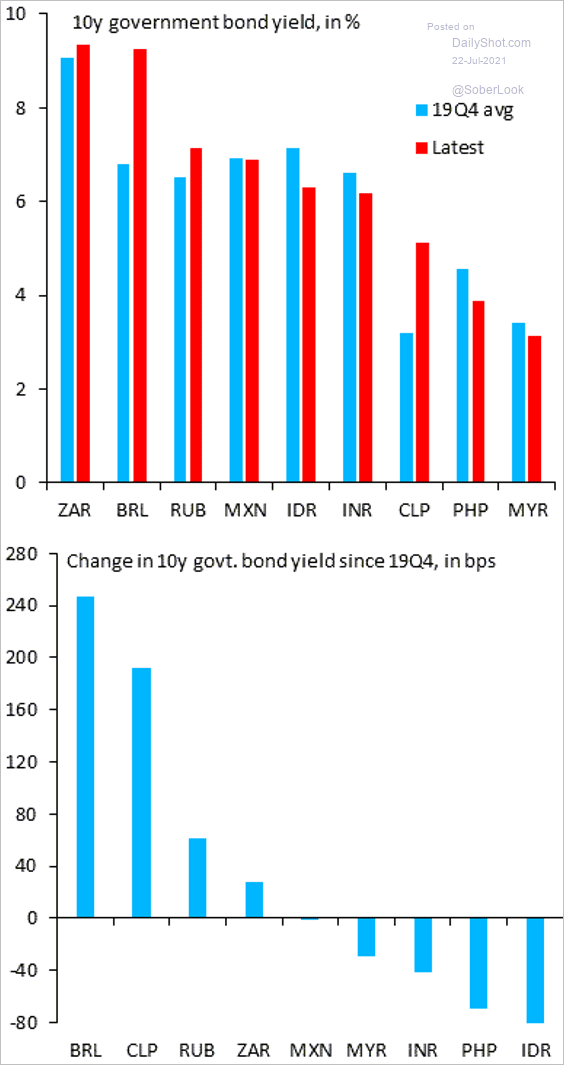 Source: @SergiLanauIIF
Back to Index
China
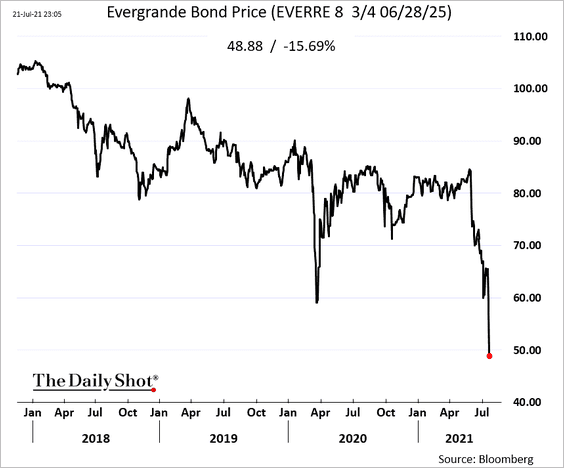
1. Evergrande’s bond price tumbled below 50c on the dollar as Hong Kong banks pull back financing.
 Source: Bloomberg Read full article
——————–
2. The China slowdown story has been a bit overblown.
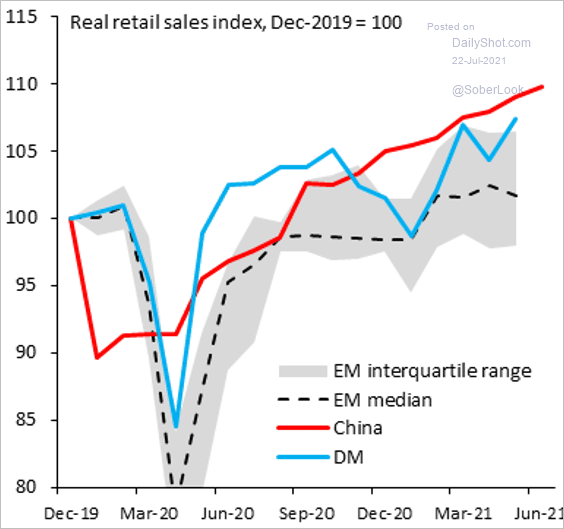 Source: @SergiLanauIIF
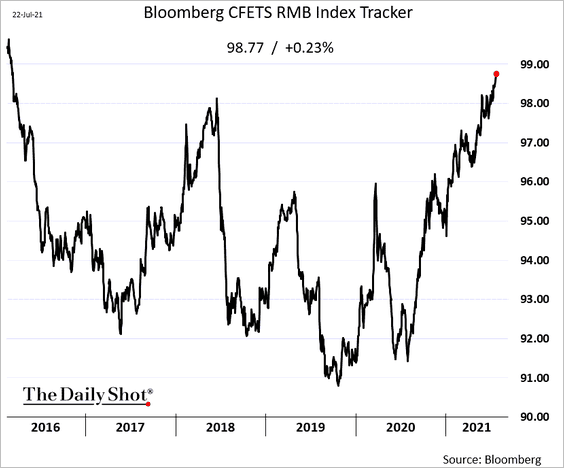
But the renminbi’s persistent strength (shown against a basket of currencies below) could become a drag on growth.
——————–
3. The Tianhong Yu’e Bao money-market fund continues to lose assets as Beijing cracks down.
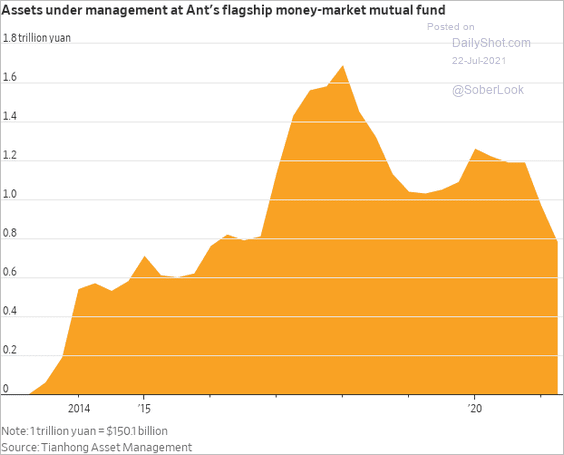 Source: @WSJ Read full article
4. Popular Chinese stocks have sold off this year partly due to regulatory risks.
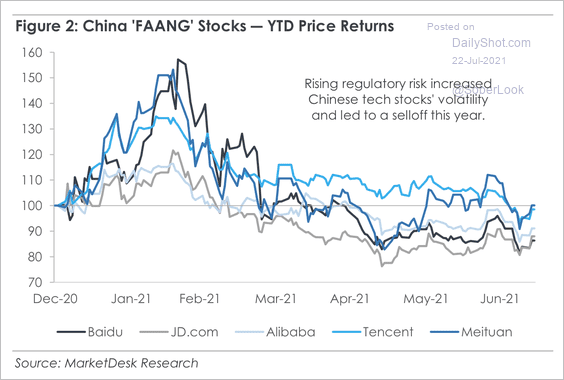 Source: MarketDesk Research
5. The iShares MSCI China ETF (MCHI) is mostly exposed to consumer discretionary and communication services stocks.
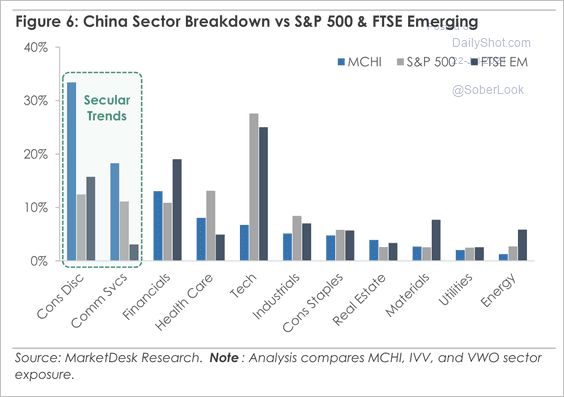 Source: MarketDesk Research
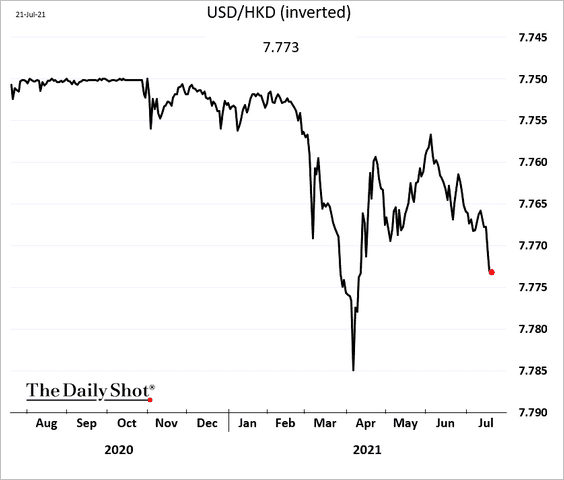
6. The Hong Kong dollar has been weakening, in part due to a softer IPO pipeline.
Back to Index
Asia – Pacific
1. This chart shows Japan’s business conditions in select sectors.
 Source: Natixis
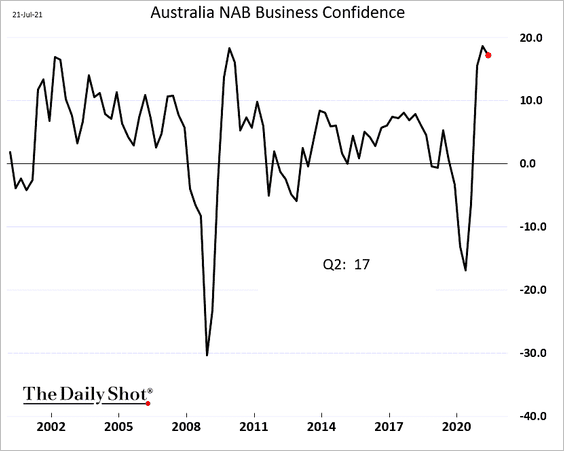
2. Australian business confidence remains elevated but is off the highs.
Back to Index
The Eurozone
1. Let’s start with ING’s scenario analysis for the ECB and the impact on the euro.
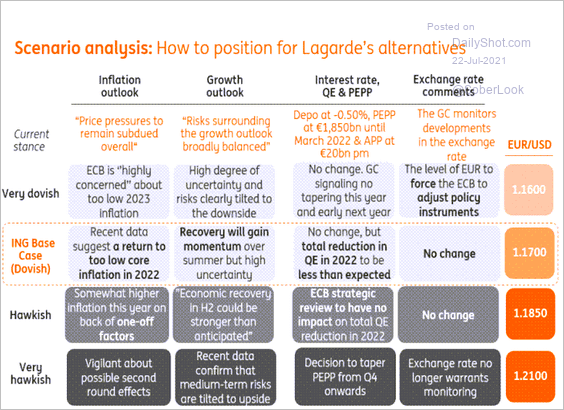 Source: ING
While the Fed actively seeks an overshoot of inflation to make up for its past misses under its new policy framework, the ECB will merely tolerate a moderate overshoot above 2%, according to BlackRock.
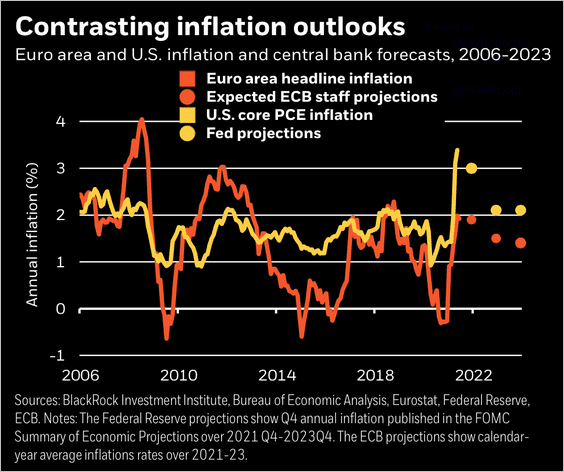 Source: BlackRock
——————–
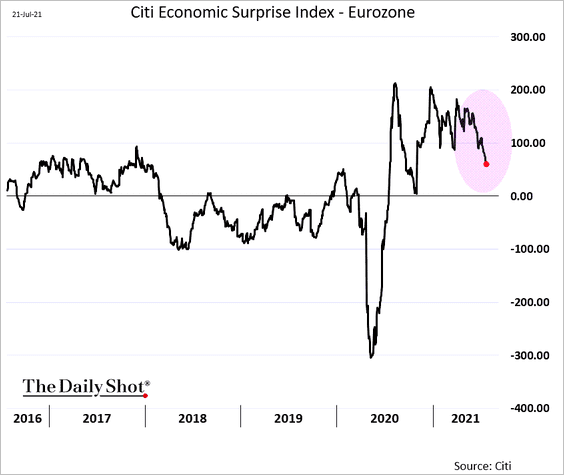
2. The Citi Economic Surprise Index shows deteriorating economic momentum.
3. The Eurozone housing market appreciation has been lagging the US.
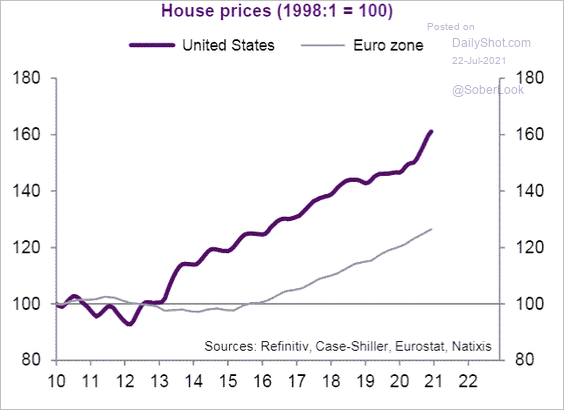 Source: Natixis
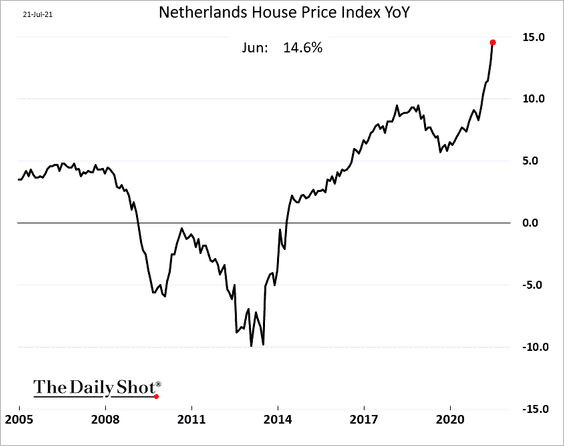
But there are pockets of exceptional strength, such as the Netherlands.
——————–
4. Italy’s industrial sales pulled back from the highs.

Back to Index
The United Kingdom
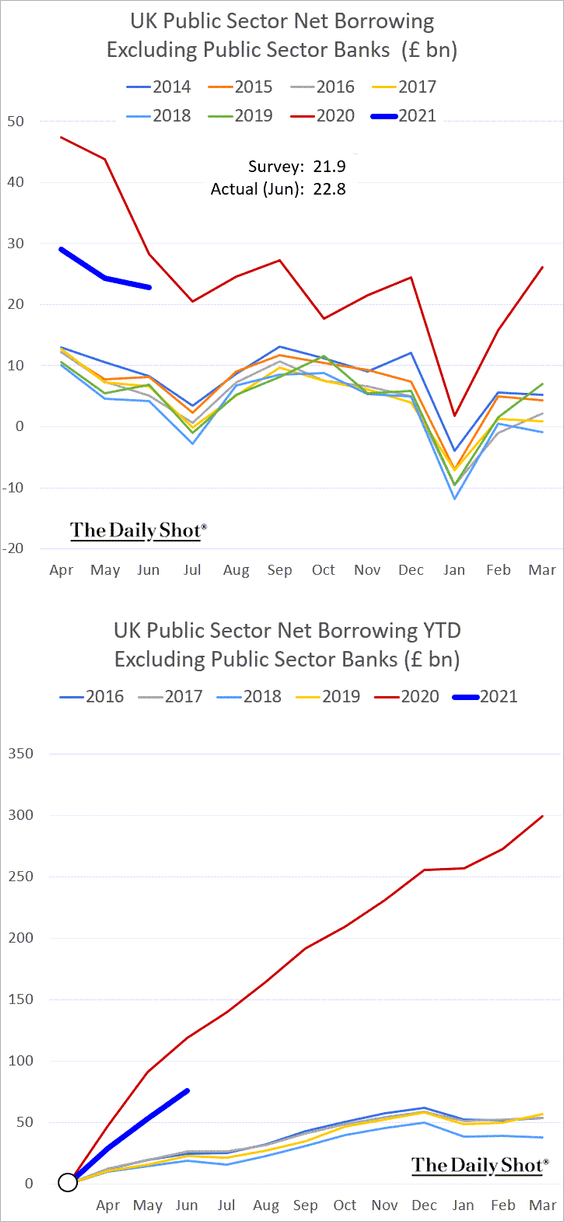
1. June public sector borrowing topped economists’ forecasts.
2. Two rate hikes by mid-2023?
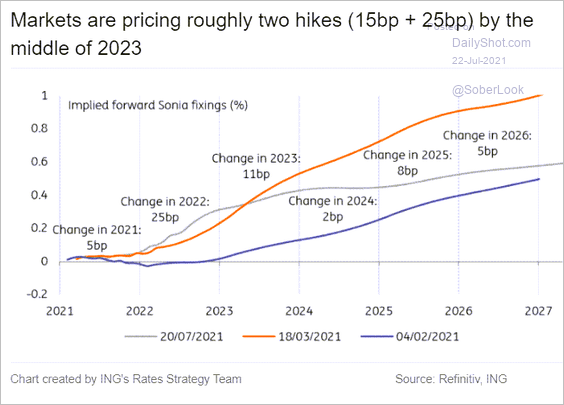 Source: ING
3. Below are price changes in select sectors since January 2020.
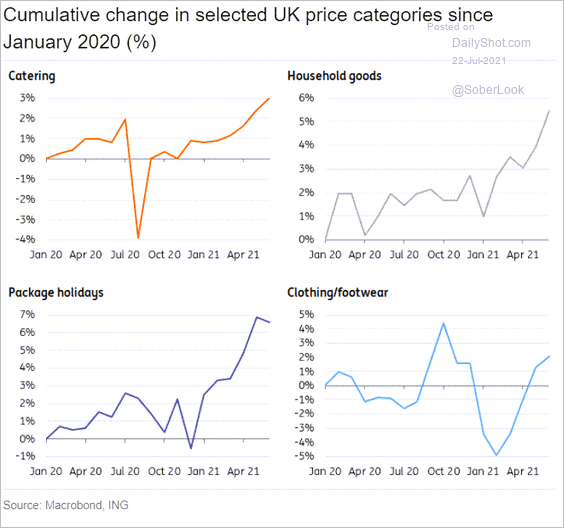 Source: ING
4. This scatterplot shows total job losses vs. job vacancies by sector.
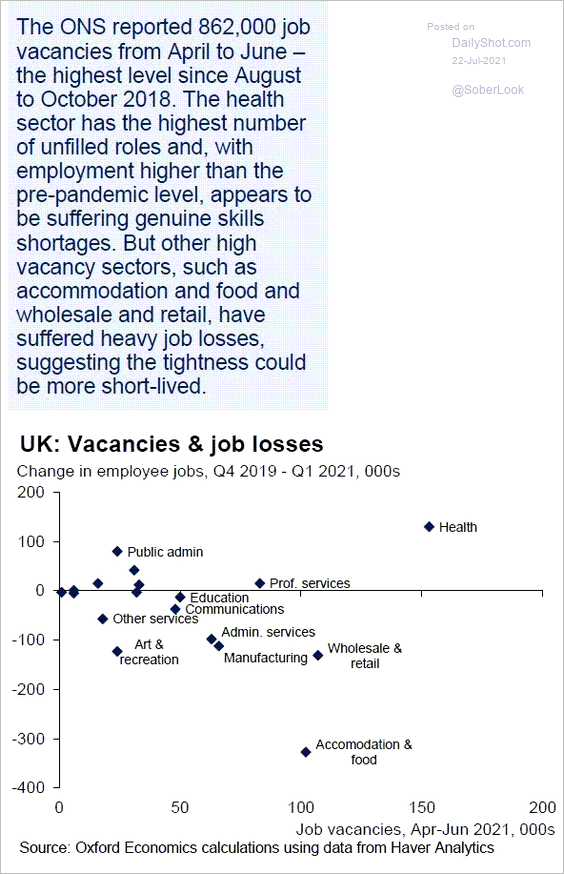 Source: @OxfordEconomics Read full article
5. Next, we have some updates on the pandemic.
• The number of people told to self-isolate:
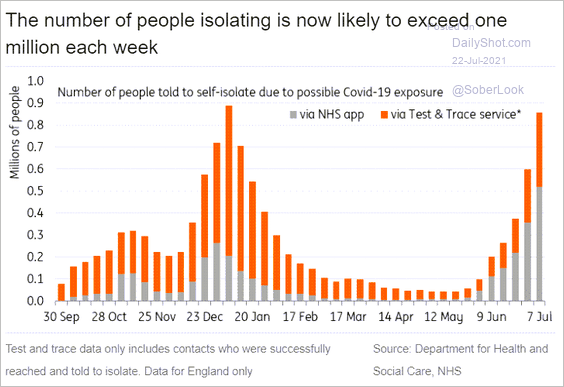 Source: ING
• The third vs. second wave:
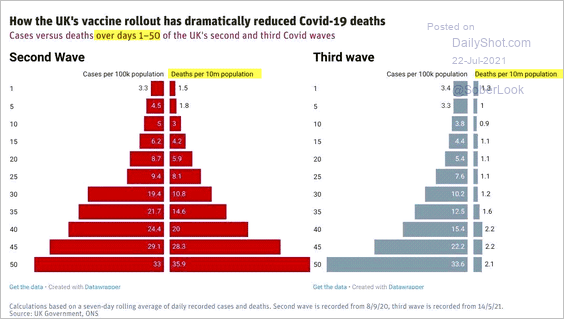 Source: @abuttenheim
Back to Index
The United States
1. The HPS-CS consumer sentiment index continues to deteriorate in response to higher prices. So far, however, that hasn’t translated into weaker consumption.
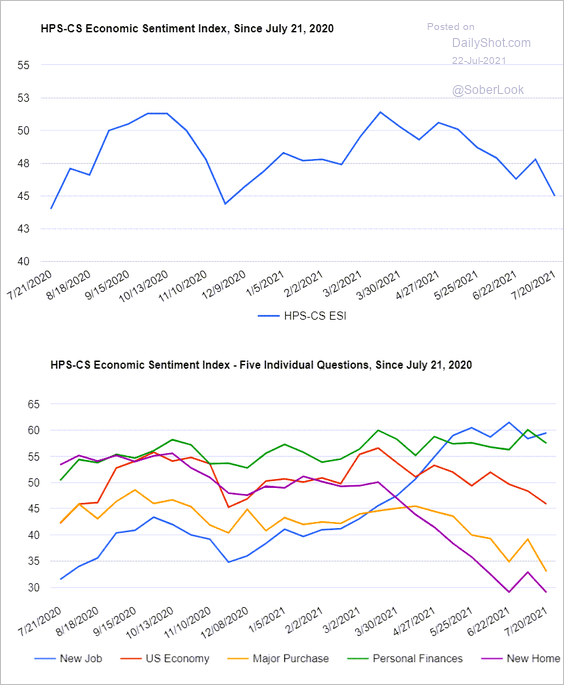 Source: @HPS_CS, @HPSInsight, @CivicScience
2. Hotel revenues are back near pre-pandemic levels.
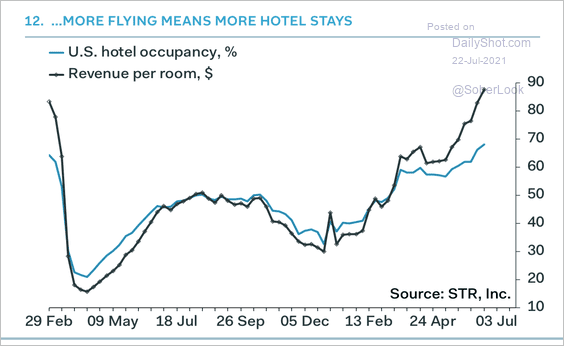 Source: Pantheon Macroeconomics
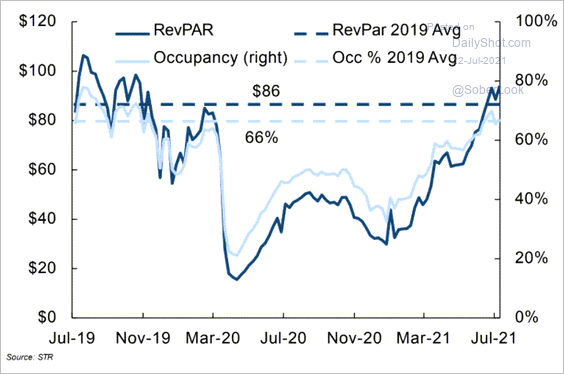 Source: Deutsche Bank Research
Airline sales are recovering.
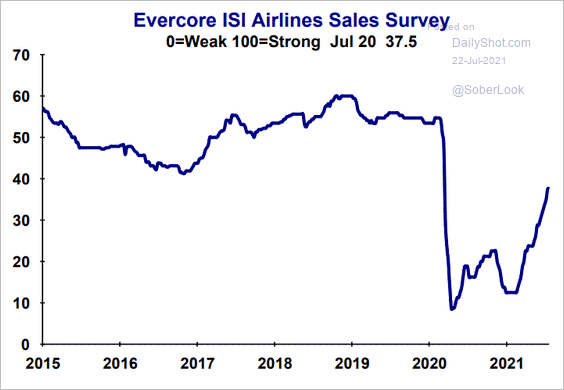 Source: Evercore ISI
——————–
3. Employees seem to have more leverage these days.
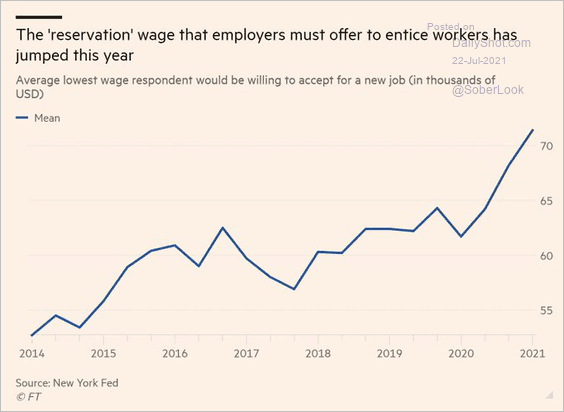 Source: @jessefelder, @FT Read full article
But will stronger wage growth persist?
 Source: Morning Consult Read full article
——————–
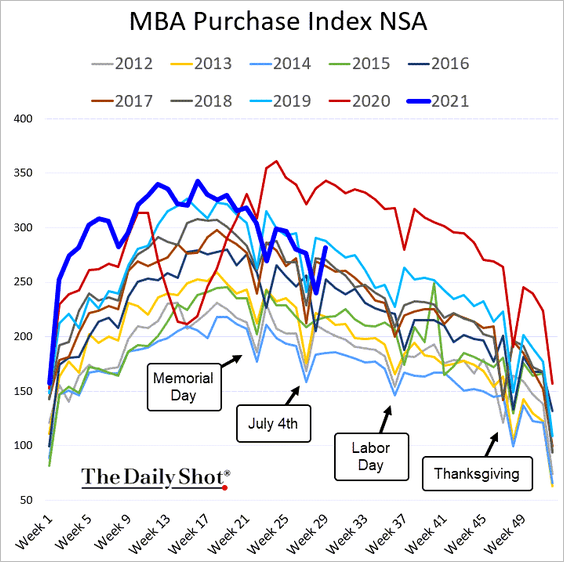
4. Next, we have some updates on housing.
• According to the Mortgage Bankers Association, loan applications to purchase a home are running roughly in line with 2019 levels.
But the AEI Housing Center data shows rate locks exceeding 2019 levels.
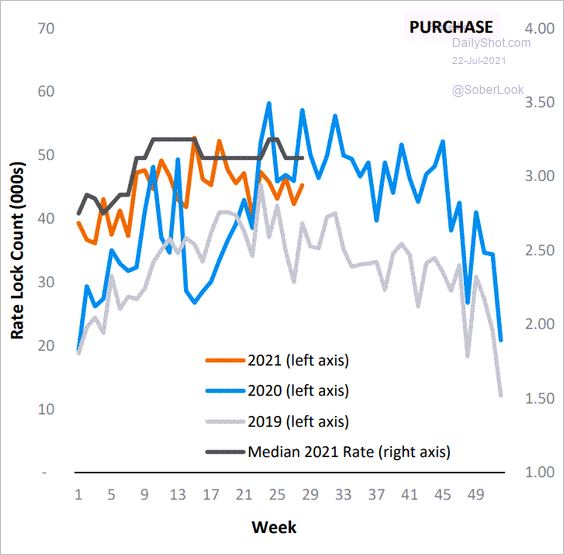 Source: AEI Housing Center
• The supply of entry-level housing is at multi-decade lows.
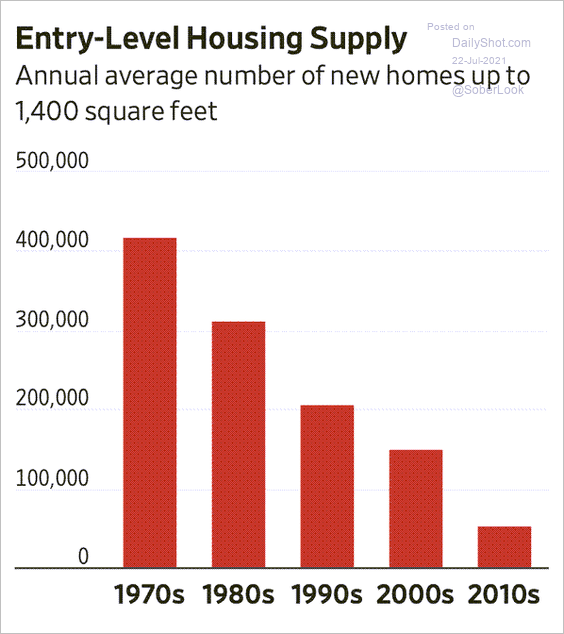 Source: @jessefelder, @htsfhickey Read full article
——————–
5. Finally, here are some economic forecasts/scenarios from Morgan Stanley.
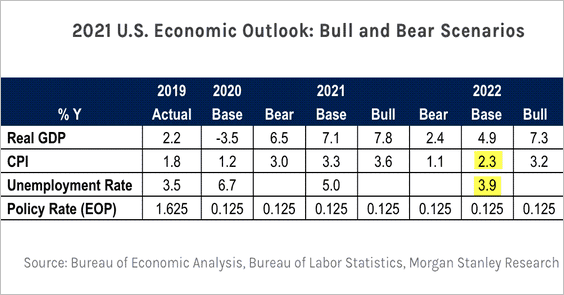 Source: Morgan Stanley Research Read full article
Back to Index
Global Developments
1. Let’s begin with month-to-date returns across equity and fixed-income markets.
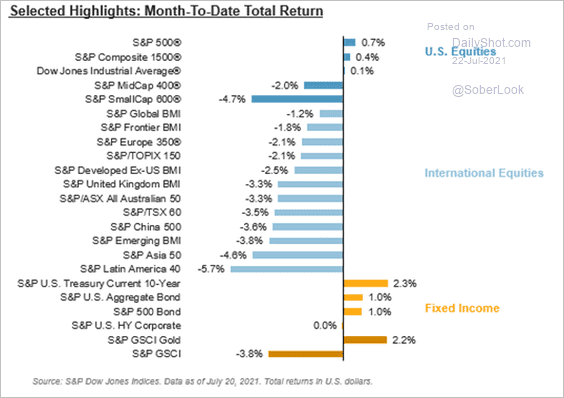 Source: S&P Global Market Intelligence
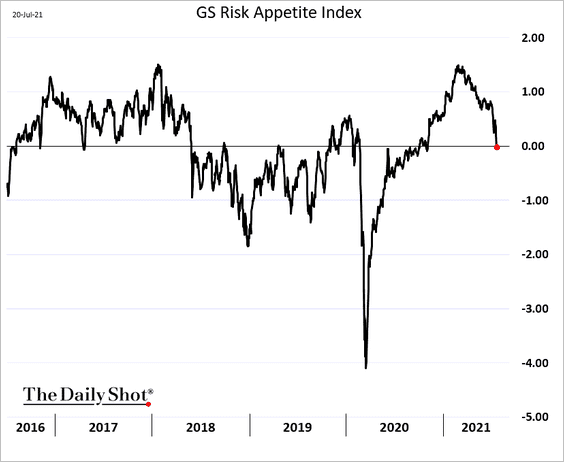
2. Goldman’s risk appetite index has been moderating.
3. The dollar is rising as real yields fall deeper into negative territory.
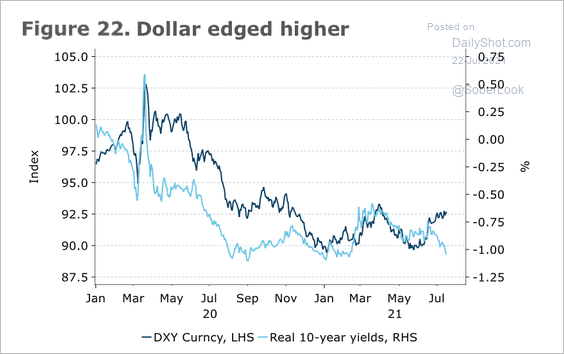 Source: ANZ Research
4. This chart shows the post-pandemic change in 2024 output projections.
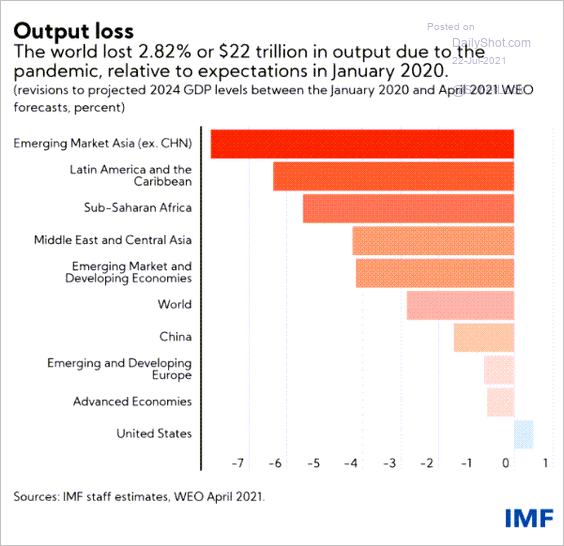 Source: IMF Read full article
——————–
Food for Thought
1. Concerns about being in public spaces:
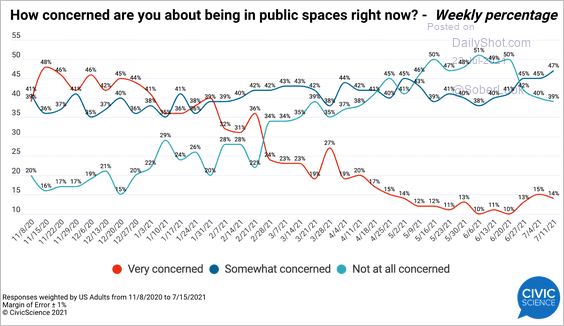 Source: @CivicScience Read full article
2. Vaccination status vs. death rates, by state:
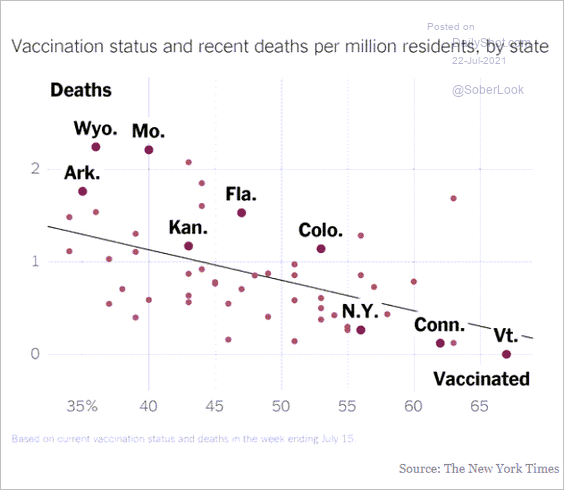 Source: The New York Times Read full article
3. Nursing home staff that are fully vaccinated:
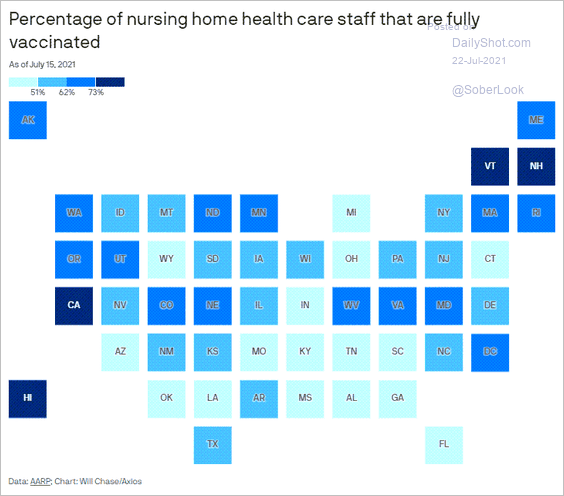 Source: @axios Read full article
4. COVID sequences by variant:
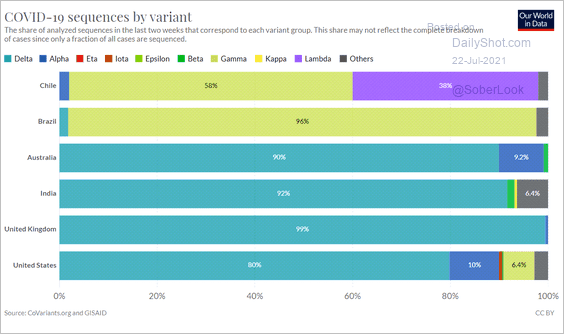 Source: Our World in Data Read full article
5. Smoke across North America:
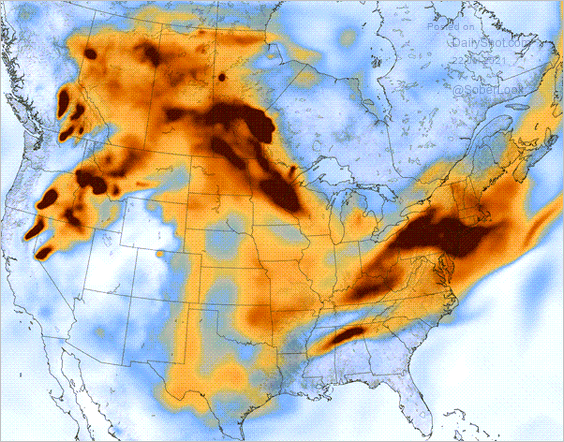 Source: The Earth Observatory
6. Carbon emissions to make an electric vehicle:
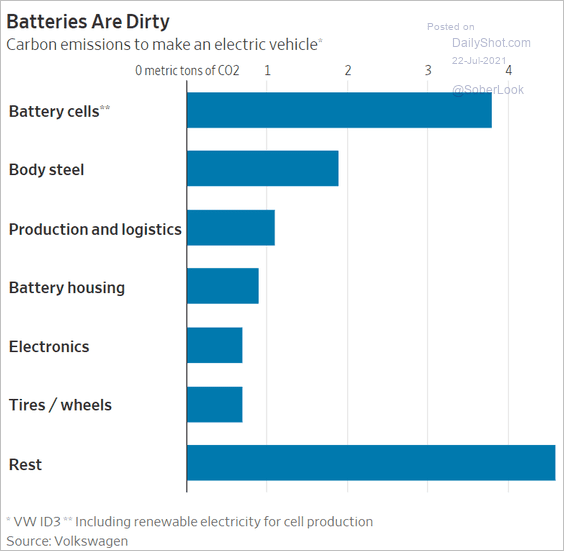 Source: @WSJ Read full article
7. Aggressive greenhouse gas emissions targets:
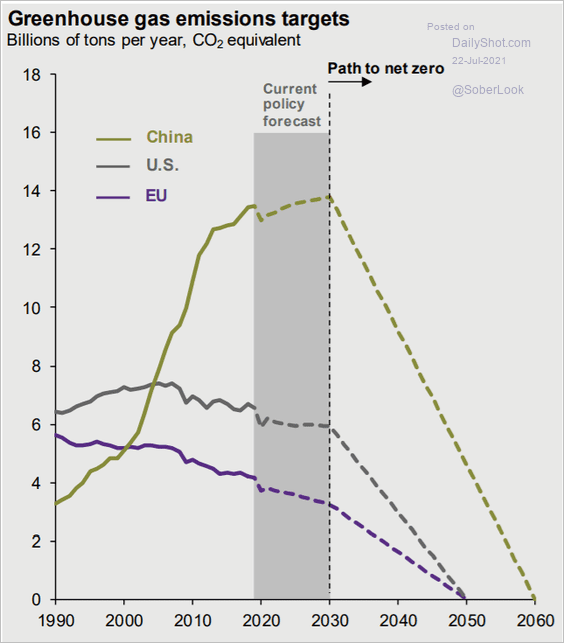 Source: J.P. Morgan Asset Management
8. Emissions from tropical forest loss vs. five largest European economies:
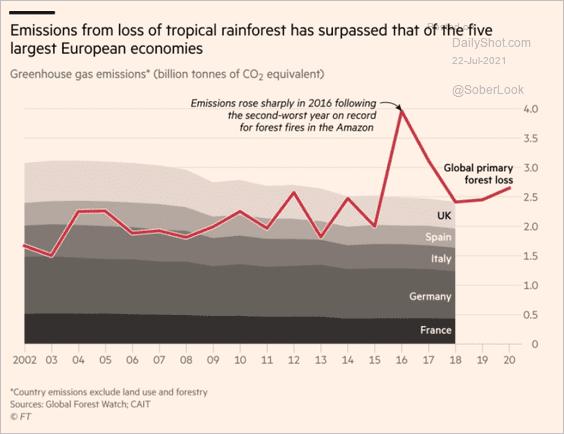 Source: @financialtimes Read full article
9. Citizenship of migrants crossing the US-Mexico border:
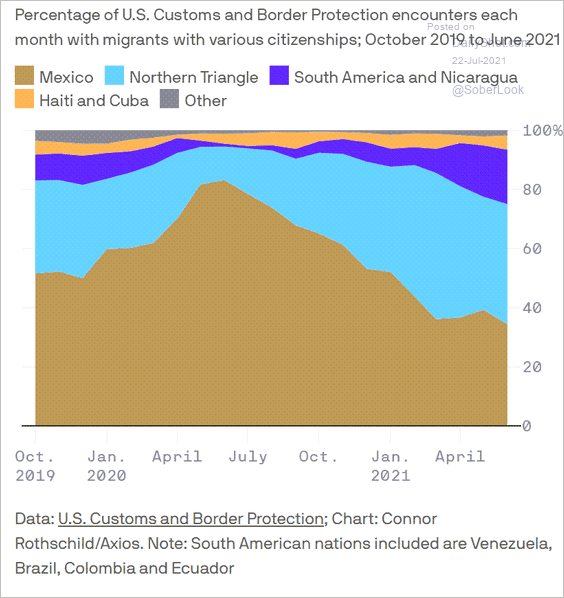 Source: @axios Read full article
10. Cuba’s economic and social progress:
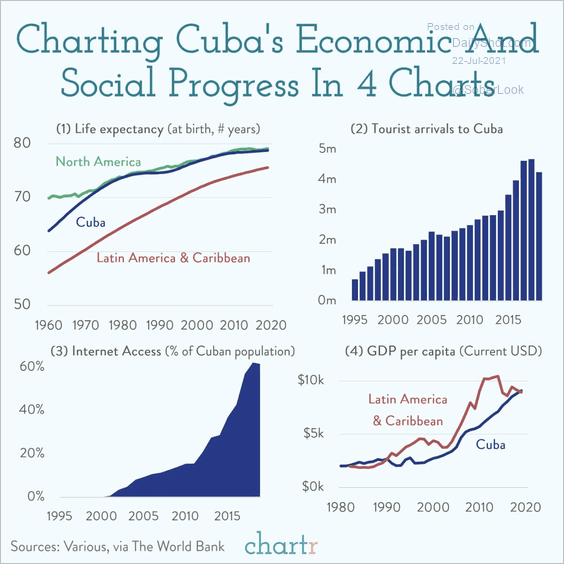 Source: @chartrdaily
11. The countries most active in the transatlantic slave trade (1514-1866):
![]() Source: Statista
Source: Statista
——————–
Back to Index