
The Daily Shot: 30-Jul-21
• The United States
• The United Kingdom
• The Eurozone
• Europe
• Japan
• Asia – Pacific
• China
• Emerging Markets
• Cryptocurrency
• Commodities
• Equities
• Alternatives
• Rates
• Global Developments
• Food for Thought
The United States
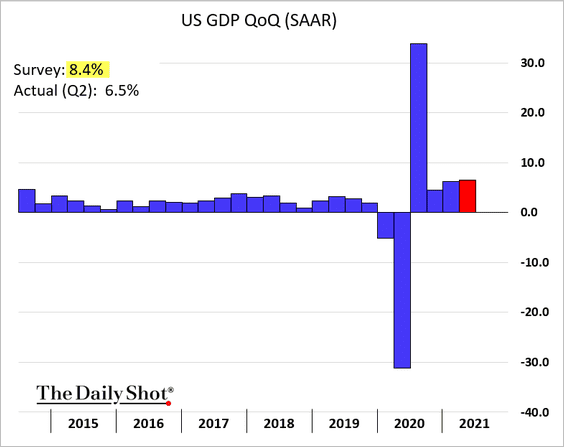
1. While economic growth remained robust in the second quarter, the GDP report surprised to the downside.
• The GDP is now above pre-COVID levels but remains under the CBO’s 2020 projections.
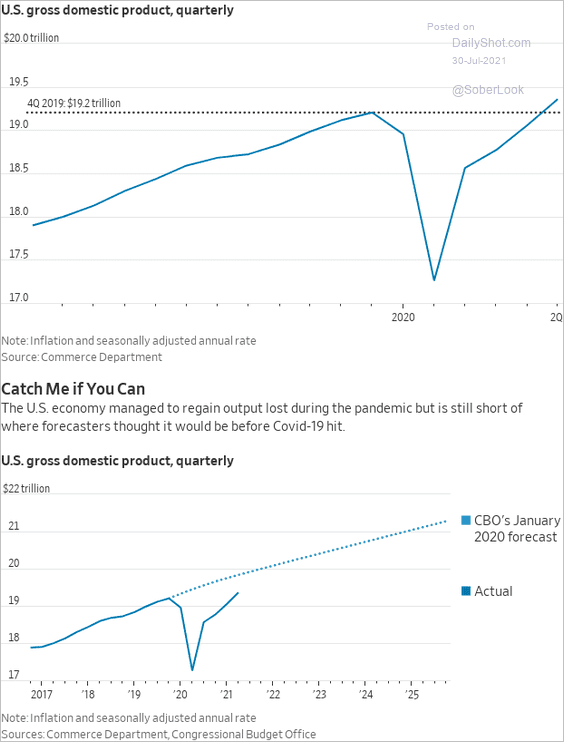 Source: @WSJ Read full article
• The economy is still running below potential, according to the CBO’s estimates.
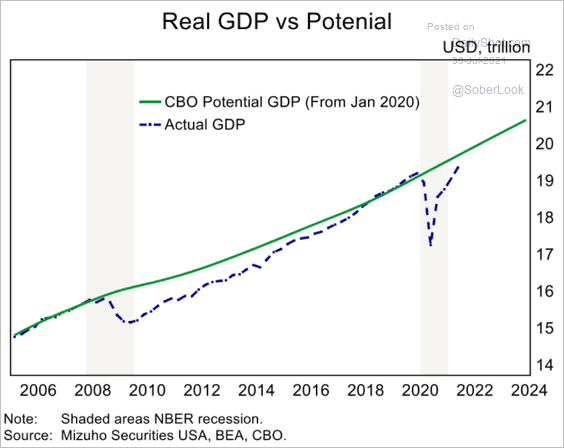 Source: Mizuho Securities USA
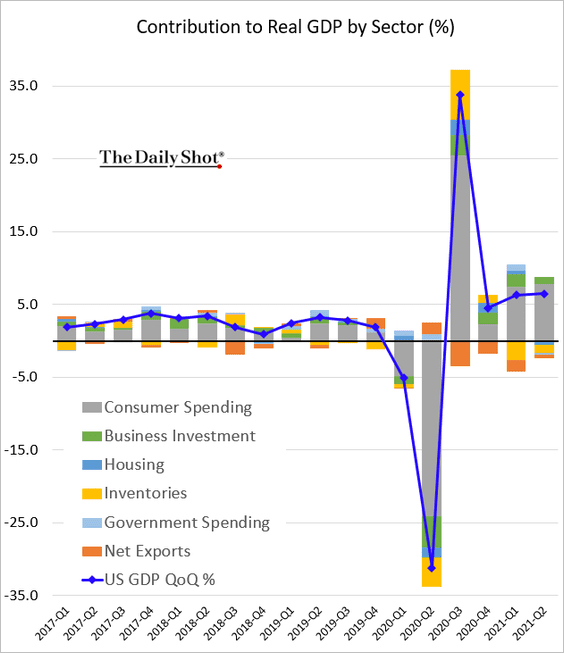
• Q2 growth was dominated by consumer spending.
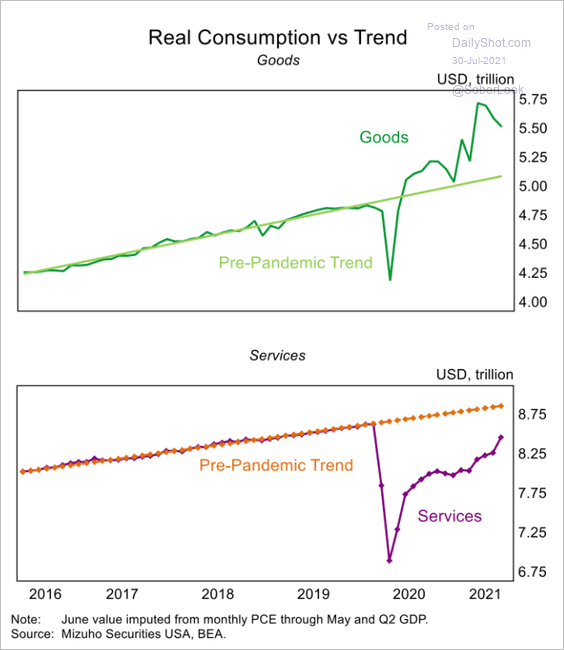
Spending on services was especially strong, …
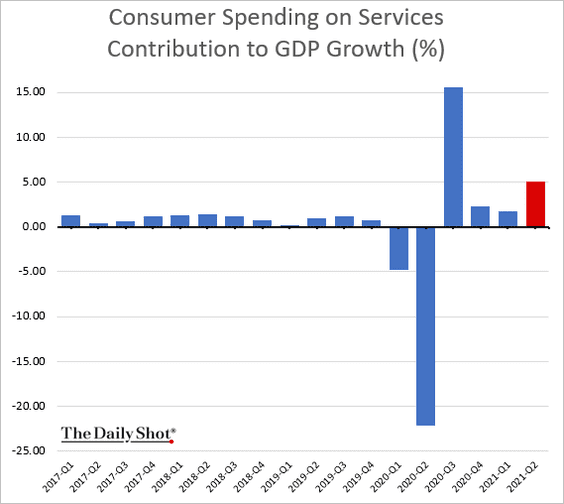
… but remained below the pre-COVID level/trend (2nd chart).
 Source: Mizuho Securities USA
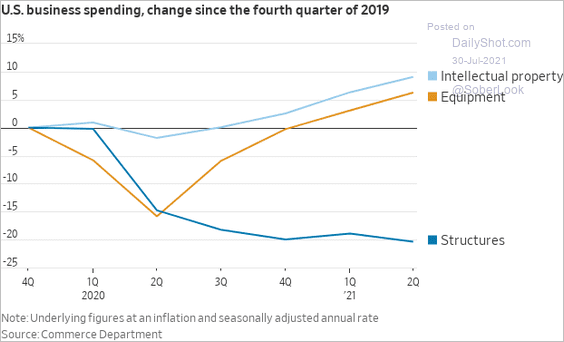
• Business investment was healthy …
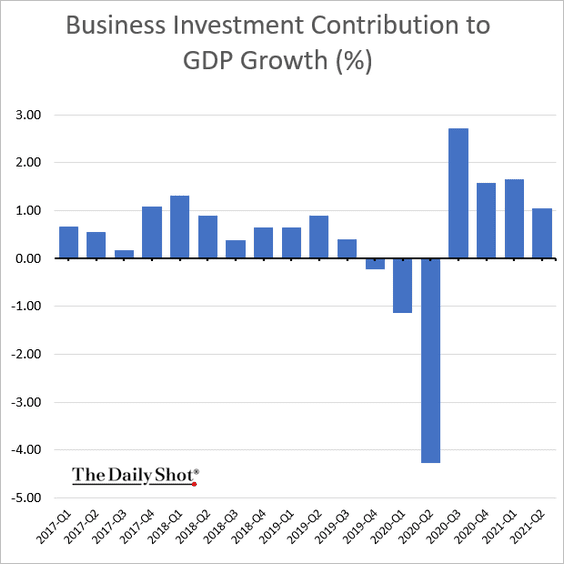
… but was dragged lower by weak spending on structures.
 Source: @WSJ Read full article
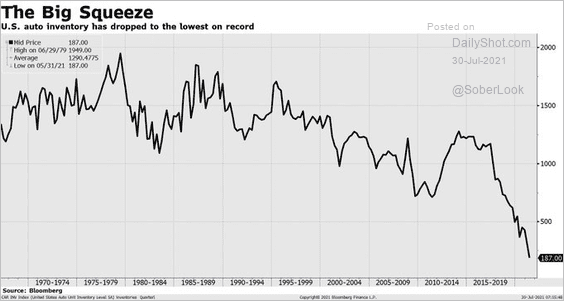
• Inventories were once again a drag on growth.
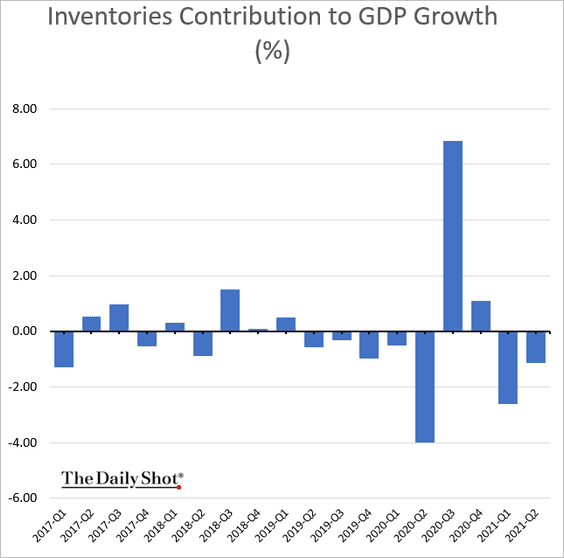
Here is one reason.
 Source: @tracyalloway
• Net exports (dollar level shown below) also remain a drag on GDP (due to strong domestic demand driving imports).
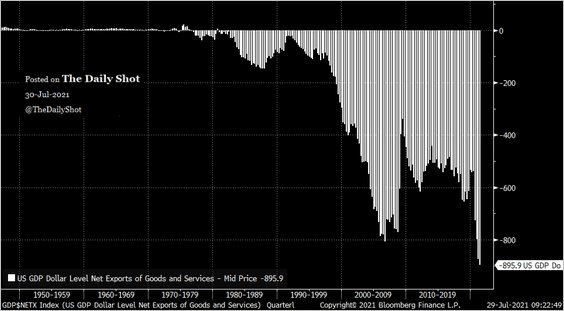 Source: @RBAdvisors
• Final sales to domestic purchasers have been surging.
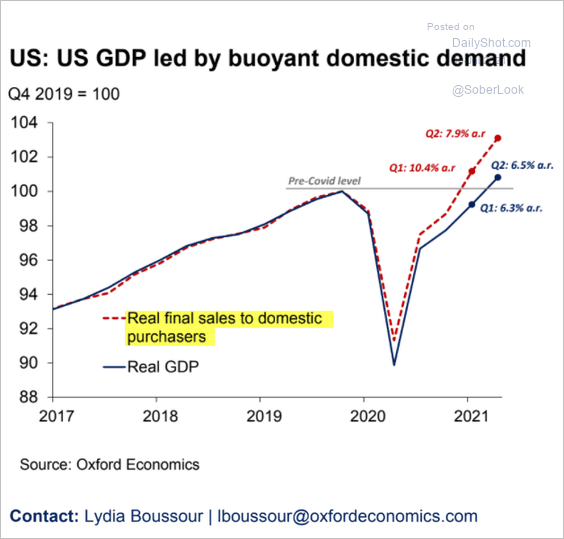 Source: Oxford Economics
——————–
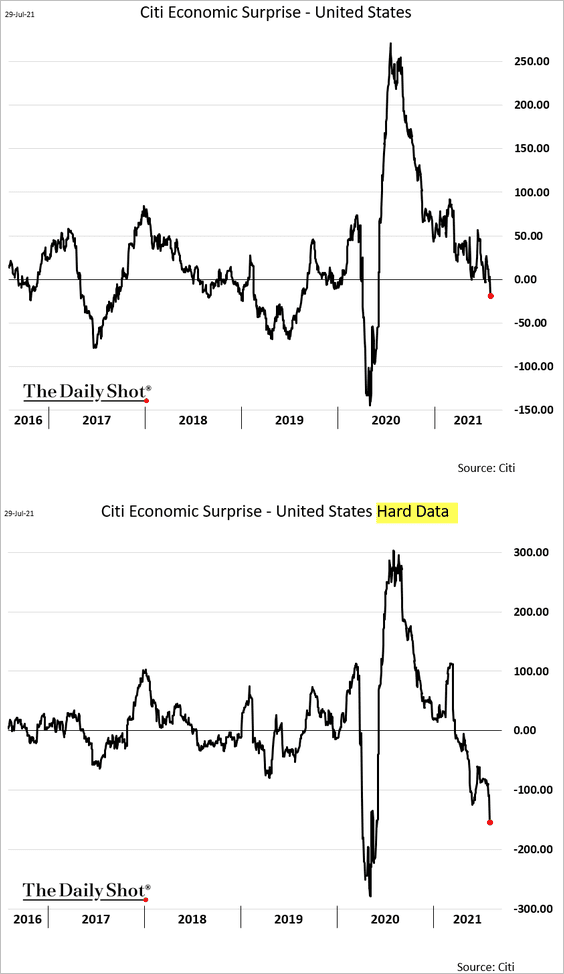
2. The Citi Economic Surprise Index tumbled after the GDP miss. The hard-data component (2nd chart) has been particularly weak, pointing to a loss of economic momentum.
3. The core PCE inflation jumped 6.1% in the second quarter, the biggest increase since the early 1980s.
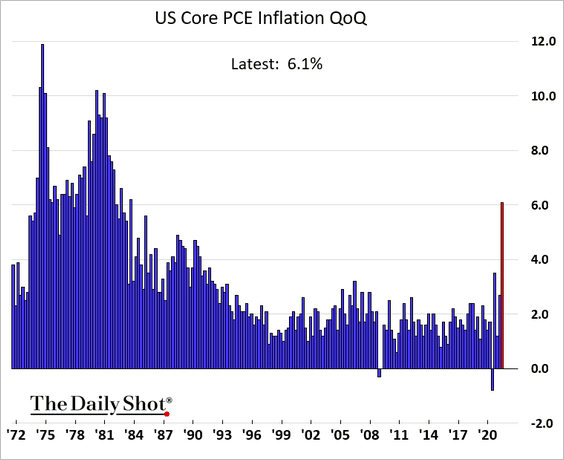
Below are some additional updates on inflation.
• Many of the sectors that saw significant price gains this year had spent a substantial amount of time in deflation over the past couple of decades.
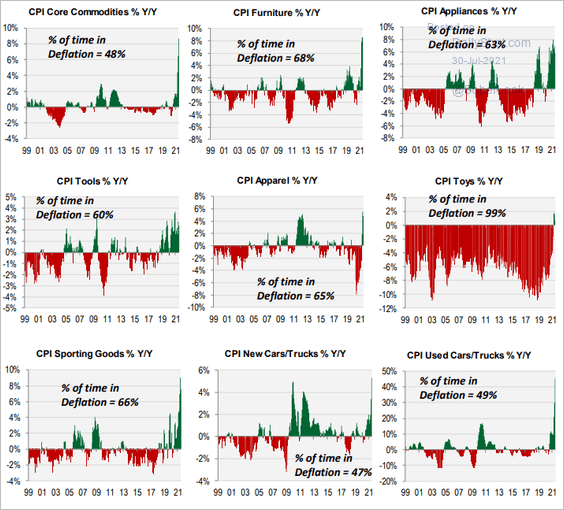 Source: Cornerstone Macro
• High-frequency data continue to point to a jump in rent CPI in the coming months.
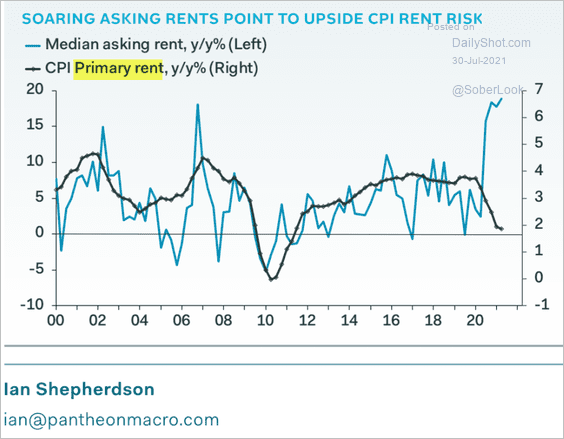 Source: Pantheon Macroeconomics
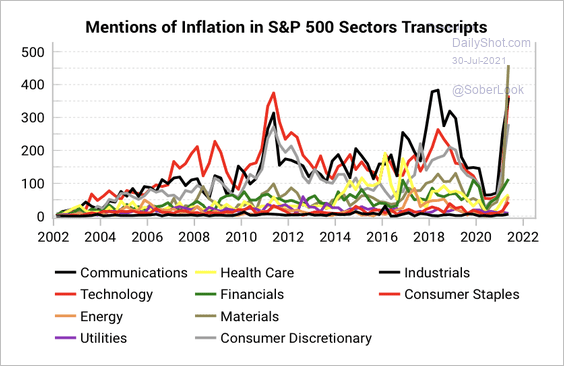
• Companies are increasingly talking about inflation on earnings calls (2 charts).
![]() Source: Variant Perception
Source: Variant Perception
 Source: Variant Perception
——————–
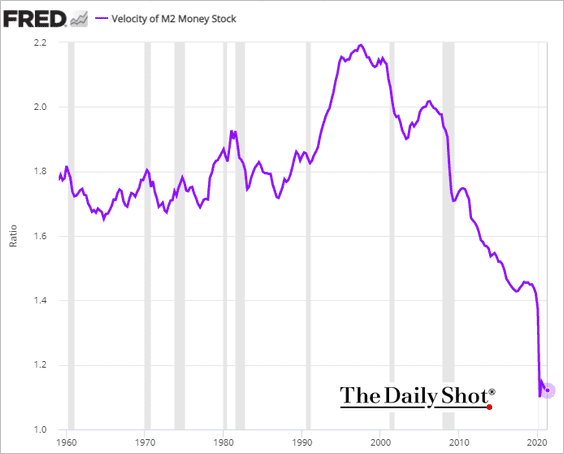
4. The velocity of money remains near all-time lows amid record levels of liquidity.
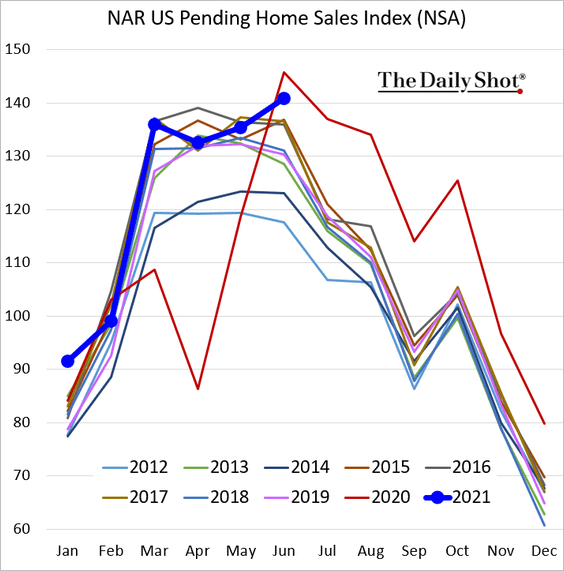
5. Pending home sales strengthened in June, rising well above 2019 levels.
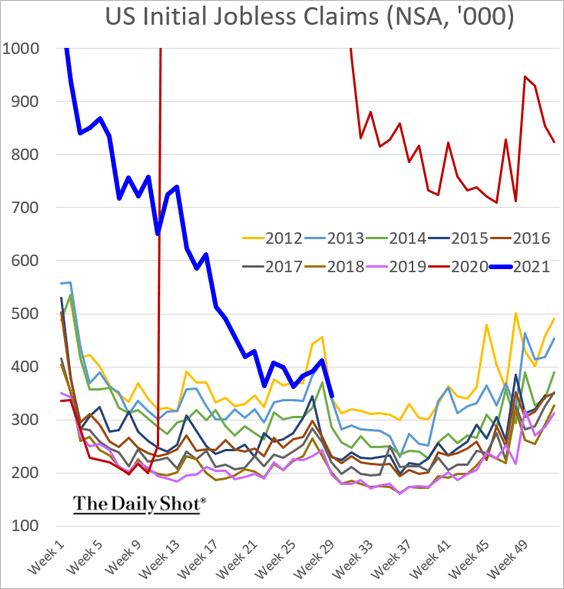
6. Initial jobless claims (excluding emergency programs) are now running at 2013 levels. We are ways away from full recovery, but the index is finally back within the 10-year range.
7. The distribution of Child Tax Credit funds boosted consumer spending (based on BofA’s card data).
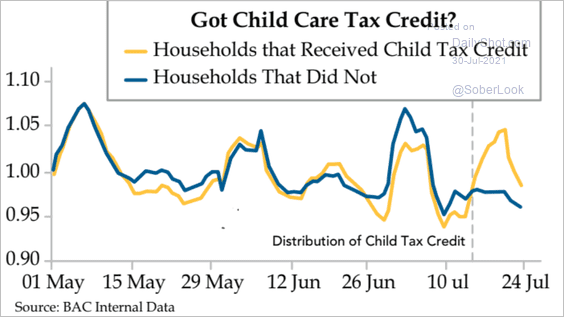 Source: The Daily Feather
However, the loss of emergency unemployment benefits has been a drag on spending.
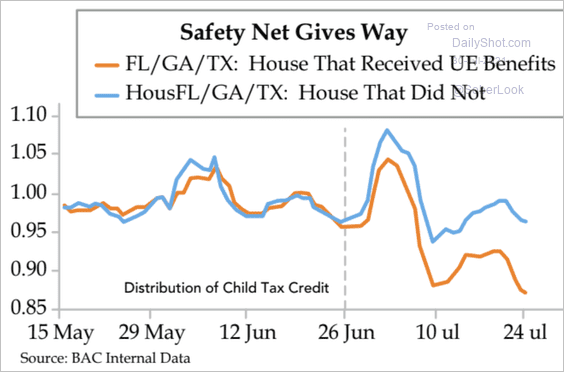 Source: The Daily Feather
Back to Index
The United Kingdom
1. Credit and debit card spending has fallen in recent weeks.
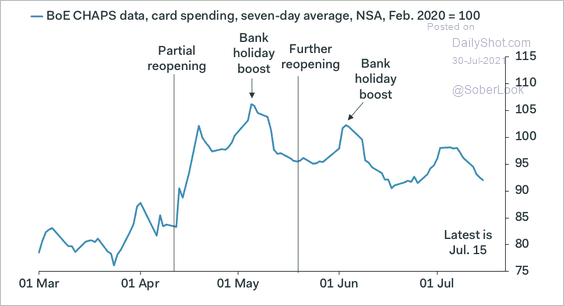 Source: Pantheon Macroeconomics
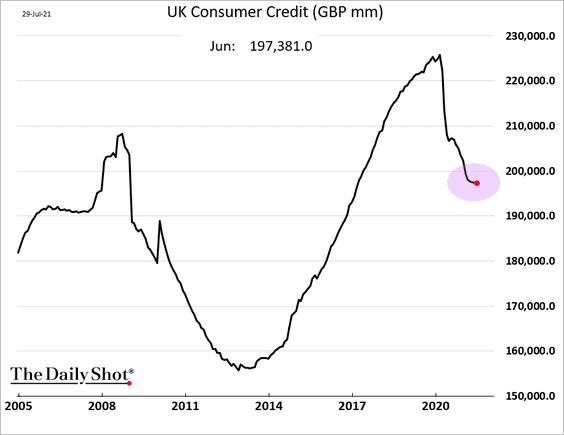
• Slower consumer credit borrowing points to softer GDP growth.
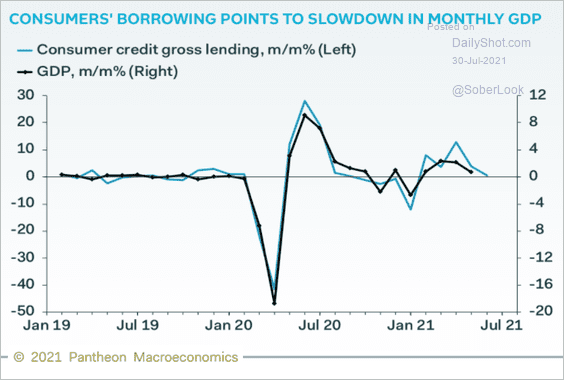 Source: Pantheon Macroeconomics
• But consumer credit appears to have troughed.
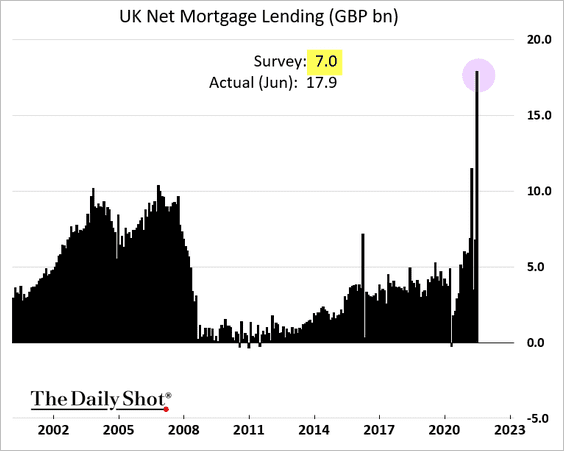
2. Mortgage lending surged before the tax deadline.
 Source: KFGO Read full article
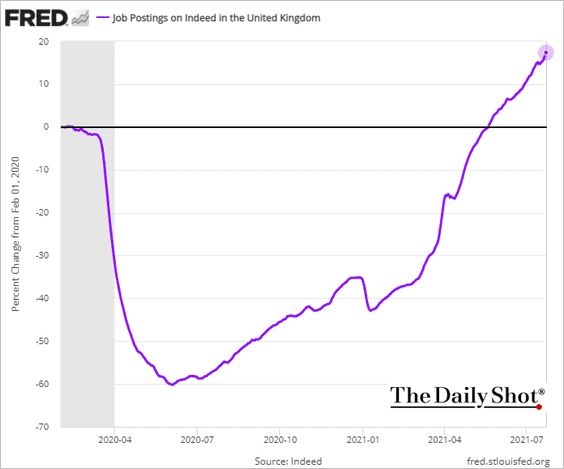
3. Job postings on Indeed point to a strengthening labor market.
4. UK equities’ discount to global peers continues to widen.
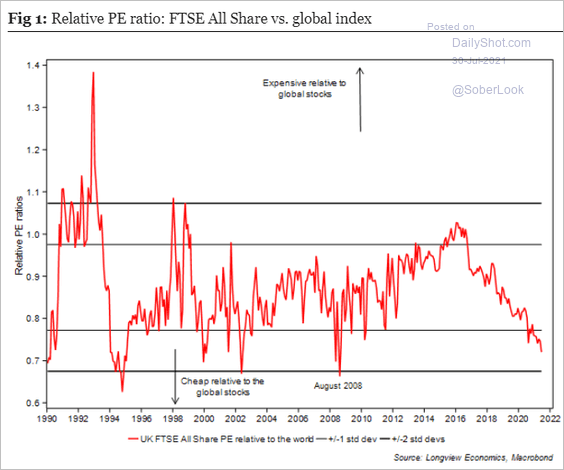 Source: Longview Economics
Back to Index
The Eurozone
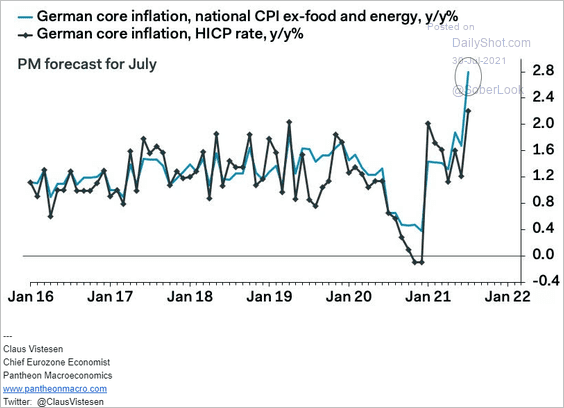
1. German inflation jumped this month, topping expectations.
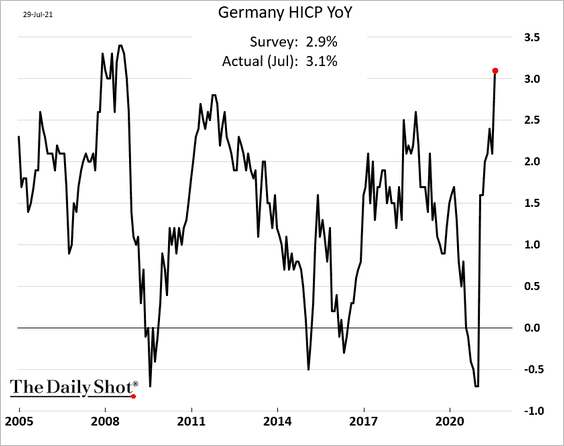
The core CPI increase was especially sharp.
 Source: Pantheon Macroeconomics
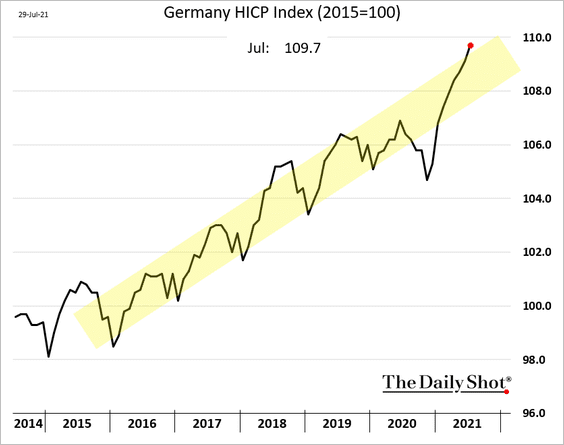
It’s worth noting that the headline HICP (EU-harmonized CPI) index has not deviated much from the pre-COVID range.
——————–
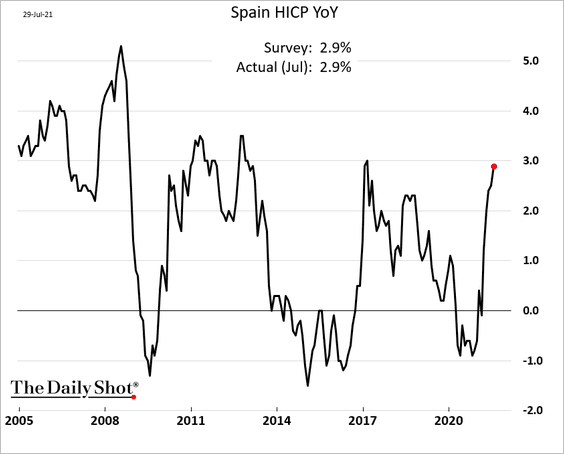
2. Spain’s inflation also increased this month.
3. Next, we have some updates on the labor market.
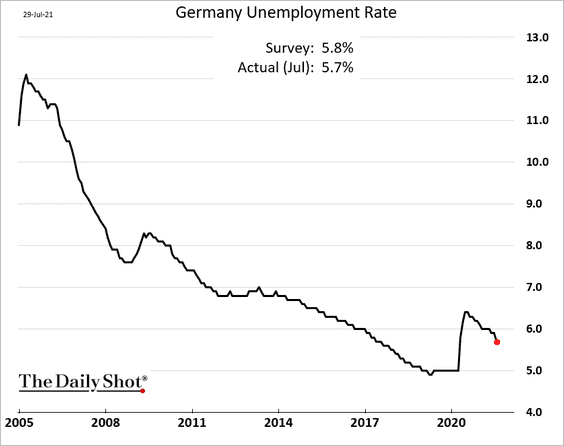
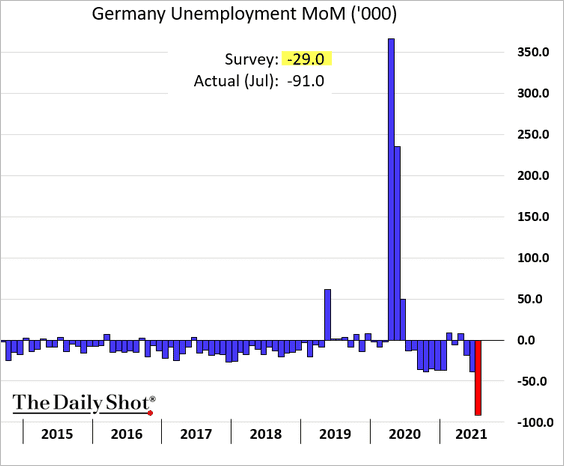
• Germany’s unemployment rate continues to decline.
The latest drop in the number of unemployed Germans was the largest in years.
• Vacancies in Germany have risen sharply, which should further boost employment.
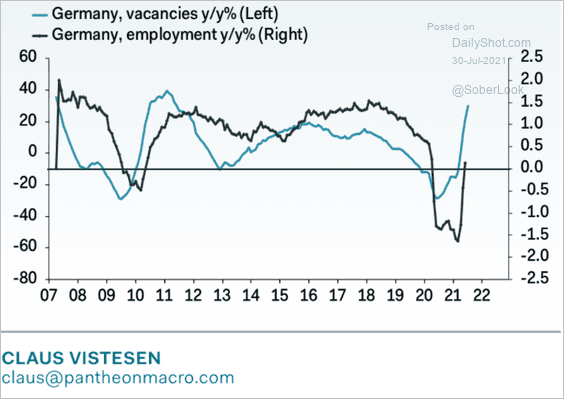 Source: Pantheon Macroeconomics
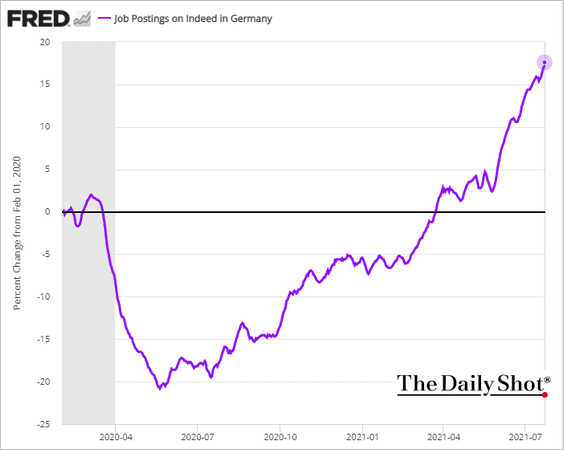
Job openings on indeed are now well above pre-COVID levels.
• The labor market is increasingly tight across the euro area.
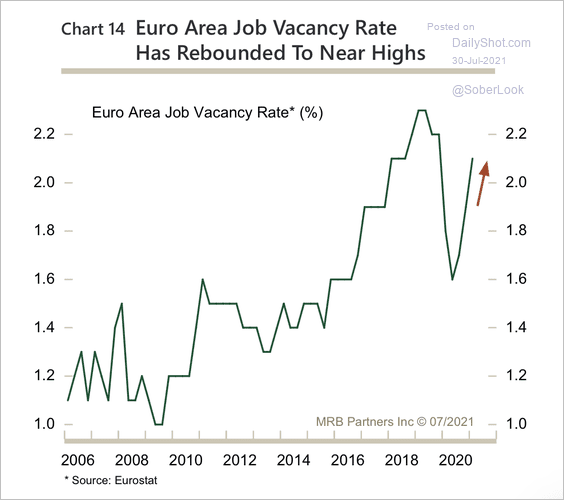 Source: MRB Partners
——————–
4. It’s been a rough decade for Italy’s economic growth.
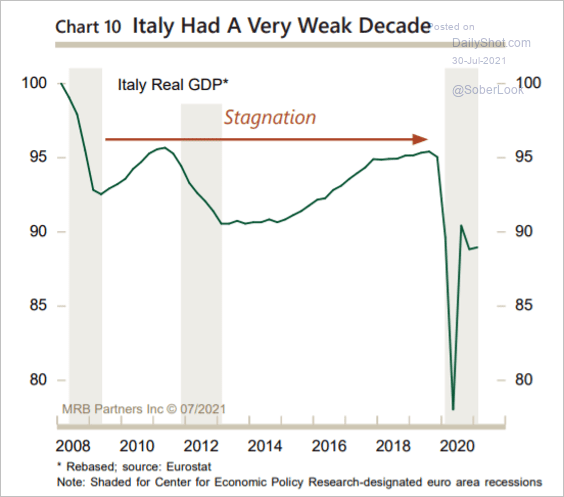 Source: MRB Partners
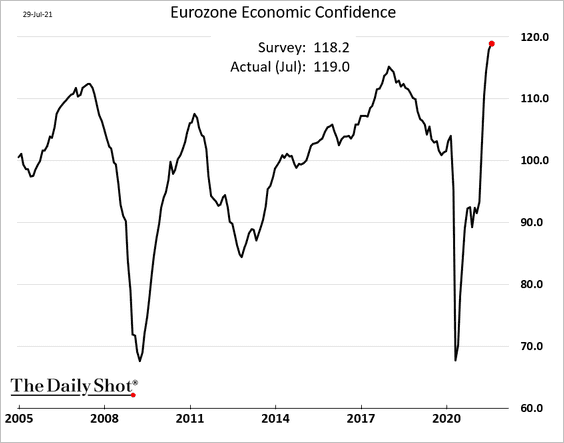
5. Economic confidence at the euro-area level hit another multi-year high this month.
Back to Index
Europe
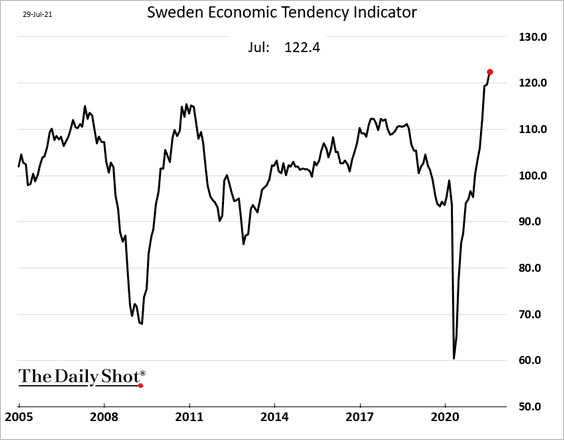
1. Sweden’s consumer confidence has pulled back from the highs.
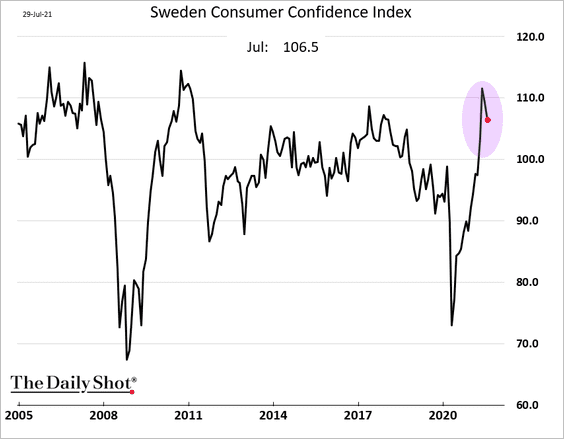
But the broad Economic Tendency Indicator continues to surge.
——————–
2. Which countries have the highest percentage of tech jobs?
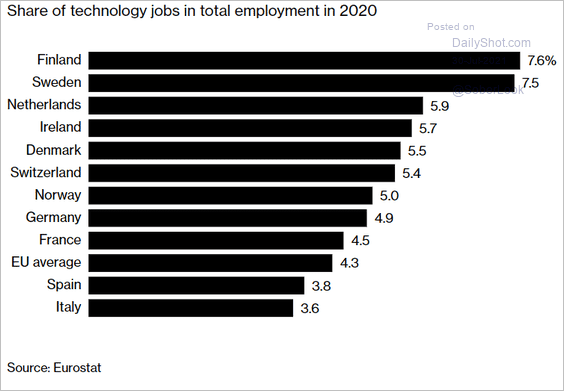 Source: Bloomberg Read full article
3. Here is the distribution of green spending plans (using COVID funds).
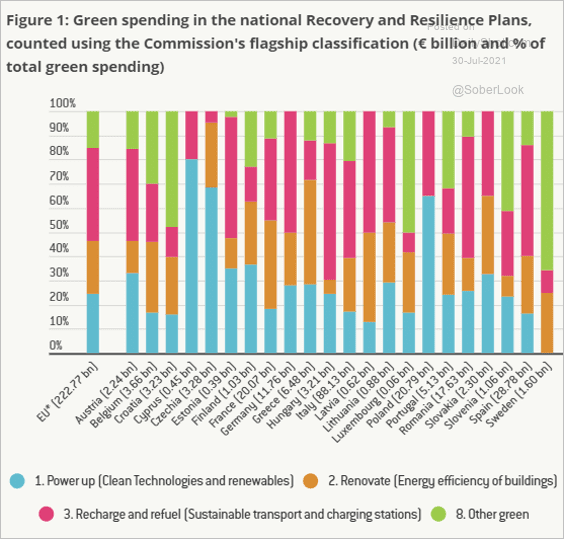 Source: Bruegel Read full article
4. Cash is still the cheapest form of payment for European merchants.
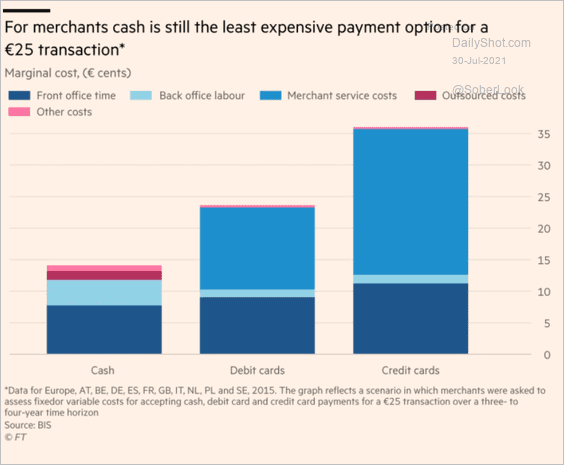 Source: @financialtimes Read full article
5. Which countries have the most/least independent judiciary?
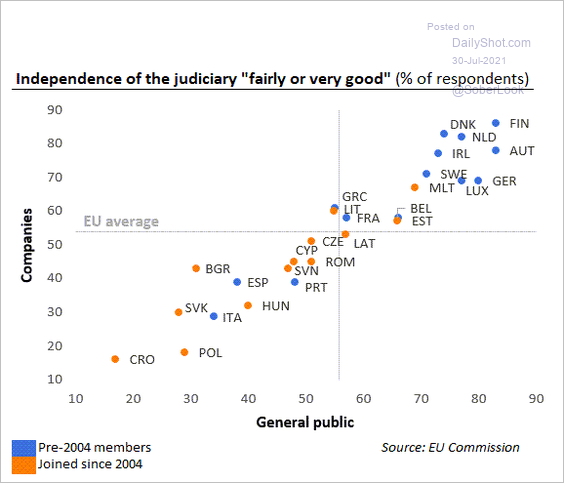 Source: @DanielKral1, @EU_Commission
Back to Index
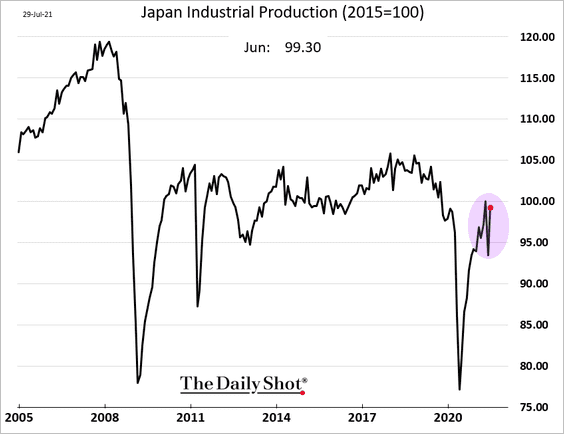
Japan
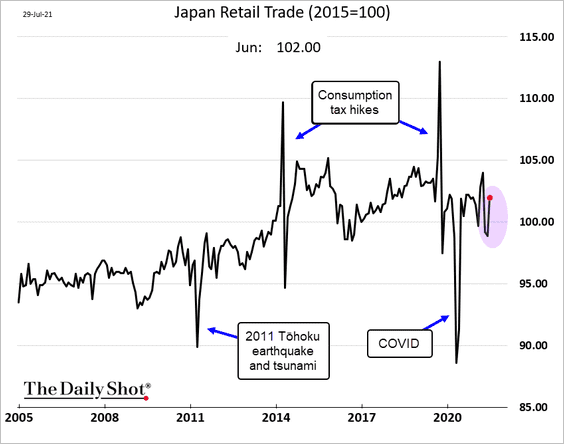
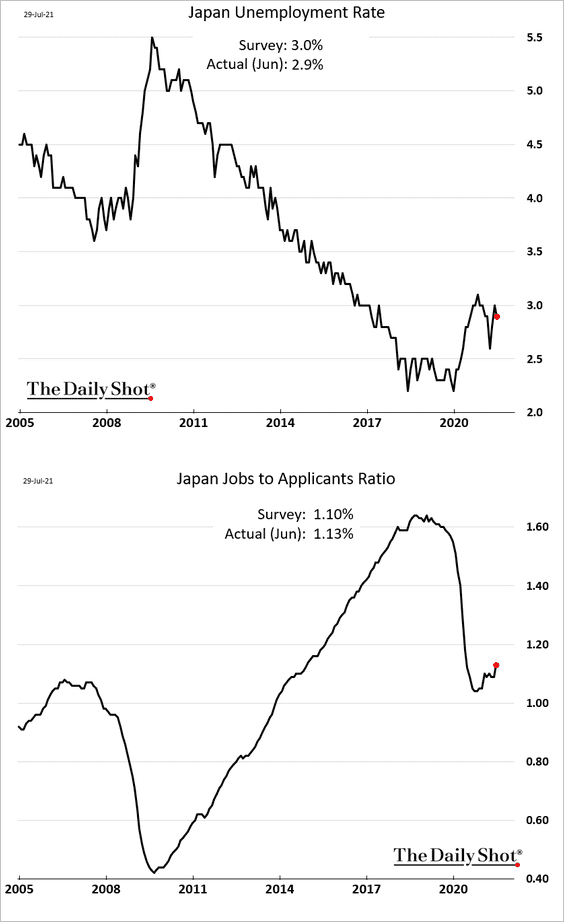
Economic data improved in June.
• Industrial production:
• Retail sales:
• Employment metrics:
Back to Index
Asia – Pacific
1. South Korea’s business survey indicators are off the highs.
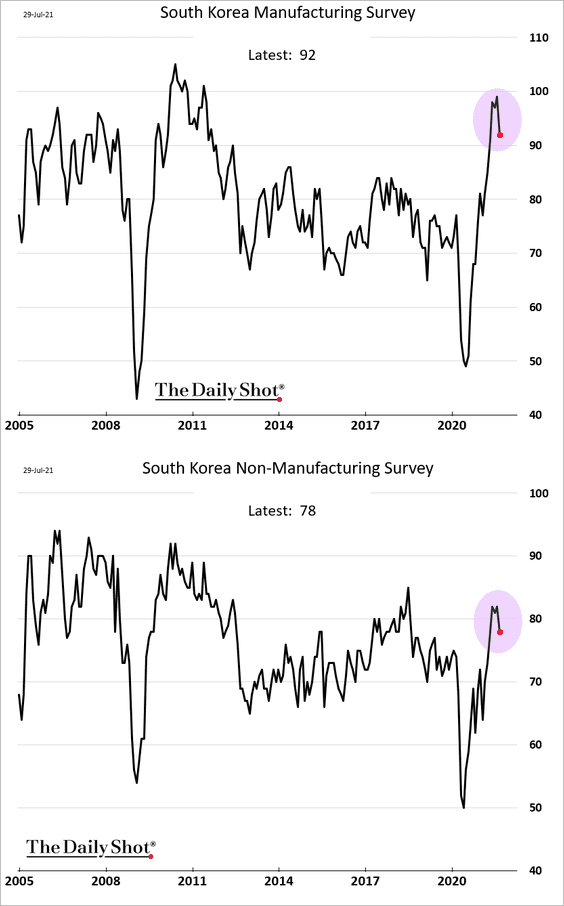
Industrial production continues to trend higher.
——————–
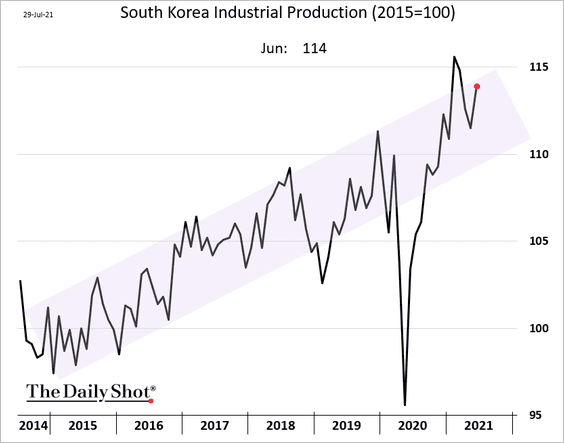
2. Bank lending in Singapore is rebounding.
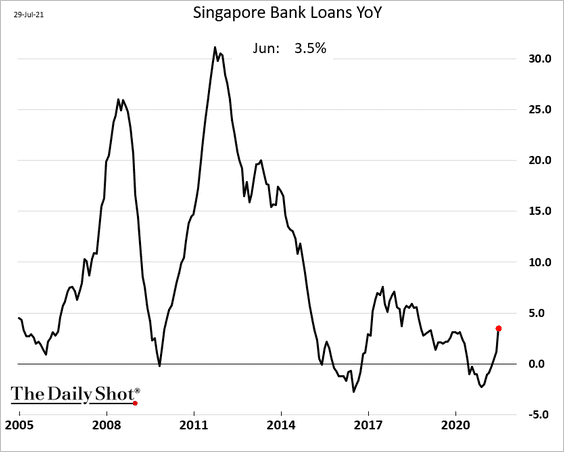
3. Australia’s private-sector credit continues to show improvement.
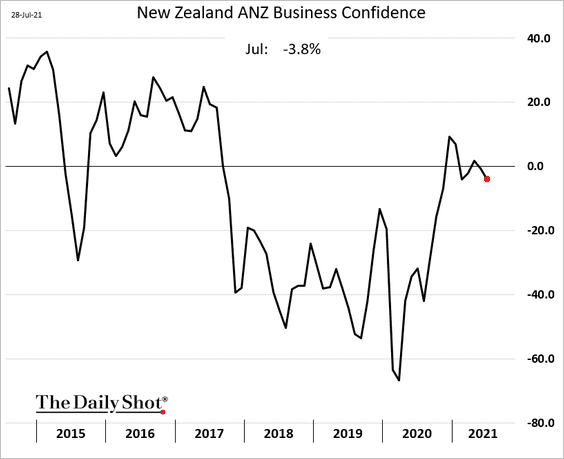
4. New Zealand’s business confidence weakened this month due to inflation concerns.
Back to Index
China
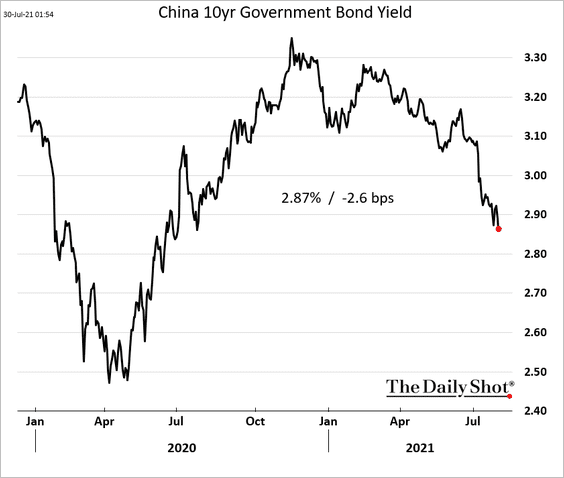
1. Bond yields continue to drift lower.
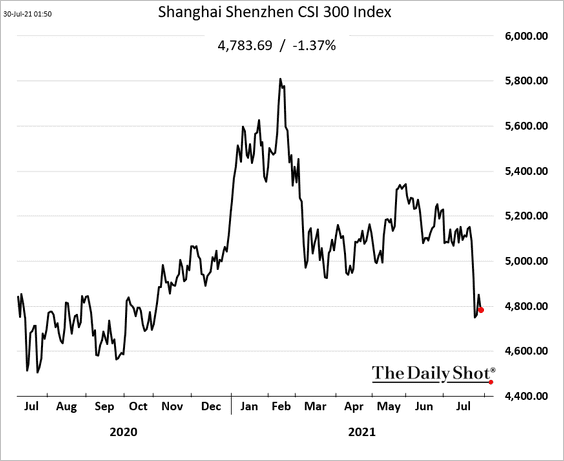
2. The stock market remains soft.
Shares look attractive based on earnings yield relative to the 10yr government bond.
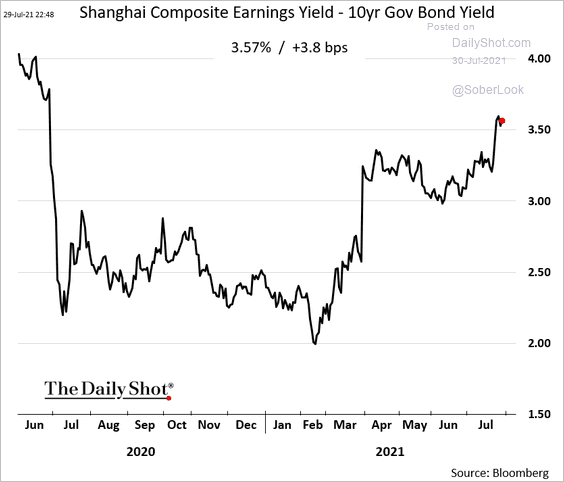 h/t Chester Yung
3. Aside from the tech rout, the decline in social financing points to a deeper pullback in Chinese equities …
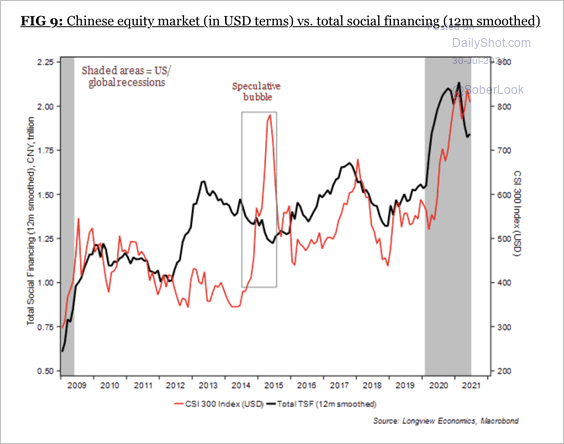 Source: Longview Economics
… and lower commercial bank loan approvals.
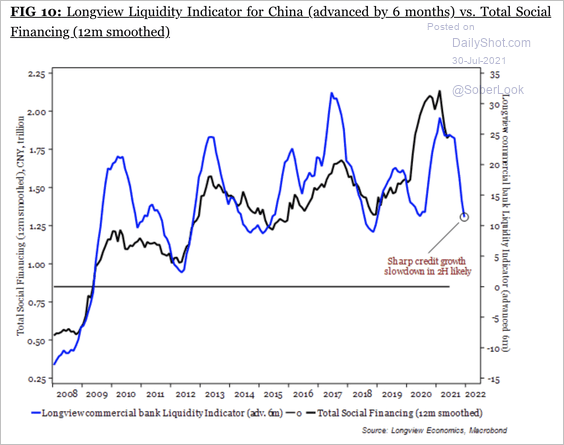 Source: Longview Economics
——————–
4. Urban households have been spending much more on education in recent years.
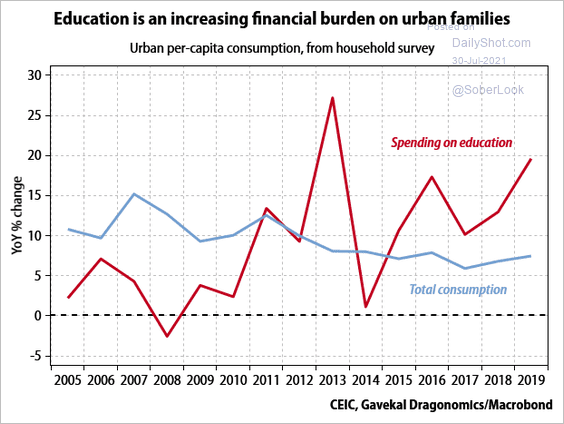 Source: Gavekal Research
5. The youth unemployment gap has been trending higher.
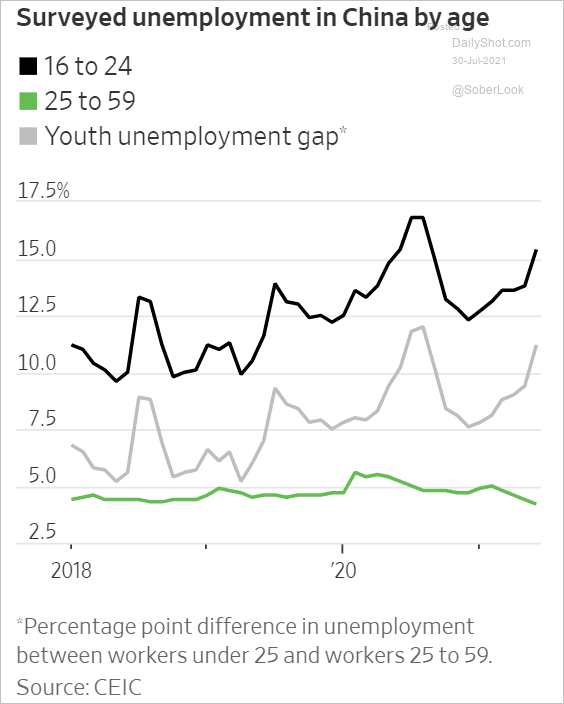 Source: @WSJ Read full article
6. The number of asylum-seekers leaving China keeps rising.
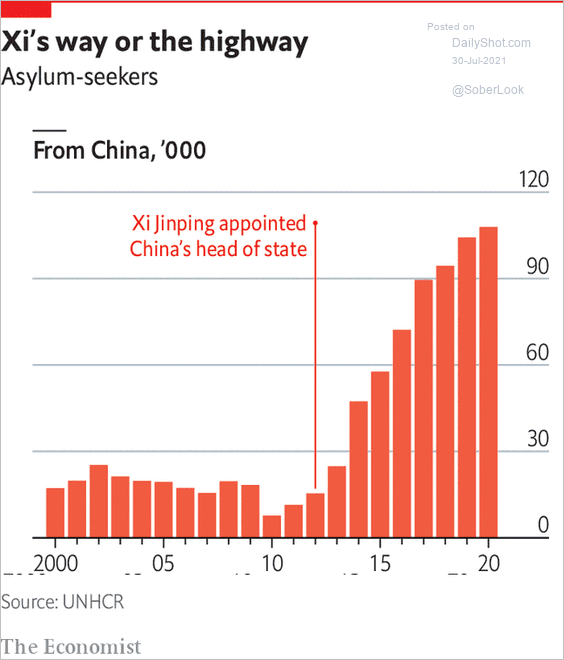 Source: The Economist Read full article
Back to Index
Emerging Markets
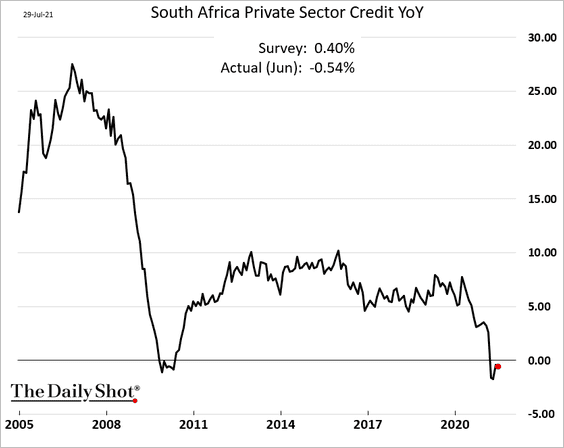
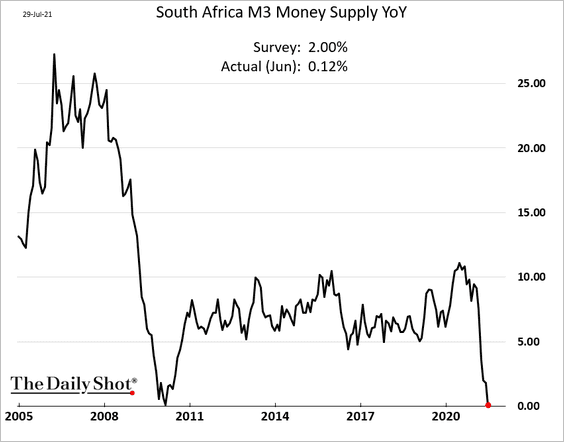
1. South Africa’s credit growth has stalled.
• Private-sector credit:
• Broad money supply:
——————–
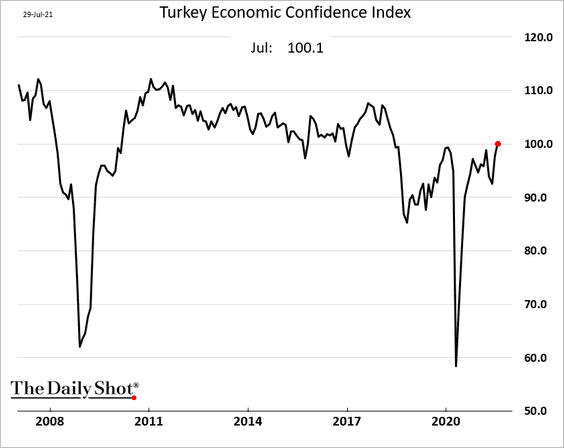
2. Turkey’s economic confidence continued to climb this month.
3. Some Asian economies see sharp declines in mobility.
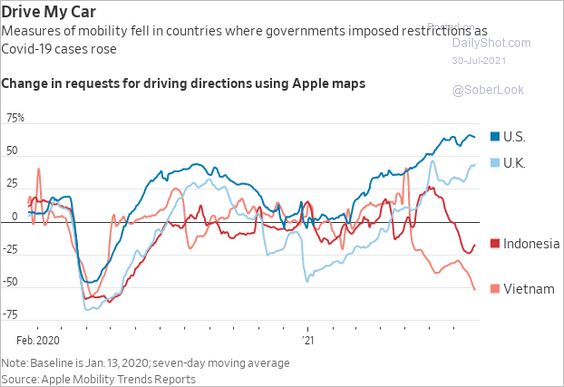 Source: @jeffsparshott
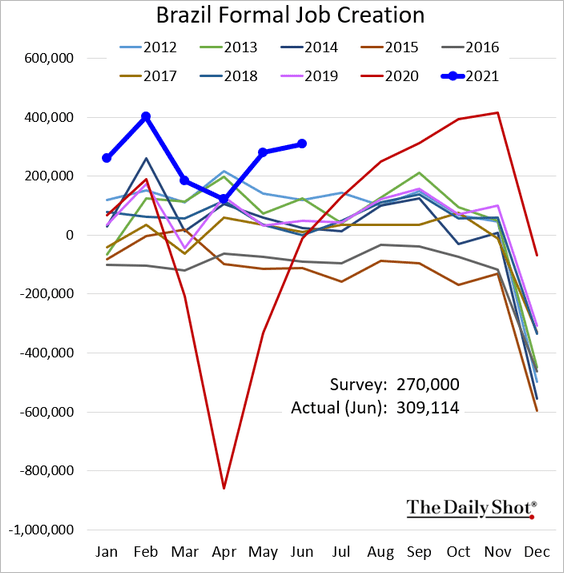
4. Brazil’s formal job creation was robust in June.
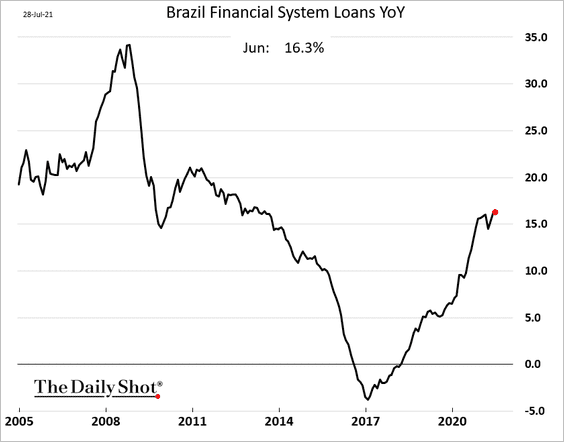
Loan growth is now above 16%.
Back to Index
Cryptocurrency
1. Twitter discourse remains focused on Bitcoin and Ethereum.
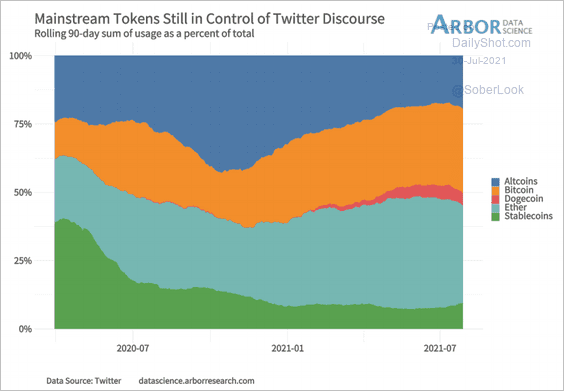 Source: Arbor Research & Trading
2. Bitcoin options open interest jumped in recent days as prices rebounded.
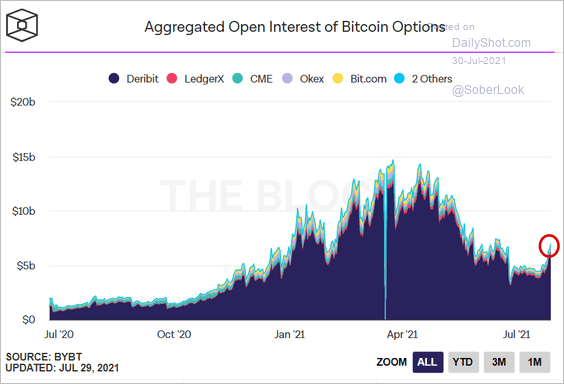 Source: The Block
Back to Index
Commodities
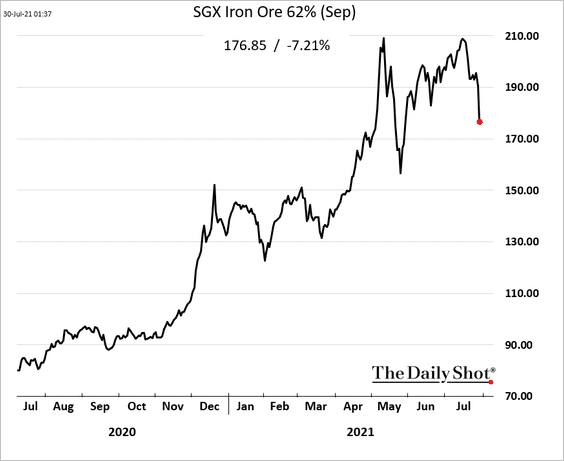
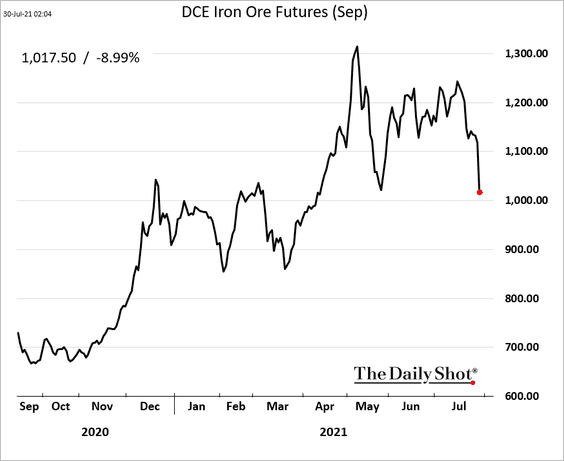
1. Iron ore prices continue to tumble.
• Singapore:
• China:
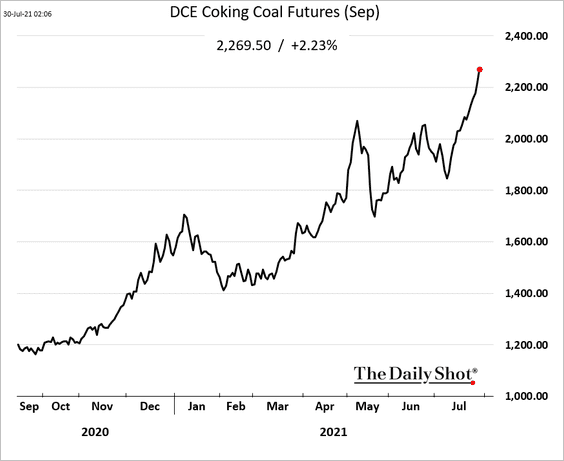
2. But metallurgical coal futures are surging.
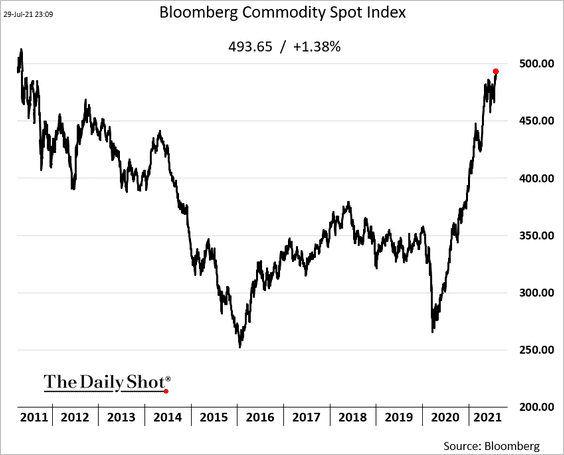
3. Bloomberg’s broad commodity index hit the highest level in a decade.
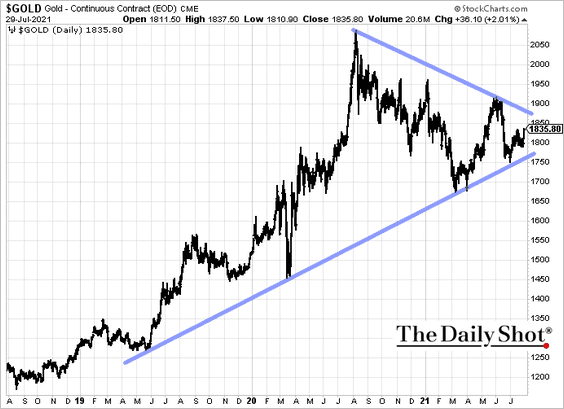
4. Will we see a breakout in gold?
Separately, here are the central banks with the largest gold purchases in the first half of the year.
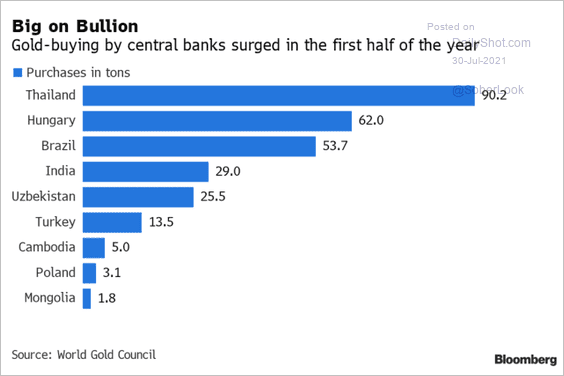 Source: @RanjeethaPakiam, @TheTerminal Read full article
Back to Index
Equities
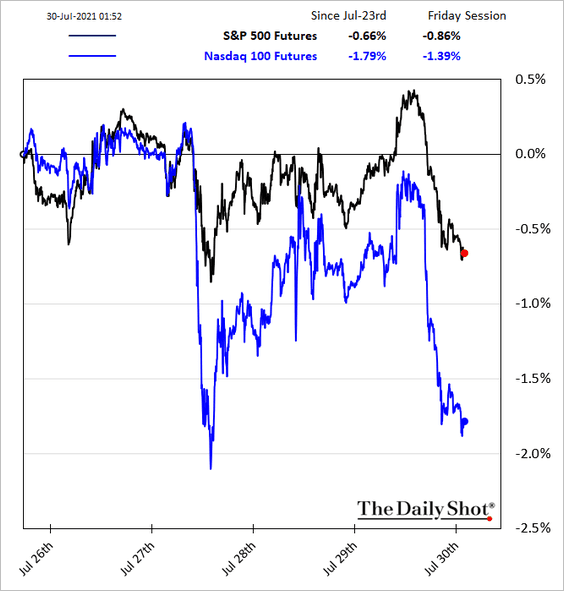
1. Nasdaq 100 futures are softer this morning due to disappointing sales expectations from Amazon.
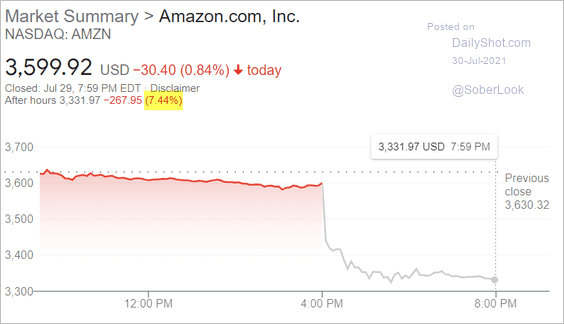 Source: Google
 Source: @WSJ Read full article
——————–
2. Robinhood’s debut session was not what investors (including retail clients) hoped to see. Will this inject some caution into the hot IPO market?
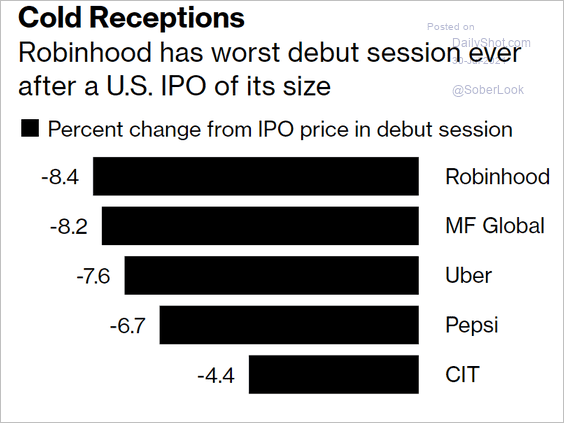 Source: Bloomberg Read full article
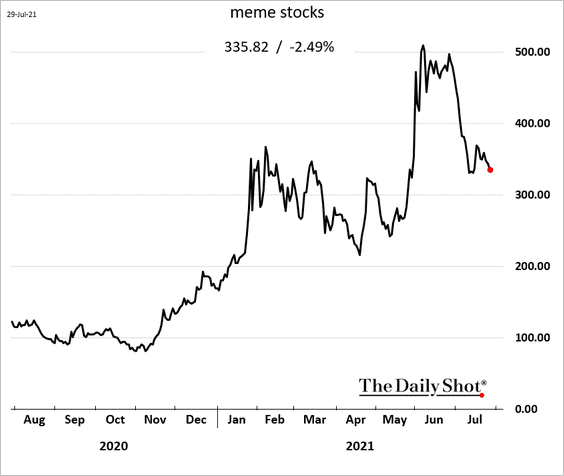
3. Meme stocks are drifting lower.
4. Here is another chart illustrating the unprecedented dip-buying tendency this year.
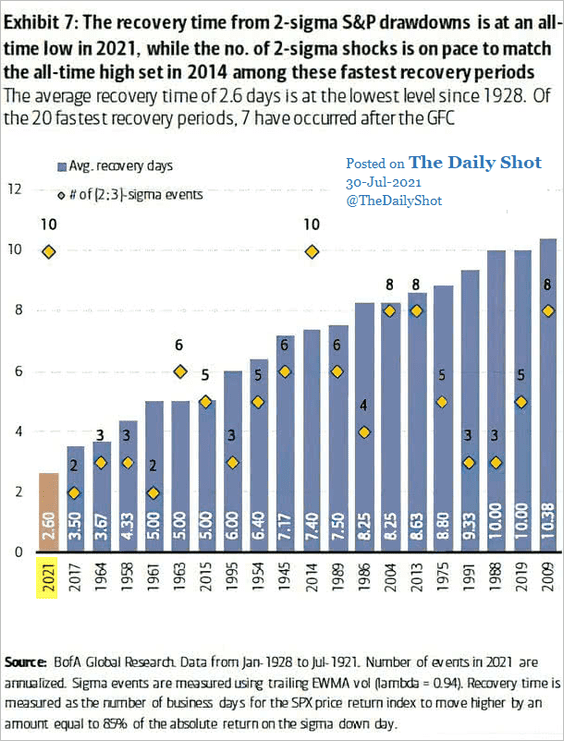 Source: @ISABELNET_SA, @BofAML
5. Hedge funds’ exposure to equities remains elevated.
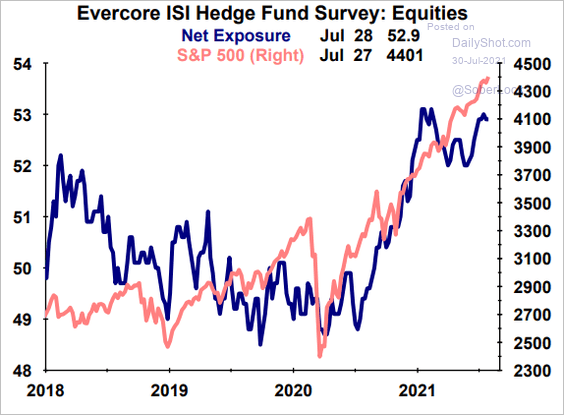 Source: Evercore ISI
Back to Index
Alternatives
1. Global VC activity continues to grow.
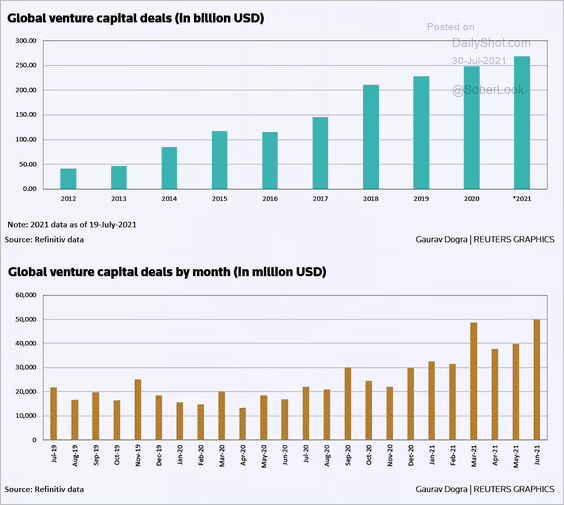 Source: Reuters Read full article
• Fintech investing and exits have been surging.
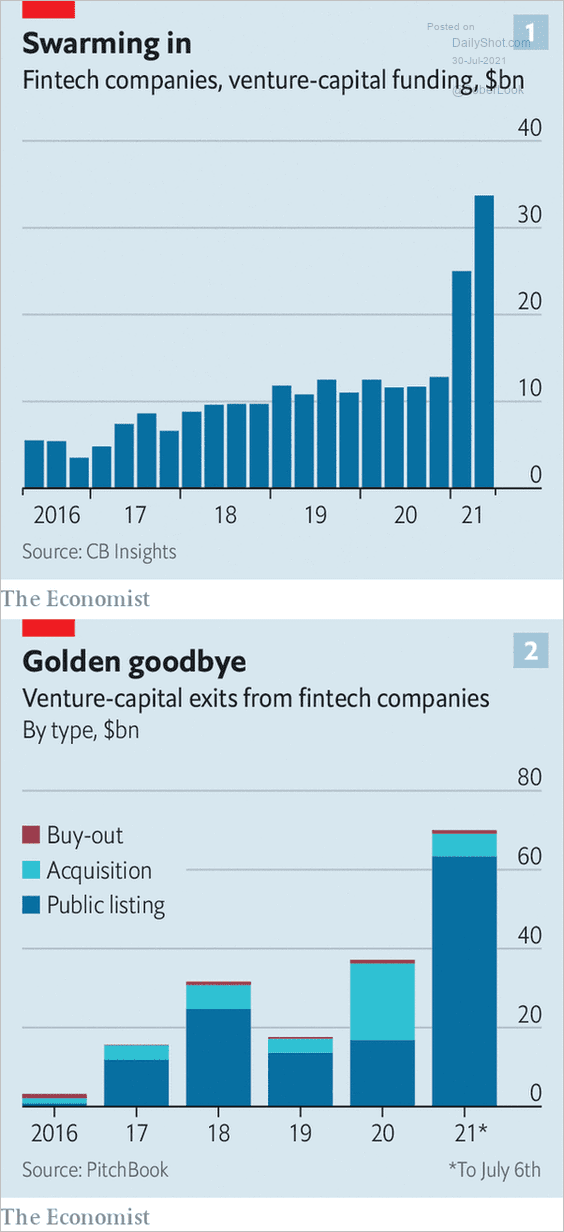 Source: The Economist, h/t Andrea Lisi Read full article
• Here are the top ten VC investors.
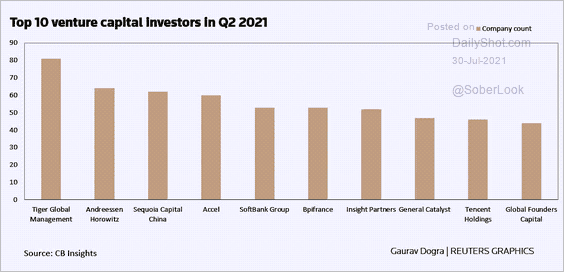 Source: Reuters Read full article
——————–
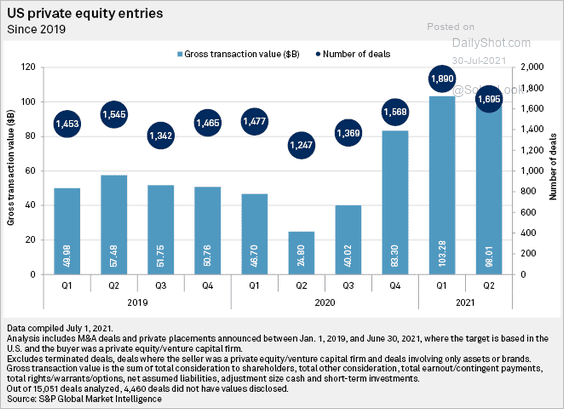
2. Year-to-date private equity investment volume has been exceptionally strong.
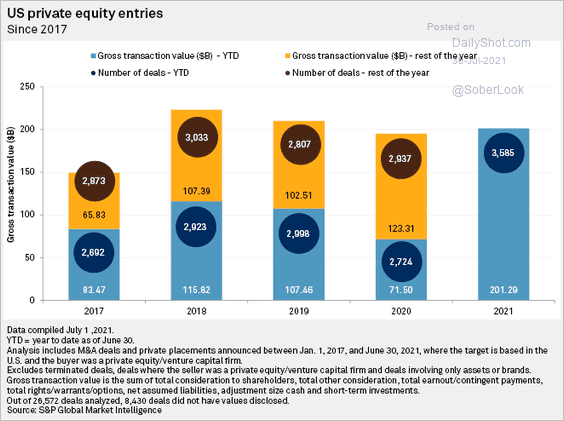 Source: S&P Global Market Intelligence
 Source: S&P Global Market Intelligence
——————–
3. This chart shows the distribution of performance across private-market strategies.
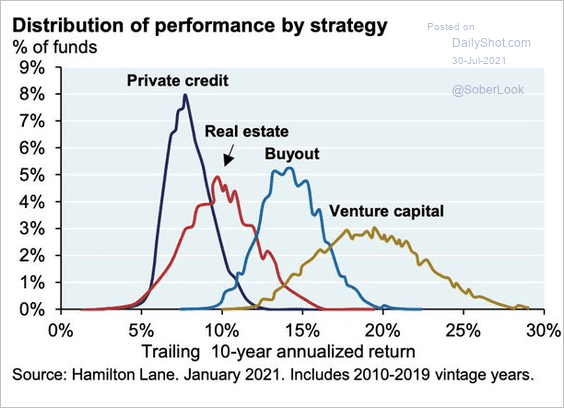 Source: Hamilton Lane; @SnippetFinance
Back to Index
Rates
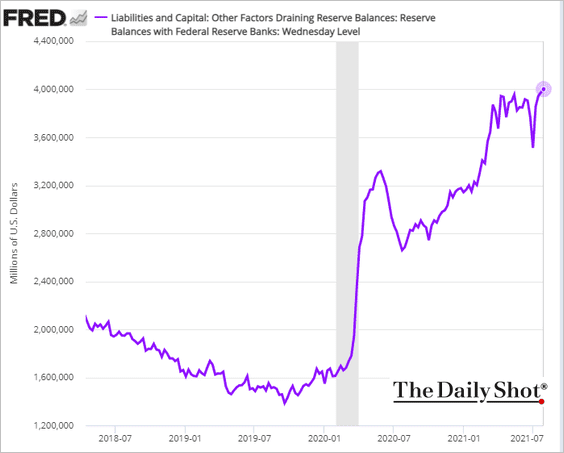
1. The US Treasury’s cash balances at the Fed continue to dwindle.
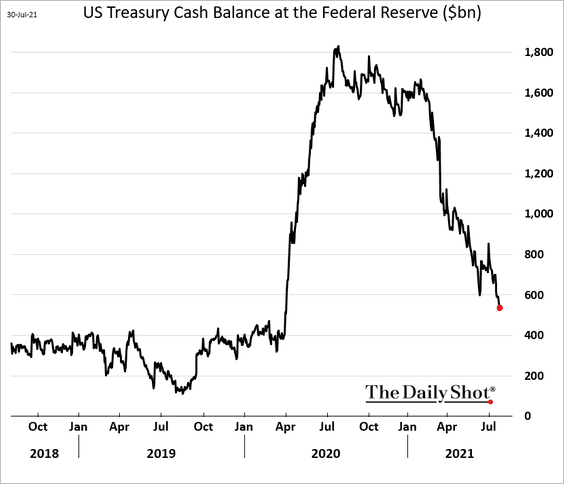
This trend, combined with QE, sent reserve balances above $4 trillion – a new record.
——————–
2. The gap between the 10yr Treasury yield and the copper-to-gold ratio continues to widen.
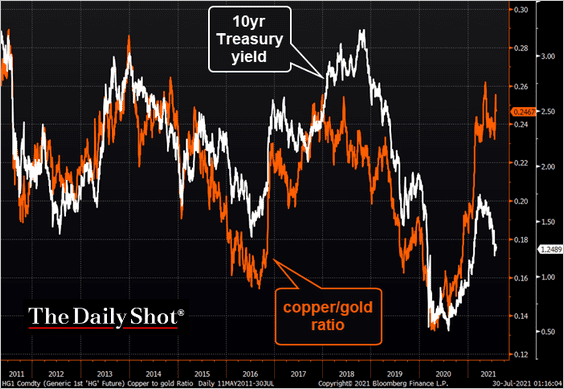 Source: @TheTerminal, Bloomberg Finance L.P.
Back to Index
Global Developments
1. This chart shows advanced economies’ trade as a percent of GDP (as well as GDP per capita).
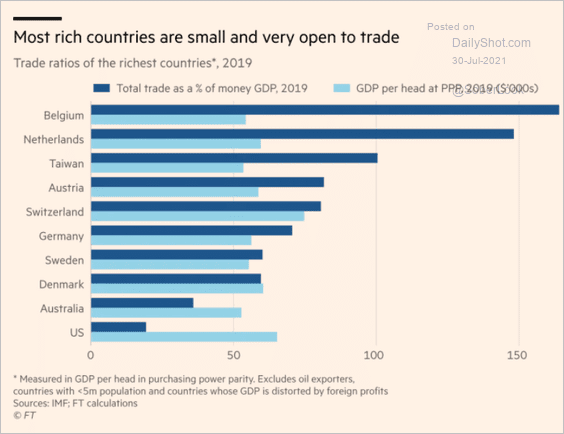 Source: @financialtimes Read full article
2. Global price-to-rent ratios are above the long-term trend but less so than in 2006.
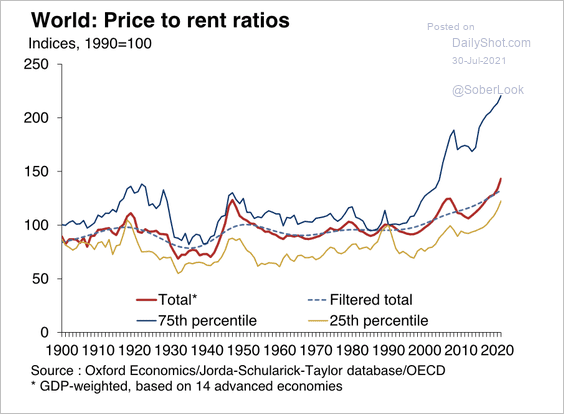 Source: Oxford Economics
3. Finally, we have some data on post-pandemic savings in the US and Europe.
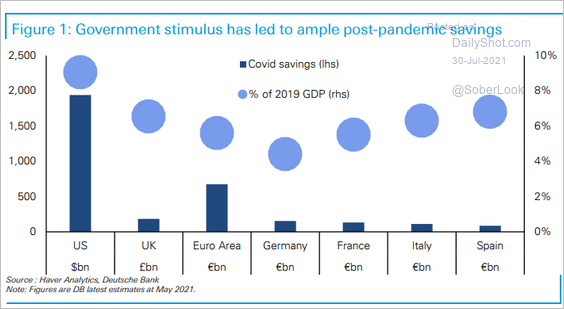 Source: Deutsche Bank Research
——————–
Food for Thought
1. Olympic gold medal bonuses:
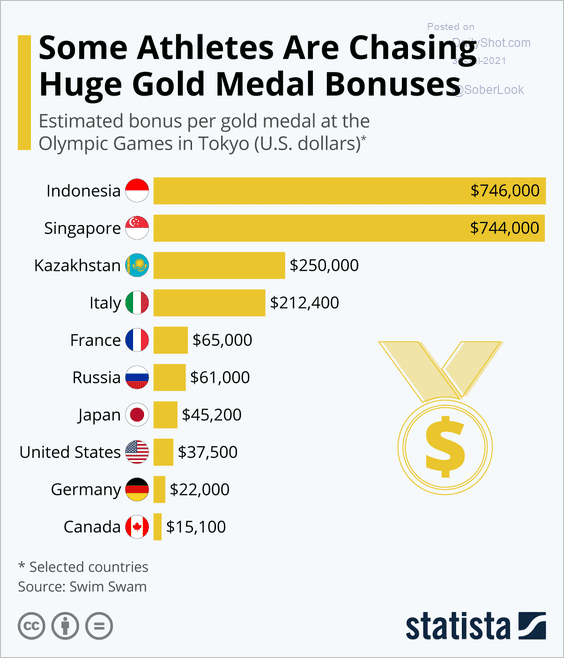 Source: Statista
2. Sports-related costs of the Olympic Games:
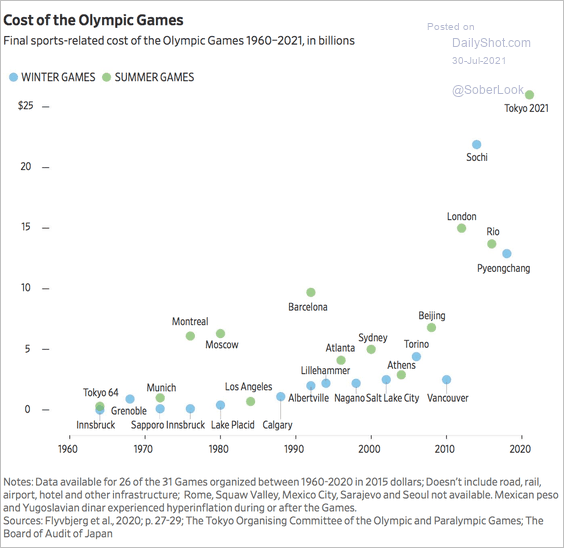 Source: @WSJ Read full article
• Sports-related cost overruns:
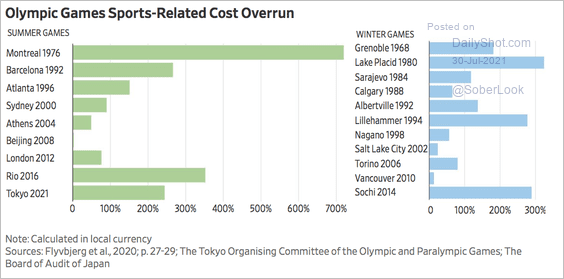 Source: @WSJ Read full article
——————–
3. Olympic medals per million people:
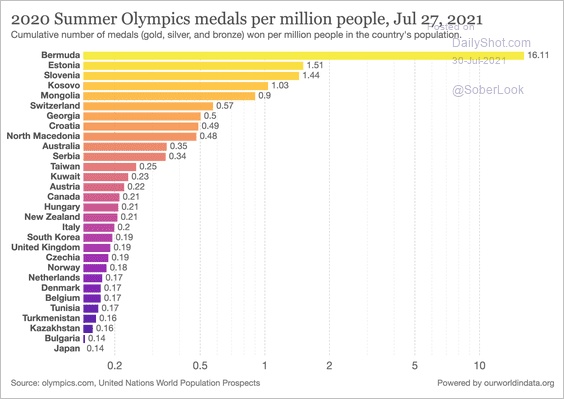 Source: @redouad
4. Vaccine hesitancy:
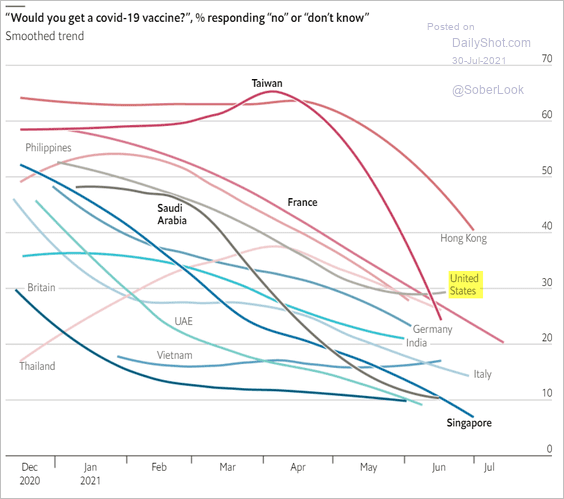 Source: The Economist Read full article
5. Civilian casualties in Afghanistan:
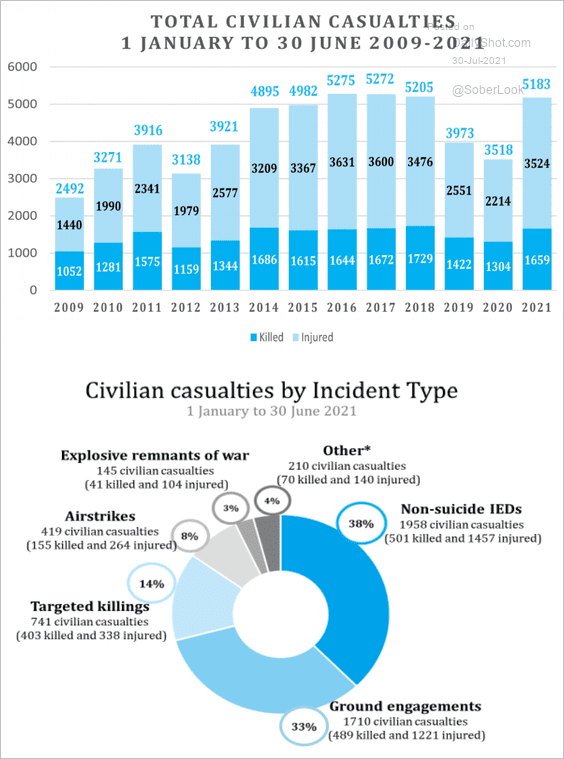 Source: UNAMA
6. Book your next beach vacation in Siberia:
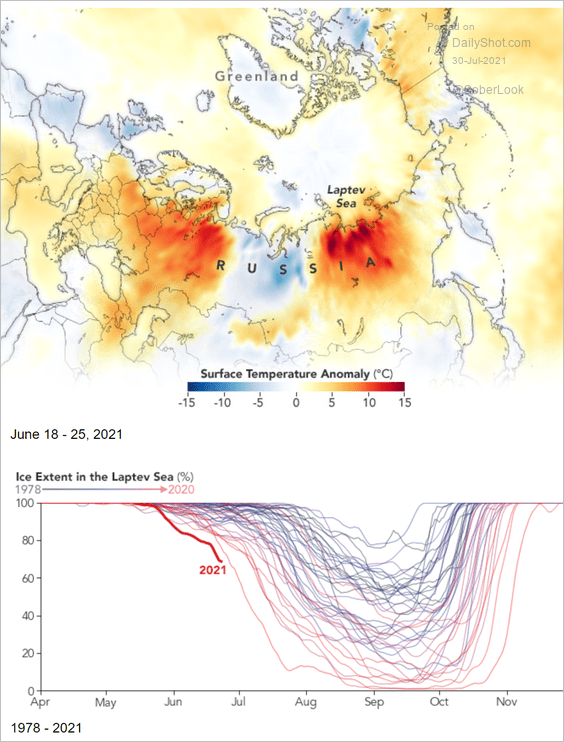 Source: Earth Observatory/NASA Read full article
7. The US infrastructure plan:
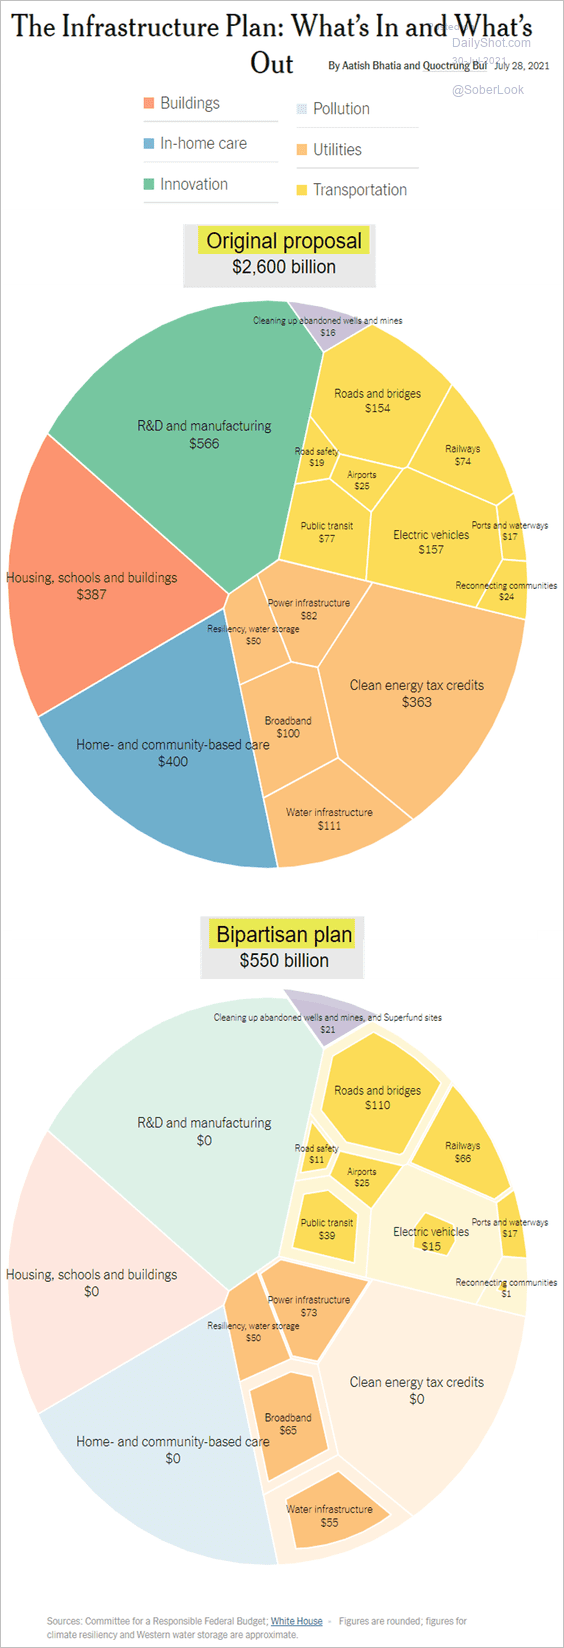 Source: @UpshotNYT Read full article
8. US casino business recovery:
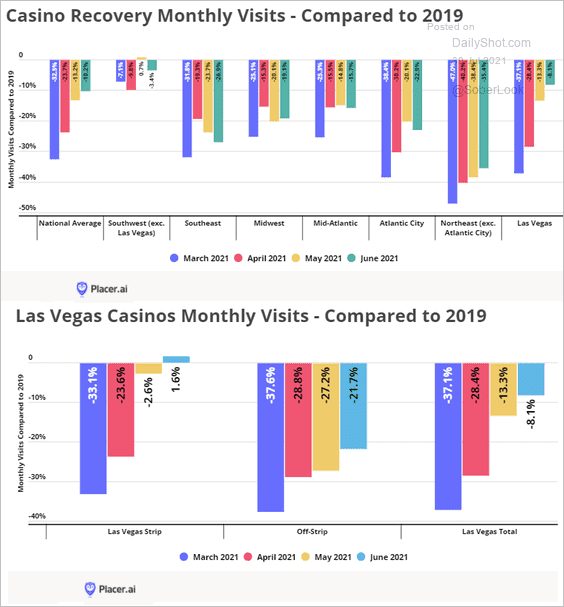 Source: Placer.ai
9. Buying alcohol during lockdowns:
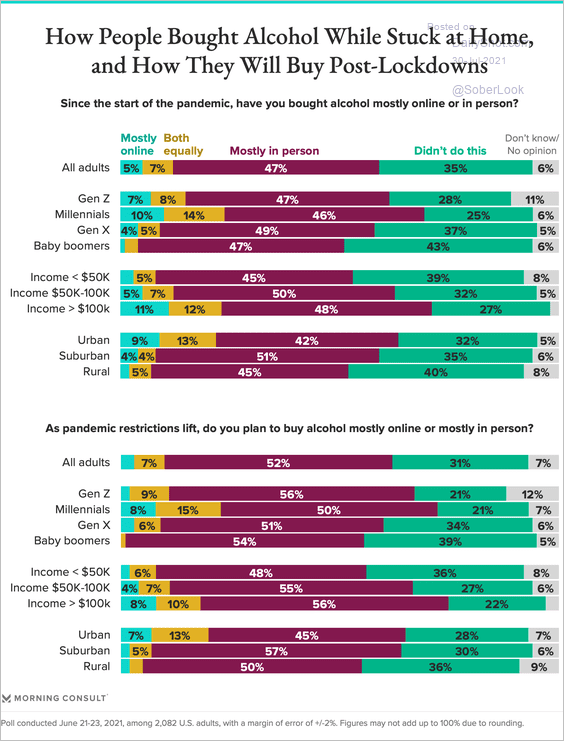 Source: Morning Consult Read full article
10. Gold-medal-winning times in the Men’s 100m sprint:
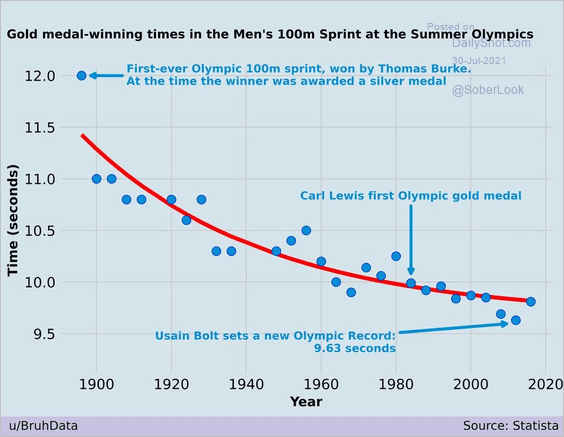 Source: @simongerman600
——————–
Have a great weekend!
Back to Index