
The Daily Shot: 03-Aug-21
• The United States
• The Eurozone
• Europe
• Japan
• Asia – Pacific
• China
• Emerging Markets
• Cryptocurrency
• Commodities
• Energy
• Equities
• Credit
• Rates
• Global Developments
• Food for Thought
The United States
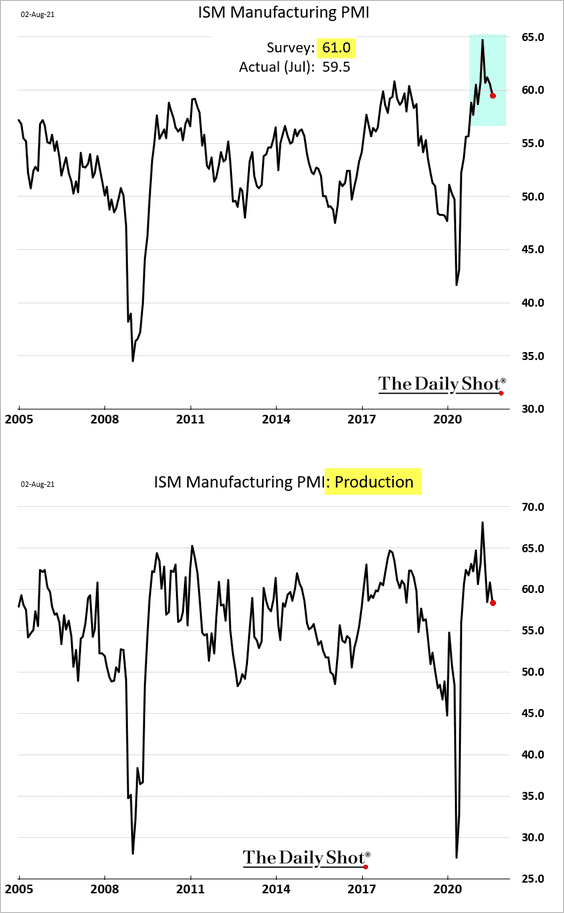
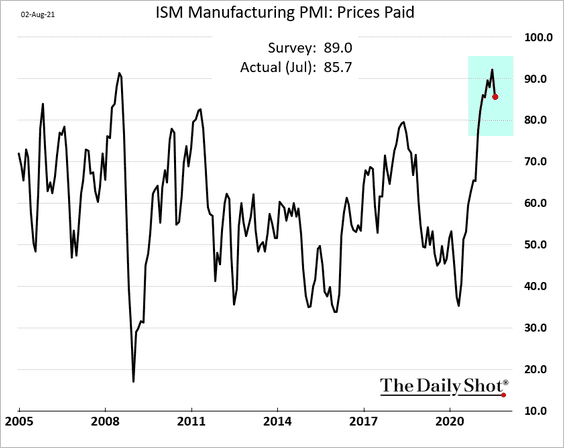
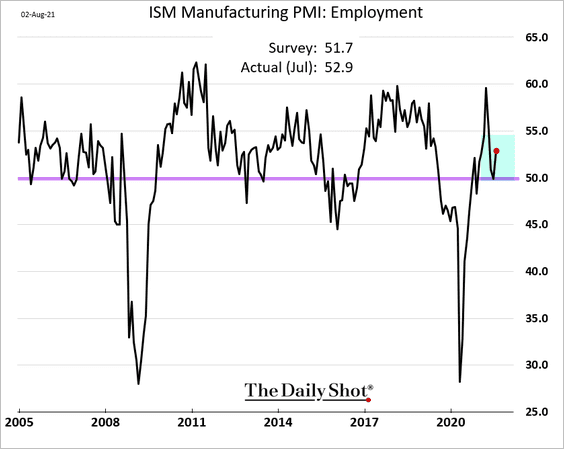
1. The ISM Manufacturing PMI surprised to the downside. To be sure, factory activity remained robust last month, but the pace of growth has easesd from multi-year highs.
Here are the contributions to the ISM index over time.
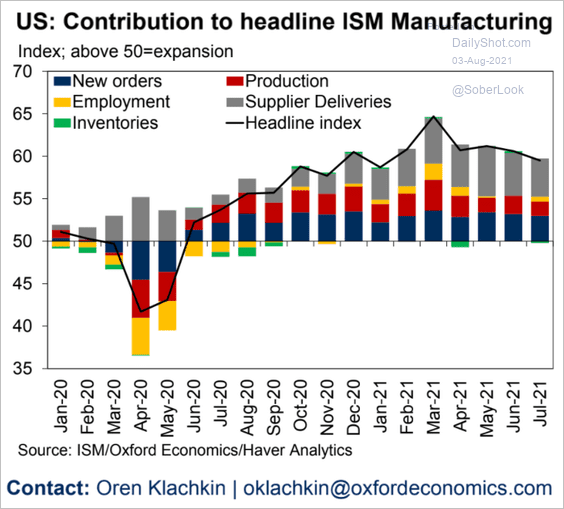 Source: Oxford Economics
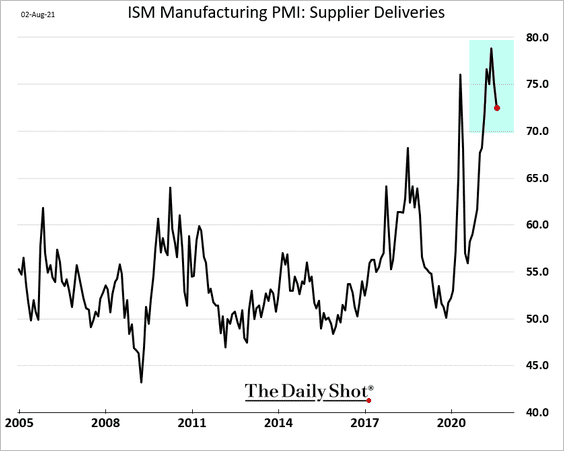
• Supply bottlenecks persist, but the supplier delivery time index is off the peak.
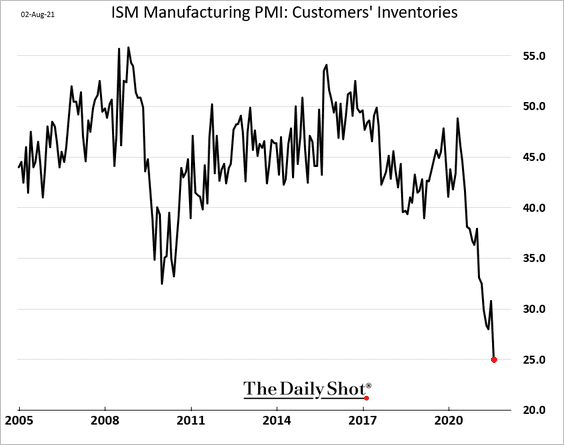
• Manufacturers increasingly see their customers’ inventories as too low.
• Input price growth remains near extremes.
• Hiring improved in July.
——————–
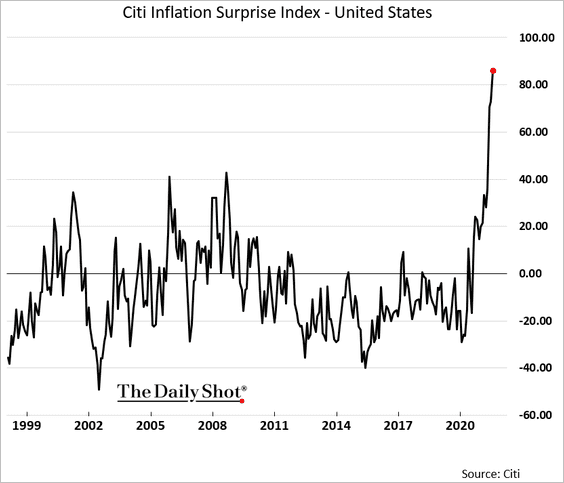
2. The Citi Inflation Surprise Index hit another record high.
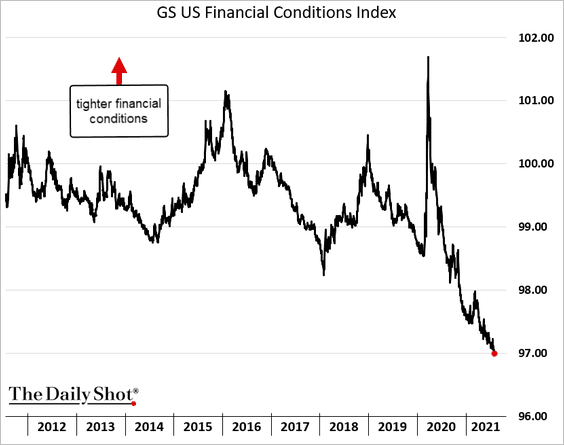
3. Goldman’s financial conditions index shows extreme levels of accommodation.
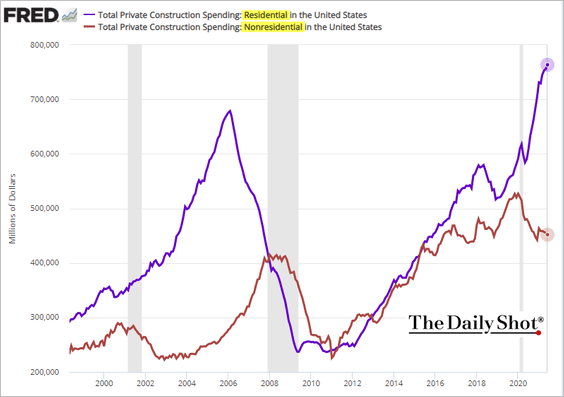
4. Residential and nonresidential construction spending trends continue to diverge.
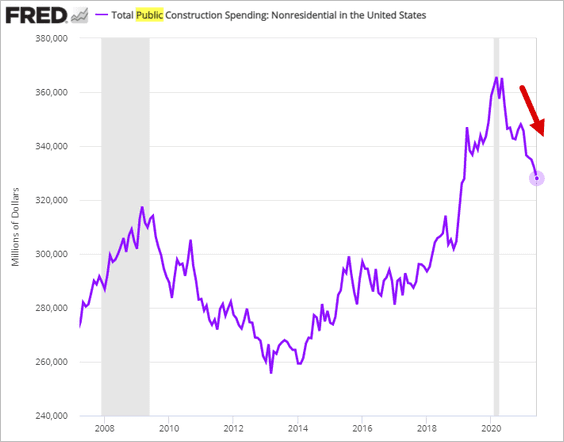
Public construction expenditures are still declining.
——————–
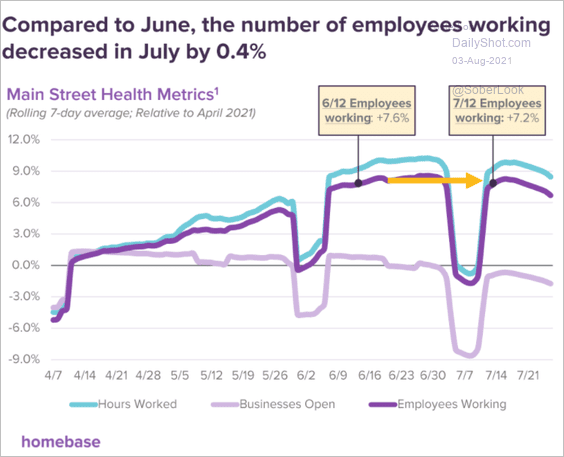
5. The latest Homebase report does not show any improvement in small business employment between June and July.
 Source: Homebase
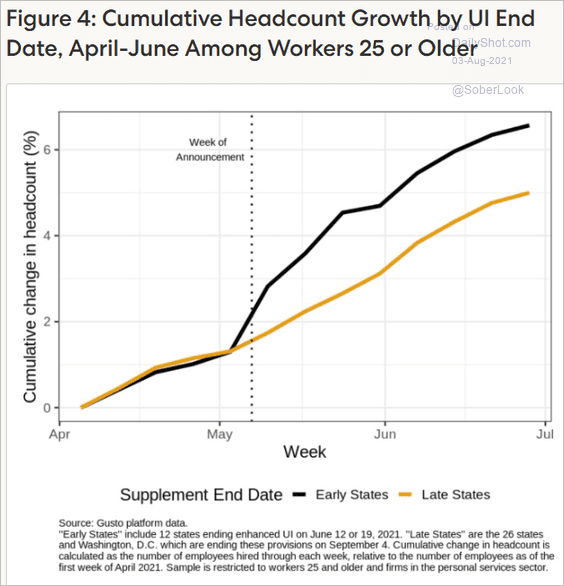
A separate report from Gusto shows small-business headcount improving faster for workers 25 and older in states that ended emergency unemployment benefits early.
 Source: Gusto
But job gains for workers 15-19 years old show the opposite trend.
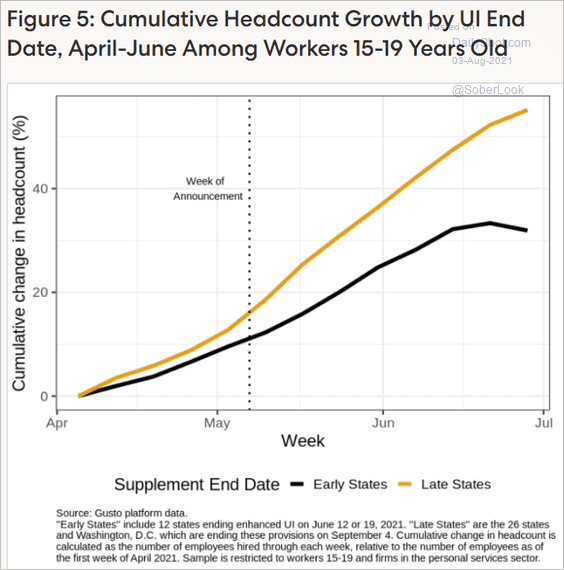 Source: Gusto
Back to Index
The Eurozone
1. The final July PMI reports continue to show strength in factory activity. The PMIs are peaking at highly elevated levels.
• Italy:
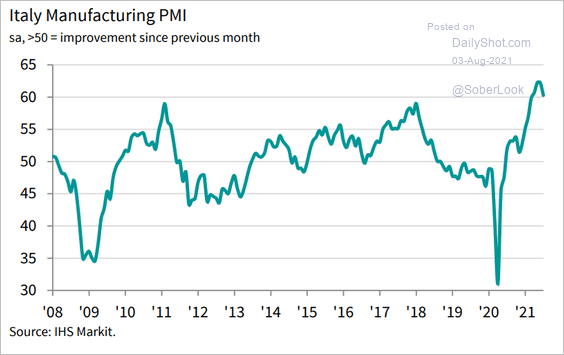 Source: IHS Markit
• Spain:
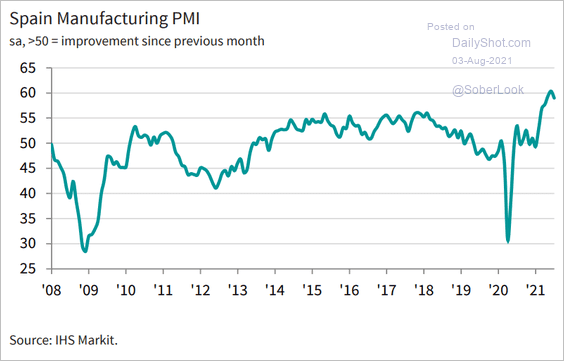 Source: IHS Markit
• The Eurozone:
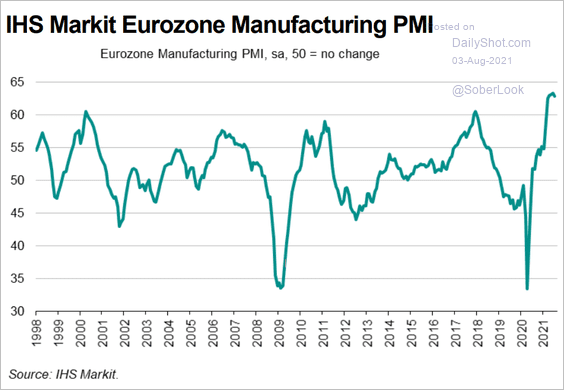 Source: IHS Markit
——————–
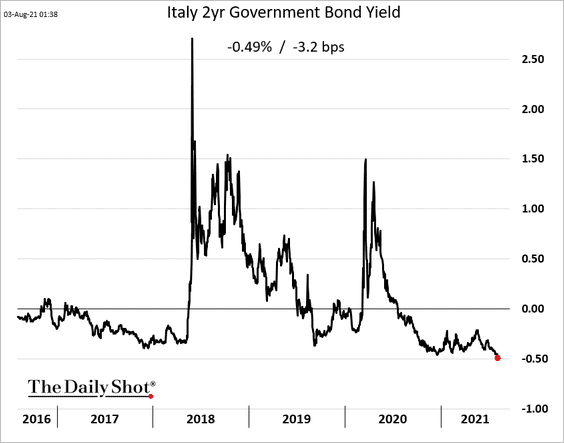
2. Italian 2-year bond yields hit a record low.
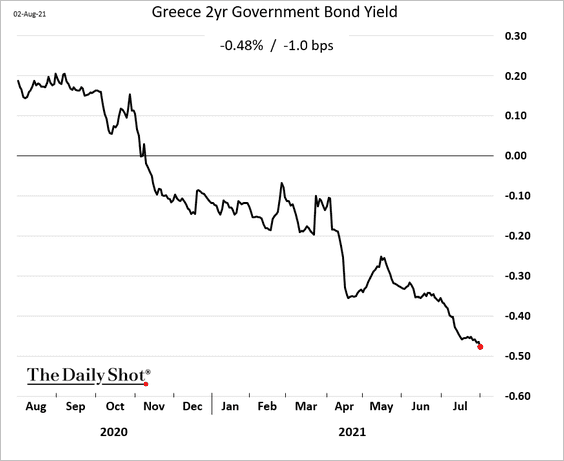
Greek short-term yields are also at the lows.
——————–
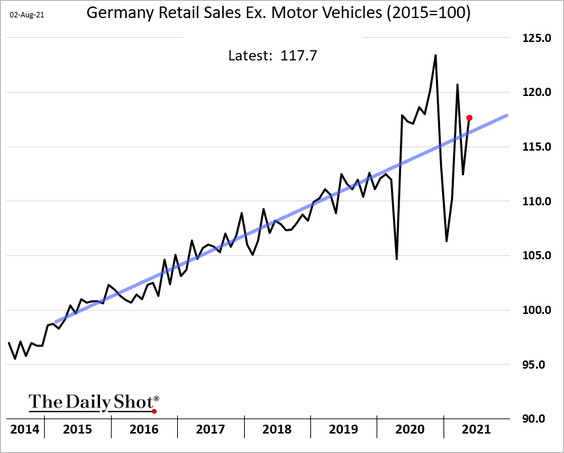
3. German retail sales are following the pre-COVID trend (as of June).
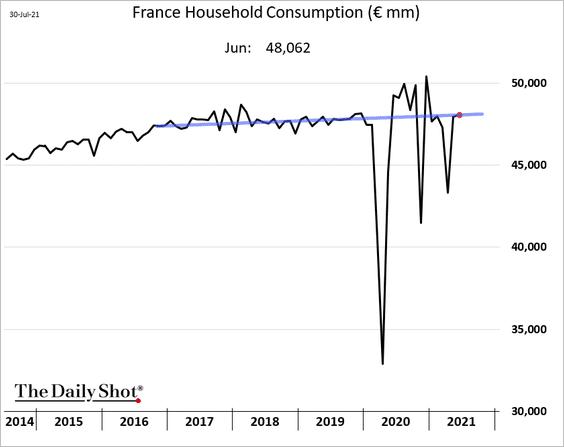
• This chart shows French household consumption.
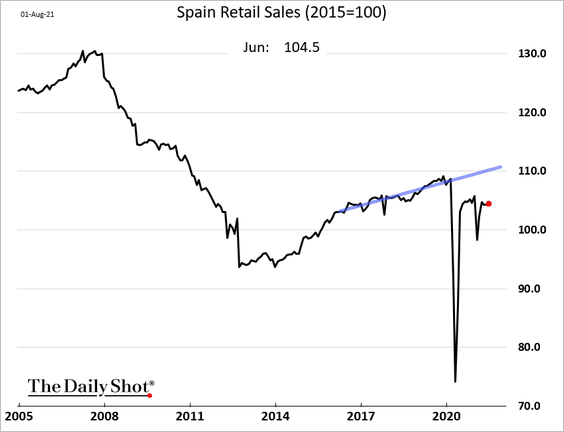
• Retail sales in Spain remain well below trend.
——————–
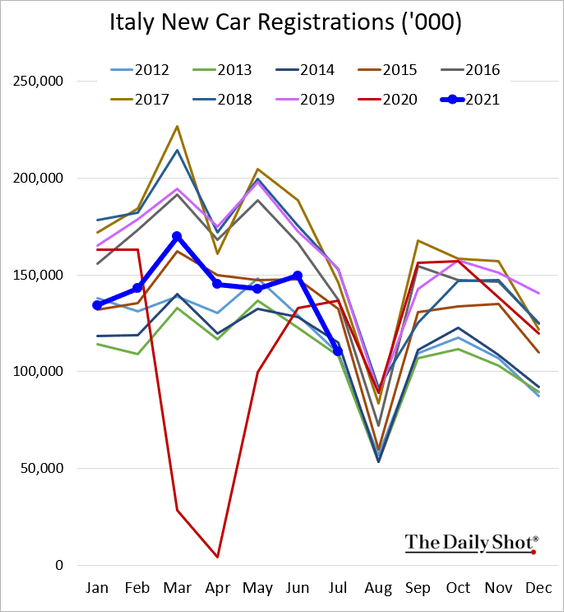
4. Italian new car registrations are below 2020 levels.
Back to Index
Europe
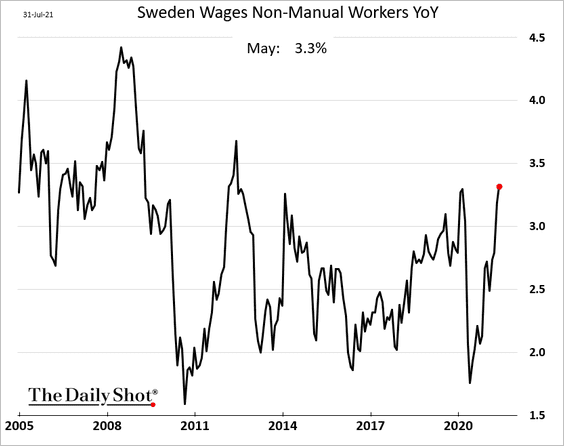
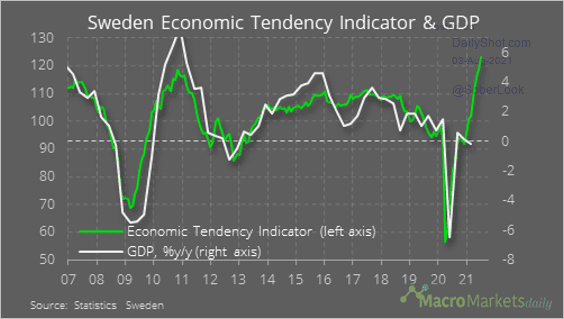
1. Let’s begin with Sweden.
• Wage growth is accelerating.
• Sentiment indicators point to a sharp increase in GDP growth.
 Source: @macro_daily
——————–
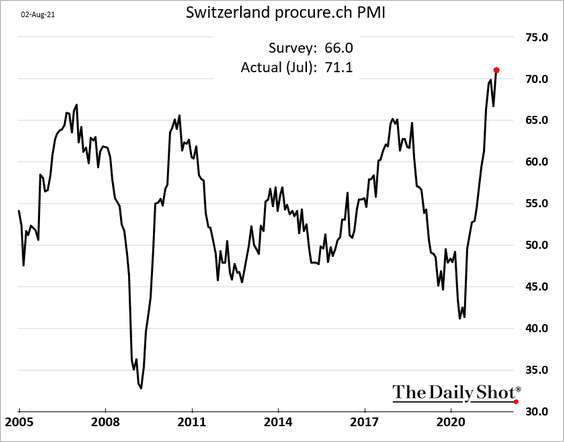
2. Swiss manufacturing growth hit the highest level in at least 25 years.
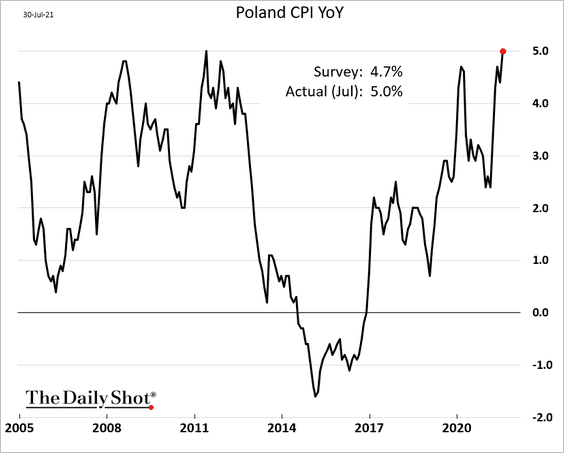
3. Poland’s inflation rate hit 5%, the highest in a decade.
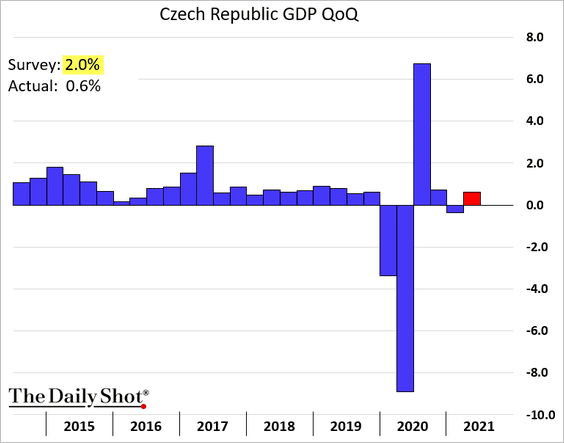
4. The Czech Republic’s Q2 GDP growth surprised to the downside.
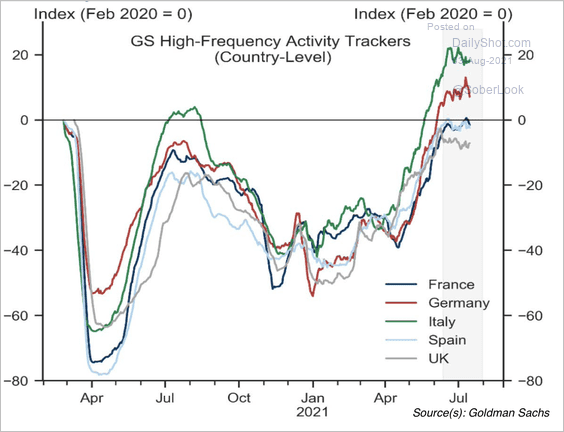
5. High-frequency activity data in the largest European economies peaked in July.
 Source: Goldman Sachs
Back to Index
Japan
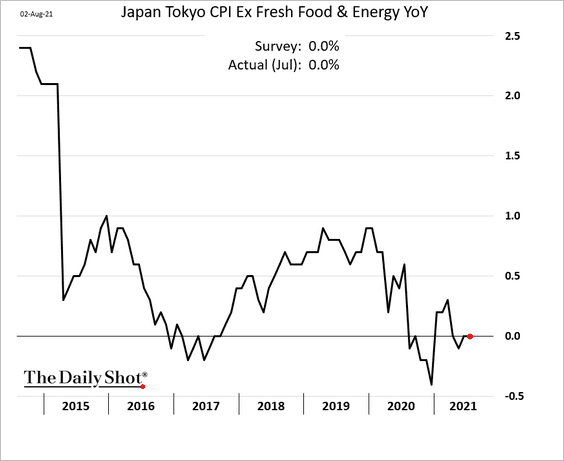
1. Tokyo’s core CPI remained at zero in July.
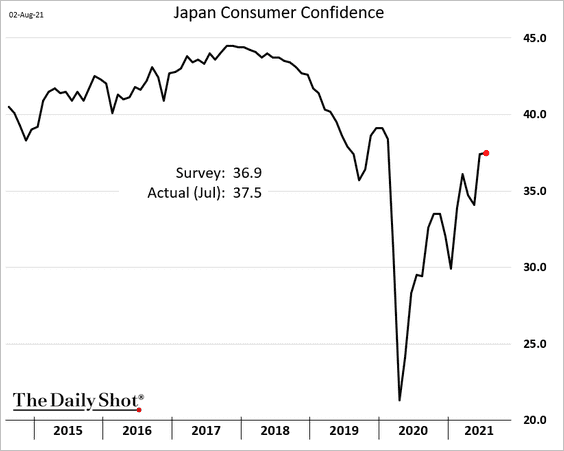
2. Consumer confidence is holding up well considering the pandemic spike.
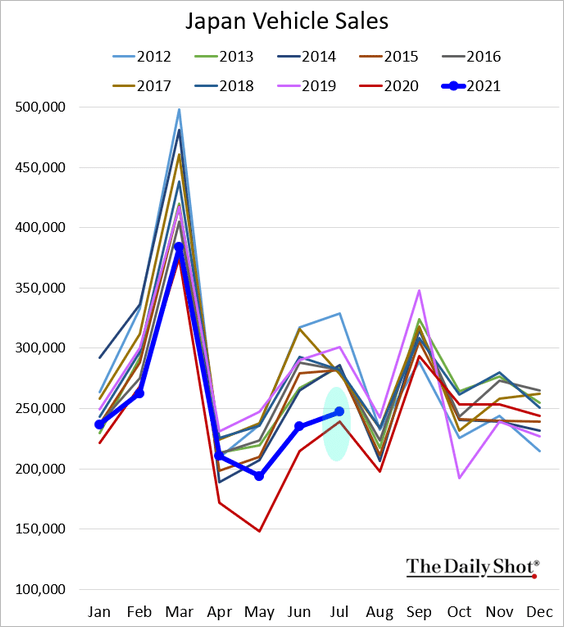
3. Vehicle sales are barely above last year’s levels.
Back to Index
Asia – Pacific
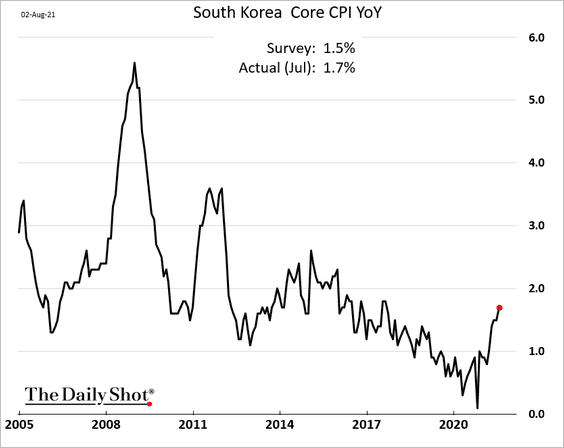
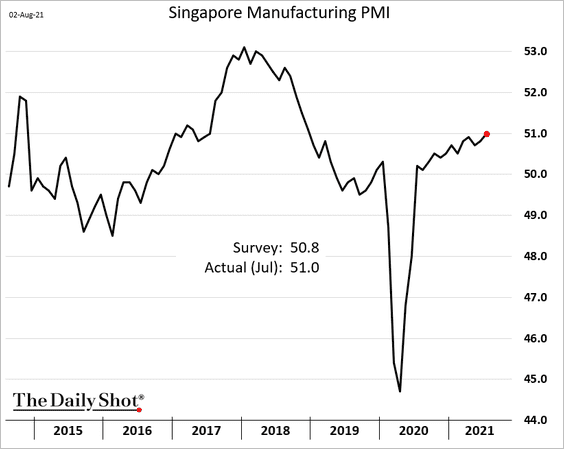
1. South Korea’s core CPI continues to climb.
2. Singapore’s factory activity accelerated last month.
3. Australia’s building approvals tumbled from the highs.
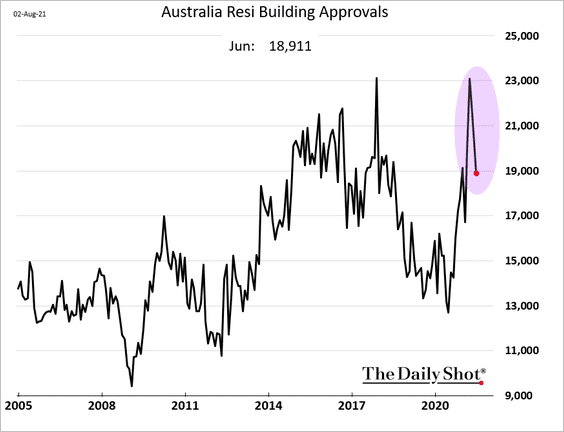
The nation’s housing finance activity remains robust.
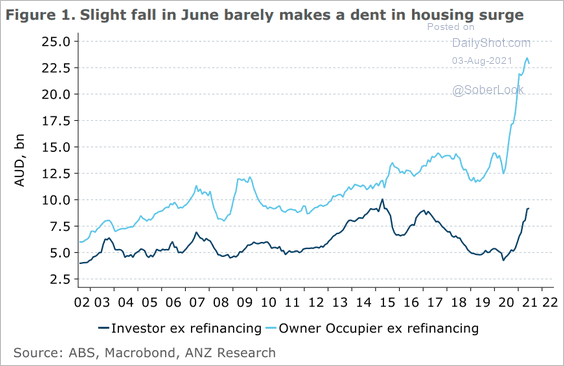 Source: ANZ Research
Australia’s housing investors are encouraged by falling vacancy rates.
 Source: ANZ Research
——————–
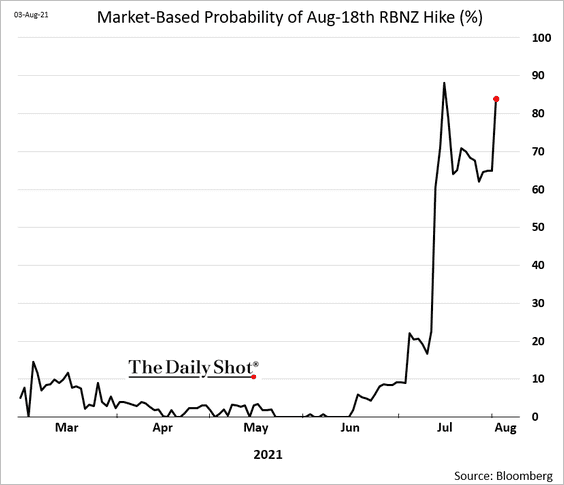
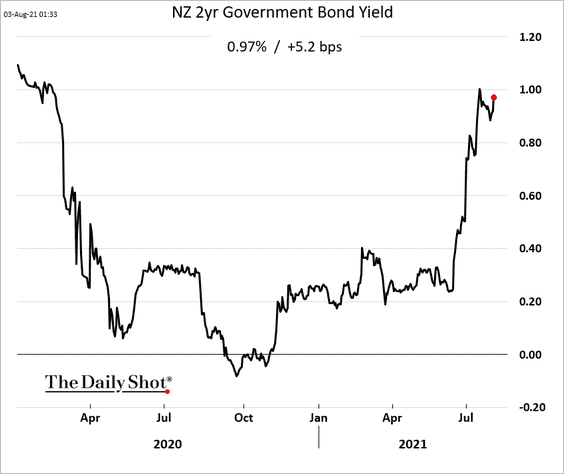
4. New Zealand’s home price appreciation is nearing 25% – the highest across advanced economies.
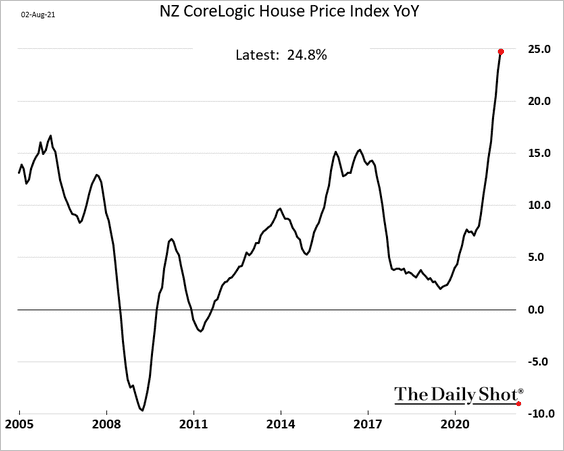
The market expects the RBNZ to hike rates as soon as this month.
Back to Index
China
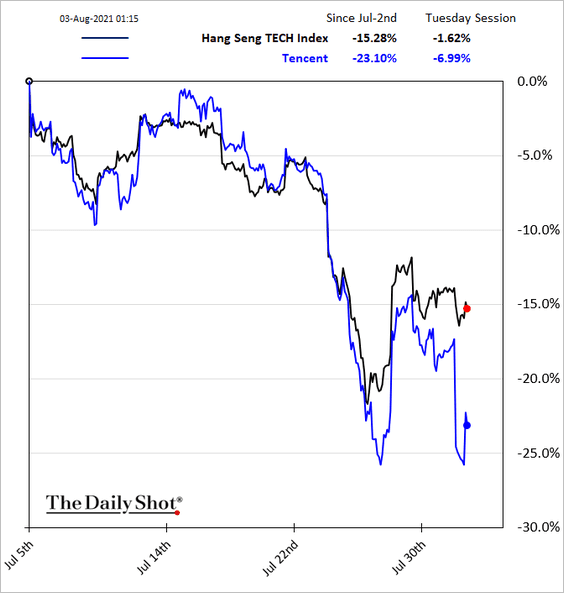
1. Tencent shares are under pressure amid concerns that Beijing may target the gaming industry next.
 Source: South China Morning Post Read full article
——————–
2. The regulatory scrutiny of large Chinese tech firms led to a significant reduction in earnings estimates.
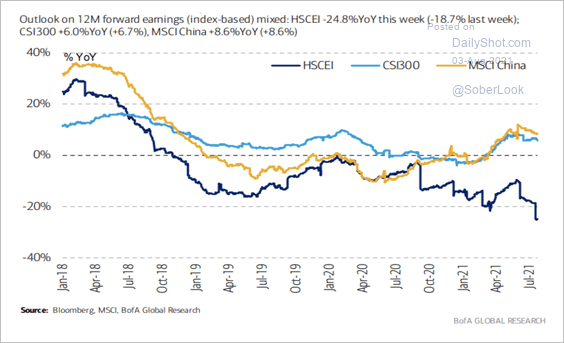 Source: BofA Global Research; {h/t} III Capital Management
Here is a look at Bejing’s regulatory actions.
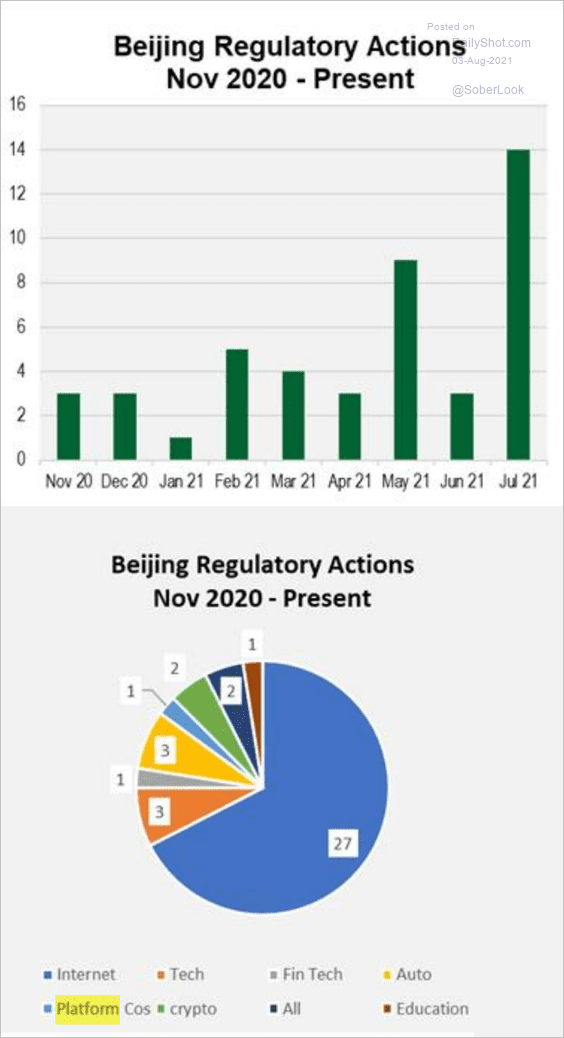 Source: Cornerstone Macro
——————–
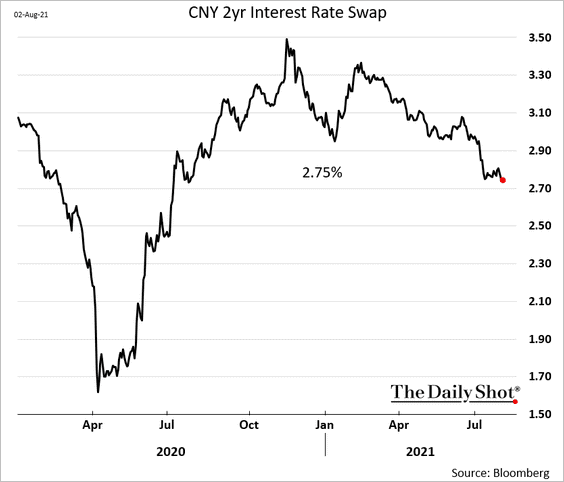
3. Short-term rates have been drifting lower.
• 2yr swap rate:
• Bank CD spreads:
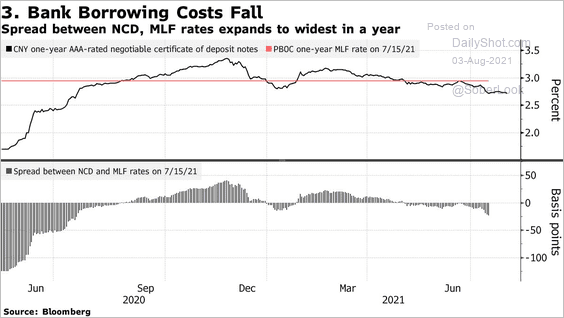 Source: Bloomberg Read full article
——————–
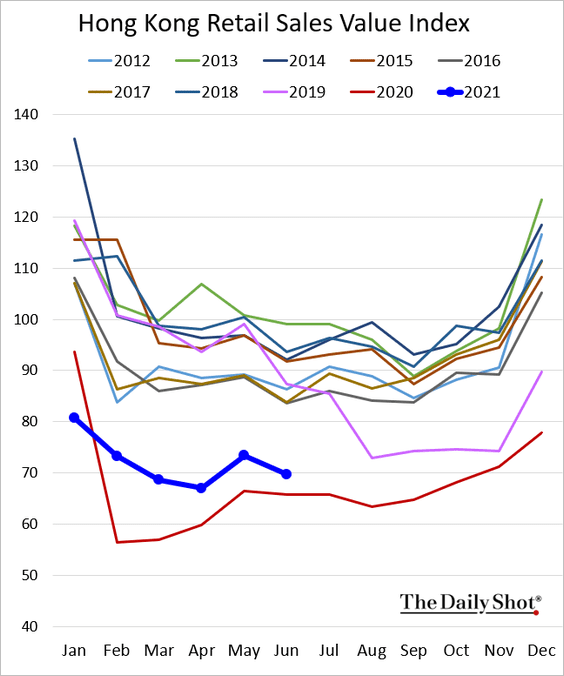
4. Hong Kong’s retail sales are barely above last year’s levels.
Back to Index
Emerging Markets
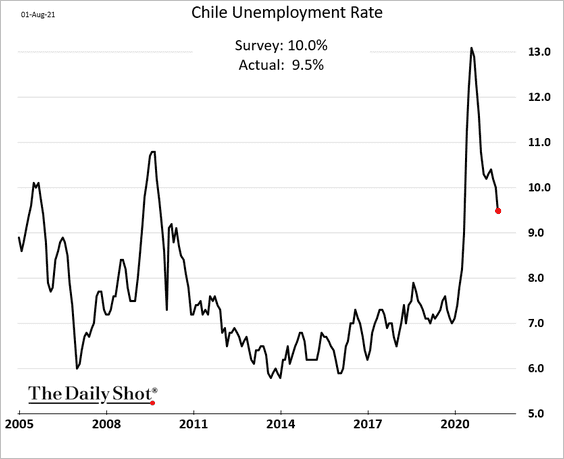
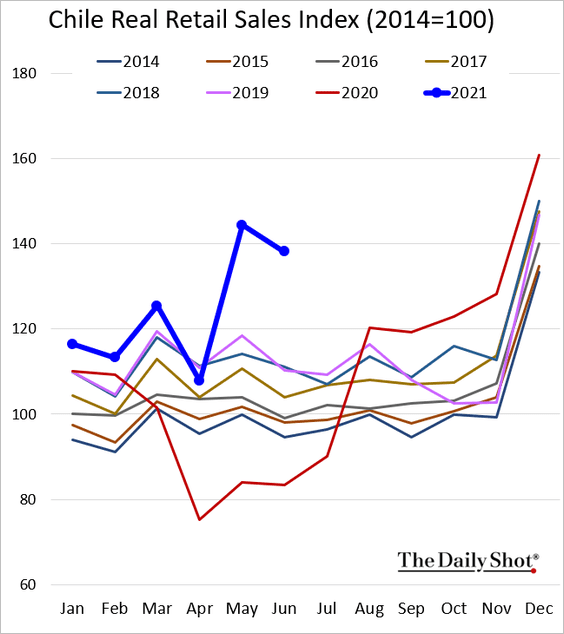
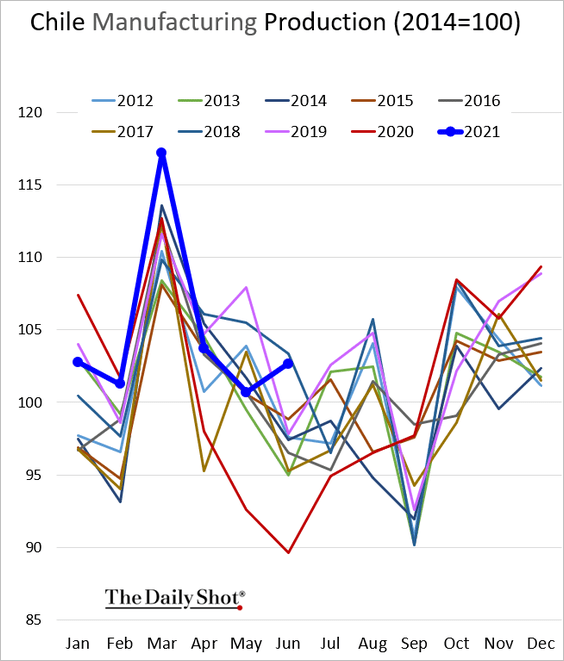
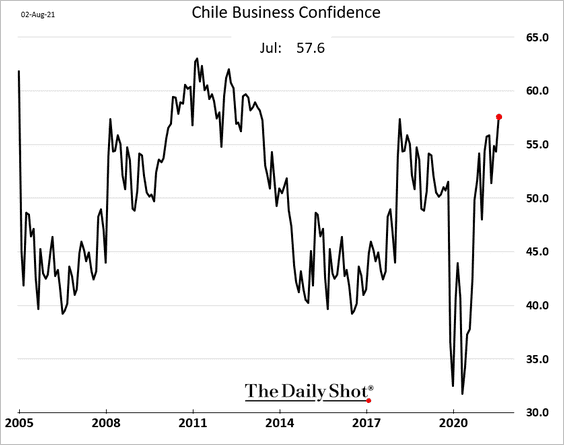
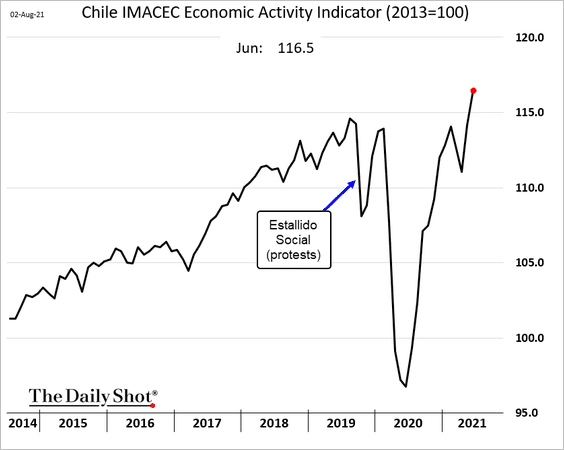
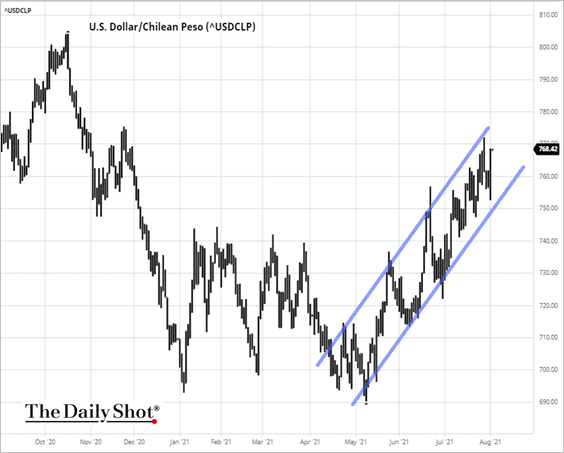
1. Let’s begin with Chile.
• The unemployment rate (lower than expected):
• Retail sales (very strong):
• Industrial production (well above 2019 level):
• Business confidence (multi-year highs):
• Economic activity (rapid growth):
• The peso (continues to weaken vs. USD):
 Source: barchart.com
——————–
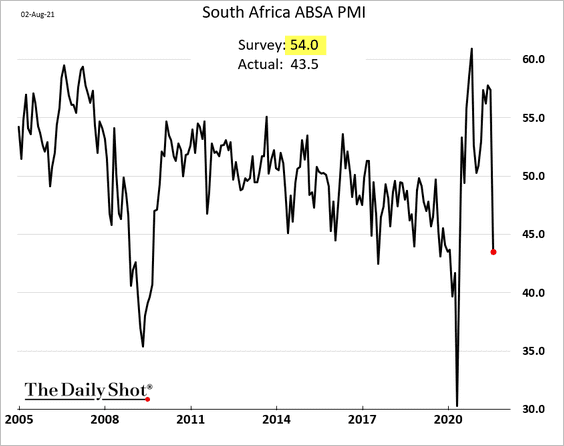
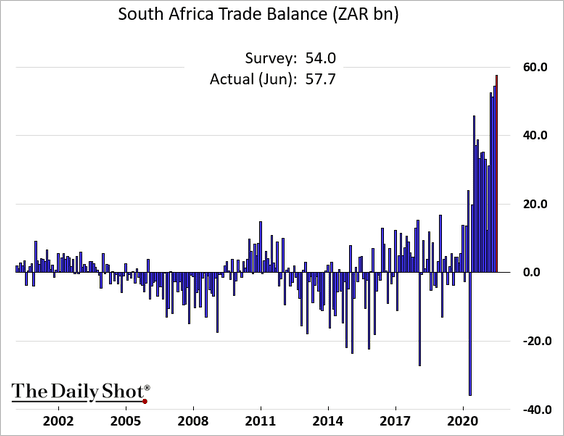
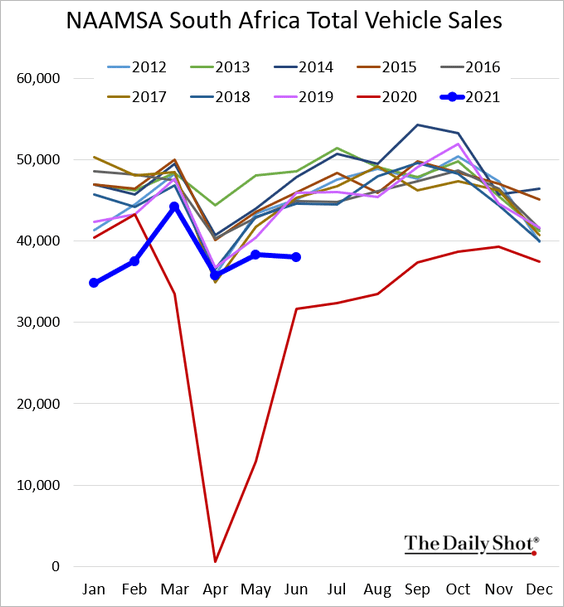
2. Next, we have some updates on South Africa.
• Factory activity tumbled last month.
• Trade surplus is at record highs.
• Vehicle sales remain soft.
• Income inequality increased in recent decades.
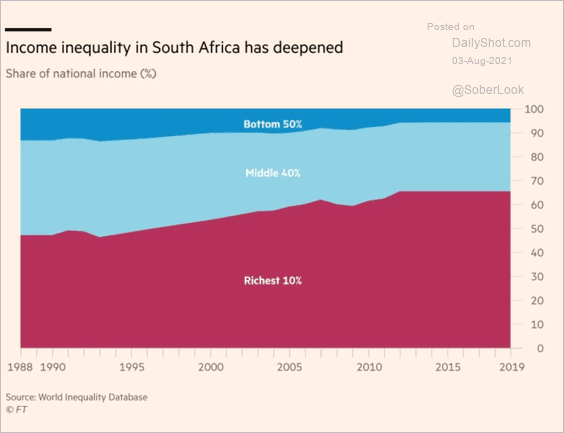 Source: @adam_tooze, @jsphctrl, @FT Read full article
——————–
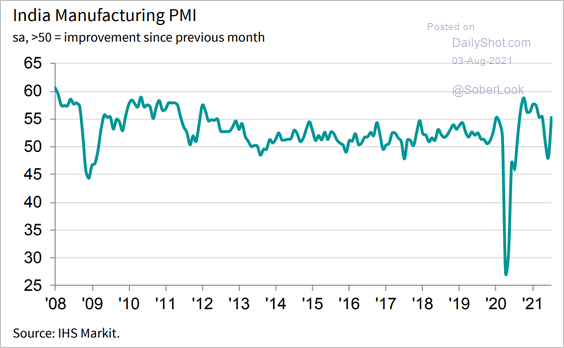
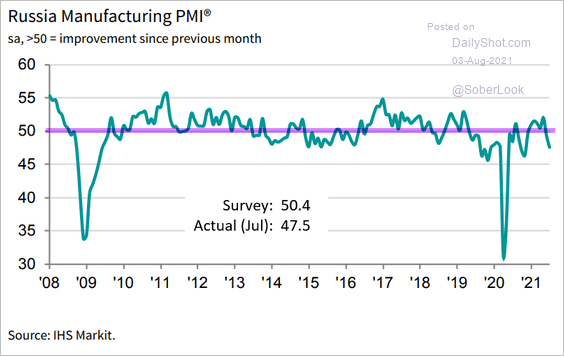
3. Finally, we have some manufacturing PMI updates.
• India (a rebound):
 Source: IHS Markit
• Russia (an unexpected drop):
 Source: IHS Markit
• Mexico (stabilization):
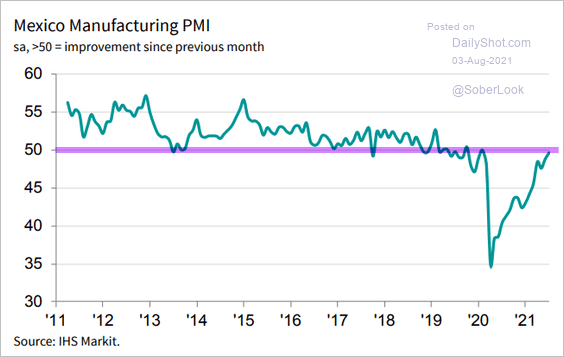 Source: IHS Markit
Back to Index
Cryptocurrency
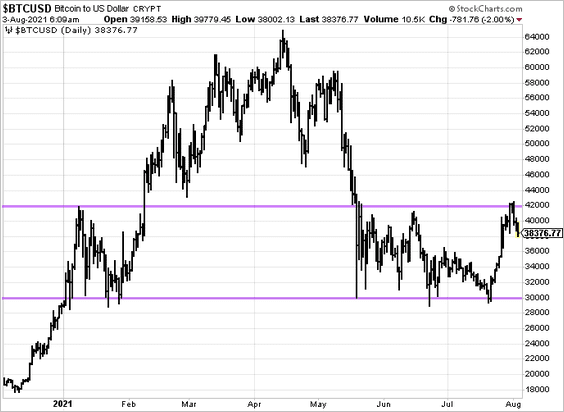
1. Bitcoin held resistance near $42k.
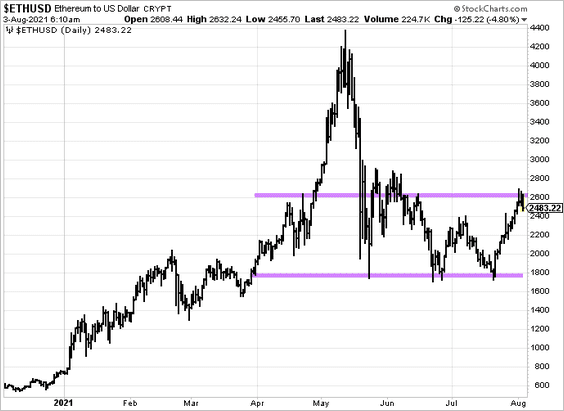
Ethereum also held resistance (at $2600).
——————–
2. Search activity for mortgage loans and entry-level jobs has been correlated with Bitcoin prices recently.
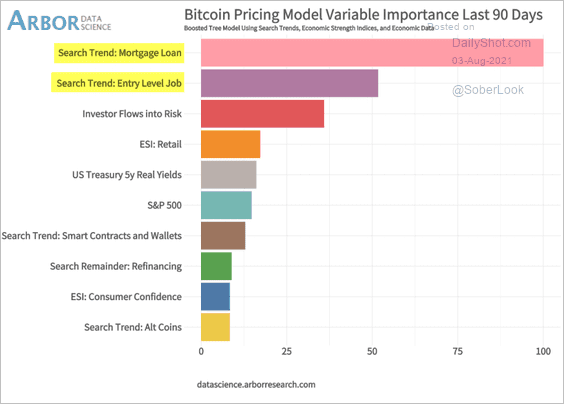 Source: Arbor Research & Trading
Emerging markets fund flows have been highly correlated with Ethereum.
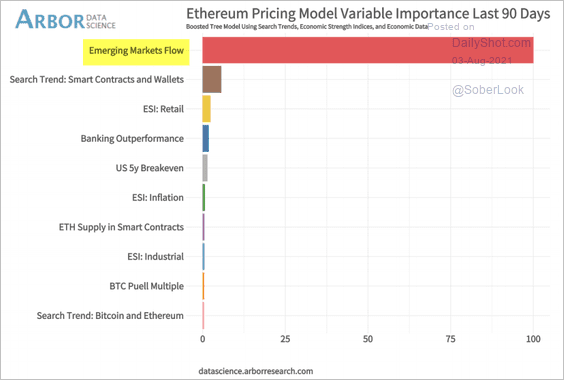 Source: Arbor Research & Trading
Back to Index
Commodities
1. This chart shows the year-to-date and July performance across major commodity categories.
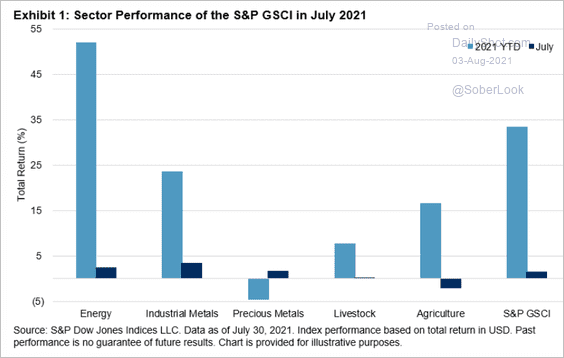 Source: S&P Global Market Intelligence
2. Bloomberg’s grains index is at resistance.
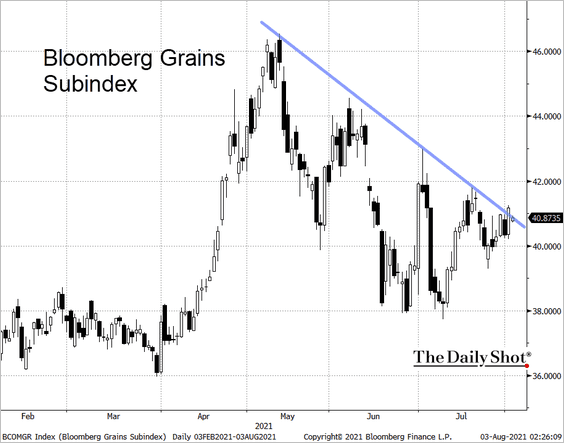 Source: @TheTerminal, Bloomberg Finance L.P.
Back to Index
Energy
1. US rig count continues to lag oil prices (2 charts).
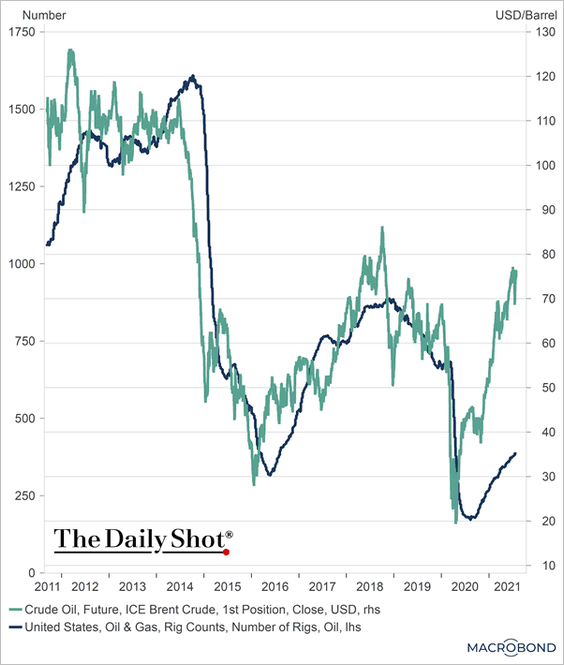 Source: Chart and data provided by Macrobond
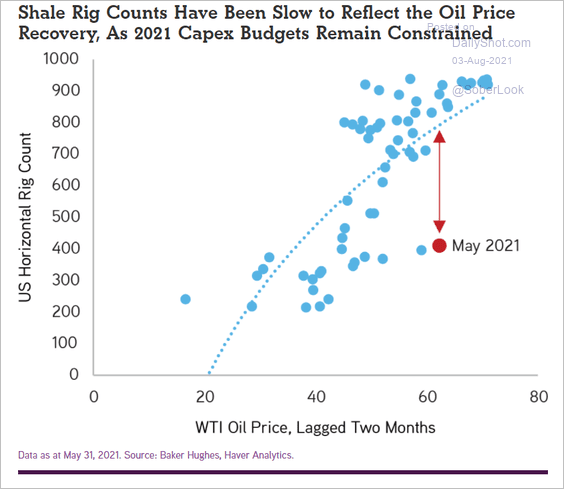 Source: Henry H. McVey, KKR
——————–
2. Upstream investment could continue to fall due to increased decarbonization efforts, according to Fitch.
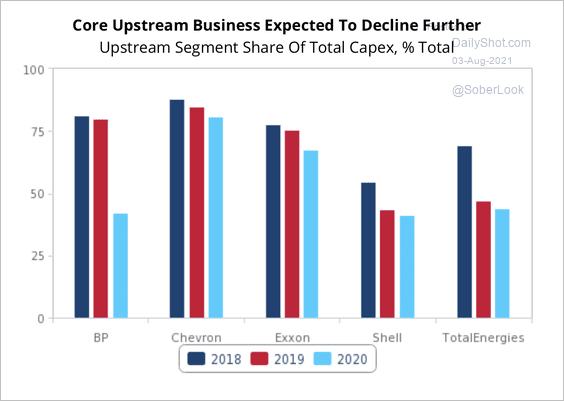 Source: Fitch Solutions Macro Research
3. Iranian crude oil exports are starting to recover.
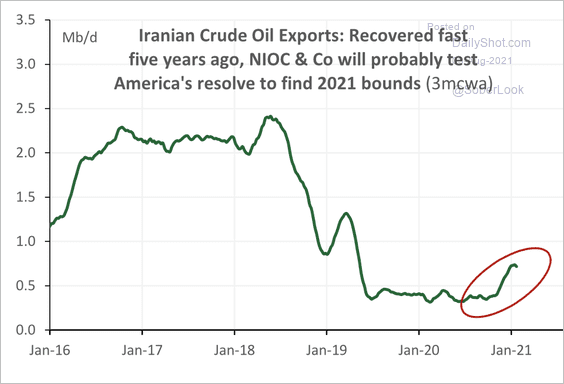 Source: Cornerstone Macro
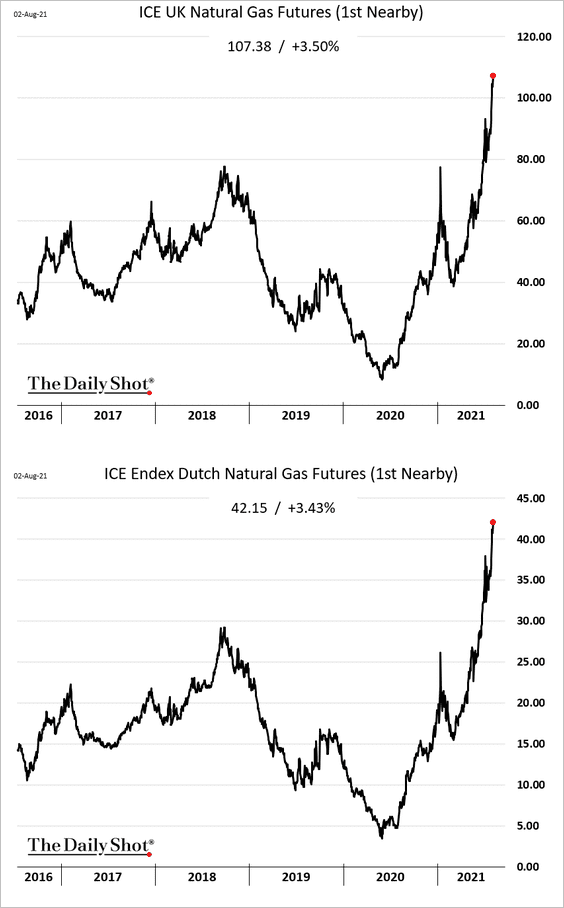
4. Europen natural gas prices continue to surge.
5. US LNG exports to Europe and Asia have been a significant source of incremental natural gas demand over the past year (2 charts).
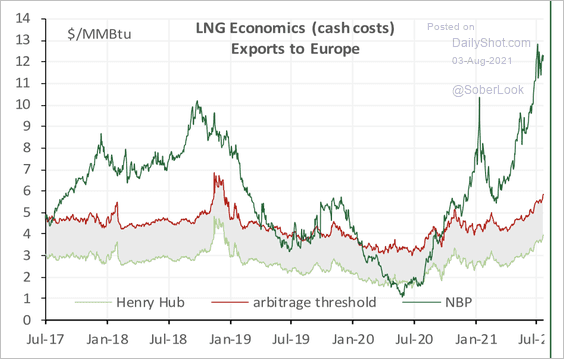 Source: Cornerstone Macro
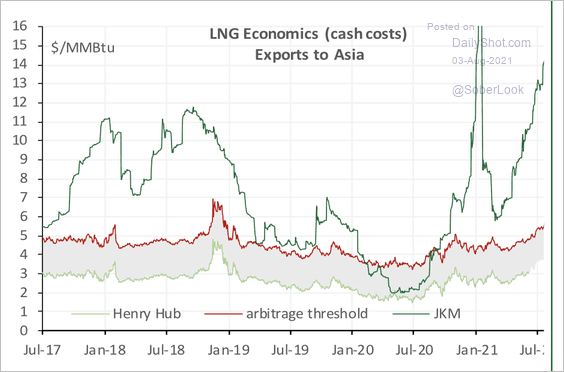 Source: Cornerstone Macro
Back to Index
Equities
1. Some $5 trillion of global excess savings have been a tailwind for stocks.
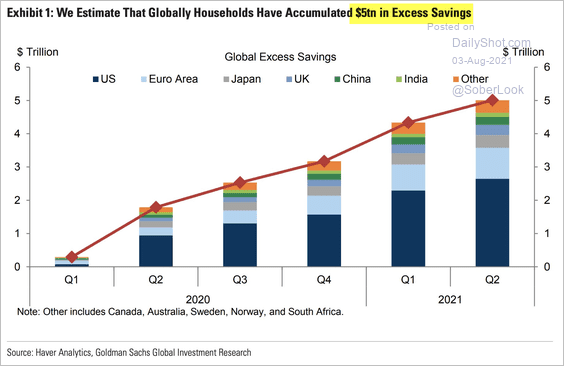 Source: Goldman Sachs; @Schuldensuehner
2. A record number of S&P 500 companies are beating earnings estimates.
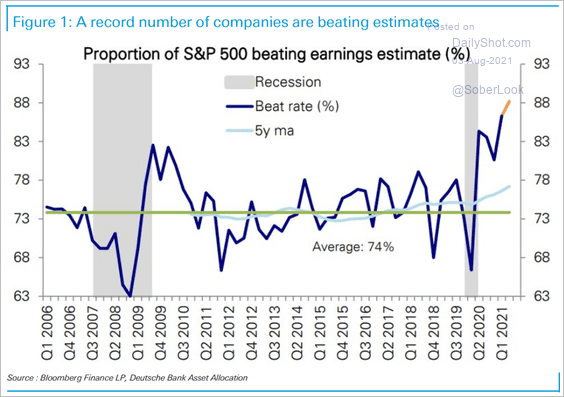 Source: Deutsche Bank Research
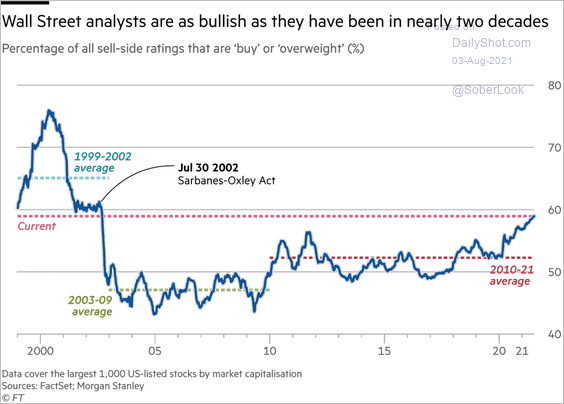
3. Sell-side analysts haven’t been this upbeat on stocks in a couple of decades.
 Source: @financialtimes Read full article
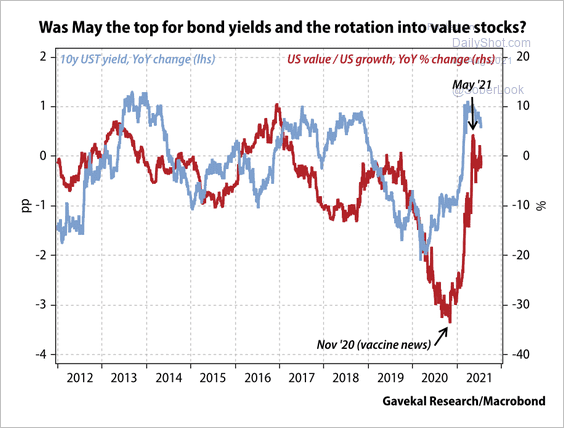
4. The recent decline in bond yields has benefitted value stocks.
 Source: Gavekal Research
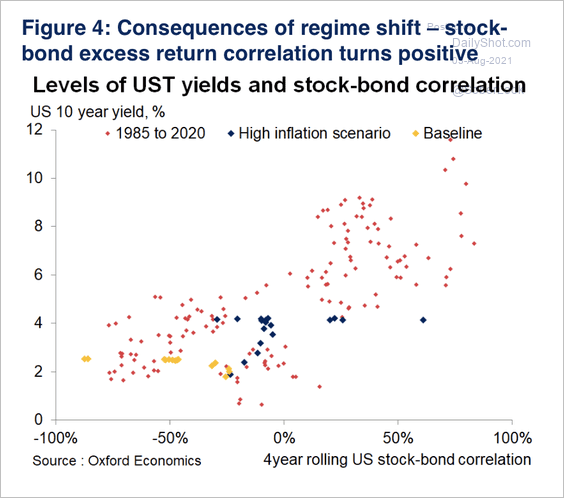
5. A shift into a high inflation regime tends to result in a positive stock/bond correlation.
 Source: Oxford Economics
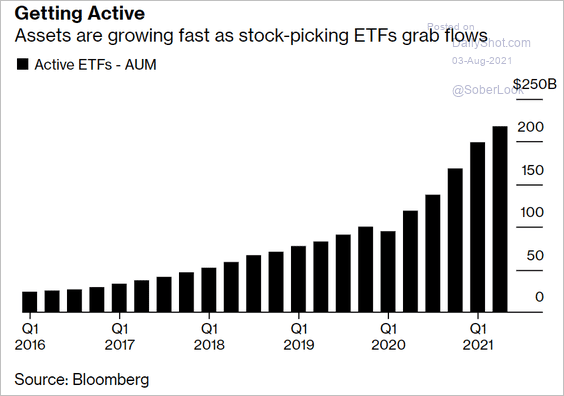
6. Actively managed ETFs are attracting more capital these days.
 Source: Bloomberg Read full article
Back to Index
Credit
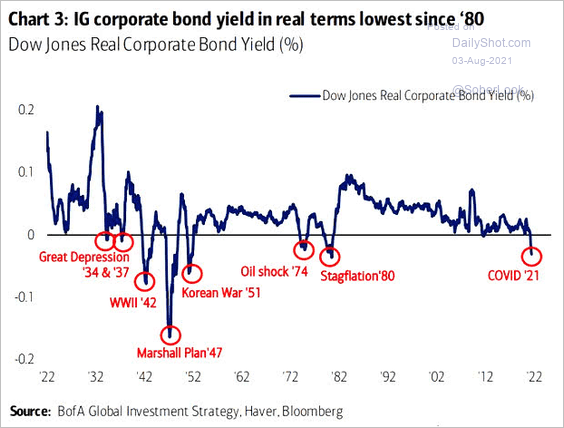
1. Real investment-grade yields remain in negative territory.
 Source: @ISABELNET_SA, @BofAML
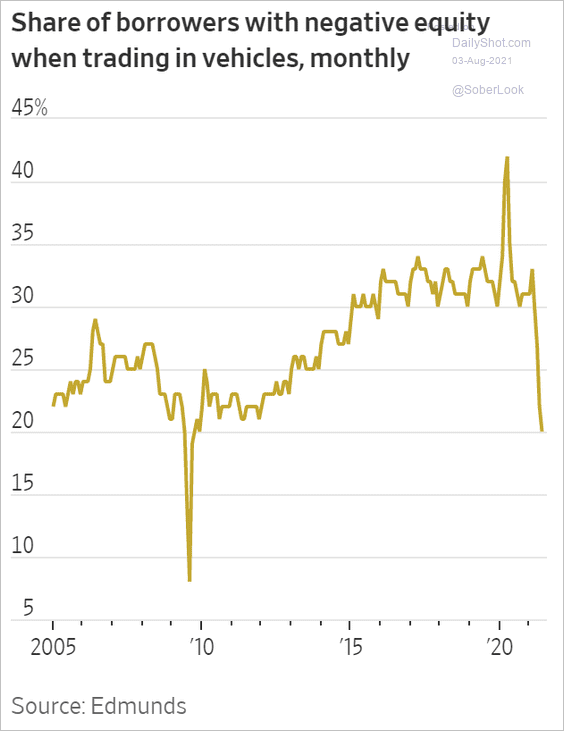
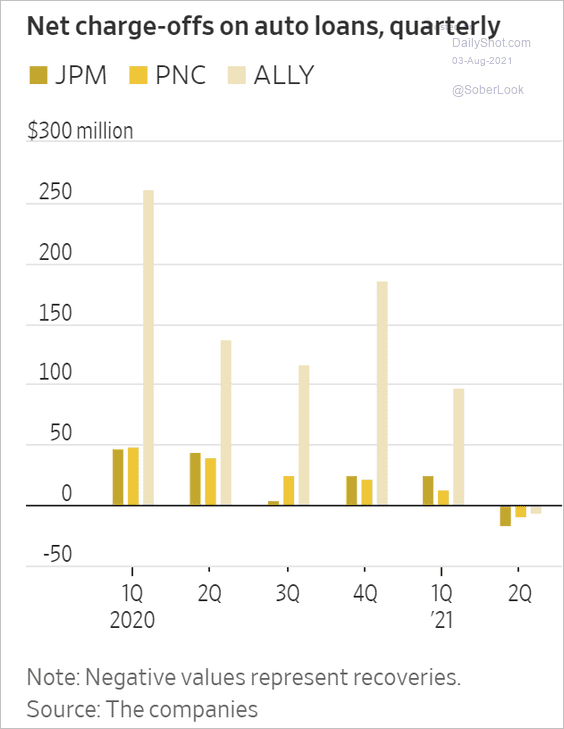
2. The percentage of US auto loan borrowers with negative equity has declined sharply as used vehicle prices surge.
 Source: @WSJ Read full article
 Source: @WSJ Read full article
Back to Index
Rates
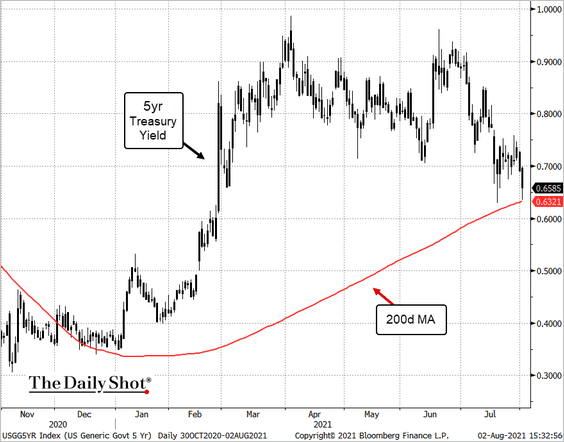
1. Treasury yields continue to fall.
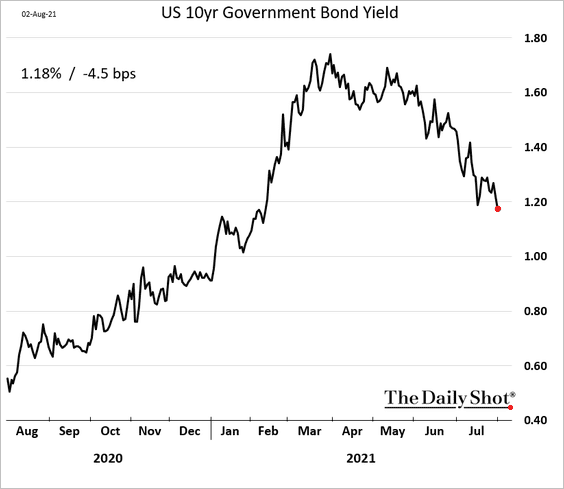
• The 5yr yield is testing support at the 200-day moving average.
 Source: @TheTerminal, Bloomberg Finance L.P.
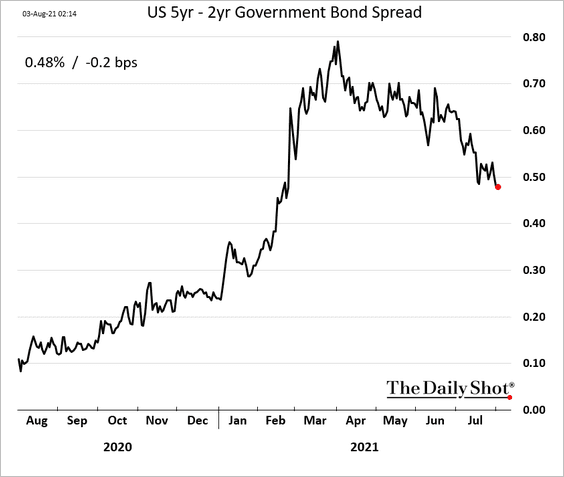
• The curve is flattening, including at the shorter end.
——————–
2. Real yields continue to hit new lows, …
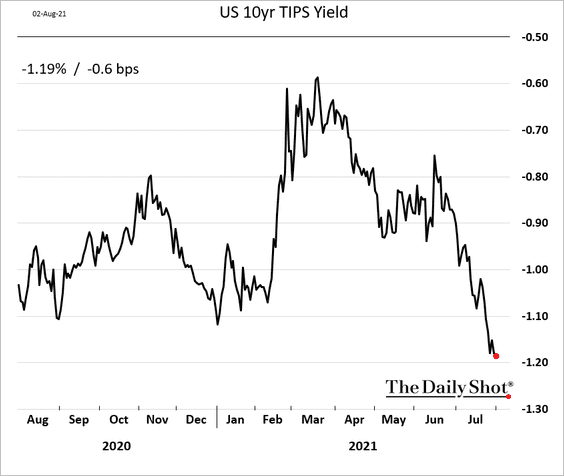
… as demand for inflation-linked Treasuries surges.
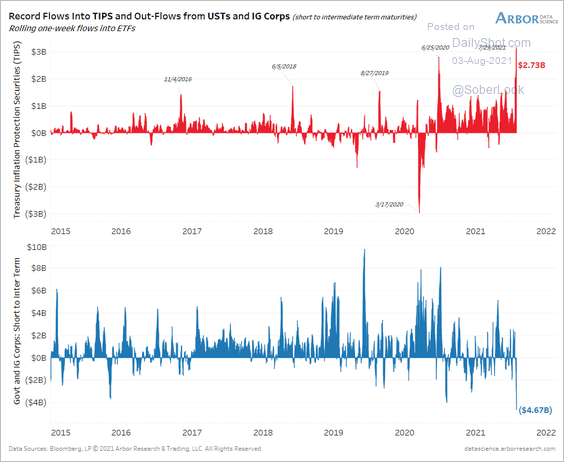 Source: Arbor Research & Trading
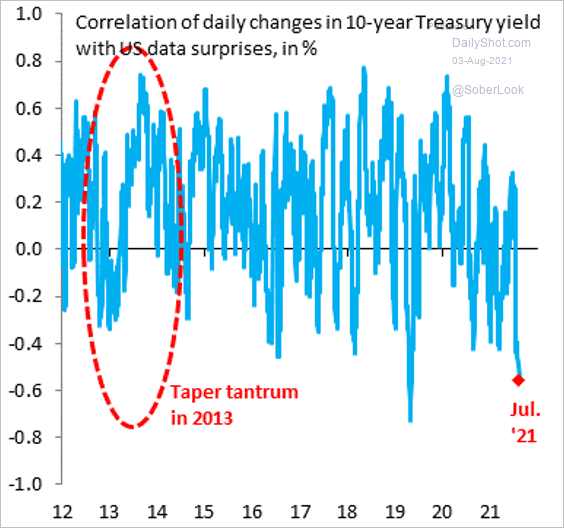
3. Here is the correlation between the 10yr Treasury yield and US economic data surprises.
 Source: @RobinBrooksIIF
Back to Index
Global Developments
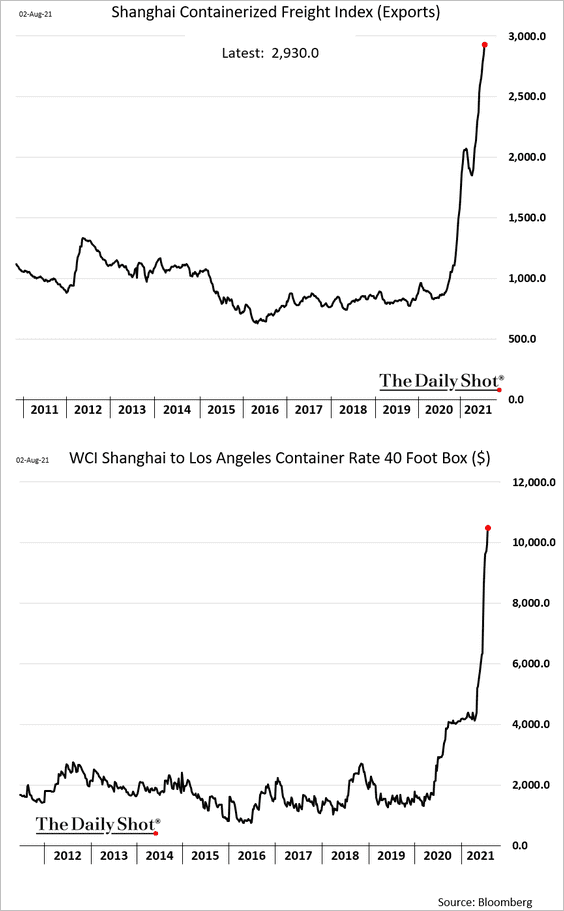
1. The surge in container shipping costs shows no signs of abating.
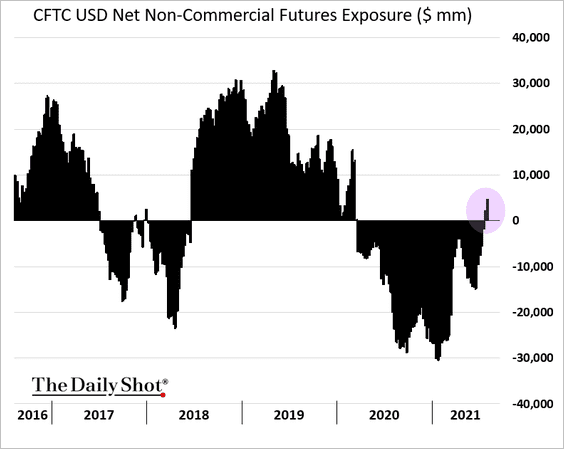
2. Speculative accounts are increasing their bets on the US dollar.
3. The Fed and the ECB are sticking with the “transitory inflation” narrative.
![]() Source: Arbor Research & Trading
Source: Arbor Research & Trading
——————–
Food for Thought
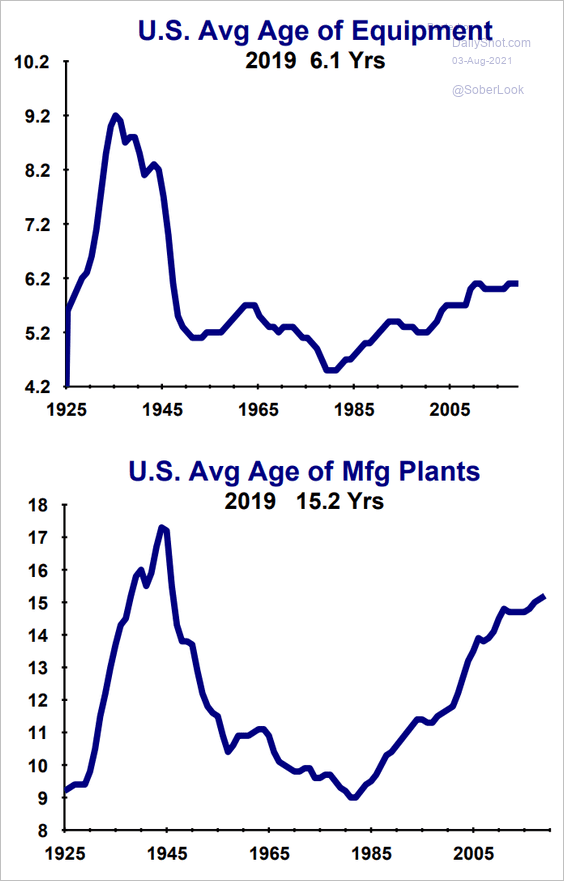
1. US average age of business equipment and manufacturing plants:
 Source: Evercore ISI
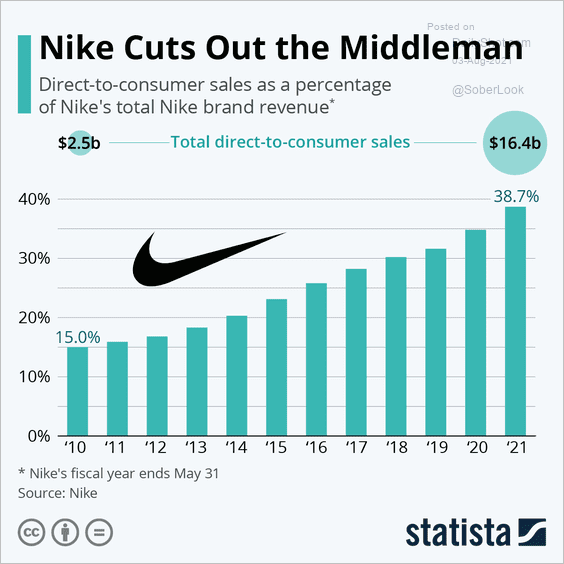
2. Nike direct sales:
 Source: Statista
3. Familiarity with ad-supported streaming:
 Source: Morning Consult Read full article
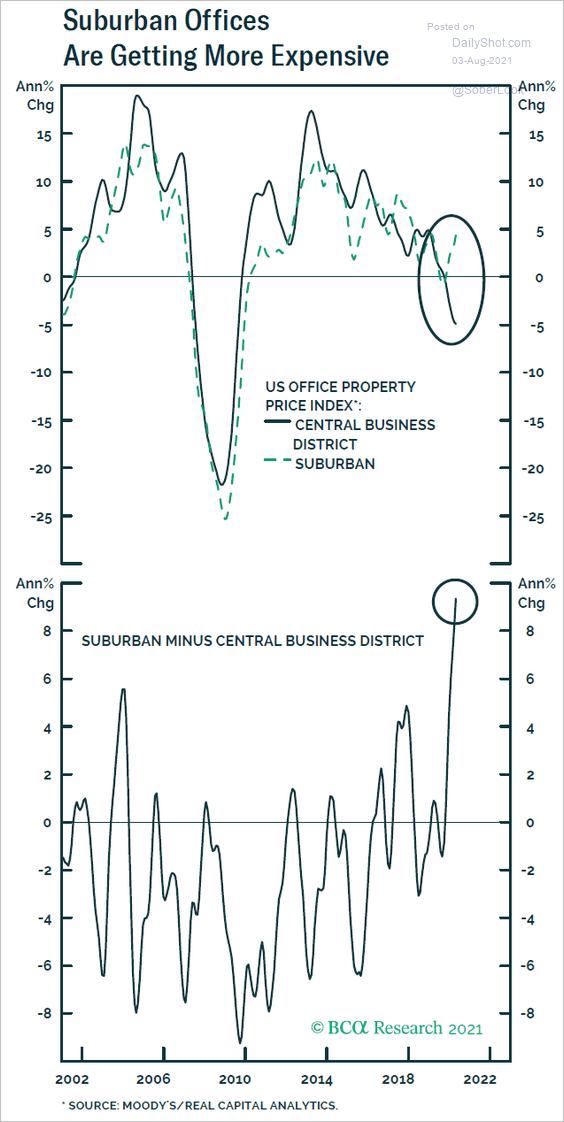
4. US suburban office property prices:
 Source: BCA Research
5. Global government debt:
 Source: @globaldataplc
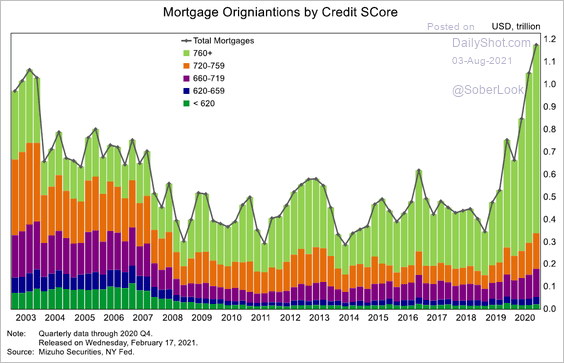
6. US mortgage originations by credit score:
 Source: Mizuho Securities USA
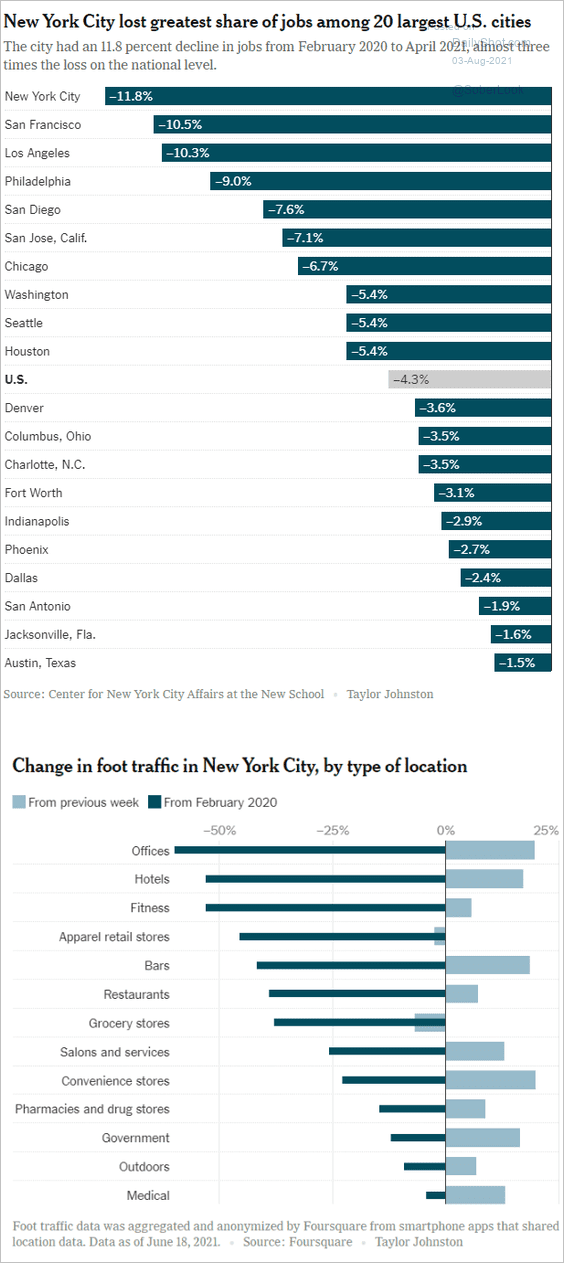
7. Job losses in the largest US cities:
 Source: The New York Times Read full article
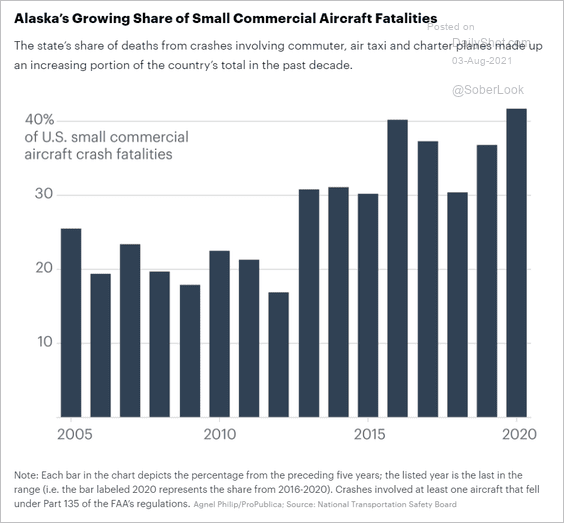
8. Small aircraft fatalities in Alaska:
 Source: ProPublica Read full article
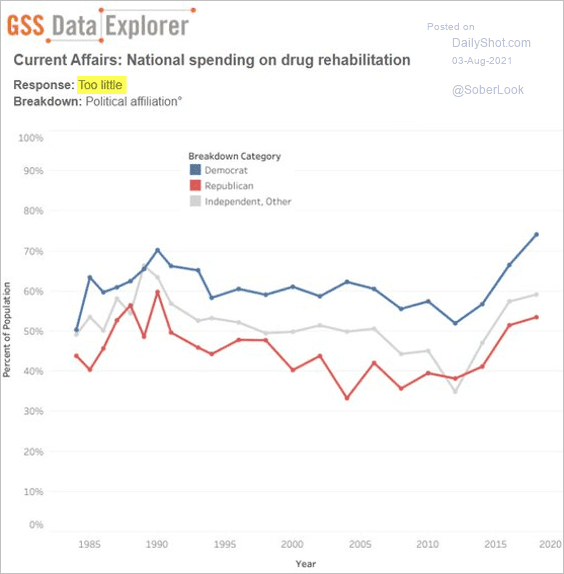
9. Spending too little on drug rehab:
 Source: @PotResearch, @NORCNews Read full article
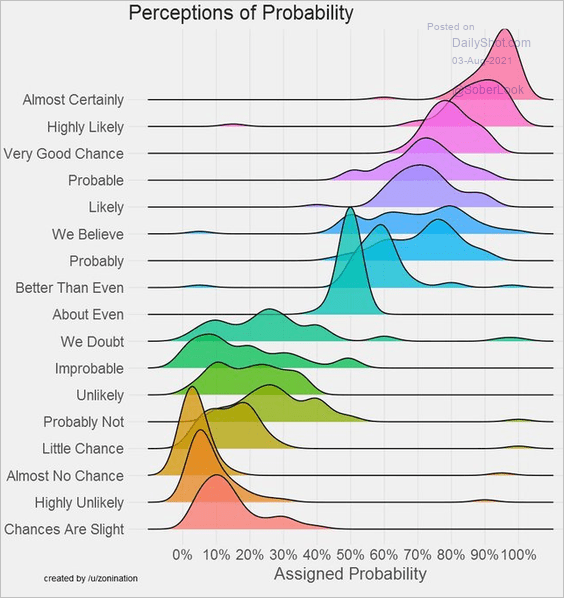
10. Perceptions of probability:
 Source: @SteveStuWill Read full article
——————–
Back to Index