
The Daily Shot: 11-Aug-21
• Administrative Update
• The United States
• The United Kingdom
• The Eurozone
• Europe
• Asia – Pacific
• China
• Emerging Markets
• Cryptocurrency
• Commodities
• Energy
• Equities
• Credit
• Food for Thought
Administrative Update
Please note that most Apple devices such as iPhones and iPads disable the table of contents links in The Daily Shot. To avoid having to scroll, click the “View in your browser” link at the beginning of the newsletter, which makes the navigational links operational.

At the end of each section, there is a “back to index” link, which gets you to your next section in two clicks.
Other technical information about The Daily Shot is available here.
Back to Index
The United States
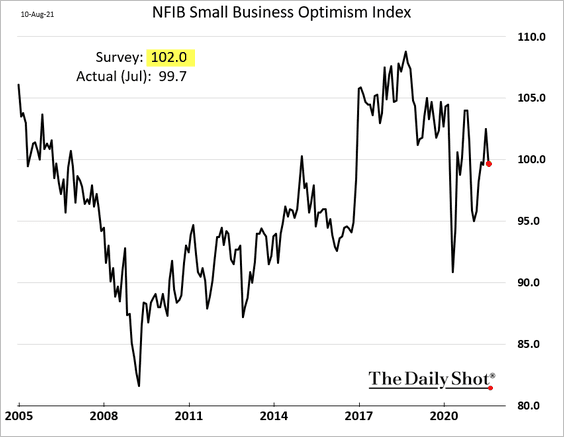
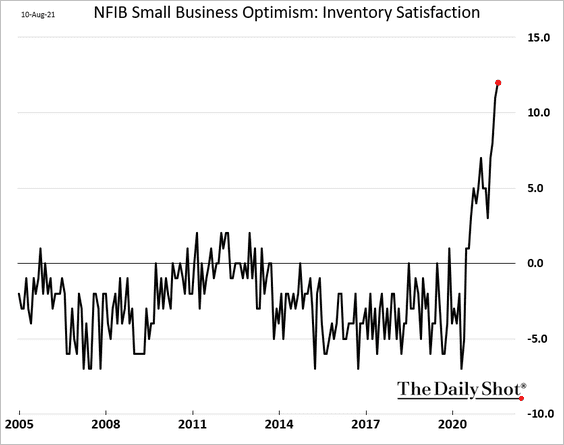
1. The NFIB small business sentiment index was weaker than expected last month.
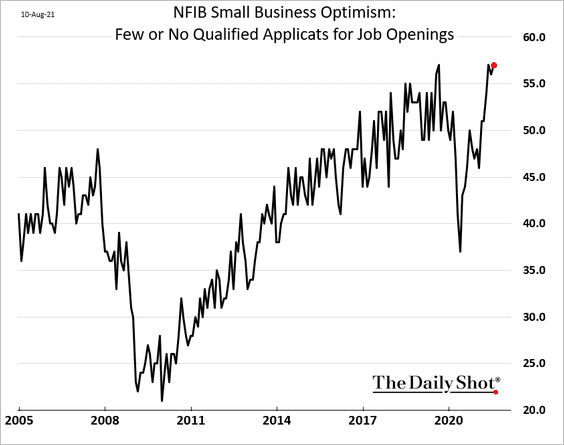
As we saw last week, small firms continue to struggle with labor shortages (see chart). Companies increasingly report challenges attracting qualified workers.
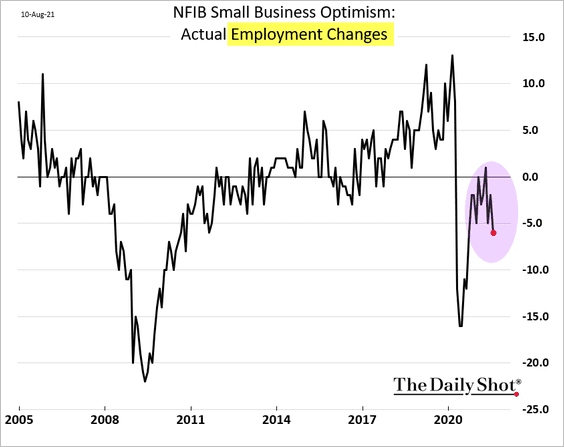
The rebound in small business hiring has stalled.
Companies are boosting wages to keep/attract workers (see chart).
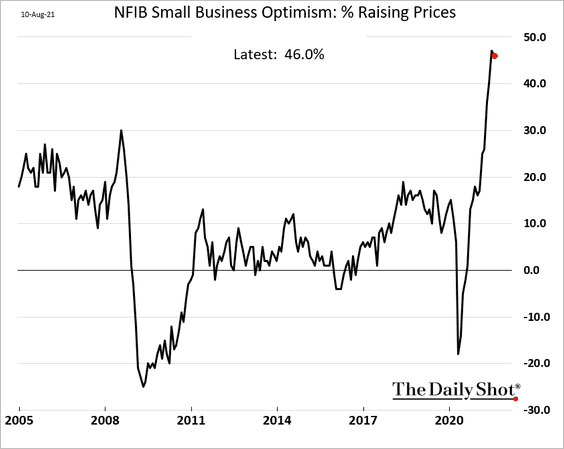
• The percentage of firms raising prices appears to have peaked but remains near the highs.
• A record percentage of companies view current inventory levels as “too low” amid persistent supply-chain challenges.
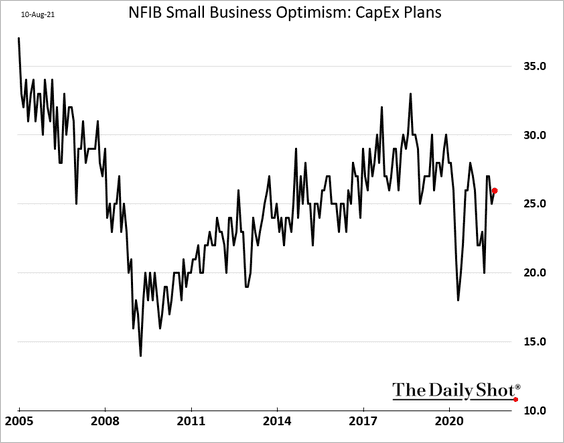
• CapEx expectations have been trending lower.
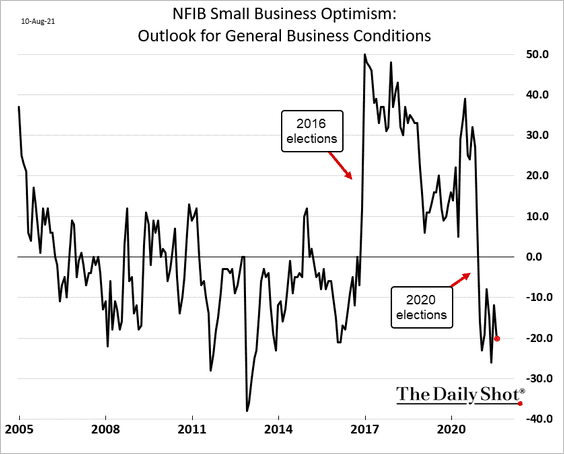
• Small business outlook remains tethered to politics.
——————–
2. US productivity gains were lower than expected in Q2.
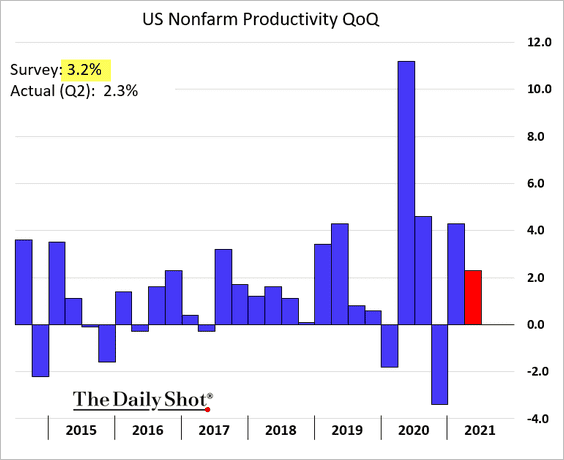
Output growth was driven more by hours worked than productivity increases.
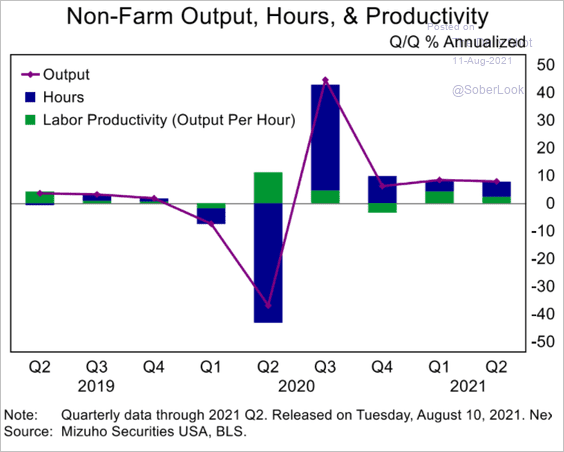 Source: Mizuho Securities USA
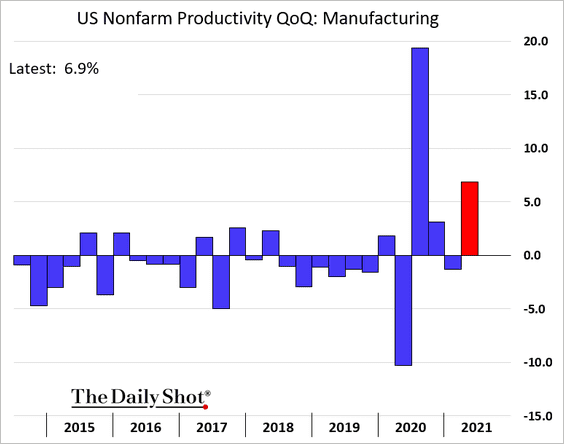
But manufacturing saw substantial improvements.
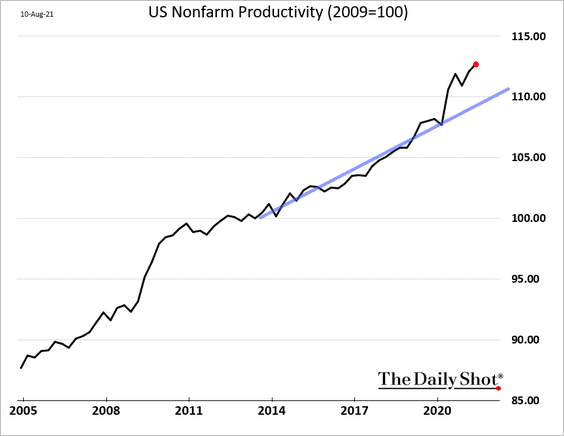
• The overall productivity growth remains above the pre-COVID trend.
• This chart shows productivity gains over 20-quarter periods.
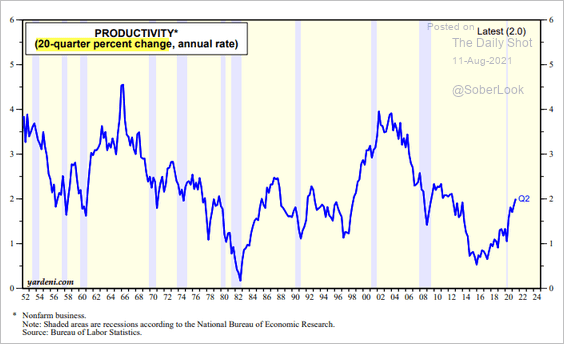 Source: Yardeni Research
——————–
3. Next, we have some updates on inflation.
• Nomura expects to see lower core CPI gains in July.
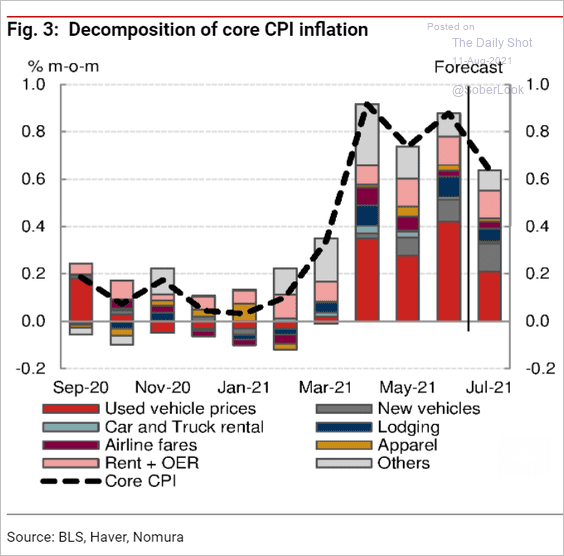 Source: Nomura Securities
• Consensus forecasts for inflation continue to revise upward.
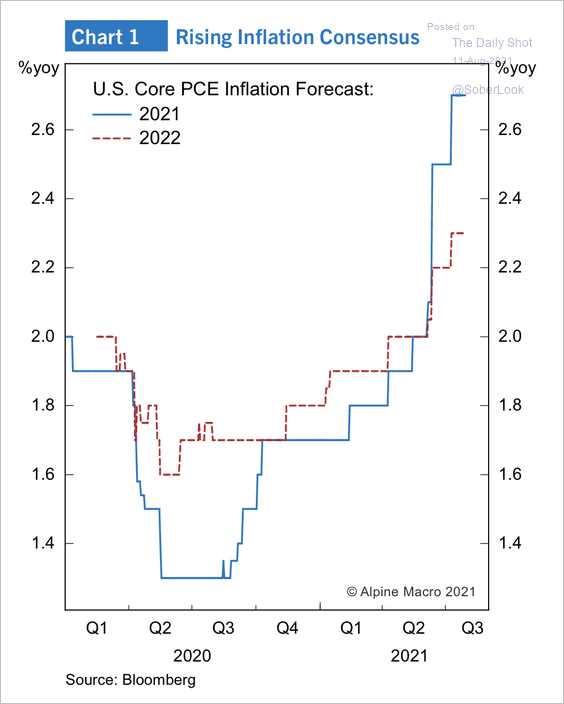 Source: Alpine Macro
• The slowing oil price rate of change points to a decline in core PCE inflation.
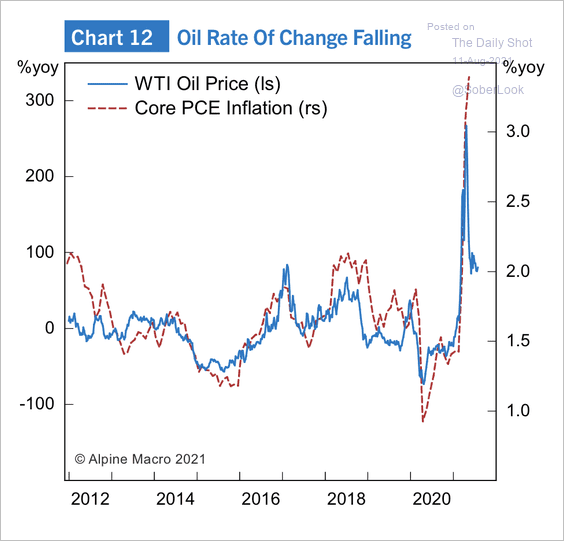 Source: Alpine Macro
• PCE inflation has averaged 2% over a look-back period of five years.
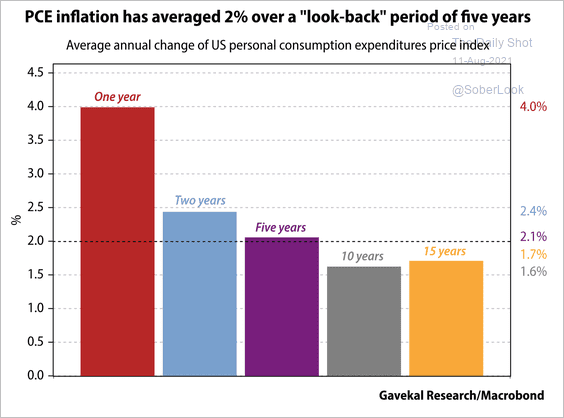 Source: Gavekal Research
• Unlike previous years, the most recent inflation spike is against the backdrop of a long period of low inflation.
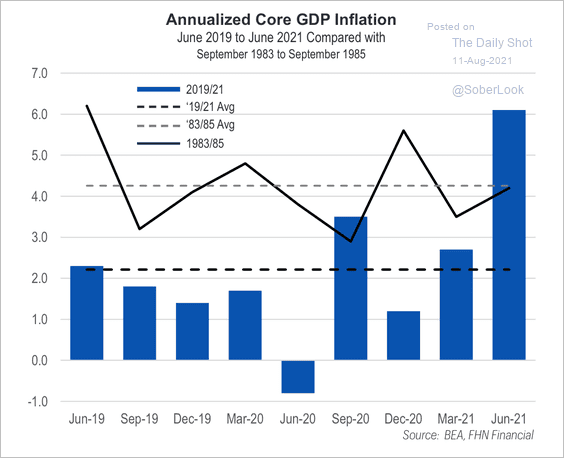 Source: FHN Financial
• Airfare CPI is recovering.
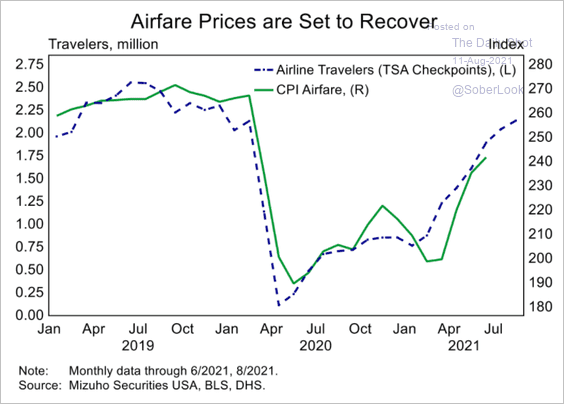 Source: Mizuho Securities USA
• This chart shows rent inflation vs. home price appreciation.
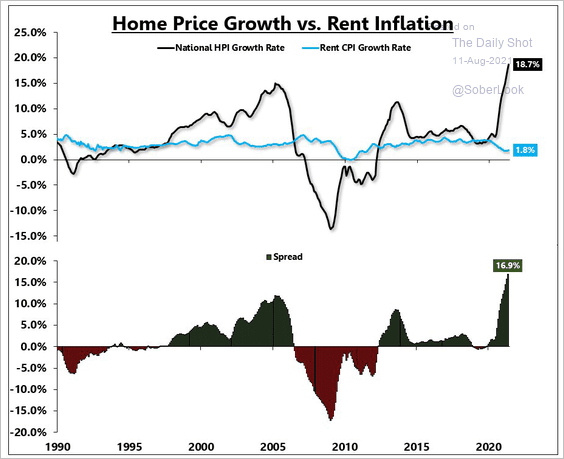 Source: @EPBResearch
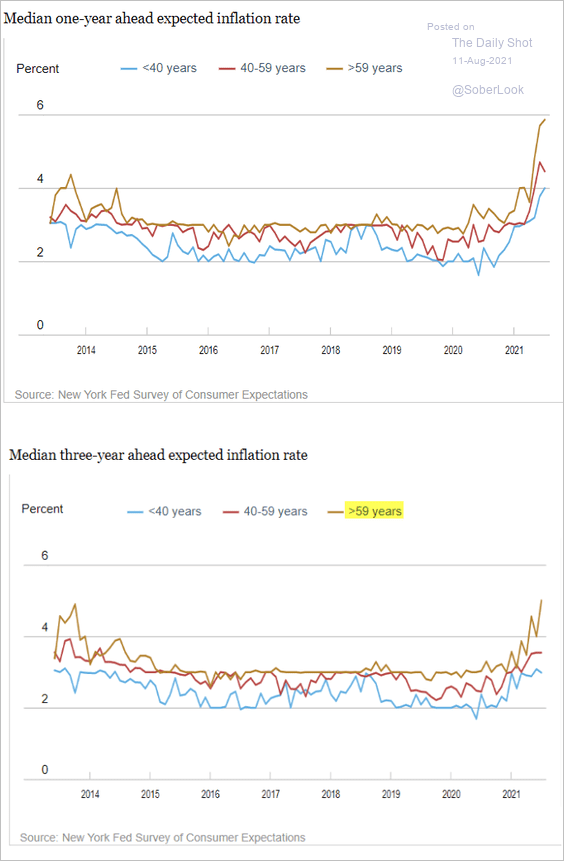
• The NY Fed’s national consumer survey points to rising inflation expectations. The ongoing increases in the three-year expected inflation rate suggest that consumers are not convinced of the “transient inflation” narrative.
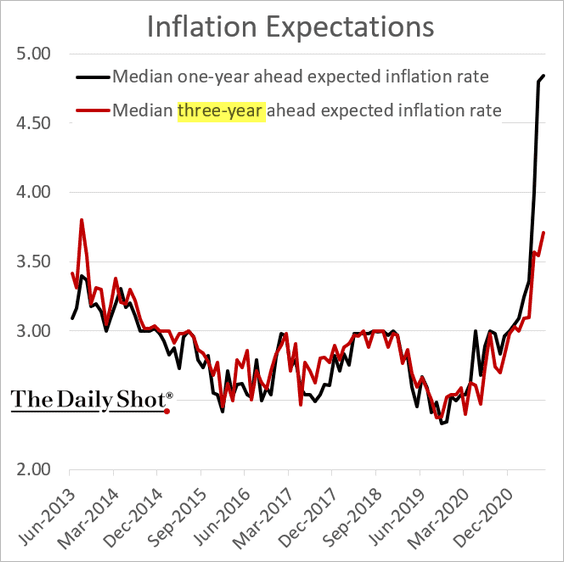 Source: NY Fed
Older Americans are particularly concerned about inflation.
 Source: Federal Reserve Bank of New York
——————–
3. The Treasury could run short of the liquidity needed to meet all obligations in the first half of October.
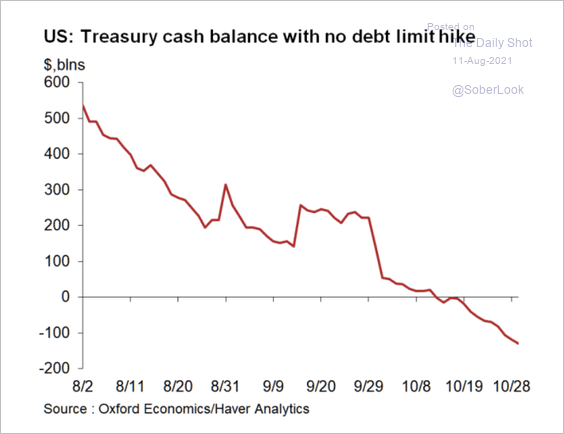 Source: Oxford Economics
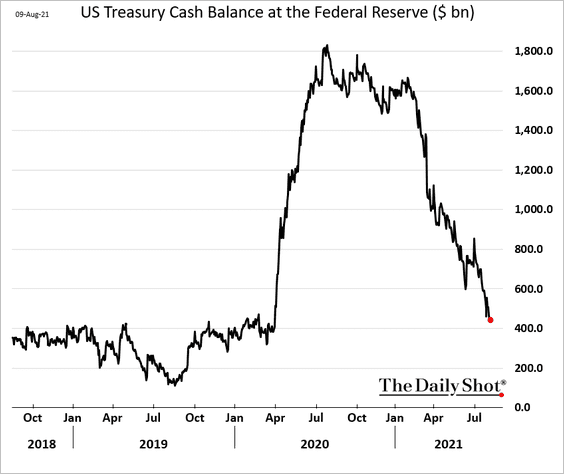
Cash balances at the Fed continue to shrink.
Here is a look at the estimated Treasury borrowing needs for the July-September quarter, according to Oxford Economics.
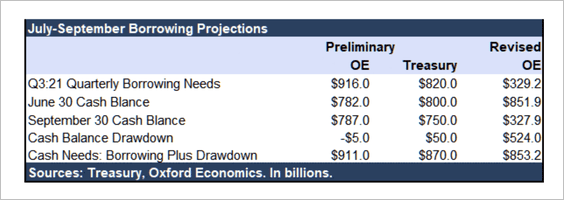 Source: Oxford Economics
——————–
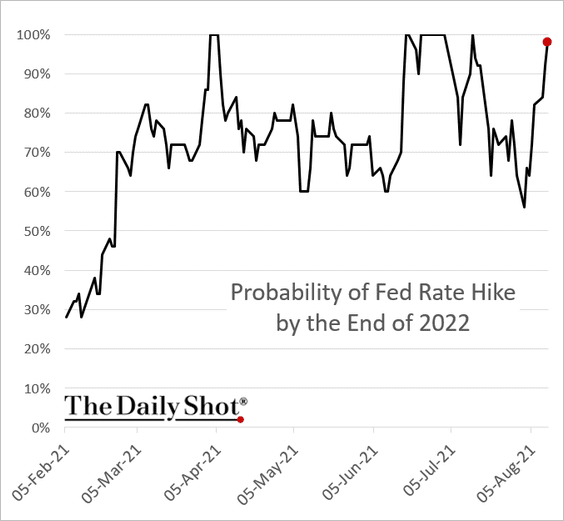
4. Treasury yields continue to climb.
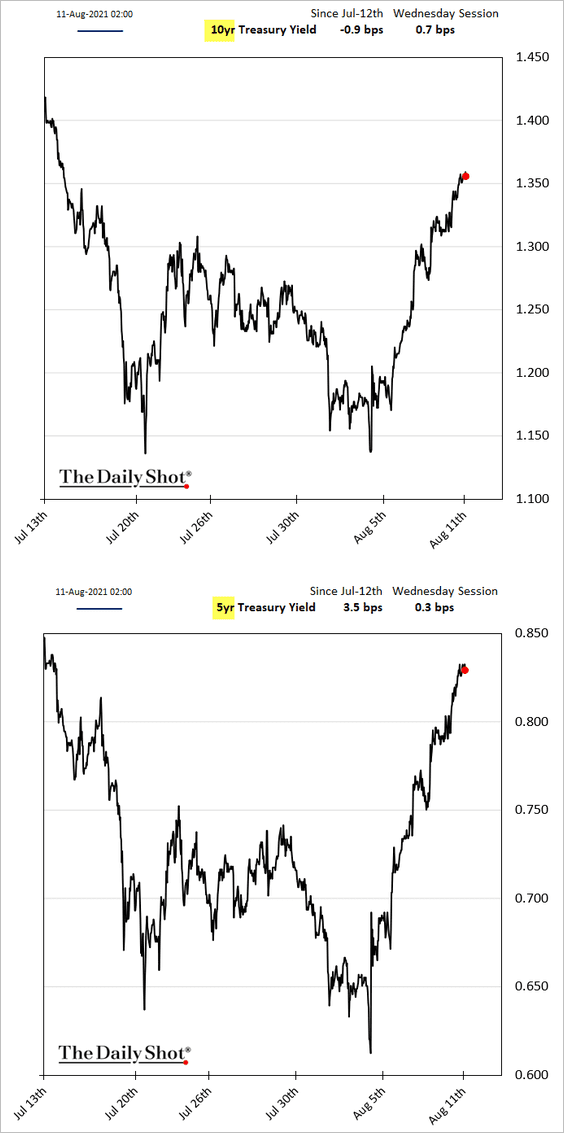
A Fed rate hike next year is once again fully priced into the market.
——————–
5. Card spending is moderating as the COVID situation worsens.
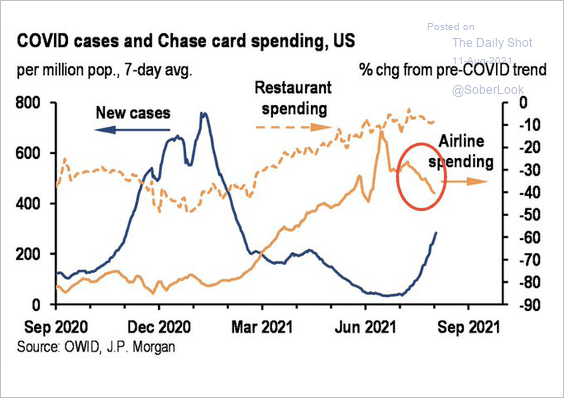 Source: JP Morgan, @carlquintanilla
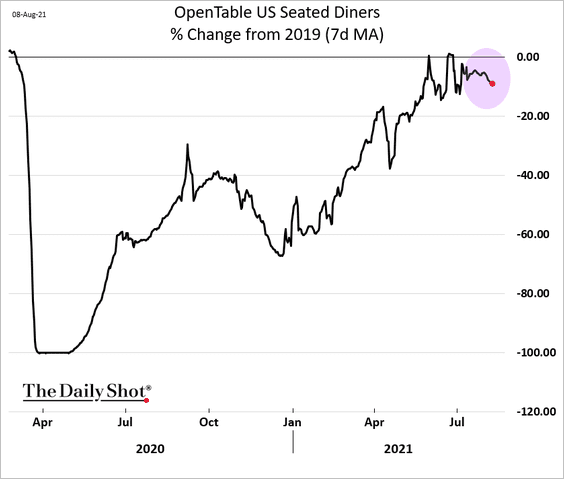
The OpenTable index seems to have peaked as well.
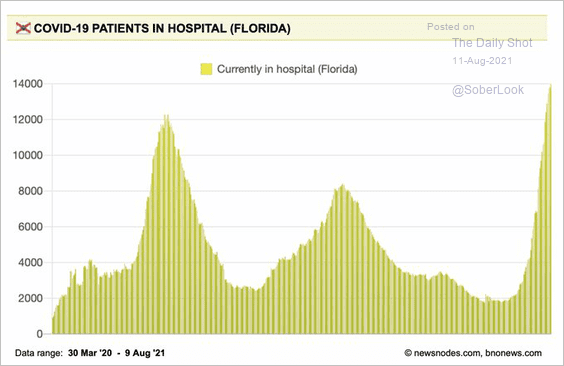
Hospitalizations have been rising.
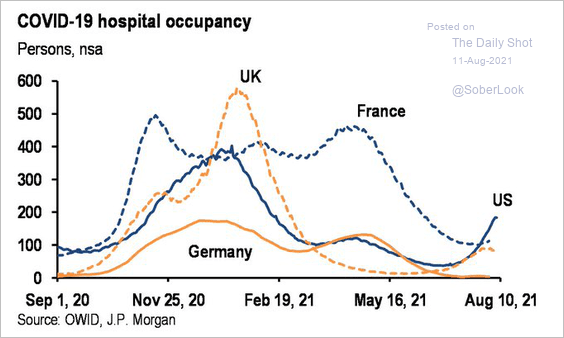 Source: JP Morgan, @carlquintanilla
 Source: @EricTopol
Back to Index
The United Kingdom
1. Wages are growing rapidly, …
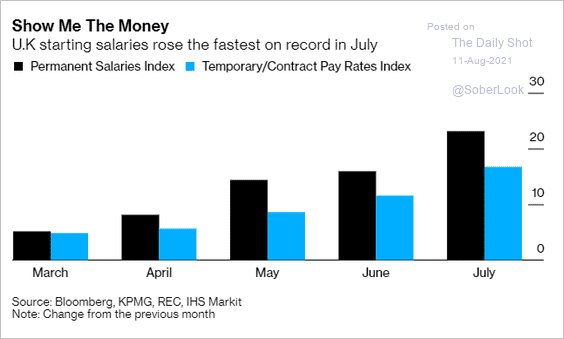 Source: @Quicktake Read full article
… amid labor shortages.
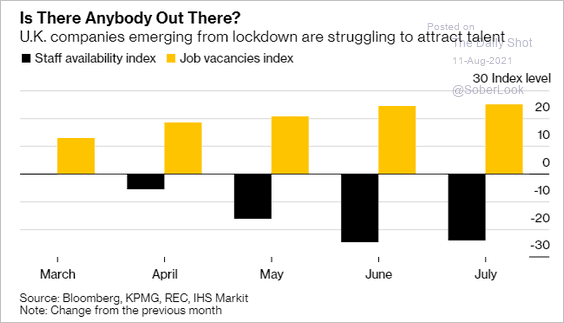 Source: @Quicktake Read full article
——————–
2. Furloughs have been declining slower than expected.
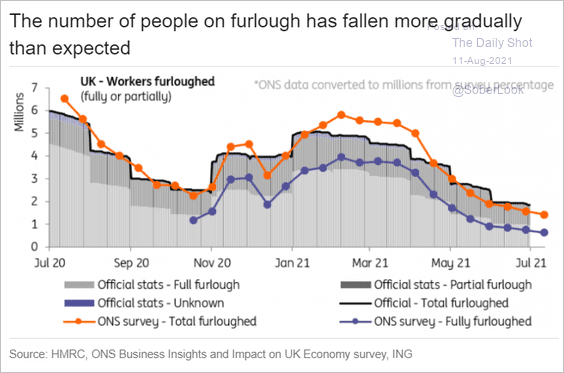 Source: ING
There are now more older furloughed workers than younger ones.
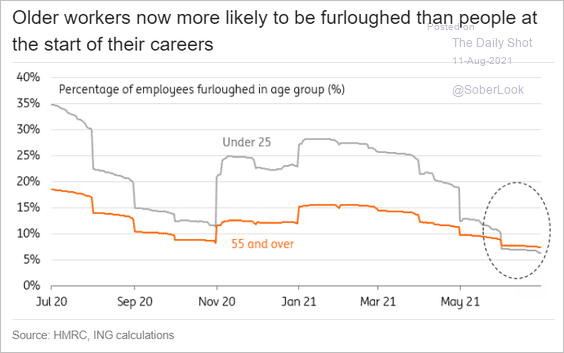 Source: ING
Furloughs are increasingly dominated by small firms.
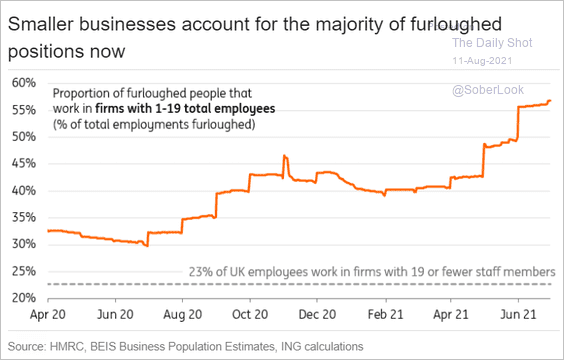 Source: ING
——————–
3. The pound has outperformed other G10 currencies vs. the dollar.
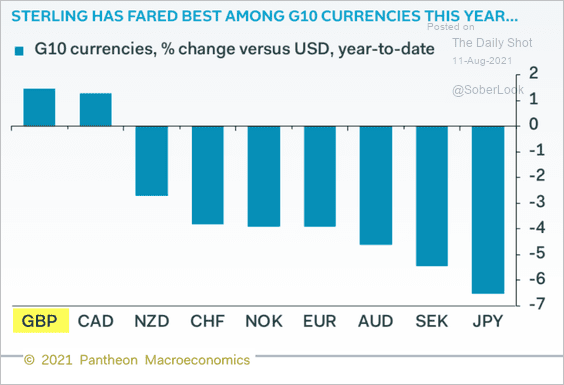 Source: Pantheon Macroeconomics
Back to Index
The Eurozone
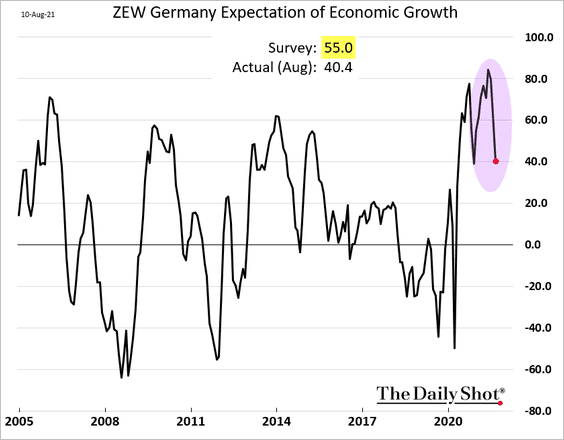
1. Germany’s ZEW index of growth expectations declined sharply (similar to Sentix – see chart).
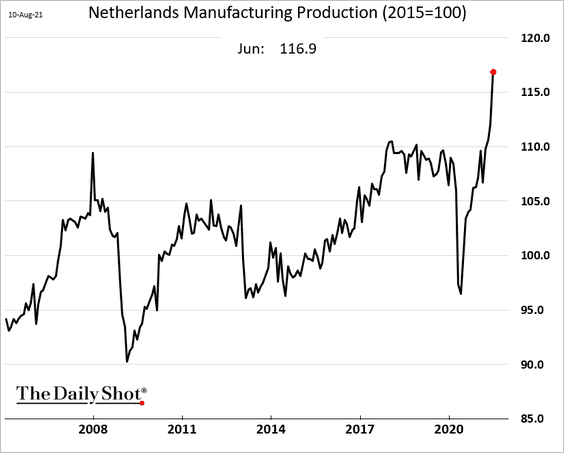
2. Dutch manufacturing output is surging (in contrast to Germany – see chart).
3. Will a rebound in Bund yields cause European banks to outperform?
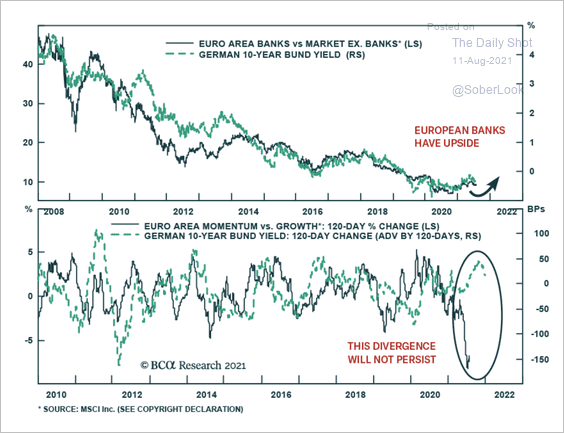 Source: BCA Research
4. Here are some possible post-election coalitions in Germany, based on the latest polls.
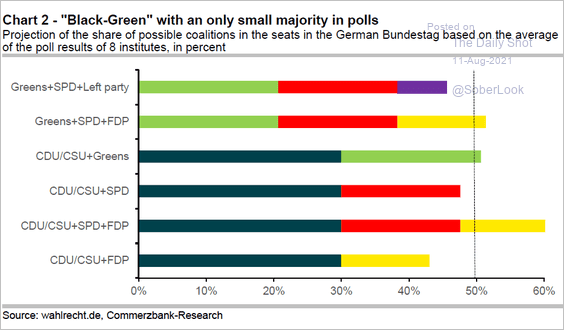 Source: Commerzbank Research
Back to Index
Europe
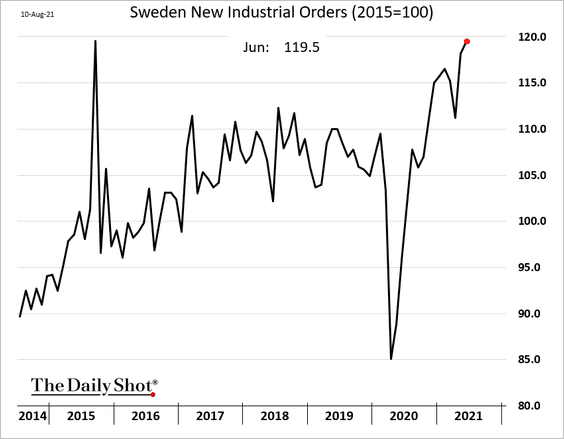
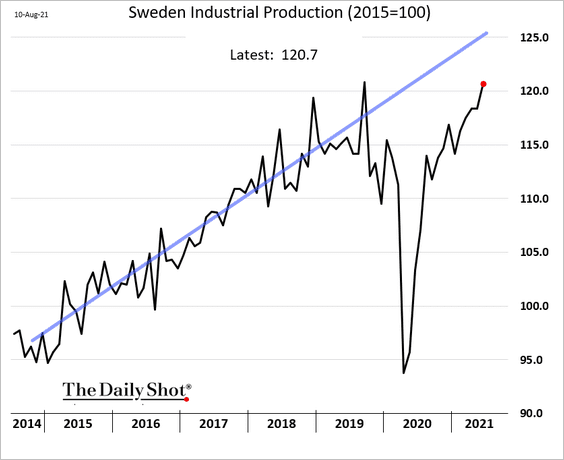
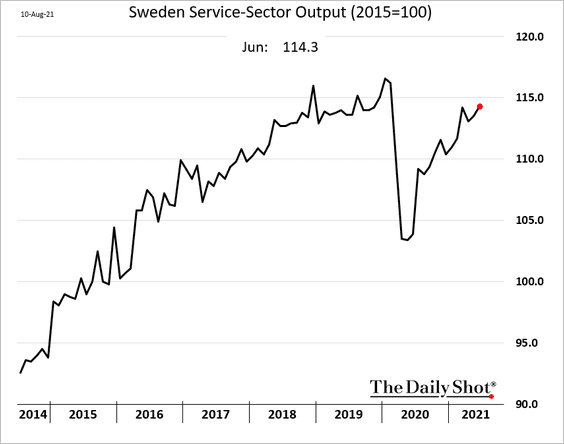
1. Let’s begin with Sweden, where economic growth remains robust.
• Industrial orders:
• Industrial production:
• Service-sector output:
• Household consumption (still below pre-COVID levels):

——————–
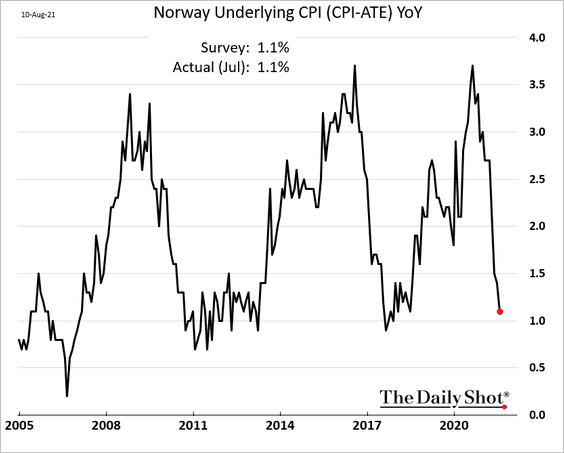
2. Markets are starting to doubt the Norges Bank’s rate path.
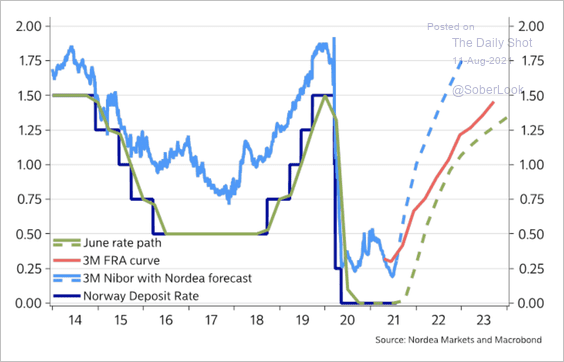 Source: Nordea Markets
Norway’s inflation is dropping quickly.
——————–
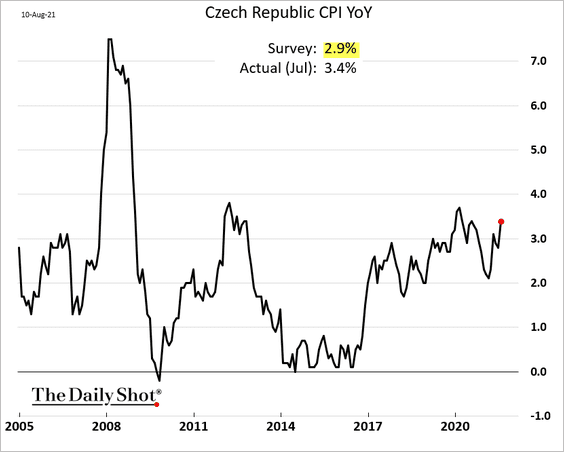
3. Czech inflation surprised to the upside.
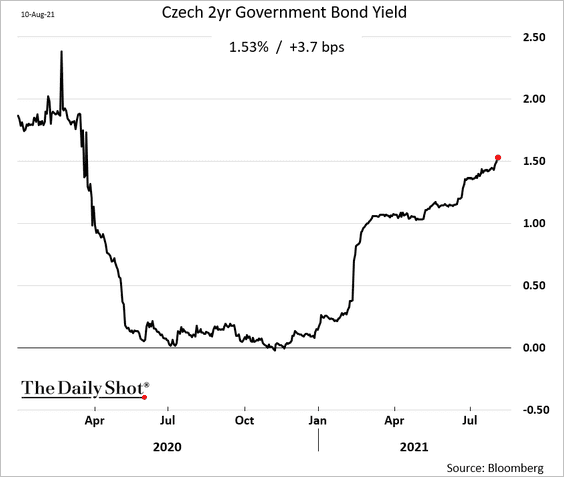
Bond yields are pricing in more rate hikes.
4. Wildfires have been more frequent this year.
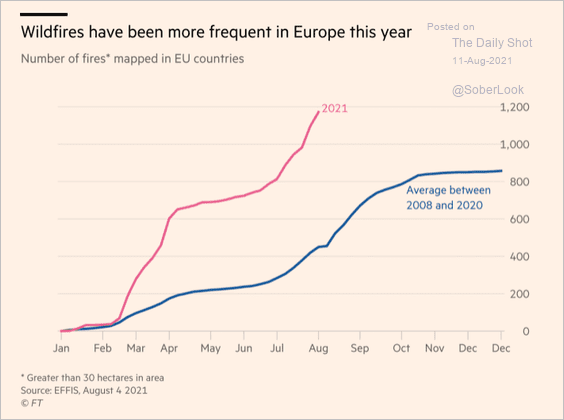 Source: @financialtimes Read full article
Back to Index
Asia – Pacific
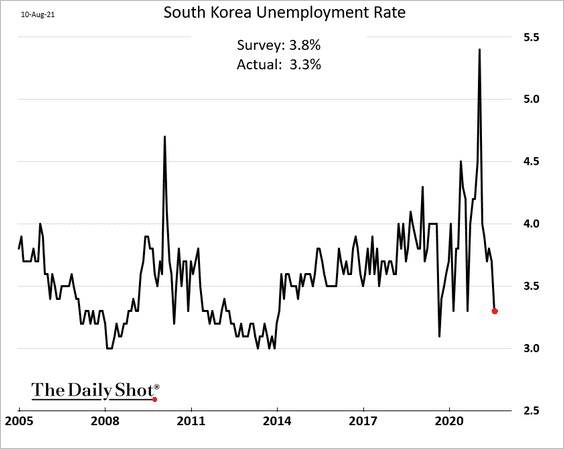
1. South Korean unemployment rate continues to drop.
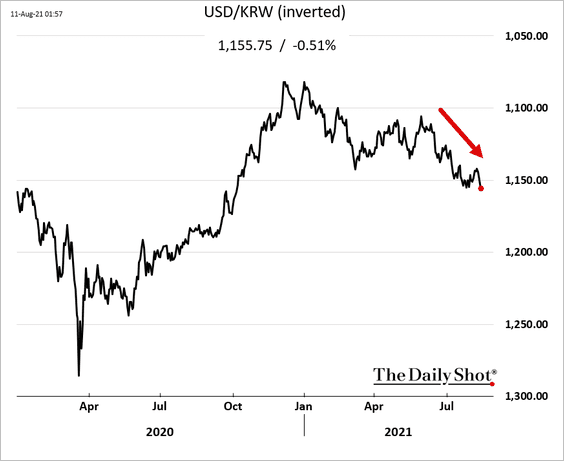
The won is trending lower amid elevated COVID cases.
——————–
2. Here is an overview of the COVID situation in Asia.
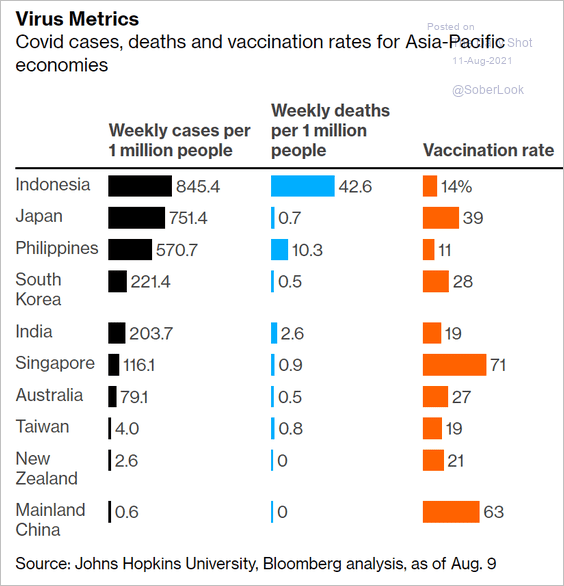 Source: @markets Read full article
Back to Index
China
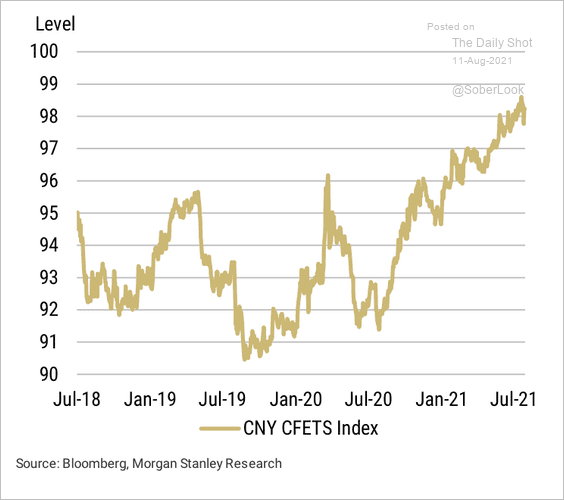
1. USD/CNY has been relatively stable despite volatility in equities and credit.
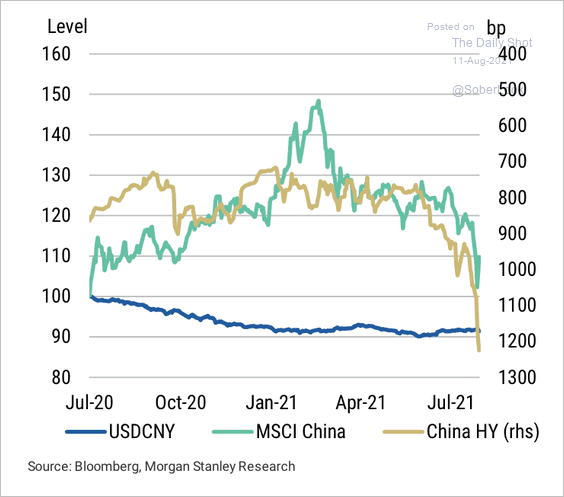 Source: Morgan Stanley Research
The trade-weighted renminbi remains strong.
 Source: Morgan Stanley Research
——————–
2. China’s composite PMI has diverged from developed markets this year.
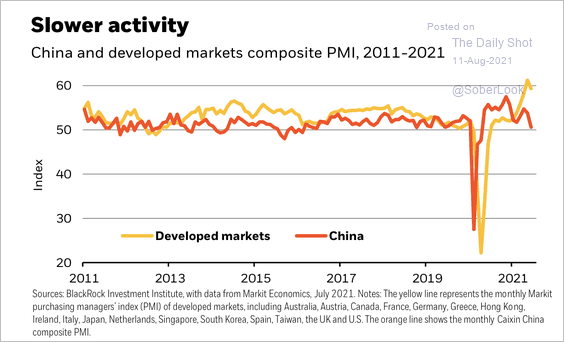 Source: BlackRock
3. Beijing has been highly supportive of the domestic semiconductor industry.
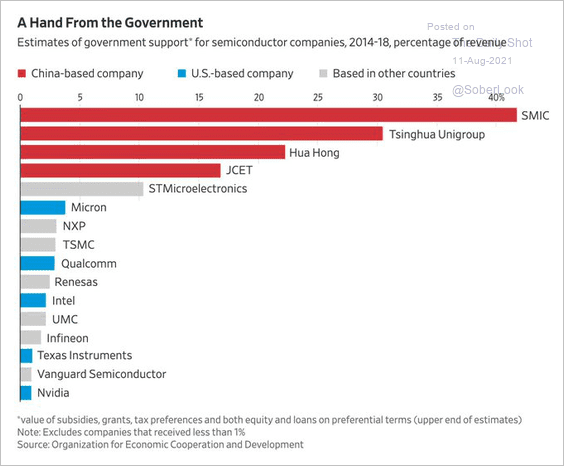 Source: @adam_tooze, @WSJ Read full article
Back to Index
Emerging Markets
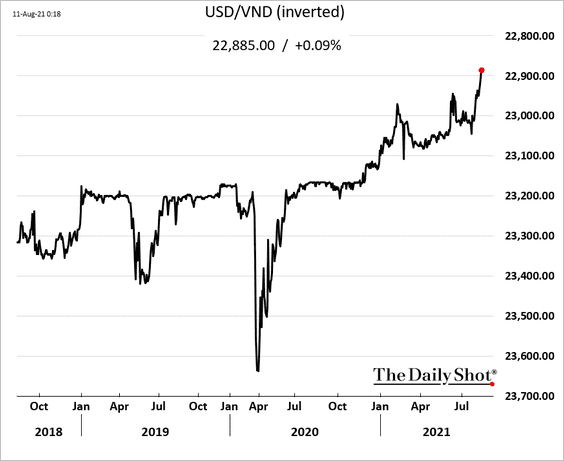
1. Vietnam’s vehicle sales are tumbling.
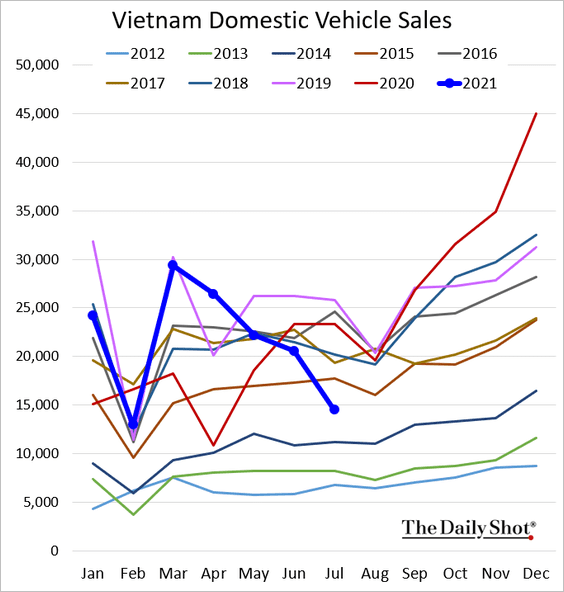
The Vietnamese dong has been allowed to appreciate after the agreement with the US to improve “exchange-rate flexibility.”
——————–
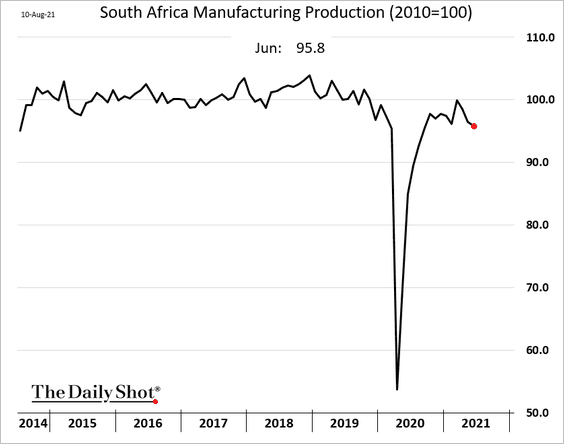
2. South Africa’s factory output has been weakening.
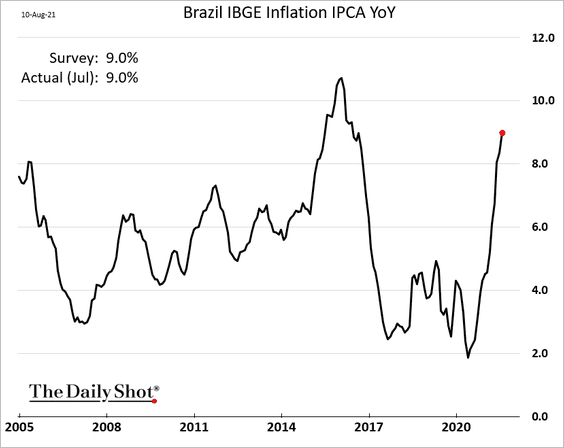
3. Brazil’s inflation continues to accelerate.
4. Which countries are most exposed to China?
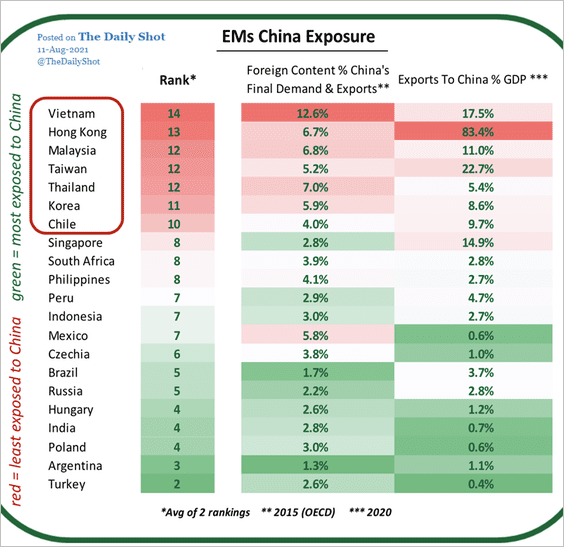 Source: Cornerstone Macro
Back to Index
Cryptocurrency
1. Digital (NFT) rocks are trading in the range of $110k – $160k (see story).
 Source: @etherrockprice
2. This chart shows stablecoin market capitalization.
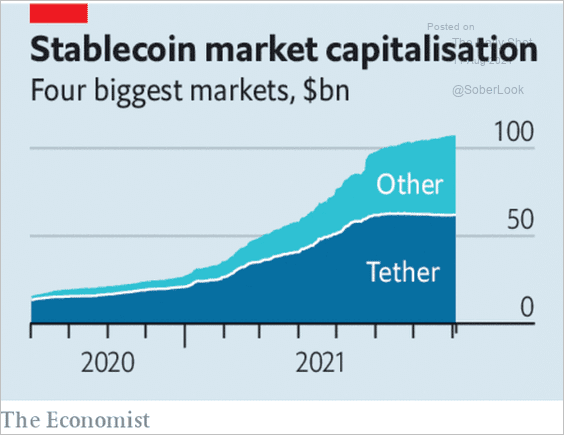 Source: The Economist Read full article
Back to Index
Commodities
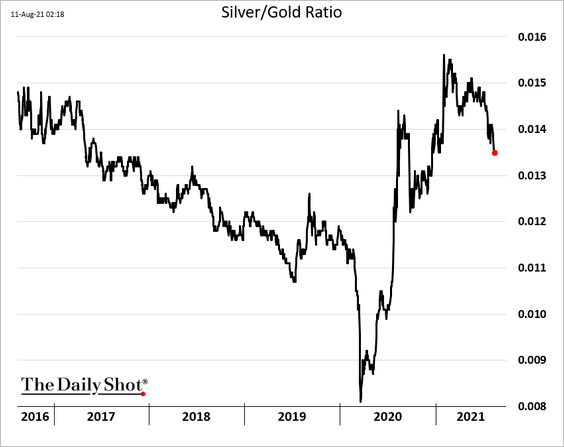
1. The silver-to-gold ratio has rolled over.
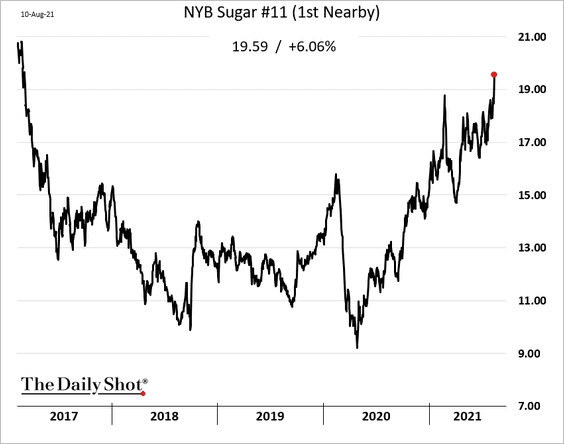
2. Sugar futures are surging.
3. Based on historical patterns, commodities should enter a trading range.
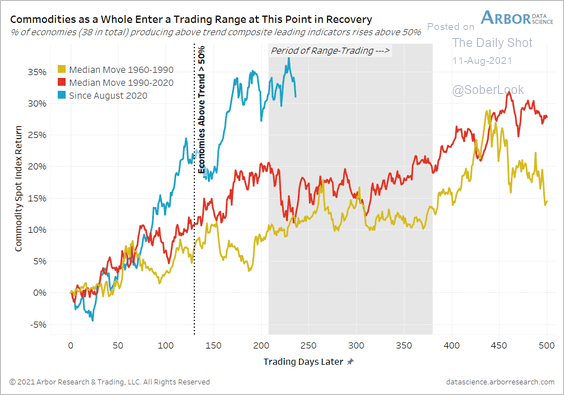 Source: Arbor Research & Trading
Back to Index
Energy
1. Forecasters are less upbeat on US oil production next year.
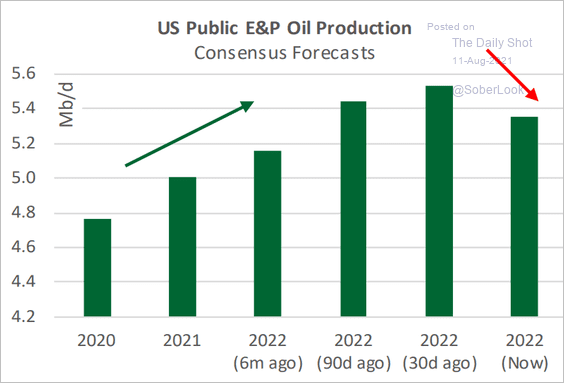 Source: Cornerstone Macro
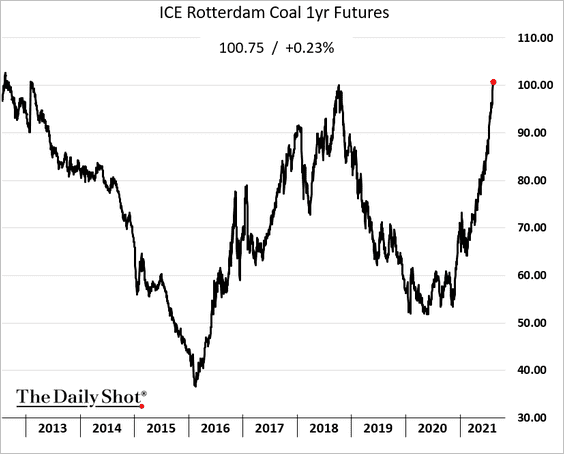
2. European coal prices are at multi-year highs due to high electricity demand (heatwave).
Back to Index
Equities
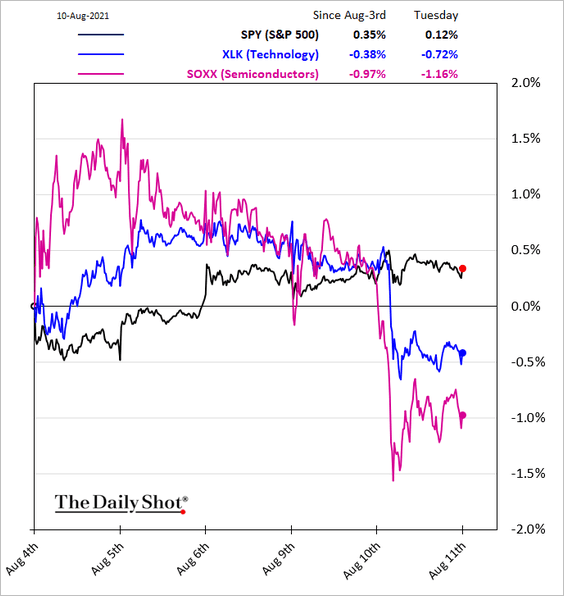
1. Tech stocks were weaker on Tuesday.
 Source: BNN Bloomberg Read full article
——————–
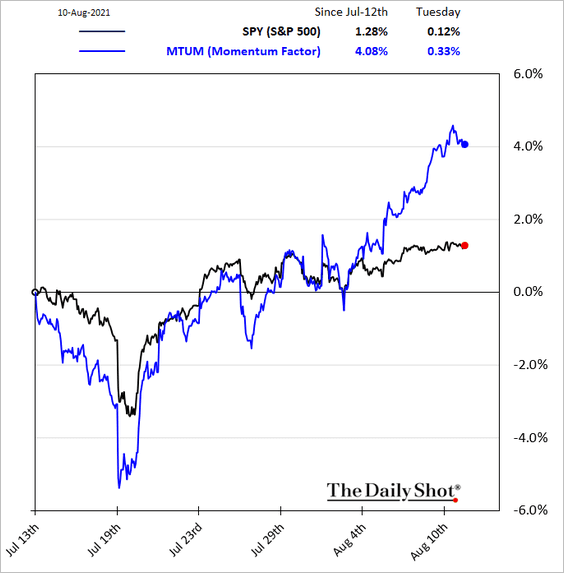
2. The momentum factor has been outperforming in recent days.
3. Valuation measures continue to indicate poor returns over longer periods.
• Market cap to gross value added ratio:
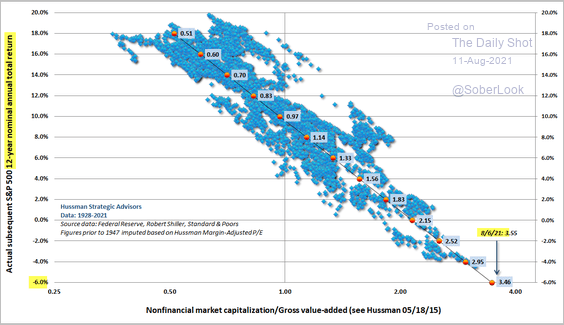 Source: @jessefelder, @hussmanjp Read full article
• Forward PE ratio:
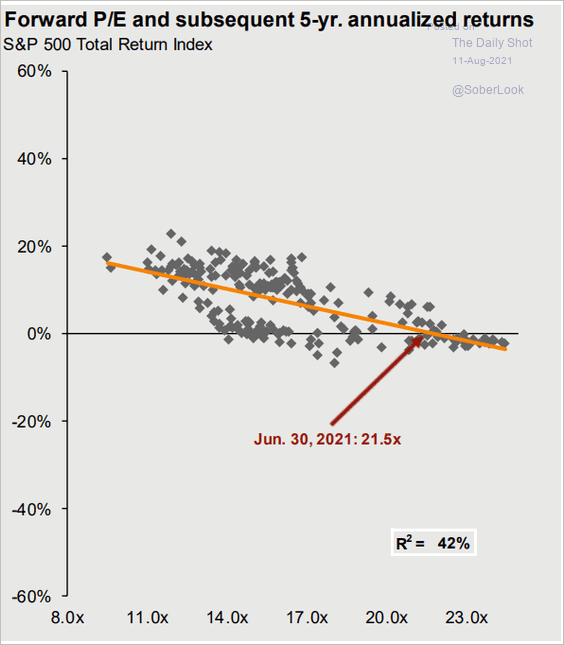 Source: J.P. Morgan Asset Management
——————–
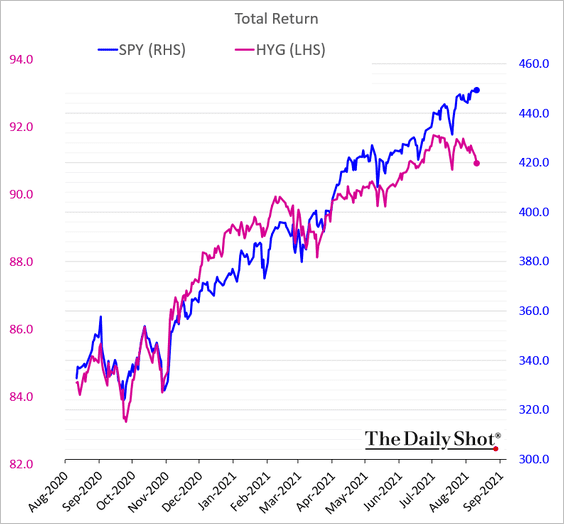
4. High-yield bonds (HYG) have diverged from stocks (SPY).
5. The decline in bank liquidity points to lower stock prices.
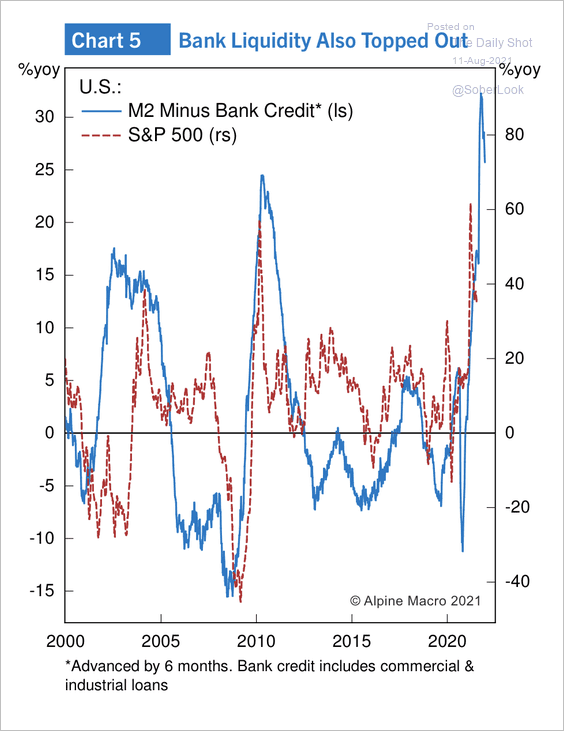 Source: Alpine Macro
6. Active managers have been picking better stocks than retail investors and passive managers, according to Cornerstone Macro.
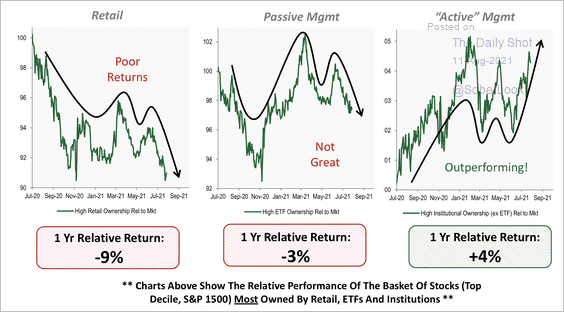 Source: Cornerstone Macro
Institutions (active managers) own a majority of the S&P 500 stocks.
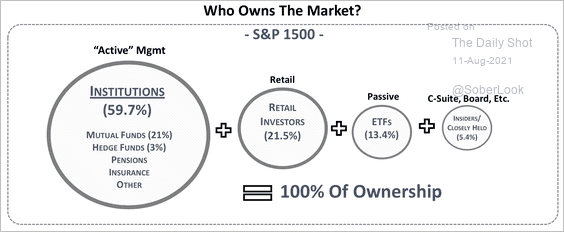 Source: Cornerstone Macro
——————–
7. Here is the S&P 500 risk/return profile by sector and subsector.
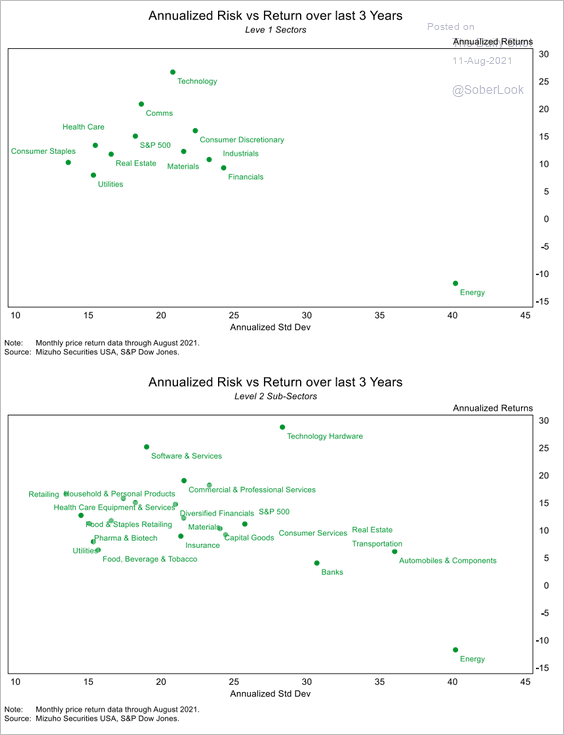 Source: Mizuho Securities USA
8. Equity risk premium continues to sink.
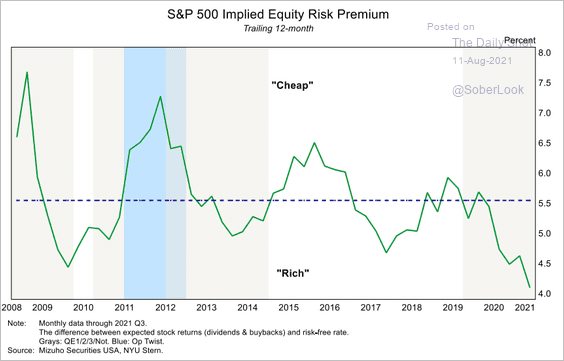 Source: Mizuho Securities USA
9. This chart shows operating cash flow as a percentage of the market cap.
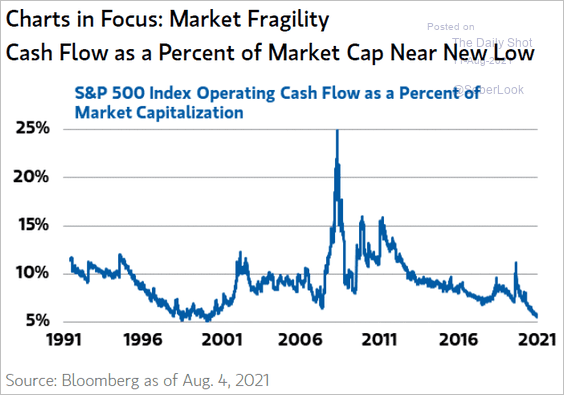 Source: @acemaxx, @MorganStanley
10. Small-caps perform best during the first year of a bull market.
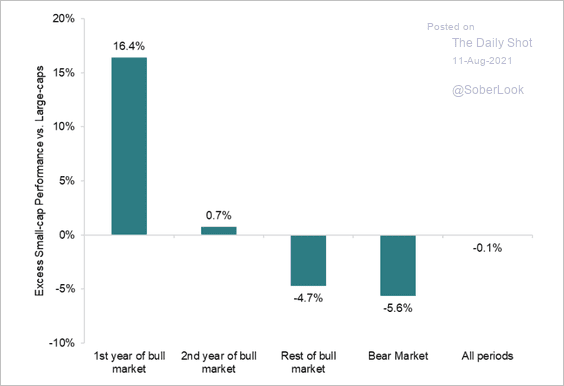 Source: Citi Private Bank
Back to Index
Credit
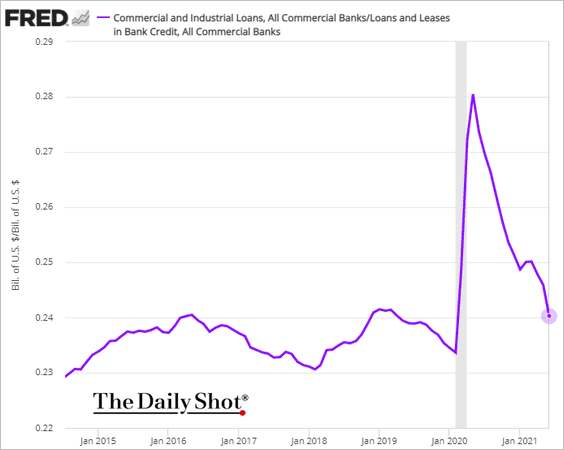
1. US business loan balances have been falling.
• Business loans as a share of total bank loans:
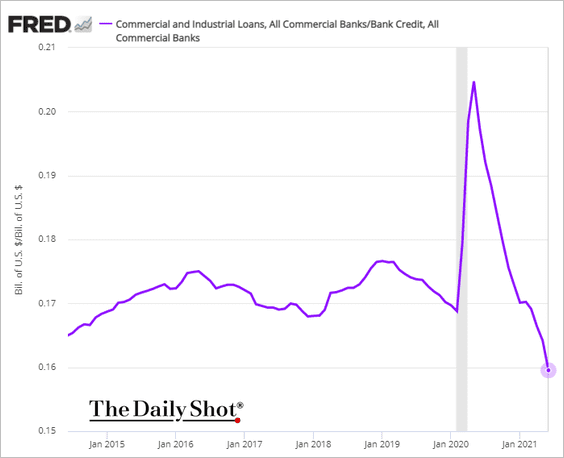
• Business loans as a share of bank credit (includes securities):
——————–
2. Distressed debt has risen in recent weeks.
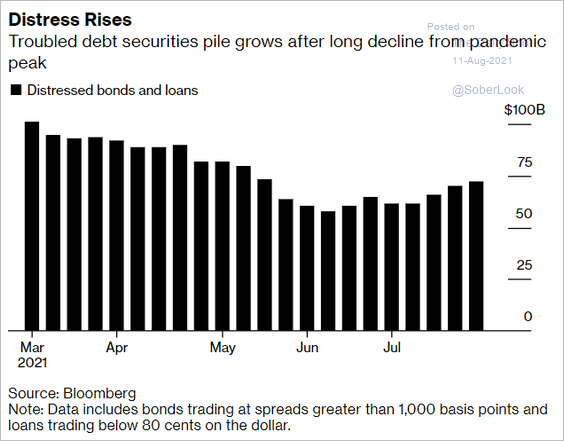 Source: Bloomberg Read full article
Back to Index
Food for Thought
1. Athletics “doping contest”:
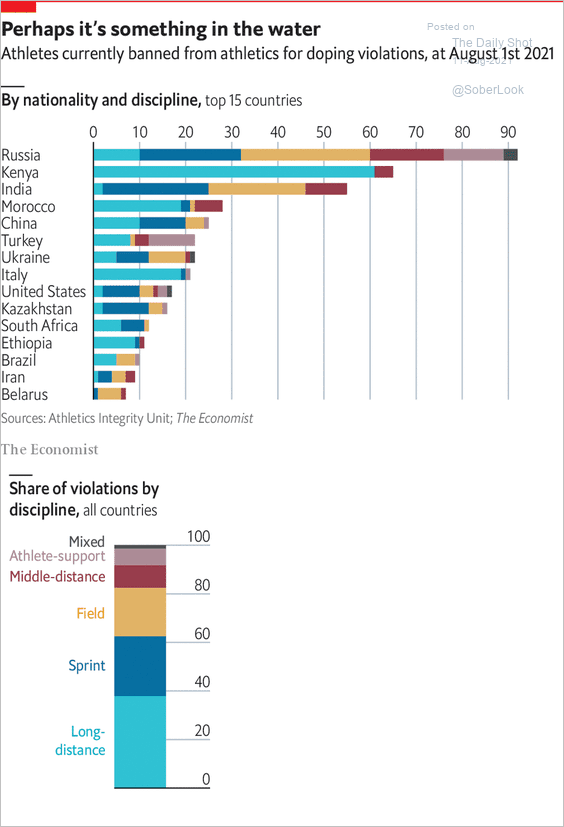 Source: The Economist Read full article
2. COVID deaths in long-term care facilities
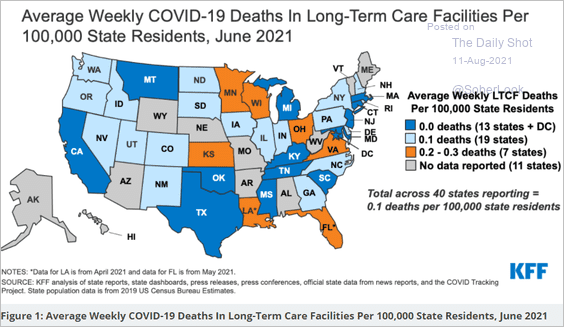 Source: KFF
3. US COVID hospitalizations:
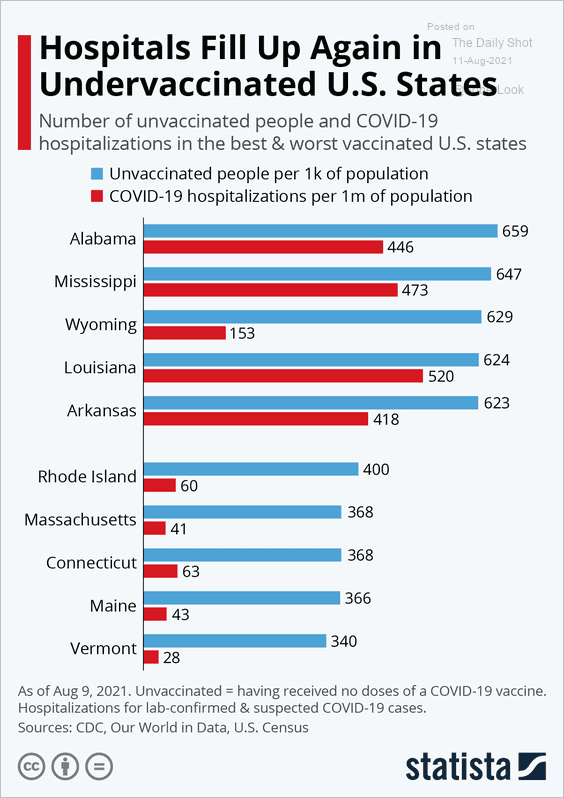 Source: Statista
4. Americans’ life ratings:
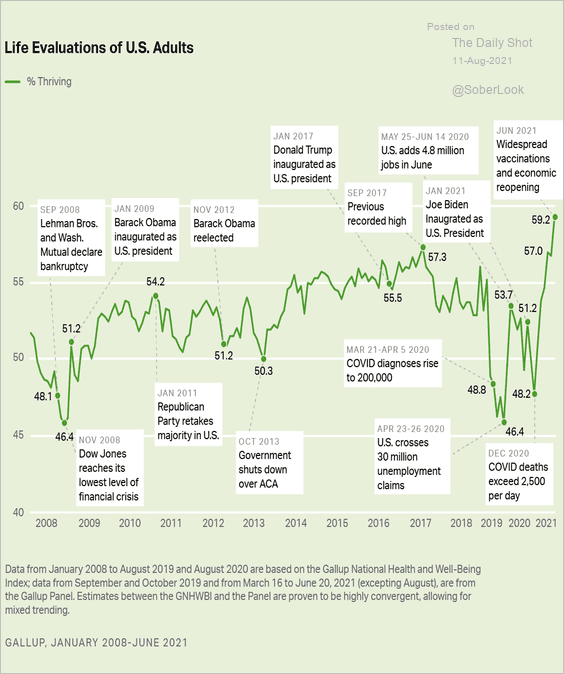 Source: Gallup Read full article
5. Acquisitions of doctor practices during the pandemic:
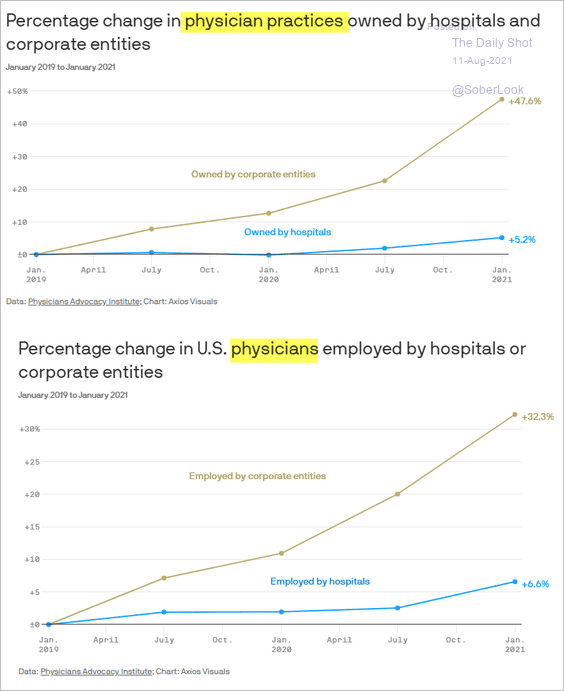 Source: @axios Read full article
6. Drinking during lockdowns:
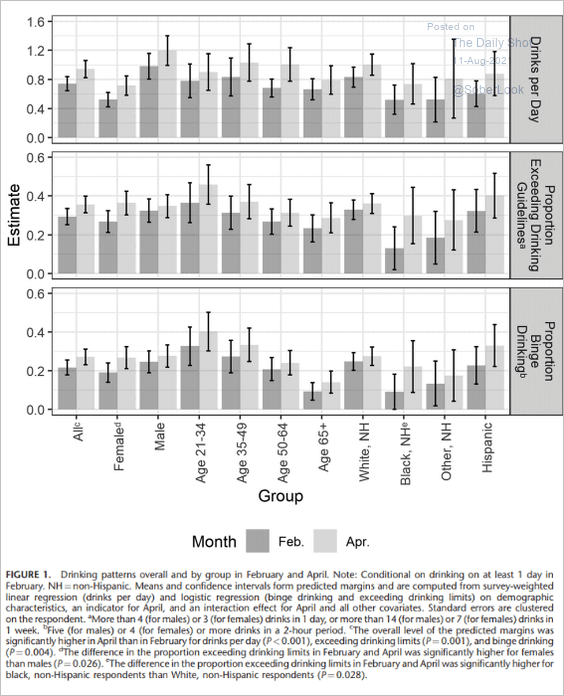 Source: American Society of Addiction Medicine Read full article
7. The flu vanishing during COVID:
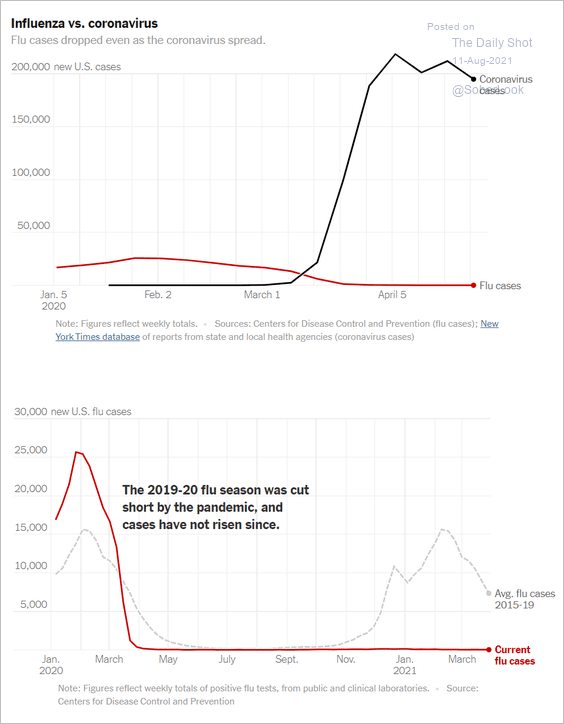 Source: The New York Times Read full article
8. Practicing yoga:
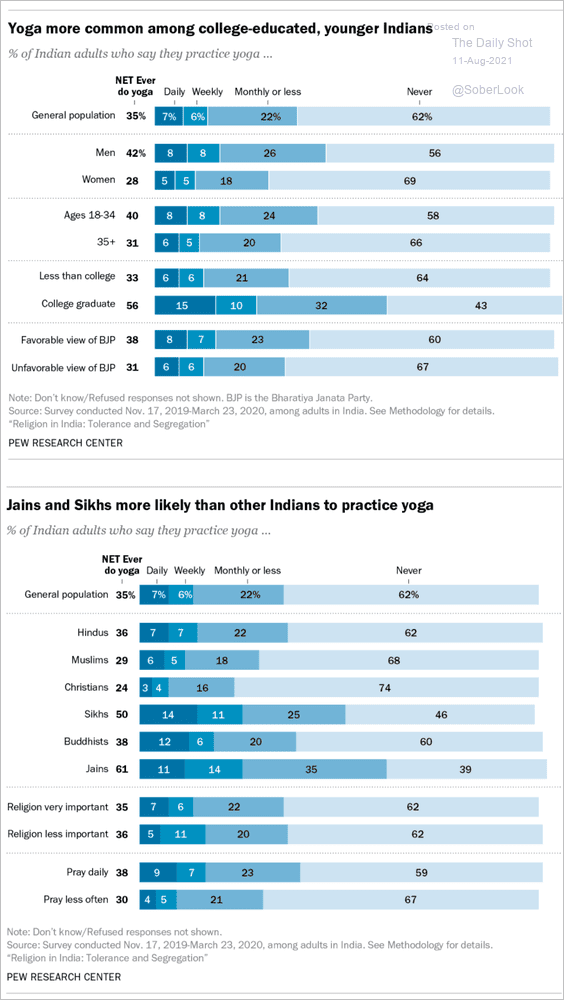 Source: Pew Research Center Read full article
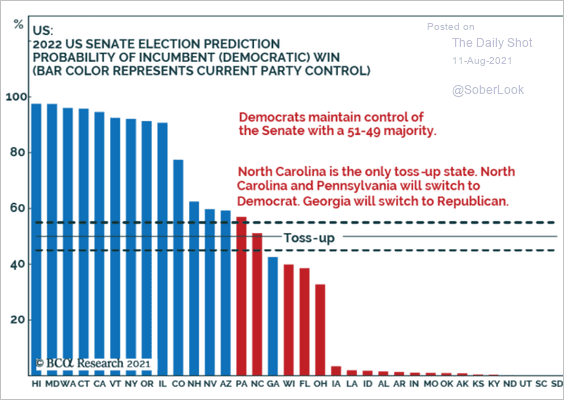
9. Senate midterm election forecast from BCA Research:
 Source: BCA Research
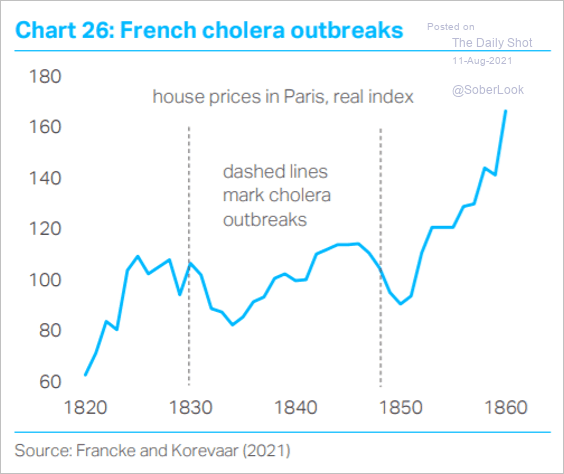
10. French cholera outbreaks and home price appreciation in the 1800s:
 Source: TS Lombard
——————–
Back to Index