
The Daily Shot: 13-Aug-21
• The United States
• Canada
• The United Kingdom
• The Eurozone
• Asia – Pacific
• China
• Emerging Markets
• Cryptocurrency
• Commodities
• Equities
• Rates
• Global Developments
• Food for Thought
The United States
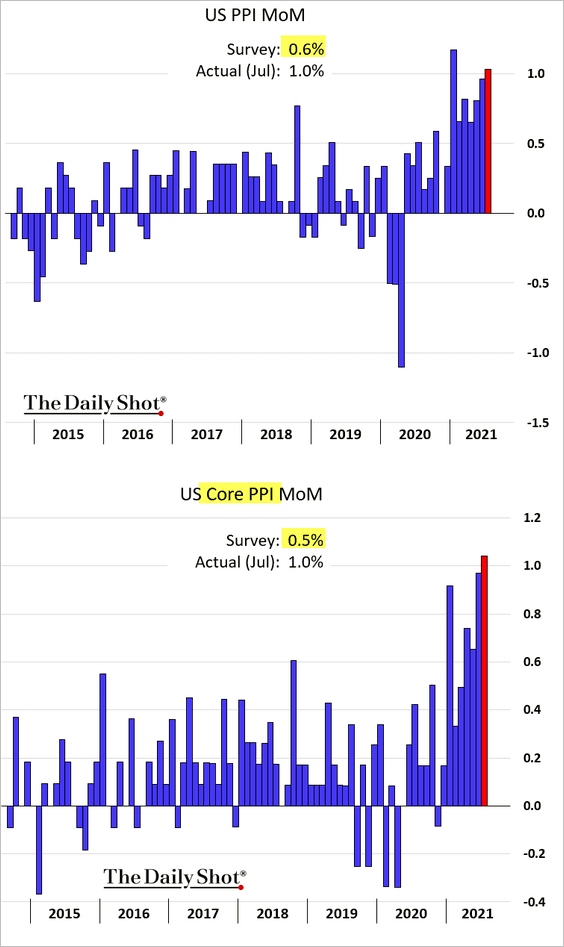
1. Let’s begin with some updates on inflation.
• In contrast with the CPI report, producer price data surprised to the upside. The monthly increase in the core PPI hit a multi-year high.
 Source: MarketWatch Read full article
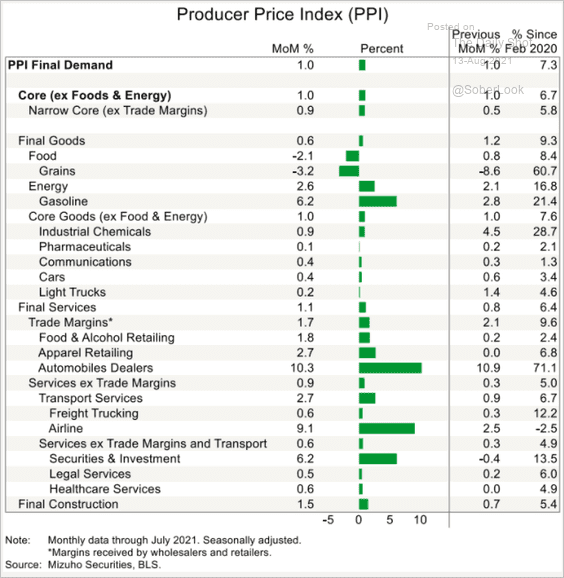
Here is the breakdown by sector.
 Source: Pantheon Macroeconomics
• COVID-sensitive items continue to drive the core CPI gains.
 Source: @PkZweifel
• Restaurants have been boosting prices.
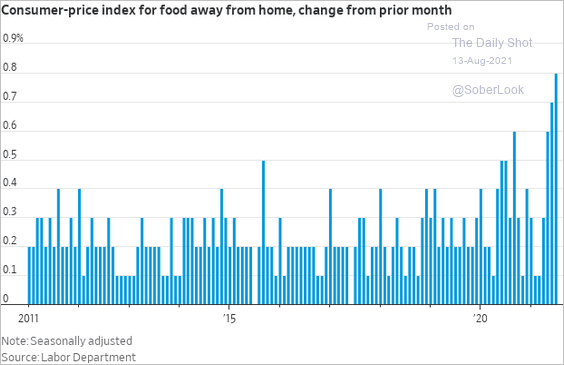 Source: @jeffsparshott
• Retailers haven’t had this much pricing power in years (perhaps decades).
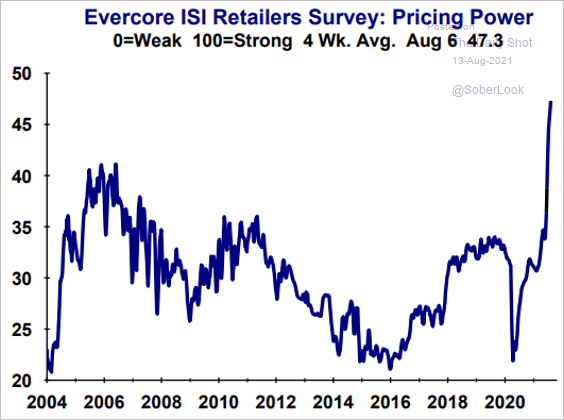 Source: Evercore ISI
• Ride-share prices have risen sharply due to driver shortages (and increased demand in some areas).
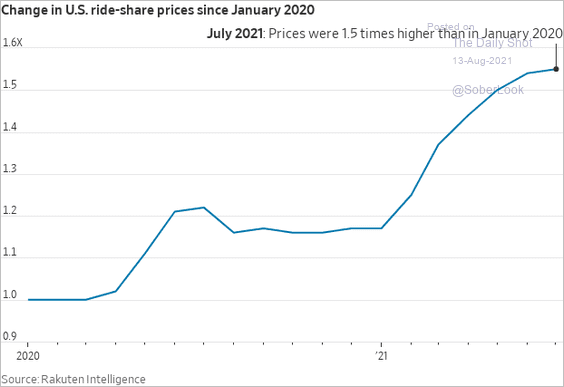 Source: @WSJ Read full article
• What is the current difference between the CPI and PCE inflation indices?
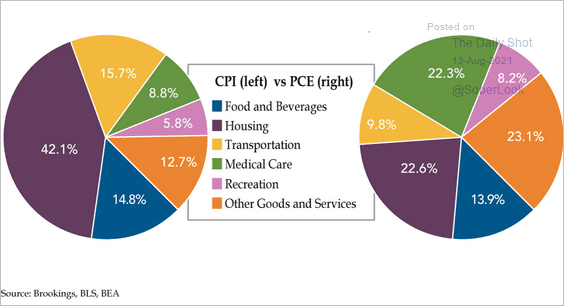 Source: The Daily Feather
• The correlation between wages and prices has been falling over the past decade.
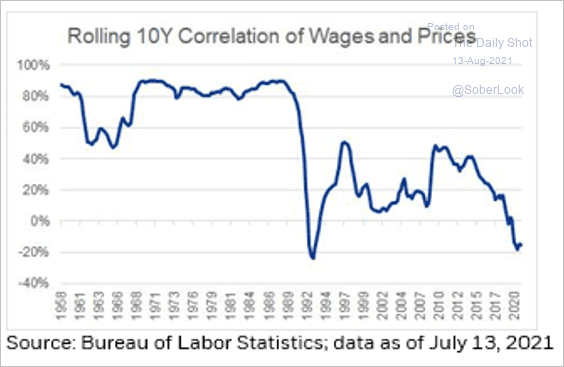 Source: @RickRieder
• Social Security payments will increase more than usual next year due to the spike in inflation. Will it be enough?
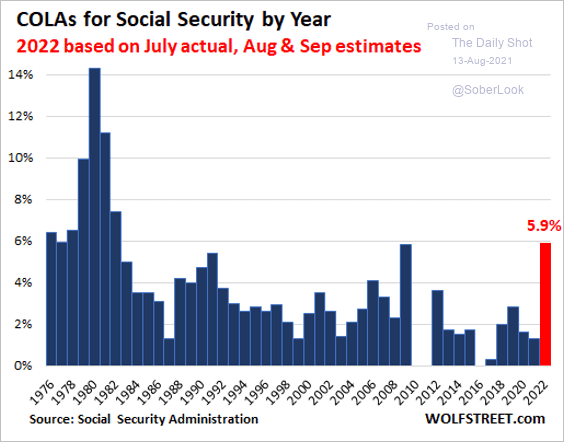 Source: @wolfofwolfst Read full article
——————–
2. Next, we have some updates on the labor market.
• Initial jobless claims (ex. emergency programs) are still in line with 2012 levels.
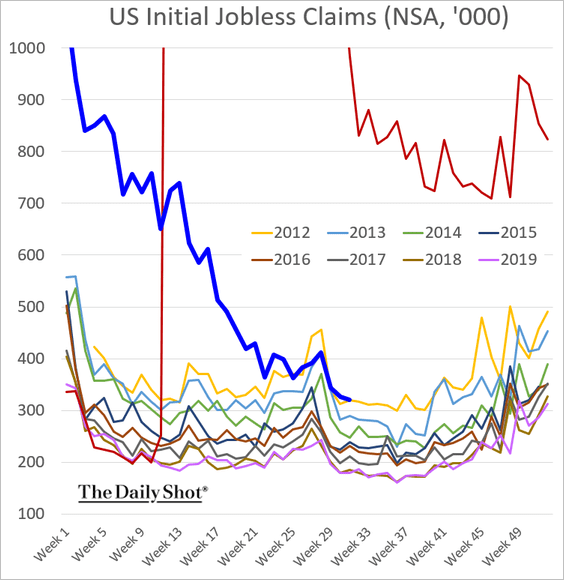
Continuing claims are drifting lower.
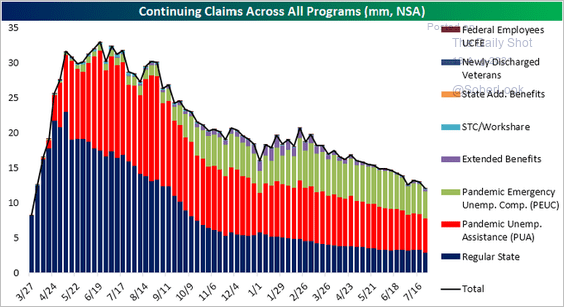 Source: @bespokeinvest Read full article
• This graphic illustrates the total employment loss by sector.
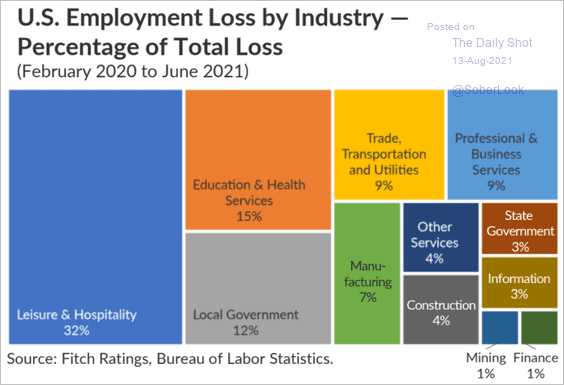 Source: Fitch Ratings
• Labor market recoveries usually take several years.
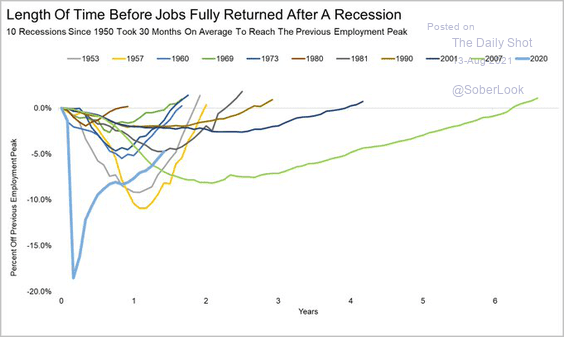 Source: @RyanDetrick
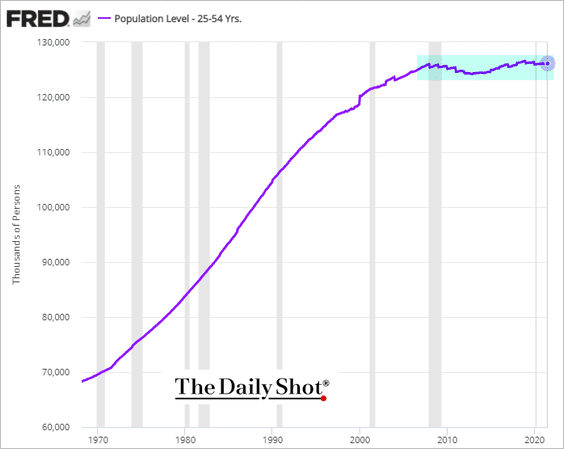
• It’s hard to grow the labor force when the prime-age population remains flat for over a decade. This trend will continue to be a drag on GDP growth.
• This chart shows the share of departing workers who quit voluntarily.
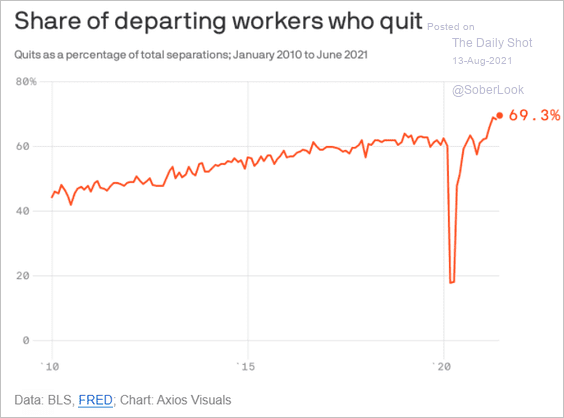 Source: @axios Read full article
• Finally, we have the growth in hourly earnings vs. the quits rate.
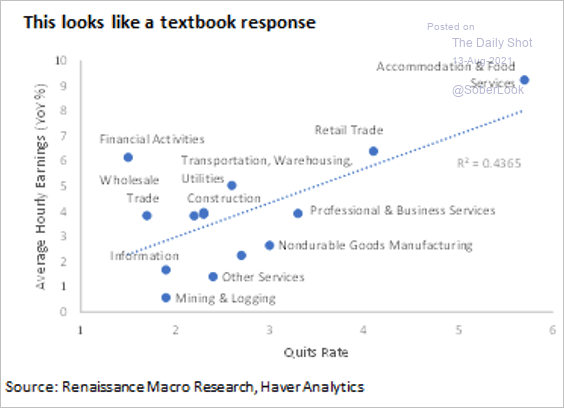 Source: @RenMacLLC
——————–
3. Mall traffic has recovered.
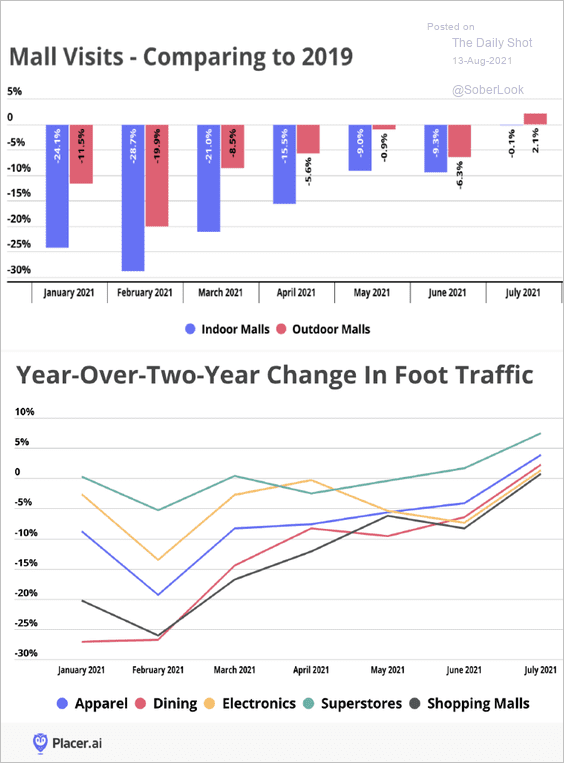 Source: Placer.ai
4. The recent surge in household net worth has been unprecedented, …
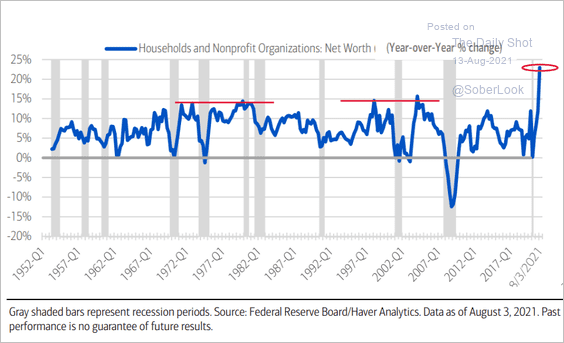 Source: BofA Global Research
… as stocks and housing prices soared.
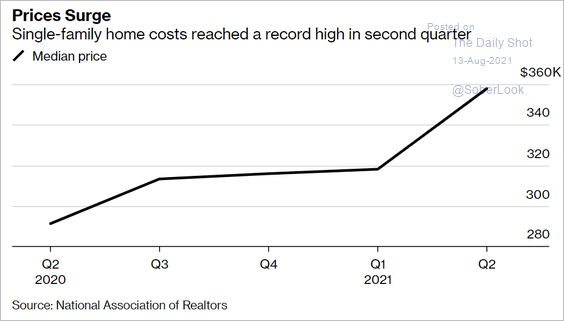 Source: Bloomberg Read full article
——————–
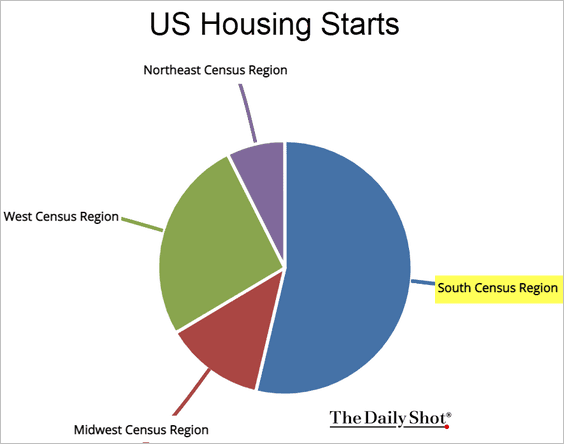
5. Will rising COVID cases in the South depress US residential construction?
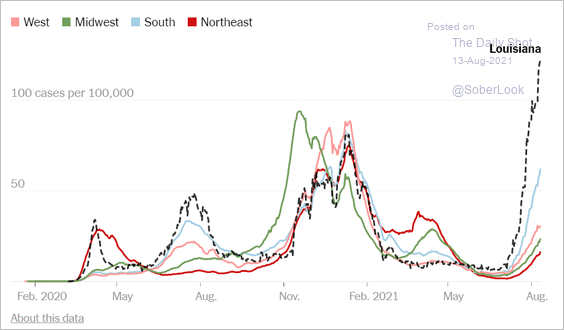 Source: The New York Times Read full article
——————–
Back to Index
Canada
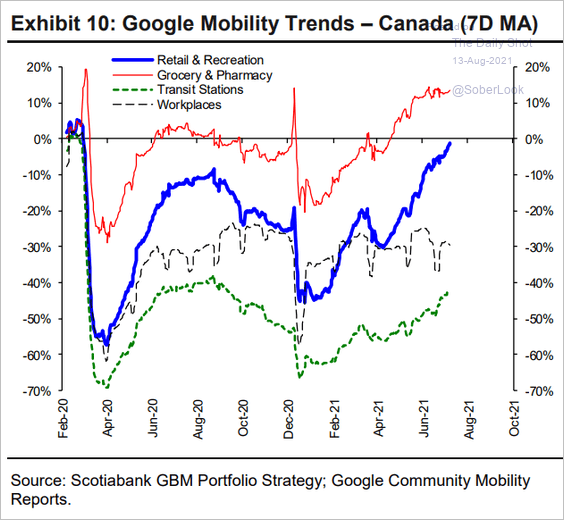
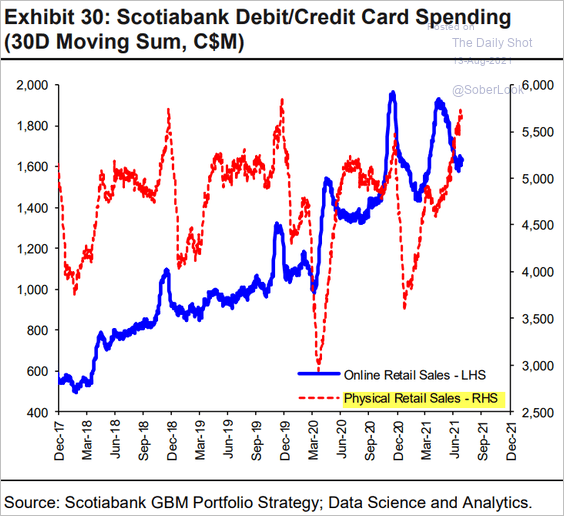
Google mobility trends and card spending data show retail and recreation activity near full recovery.
 Source: Hugo Ste-Marie, Portfolio & Quantitative Strategy Global Equity Research, Scotia Capital
 Source: Hugo Ste-Marie, Portfolio & Quantitative Strategy Global Equity Research, Scotia Capital
The Oxford Economics Recovery Tracker is now above pre-COVID levels.
![]() Source: Oxford Economics
Source: Oxford Economics
Back to Index
The United Kingdom
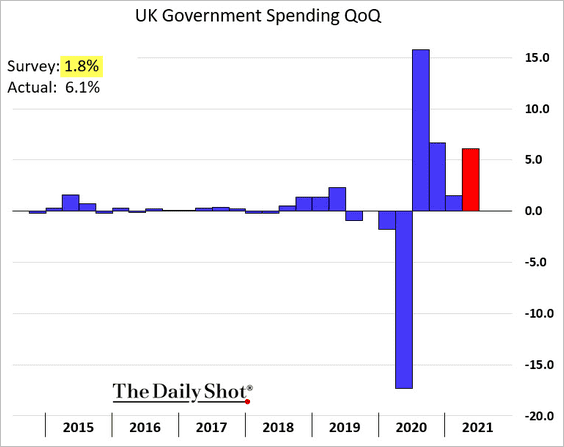
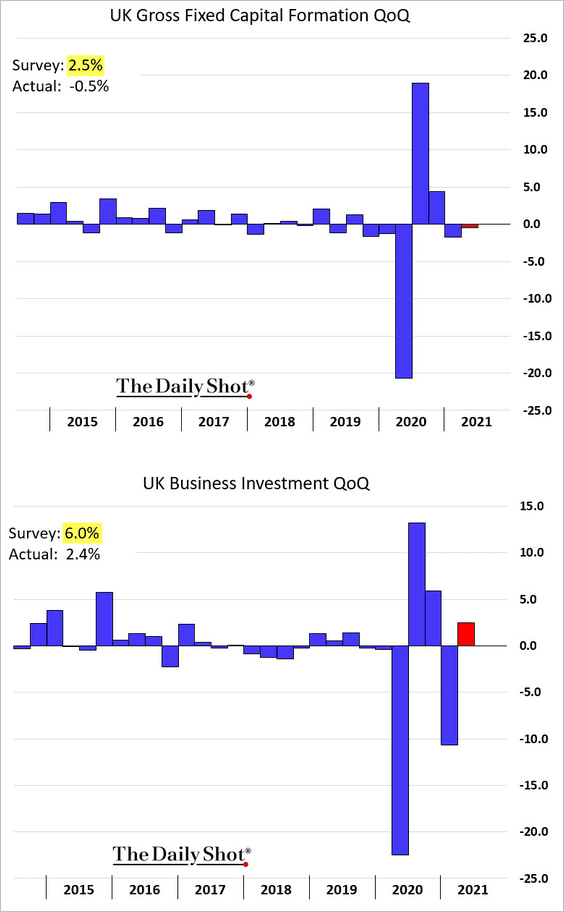
1. As we saw yesterday, private consumption topped expectations in Q2 (chart). Government spending was also very strong.
However, business investment was weaker than expected.
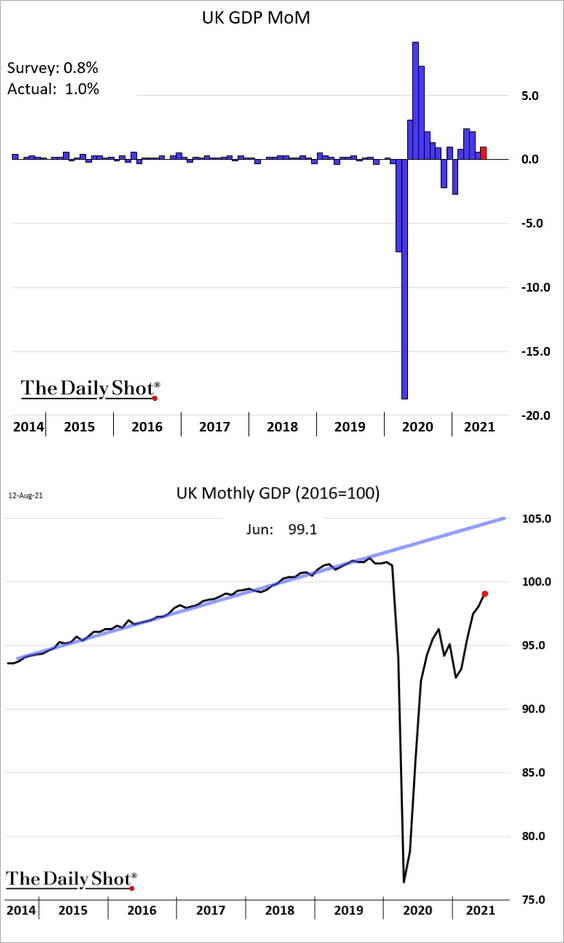
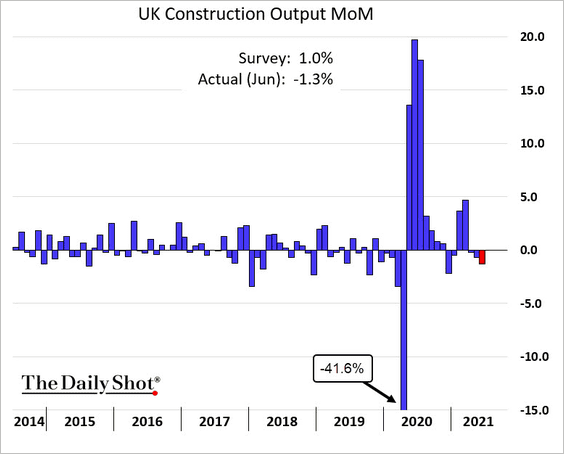
• The June monthly GDP estimate exceeded forecasts.
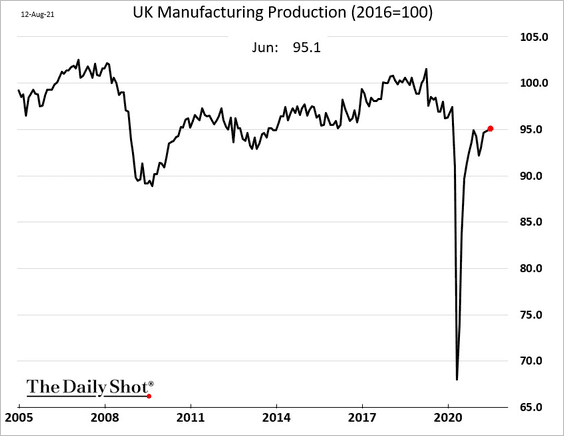
• Factory output gains were soft, …
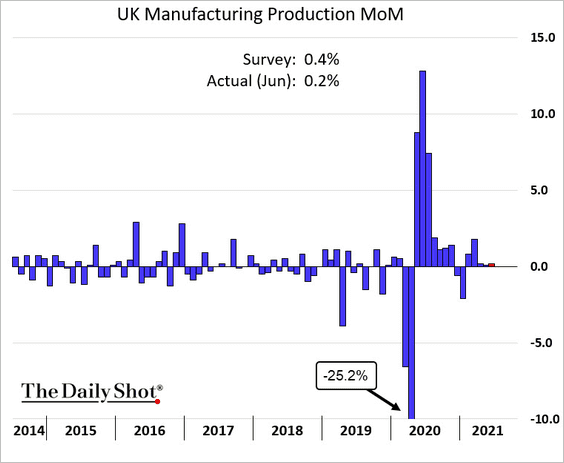
… and production is still below pre-COVID levels.
• Construction unexpectedly declined.
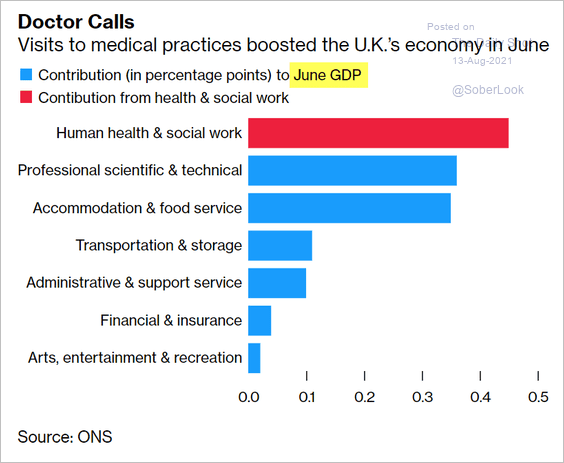
• But service industries’ output topped projections, …
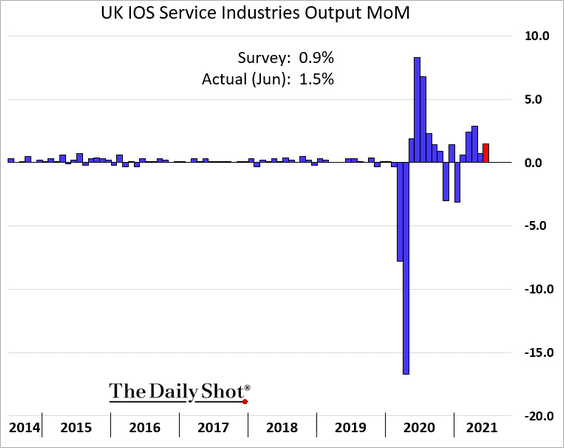
… boosted by health services.
 Source: Bloomberg Read full article
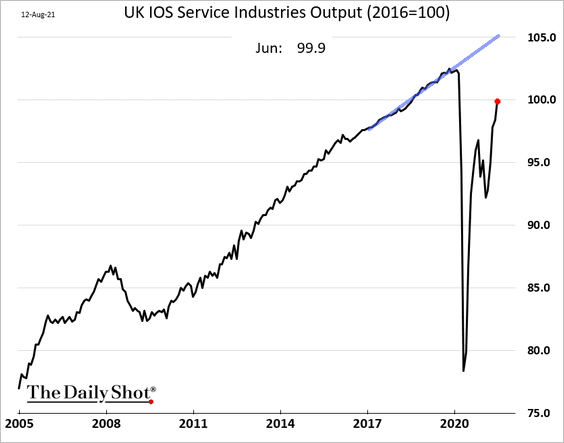
However, the full recovery will take time.
2. The trade balance was in deficit (a small surplus was expected).
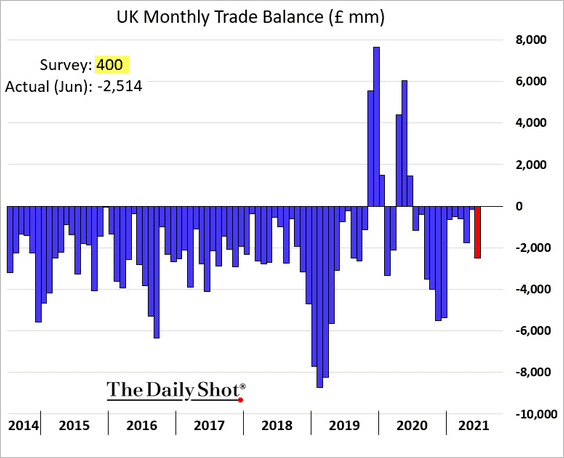
Trade with the EU continues to improve.
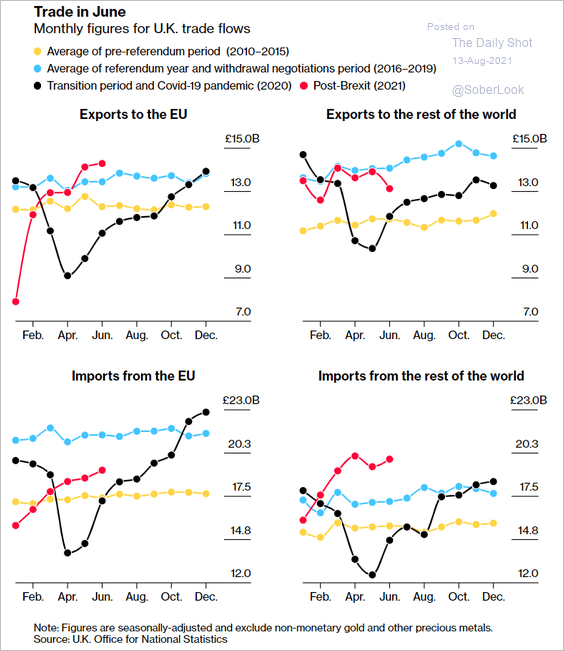 Source: @bbgvisualdata Read full article
Back to Index
The Eurozone
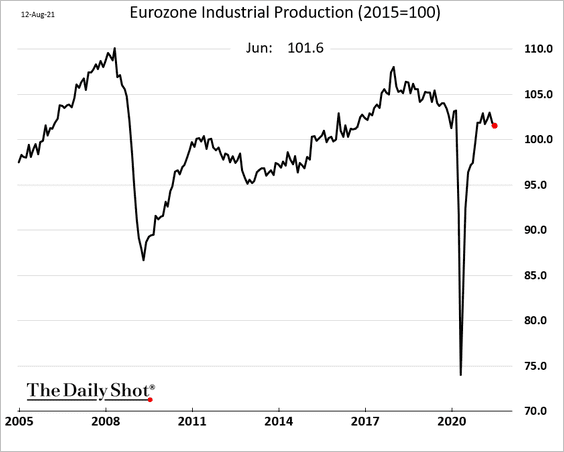
1. Industrial production ticked lower in June.
2. The recovery in consumer confidence points to rising private consumption.
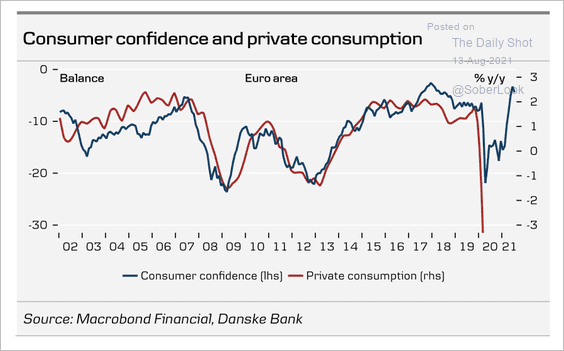 Source: Danske Bank
3. The ECB (Eurosystem) has absorbed most new government bond issuance in Italy and Spain.
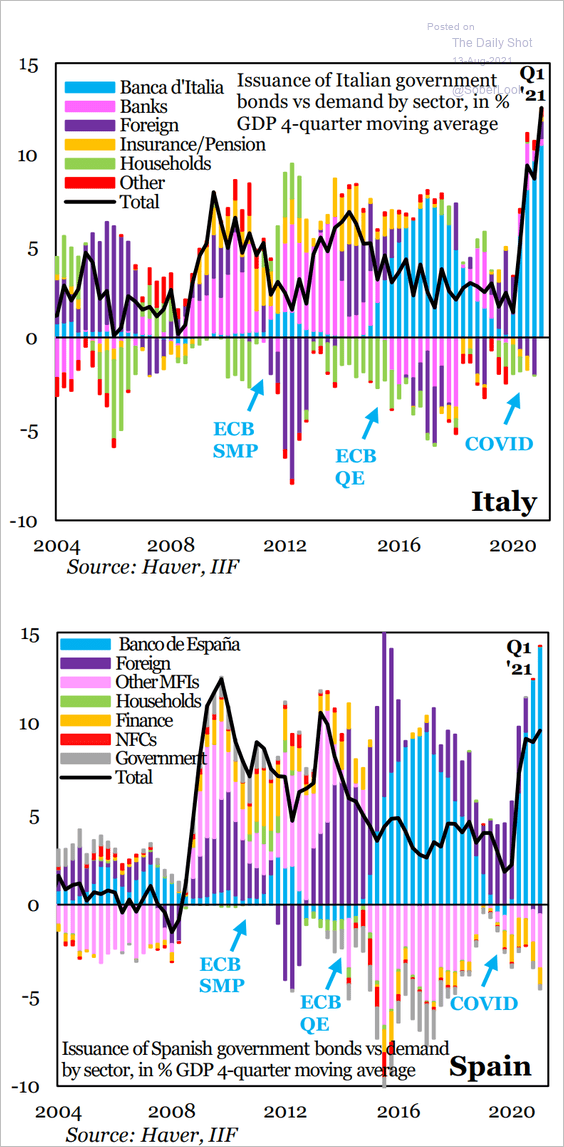 Source: IIF
Back to Index
Asia – Pacific
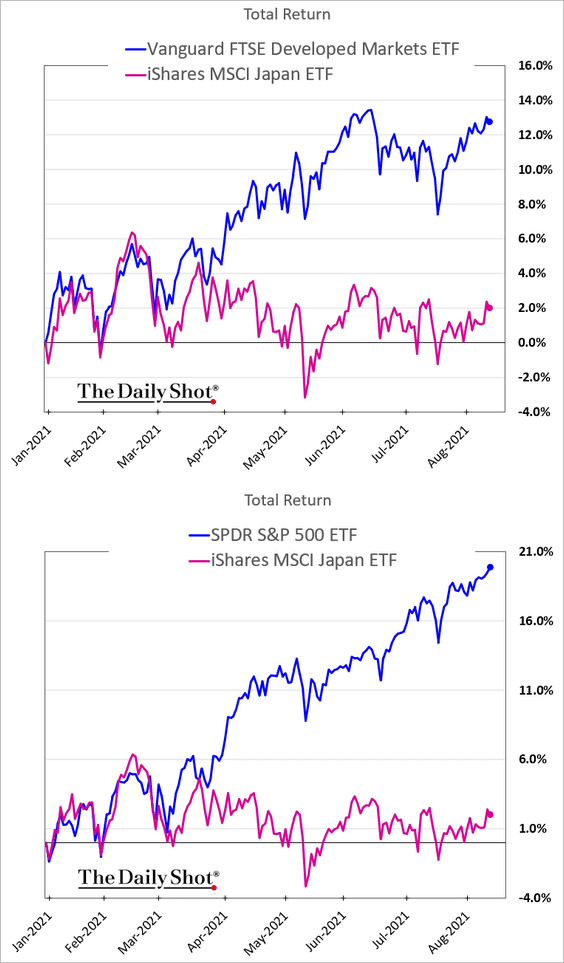
1. Japanese shares have underperformed other developed markets this year.
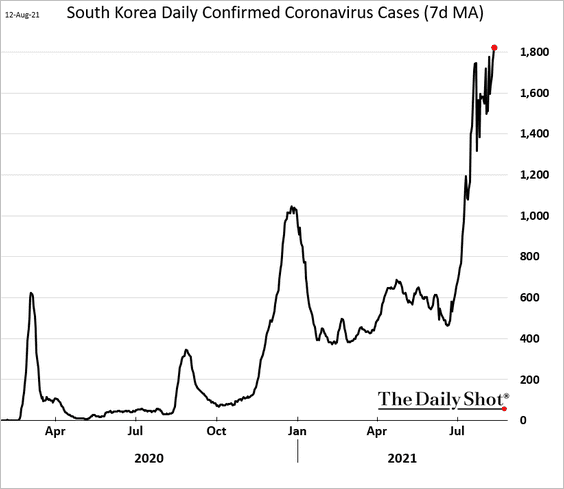
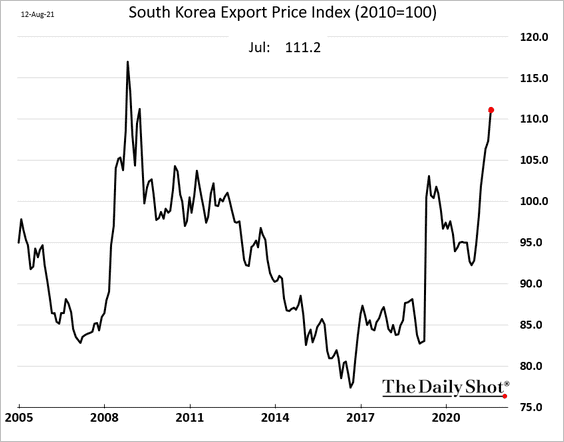
2. COVID cases in South Korea have been surging.
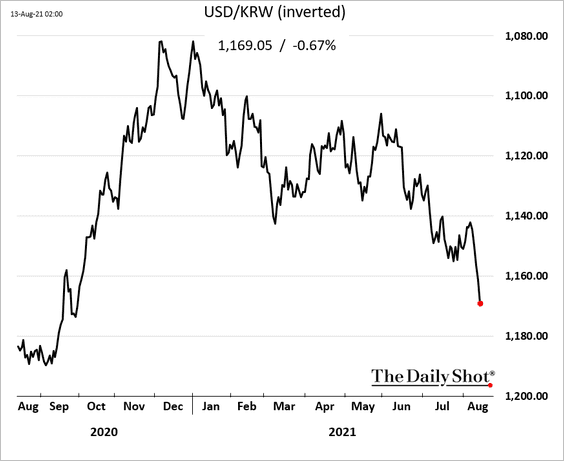
The won continues to sink as nervous foreign investors exit.
Separately, South Korean exporters have been rapidly boosting prices.
——————–
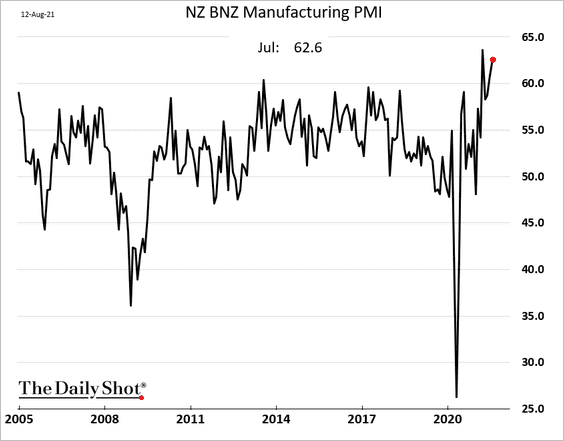
3. New Zealand’s manufacturing growth remains near multi-year highs.
Back to Index
China
1. Despite the recent selloff, the Hang Seng TECH index is still trading at a premium to the Nasdaq 100.
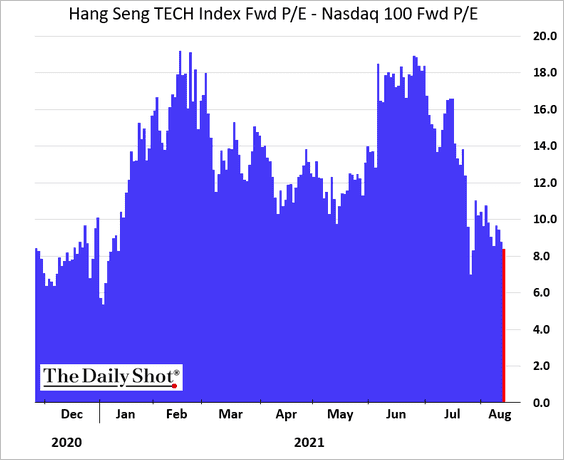 h/t @richwesgoodman
2. Monetary conditions appear to be easing again (although growth in money supply indicators has been falling – see chart).
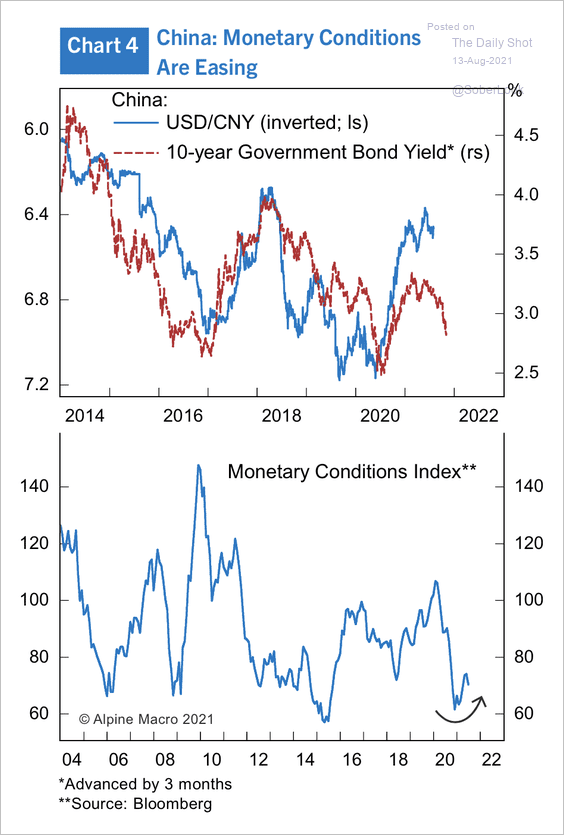 Source: Alpine Macro
Back to Index
Emerging Markets
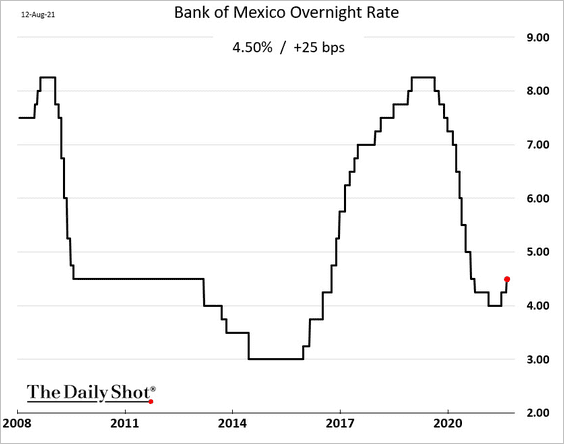
1. Banxico hiked rates again, as expected.
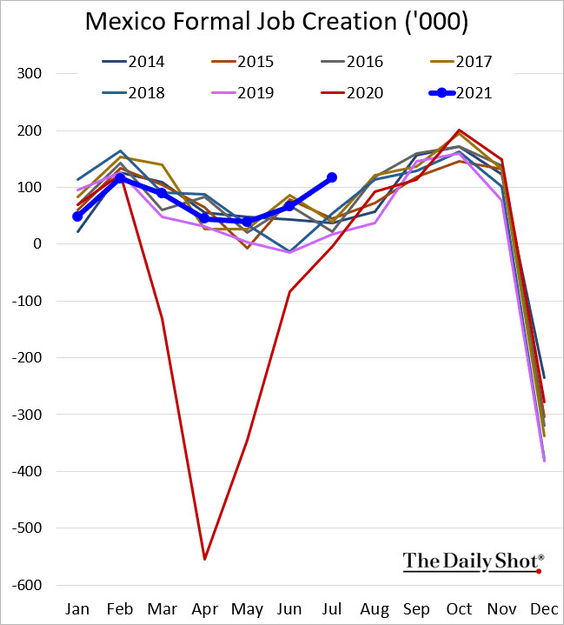
Mexican formal job creation is at multi-year highs for this time of the year.
——————–
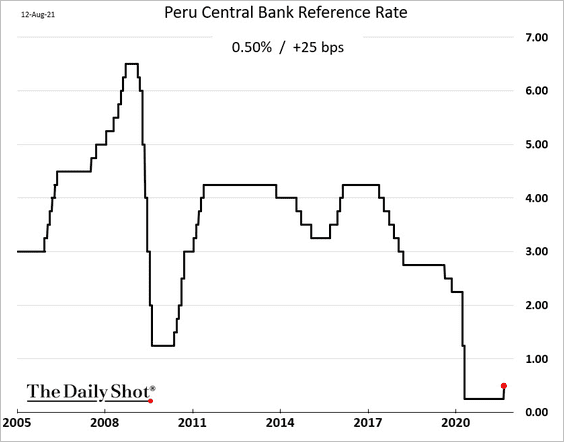
2. Peru’s central bank hiked rates for the first time since 2016.
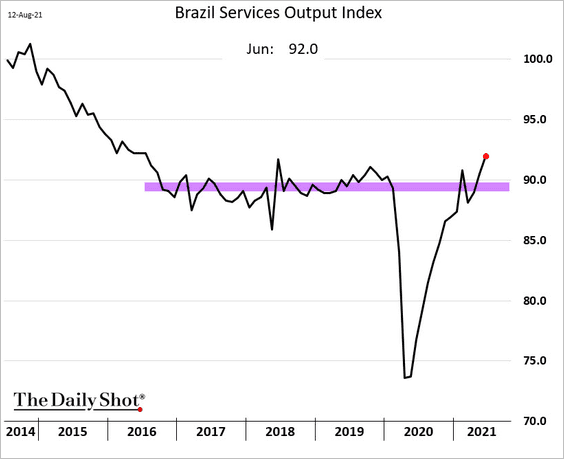
3. Brazil’s services output is above pre-COVID levels.
4. Colombia’s manufacturing rebounded in June.

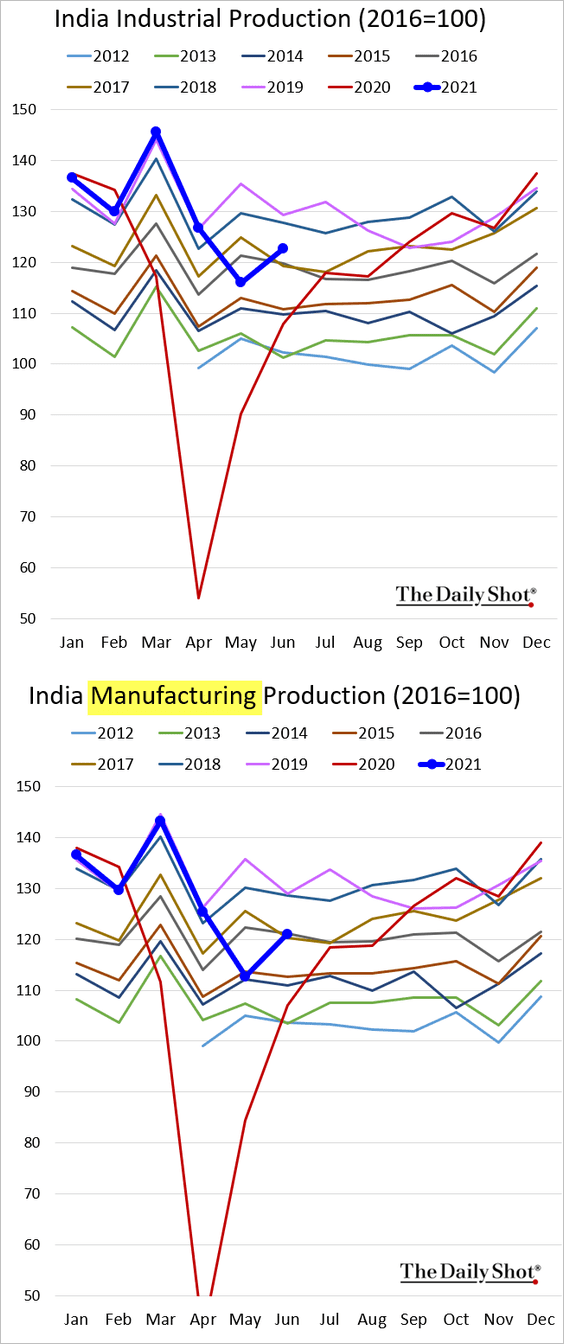
5. India’s industrial production improved in June but remains well below pre-COVID levels.
Separately, this chart shows India’s electricity capacity development.
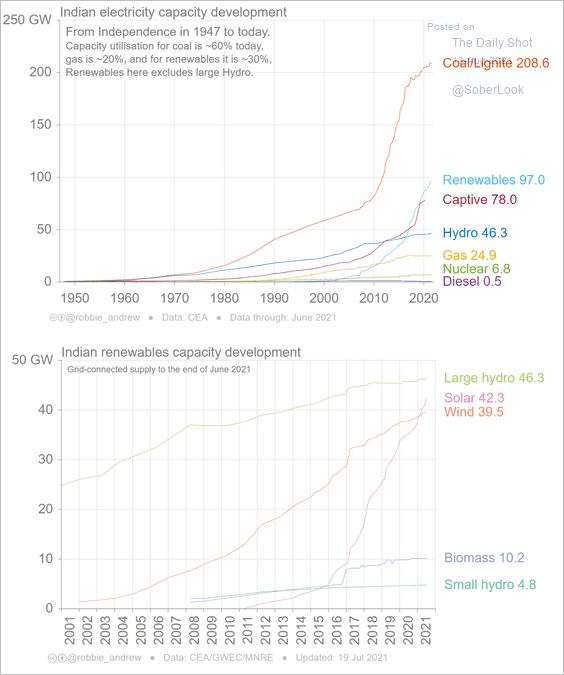 Source: Robbie Andrew, CICERO
——————–
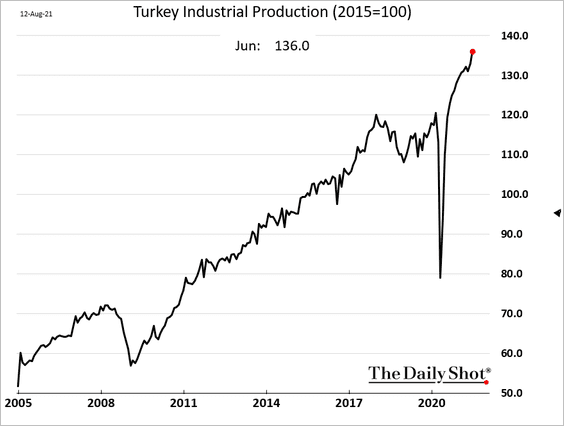
6. Turkey’s industrial production is surging.
7. This chart shows public debt-to-GDP ratios by region.
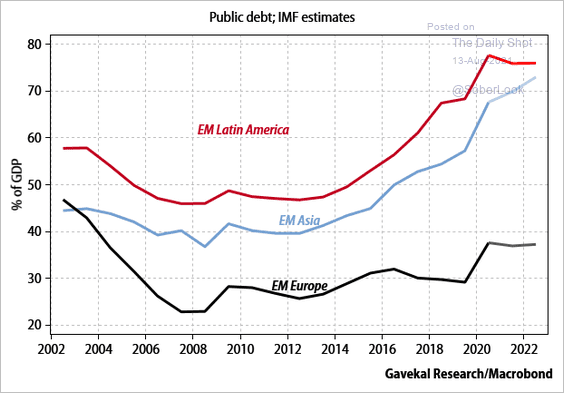 Source: Gavekal Research
8. Next, we have EM bond yields vs. public debt (chart below) and vs. currency volatility (2nd chart).
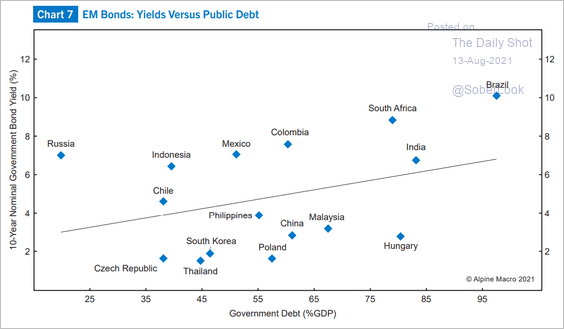 Source: Alpine Macro
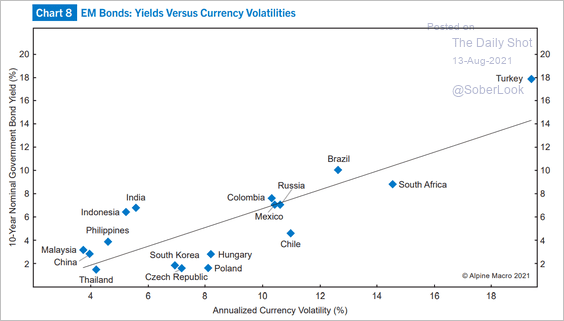 Source: Alpine Macro
——————–
9. Asset managers are no longer unwinding their bets on EM equities.
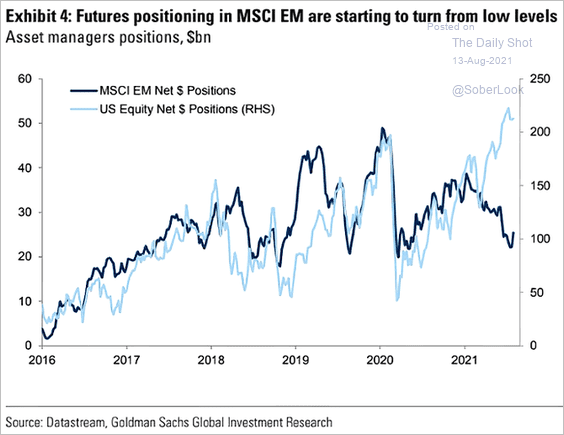 Source: @ISABELNET_SA, @GoldmanSachs
Back to Index
Cryptocurrency
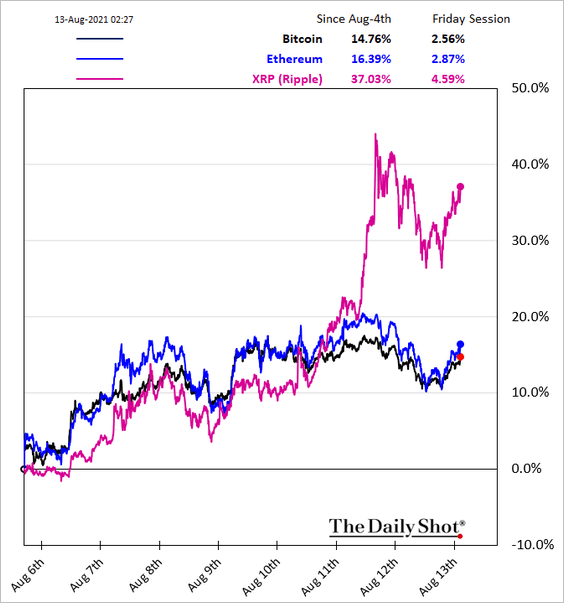
1. XRP has outperformed other large cryptocurrencies over the past week.
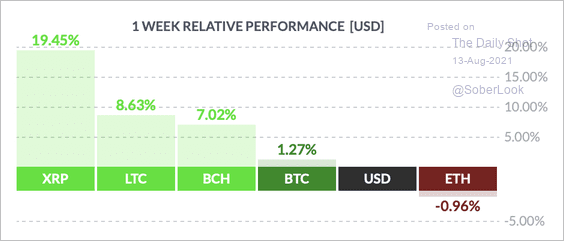 Source: FinViz
——————–
3. In aggregate, short-term bitcoin holders are now slightly up relative to their cost basis, according to blockchain data.
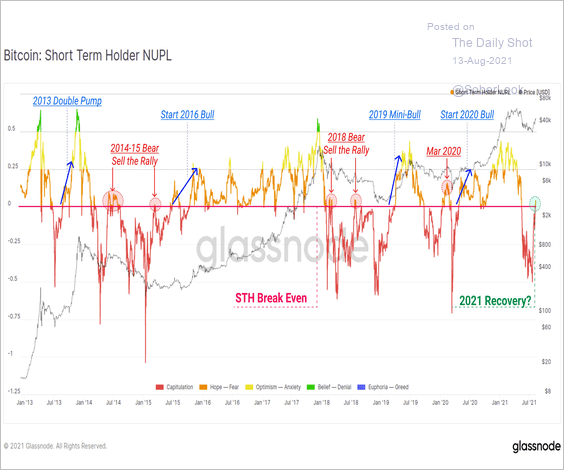 Source: @glassnode
4. Total ETH open interest exceeded $4 billion, reaching a two-month high.
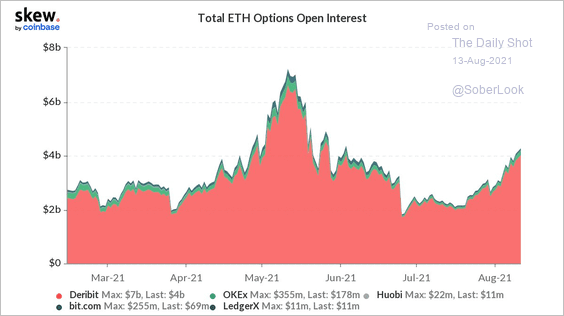 Source: @skewdotcom
5. Bitcoin’s one-year realized correlation to gold turned negative and is approaching a three-year low.
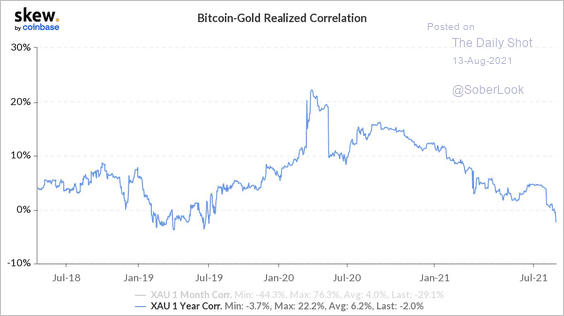 Source: @skewdotcom
Back to Index
Commodities
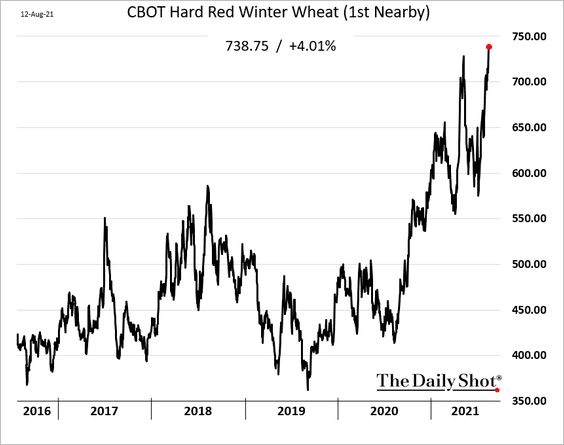
1. US grains surged after the latest USDA report.
 Source: MarketWatch Read full article
• Hard red winter wheat climbed to a multi-year high. The USDA report indicated that Russia’s crop will be smaller than expected.
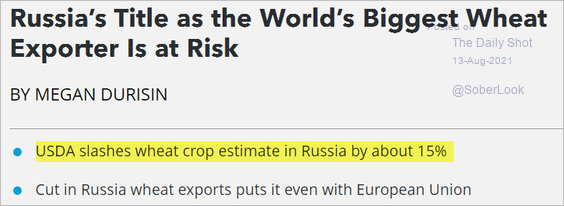 Source: Bloomberg Law Read full article
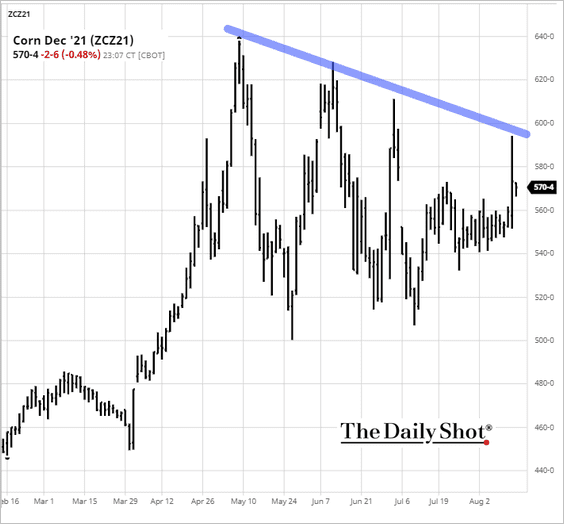
• Corn futures jumped but held resistance.
 Source: Successful Farming Read full article
 Source: barchart.com
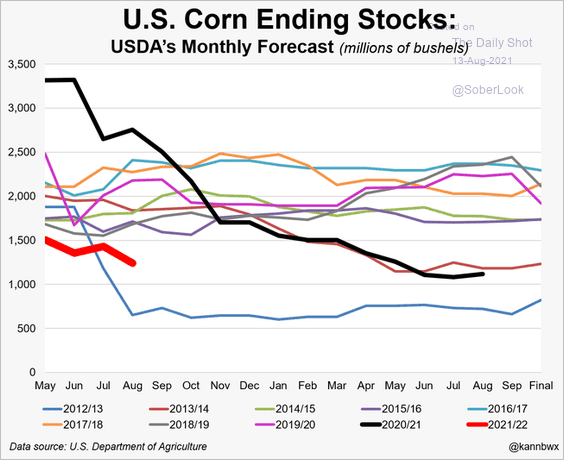
Corn inventories have been moving lower.
 Source: @kannbwx
——————–
2. Global steel prices continue to rise.
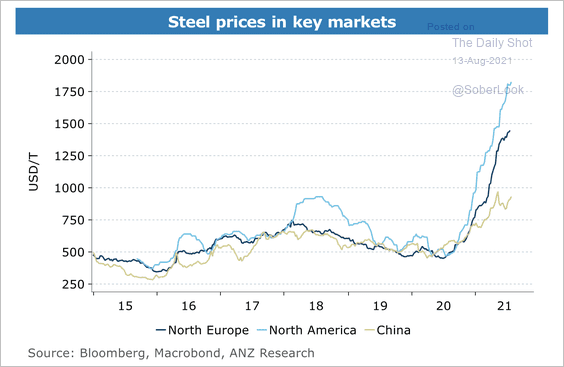 Source: ANZ Research
3. China’s copper treatment prices are increasing (an indication of higher supplies), along with increased production in Chile.
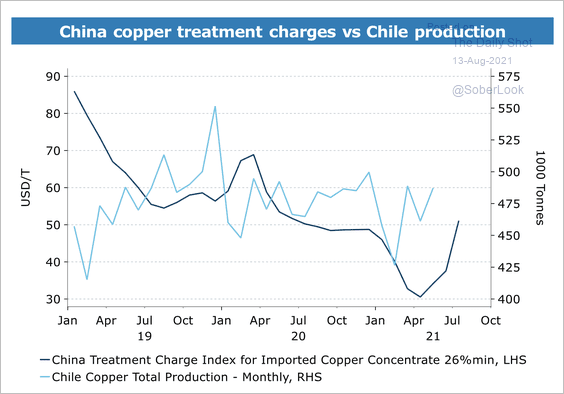 Source: ANZ Research
Back to Index
Equities
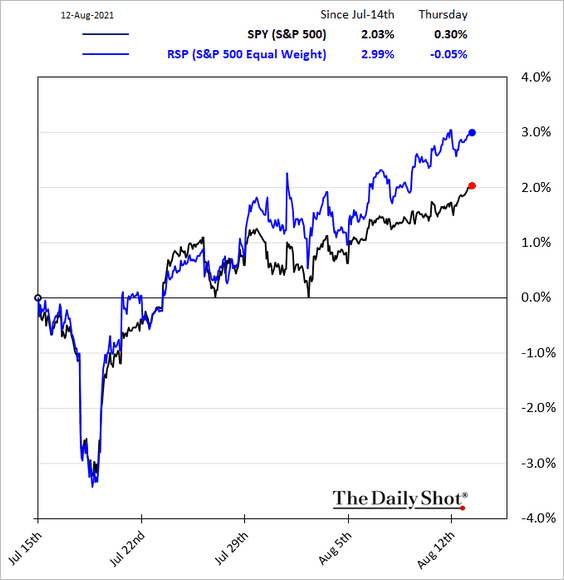
1. The S&P 500 breadth has been improving, …
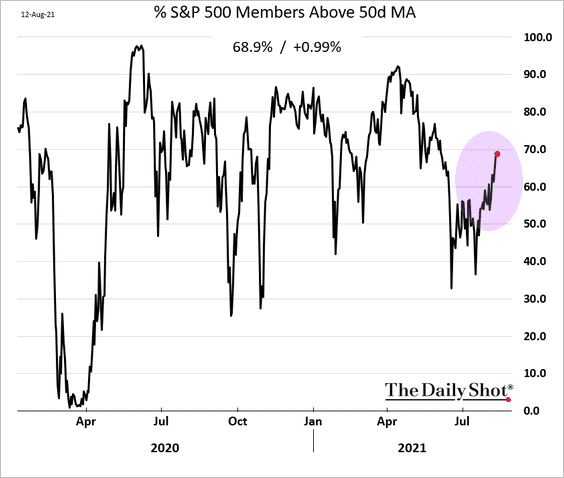
… as smaller members of the index outperform.
——————–
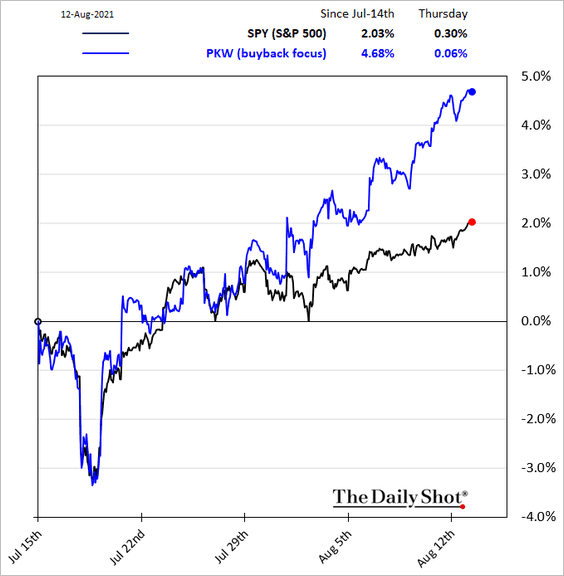
2. Companies that tend to return cash to investors have been outperforming those that focus on CapEx and R&D.
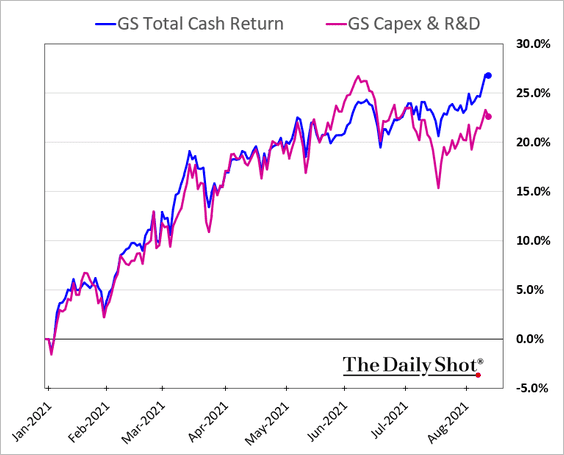
In particular, firms that buy back shares sharply outpaced the S&P 500 this month.
——————–
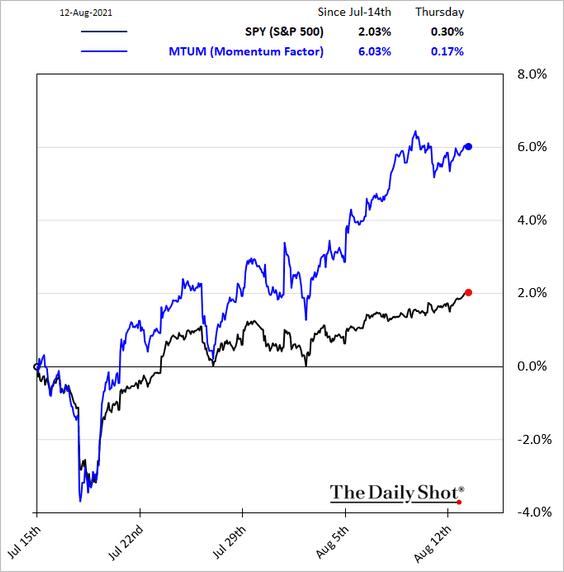
3. The momentum factor has done well since the July selloff.
4. For more than seven months in a row, almost every world equity index has been in a solid long-term uptrend, with a rising 200-day moving average.
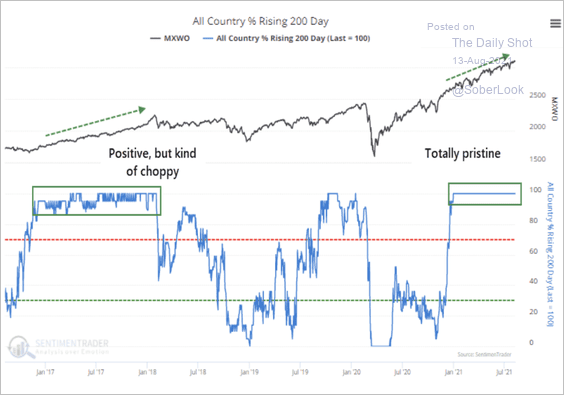 Source: SentimentTrader
5. How long does it take the S&P 500 to double in a bull market?
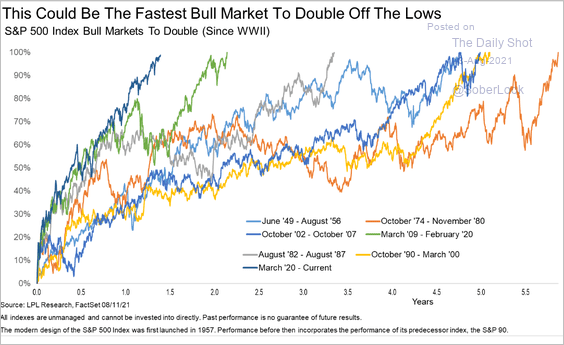 Source: LPL Research
6. Stocks don’t look attractive on an inflation-adjusted basis. The ongoing rally is an indication that the market sees inflation as transient.
• Real earnings yield:
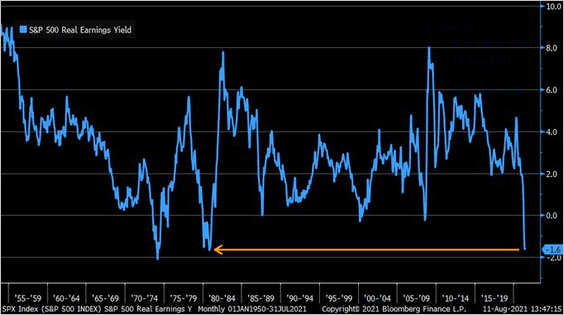 Source: @LizAnnSonders
• Tech stocks’ real free-cash-flow yield:
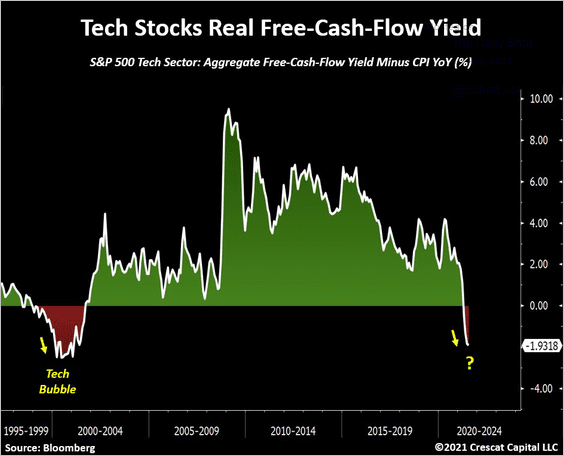 Source: @TaviCosta
——————–
7. The S&P 500 60-day historical volatility dipped below 10% for the first time since the start of the pandemic.
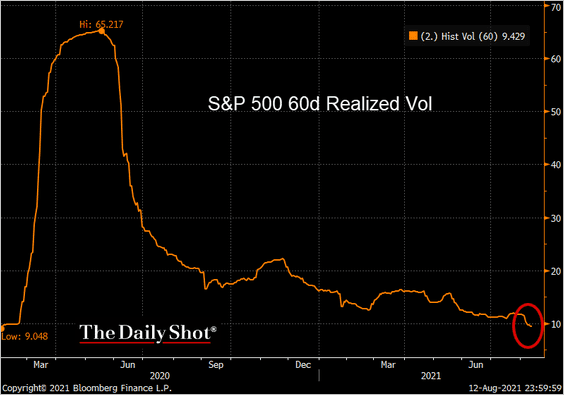 Source: @TheTerminal, Bloomberg Finance L.P.
8. Tech margins are substantially larger than the rest of the market.
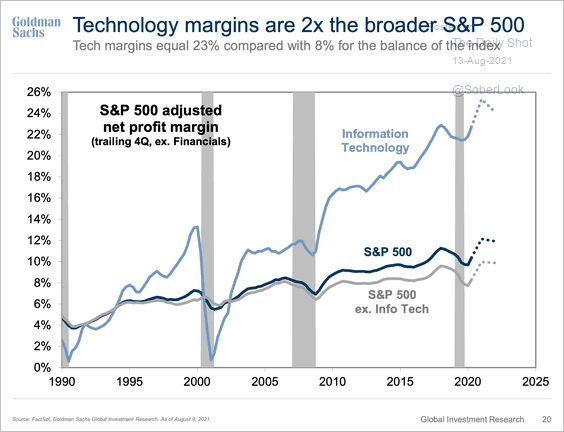 Source: Goldman Sachs; @SamRo
9. After the financial crisis, US growth stock outperformance has been driven by superior earnings growth.
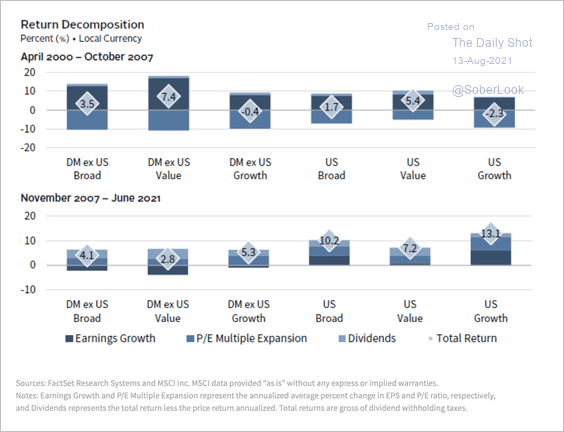 Source: Cambridge Associates Read full article
10. Fewer Investopedia readers (mostly retail) now expect stock market returns above 5%.
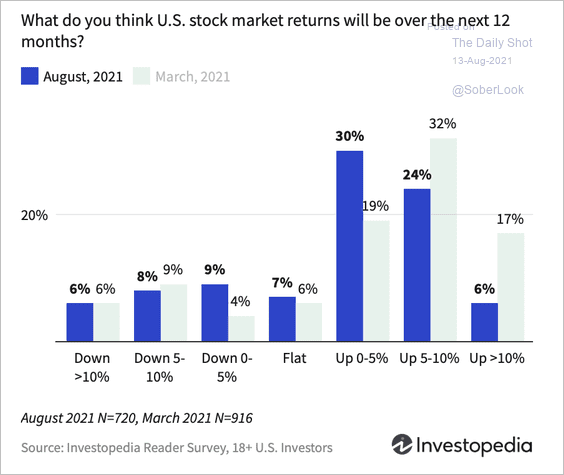 Source: Investopedia Read full article
Back to Index
Rates
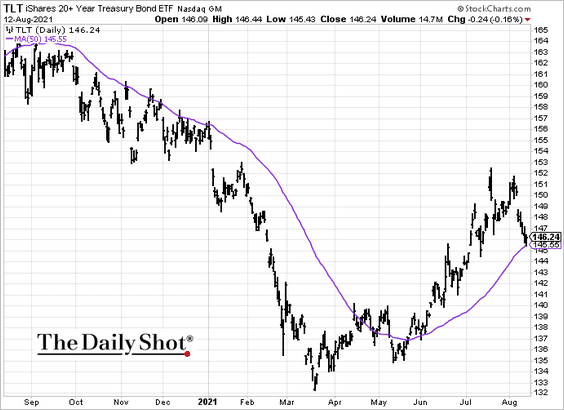
1. The 10yr Treasury yield is testing resistance at the 50-day moving average.
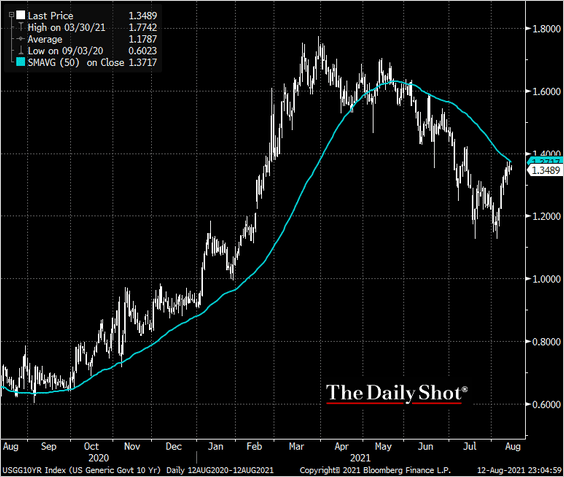 Source: @TheTerminal, Bloomberg Finance L.P.
The iShares 20+ Year Treasury ETF (TLT) is at support.
——————–
2. The US Treasury’s cash balances at the Fed are falling rapidly, …
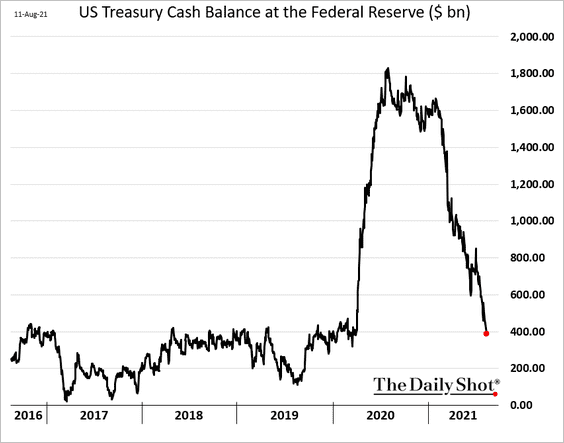
… which is boosting liquidity in the financial system. As a result, the Fed’s reverse repo (RRP) facility usage hit a record high.

But RRP gains are not enough to slow the expansion in bank reserves, which exceeded $4 trillion for the first time.

Back to Index
Global Developments
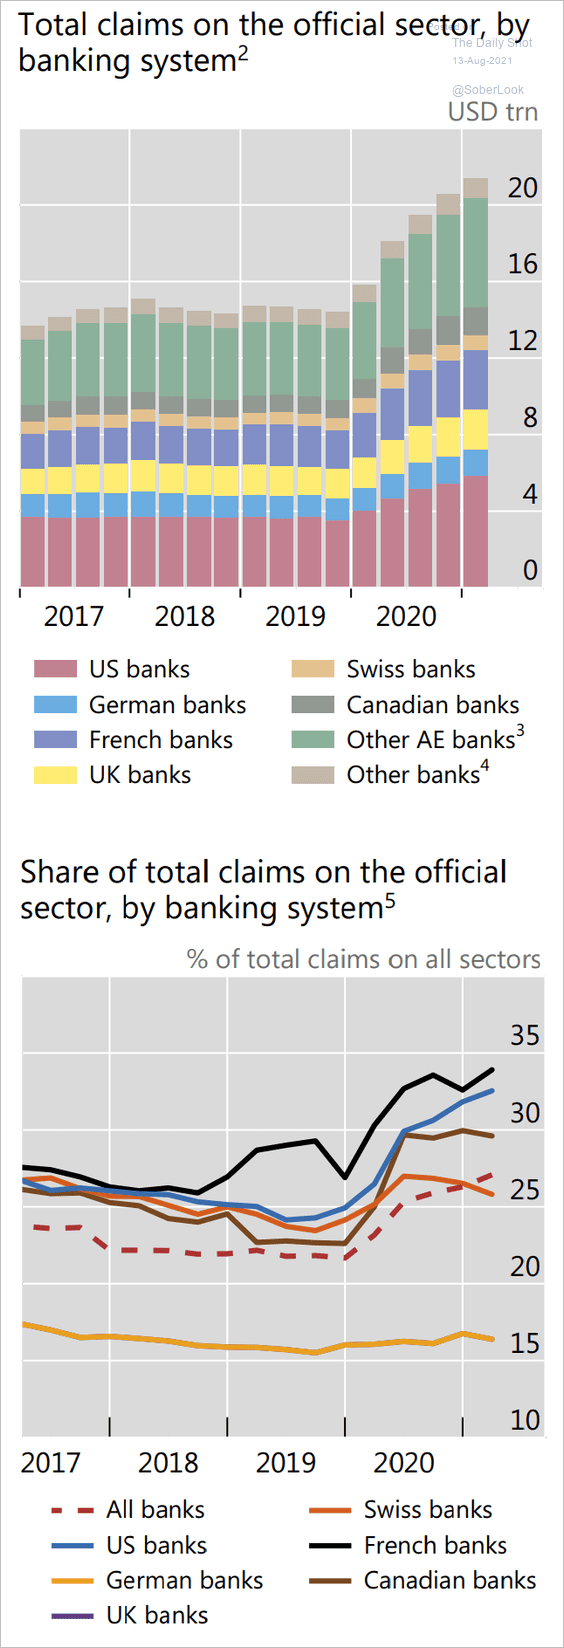
1. Let’s start with the global banking system’s exposure to sovereign debt.
 Source: BIS Read full article
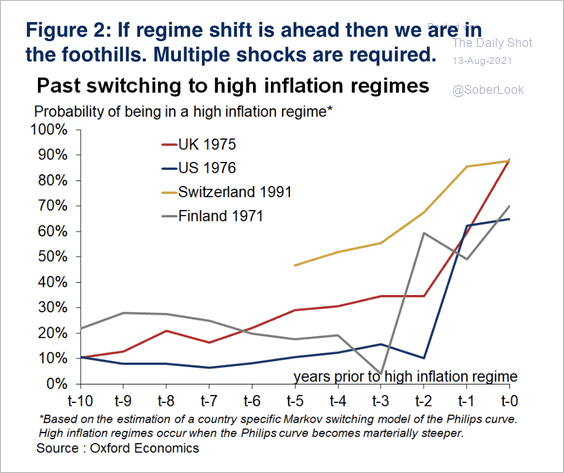
2. Inflation regime shifts typically occur over a few years.
 Source: Oxford Economics
A high inflation regime typically favors emerging market equities and cash.
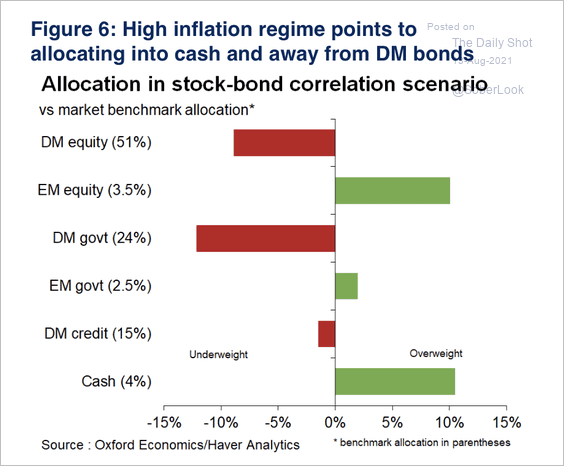 Source: Oxford Economics
——————–
3. MRB’s cyclical momentum indicator suggests risk assets will take a breather.
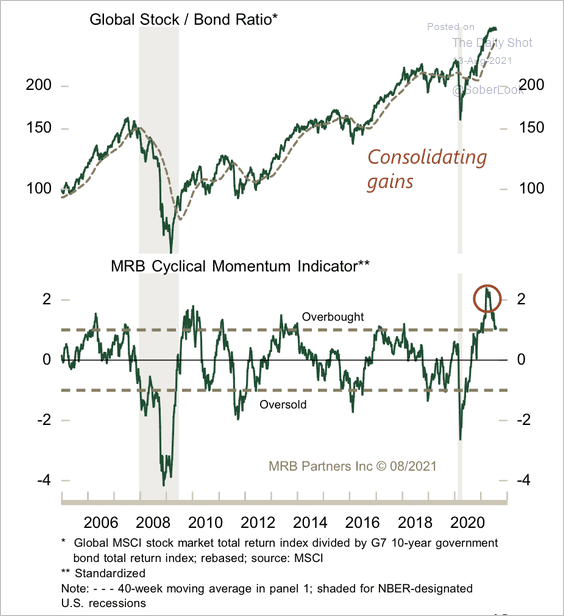 Source: MRB Partners
4. Chip delivery times continue to climb.
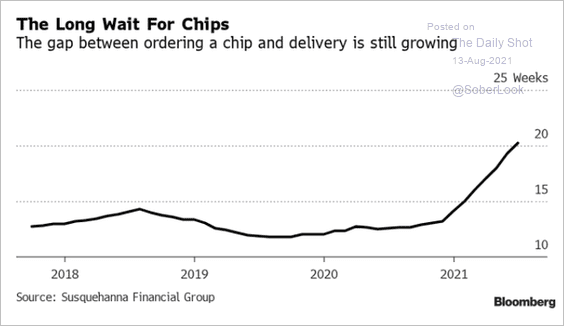 Source: @ChrisRugaber, @DiMartinoBooth, @LizAnnSonders, @YahooFinance, @SPYJared, @tracyalloway, @ianmking Read full article
5. Here is a look at inflation levels in select economies.
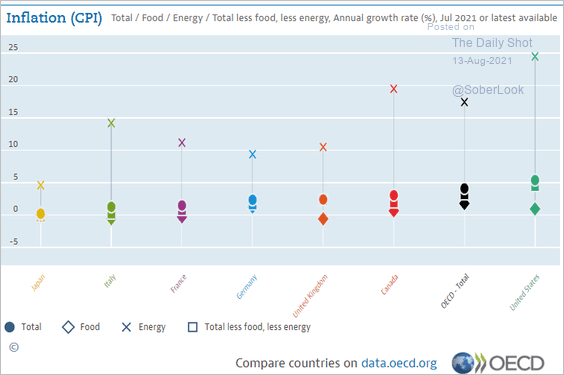 Source: OECD Read full article
——————–
Food for Thought
1. Car buyers considering an electric vehicle, by country:
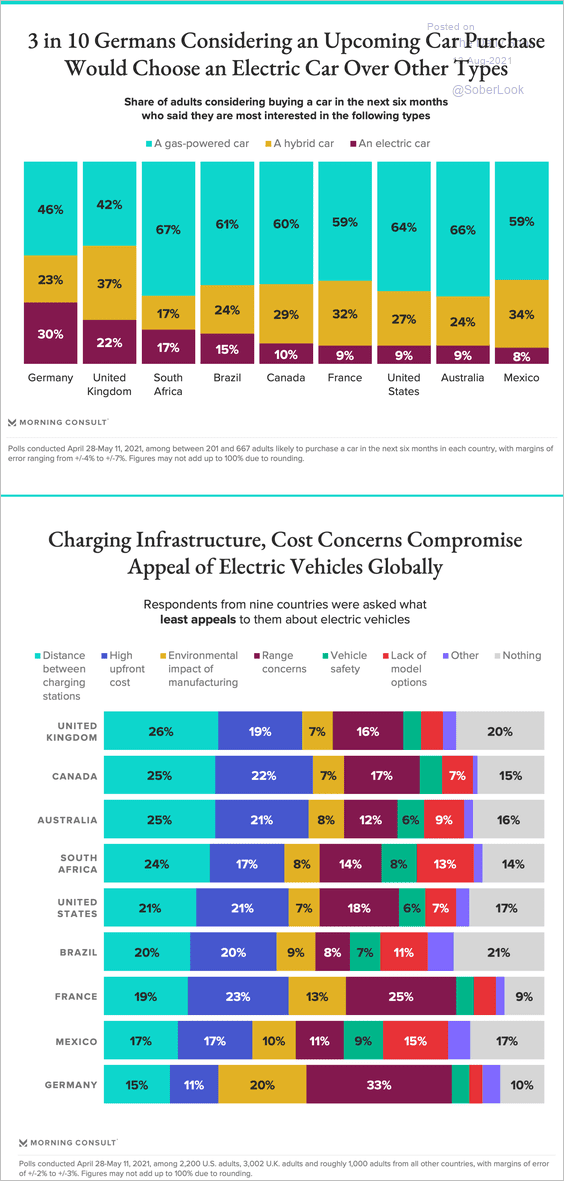 Source: Morning Consult Read full article
2. Consumer gaming revenue:
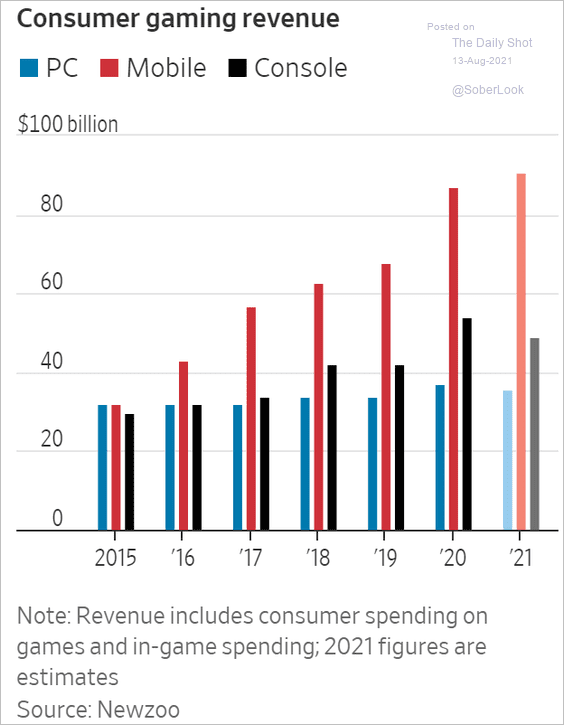 Source: @WSJ Read full article
3. US back-to-school spending:
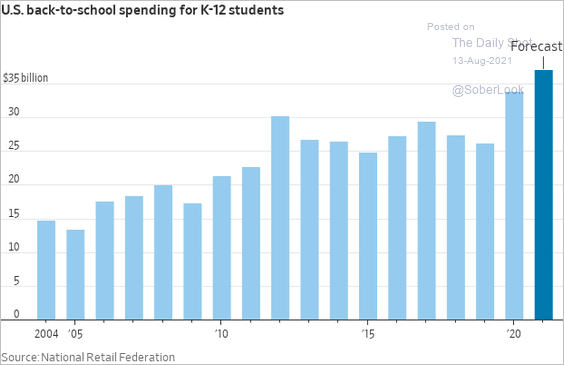 Source: @WSJ Read full article
4. COVID effect on pet stores:
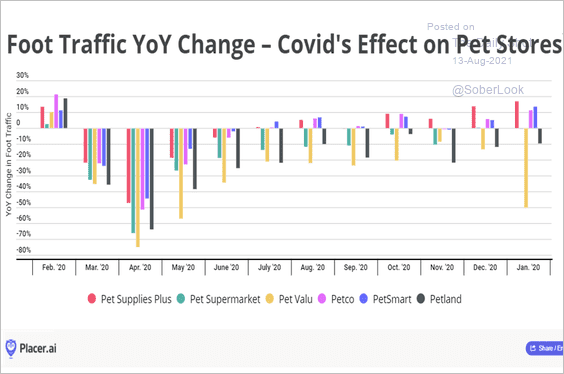 Source: Placer.ai Read full article
5. First-year analysts’ compensation at big investment banks:
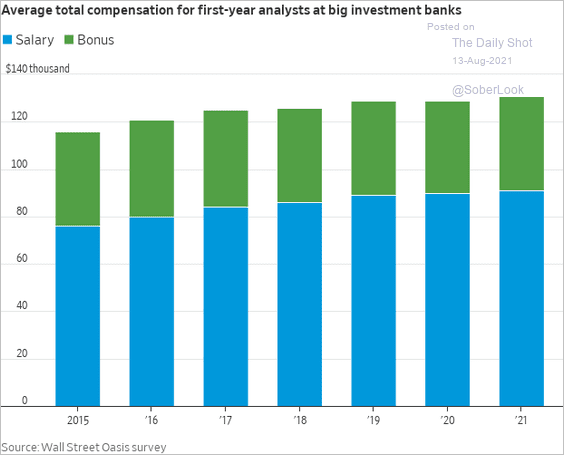 Source: @WSJ Read full article
6. Reasons for boycotting brands:
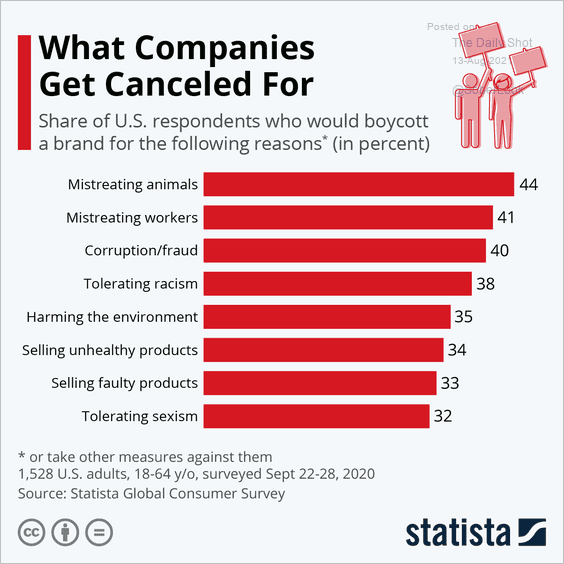 Source: Statista
7. Food insecurity:
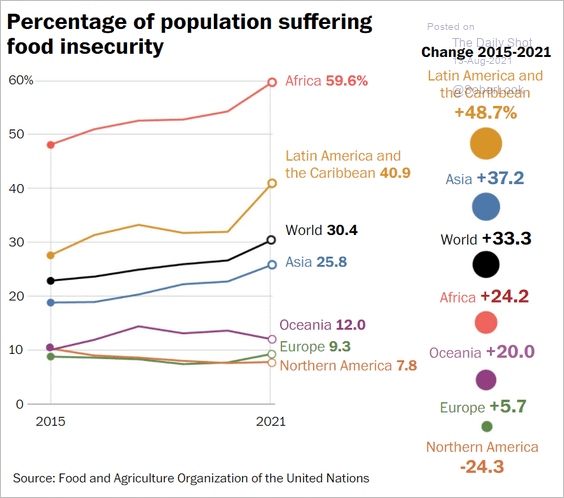 Source: The Washington Post Read full article
7. The global wealth pyramid:
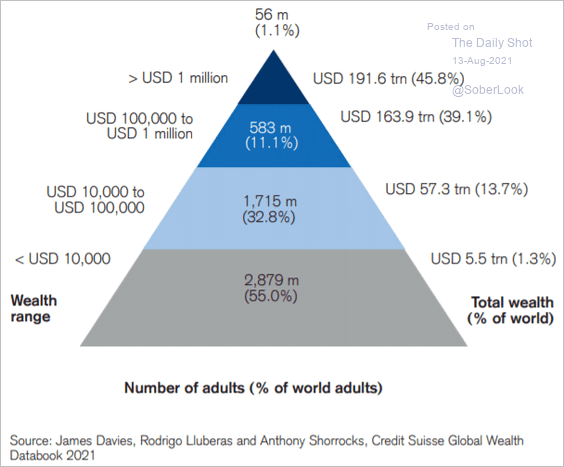 Source: Credit Suisse; @toby_n
8. Growth in US working-age population:
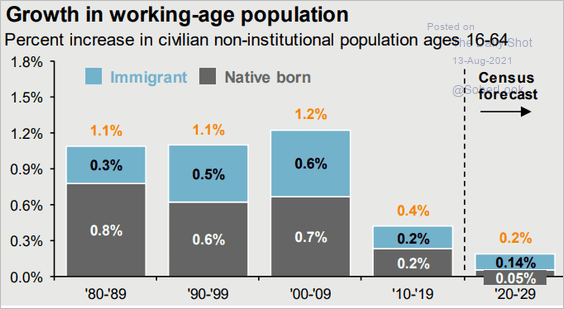 Source: @JPMorganAM
9. Global middle-class growth:
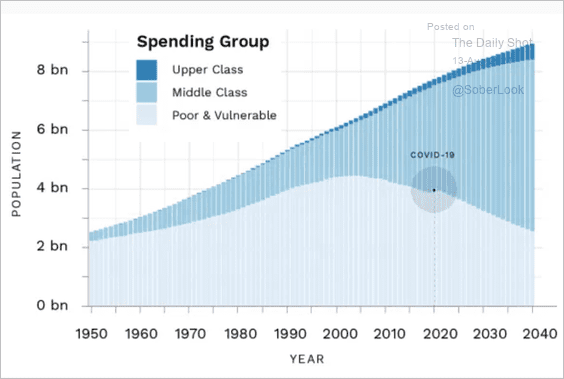 Source: Brookings Read full article
10. LGBTQ age distribution:
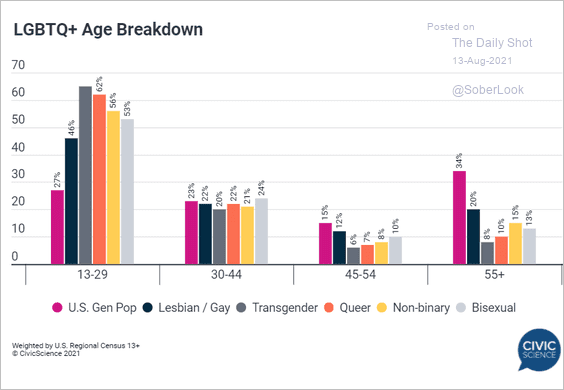 Source: @CivicScience
11. Mask mandates in schools:
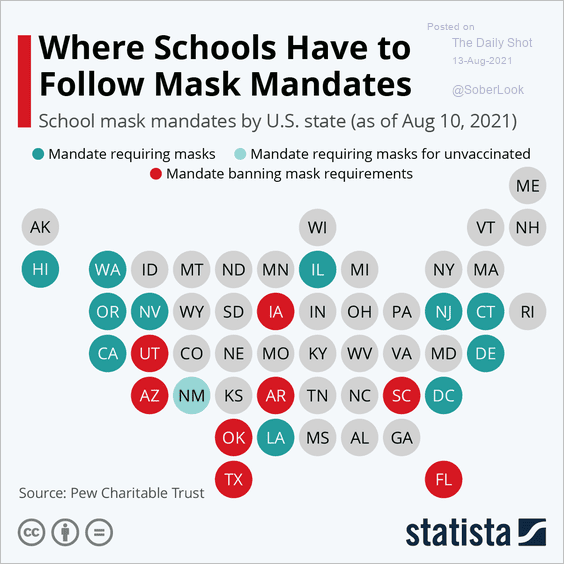 Source: Statista
12. Best in Show at Westminster:
 Source: Statista
——————–
Have a great weekend!
Back to Index