
The Daily Shot: 18-Aug-21
• The United States
• The United Kingdom
• The Eurozone
• Asia – Pacific
• China
• Emerging Markets
• Cryptocurrency
• Commodities
• Energy
• Equities
• Global Developments
• Food for Thought
The United States
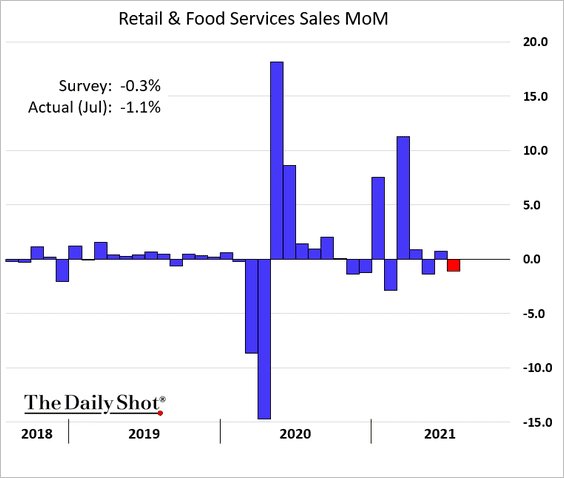
1. July retail sales were weaker than expected.
 Source: Reuters Read full article
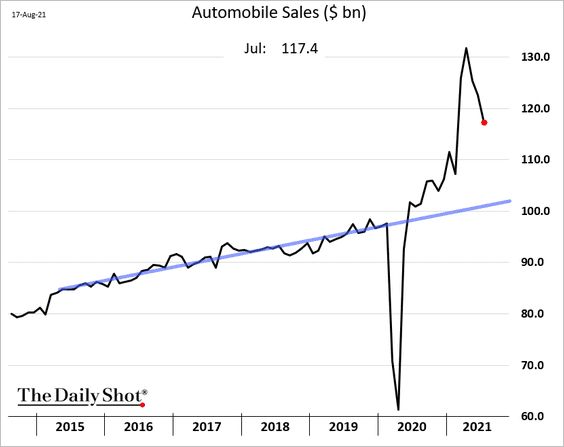
• Automobile sales declined for the third month in a row.
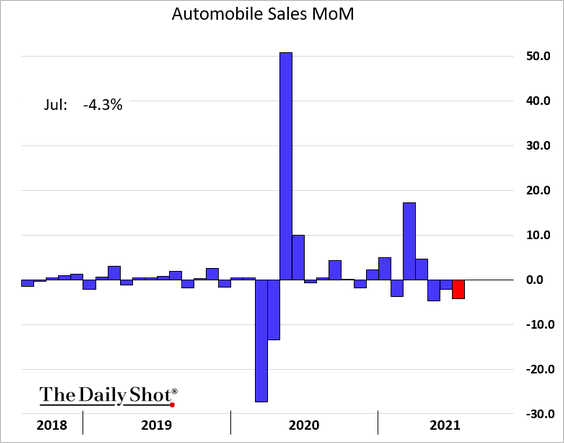
Despite the automotive sector’s challenges, sales remain well above the pre-COVID trend.
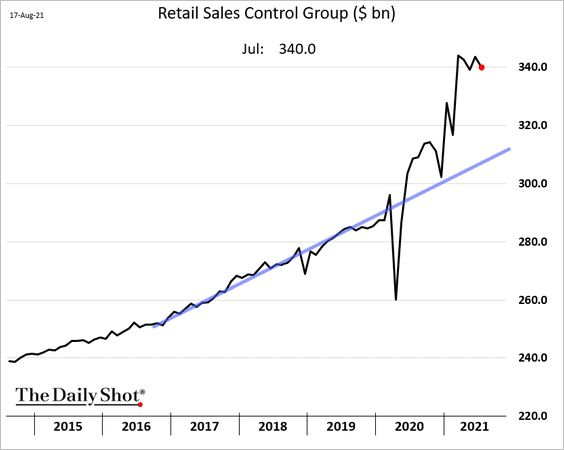
• Excluding volatile sectors, US retail sales are holding near record highs.
• Restaurant sales continued to improve despite rising pandemic concerns.
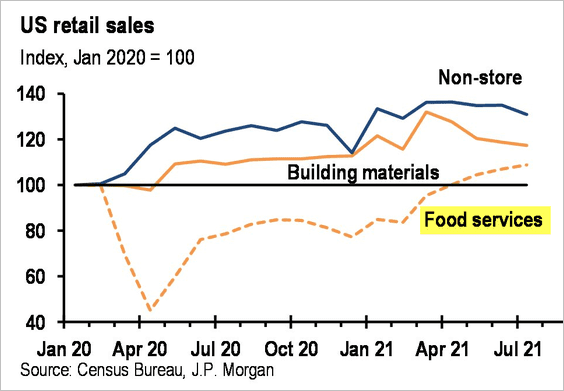
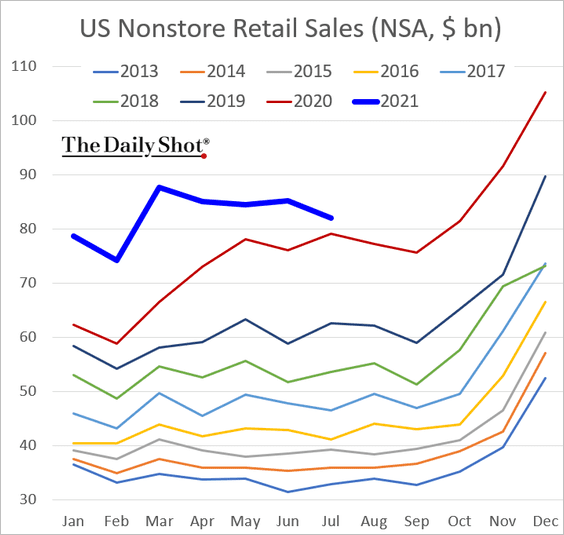
• Non-store (internet) sales have been moderating.
• This chart shows retail sales changes by sector.
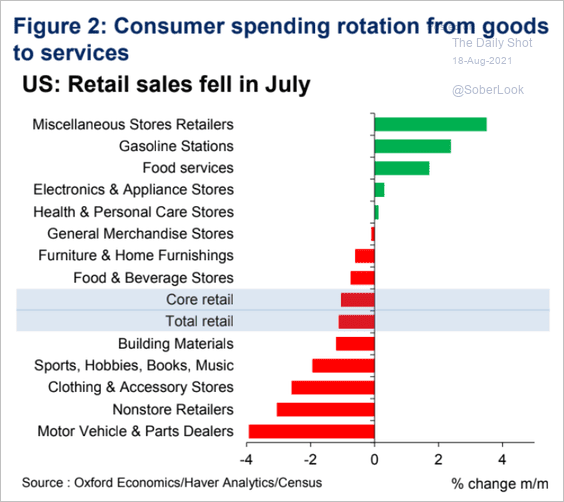 Source: Oxford Economics
——————–
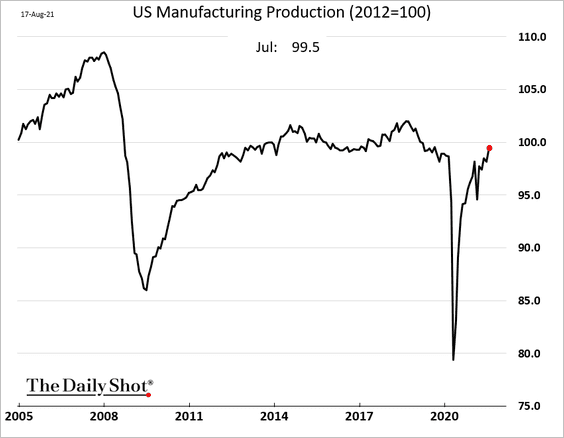
2. Industrial production topped expectations.
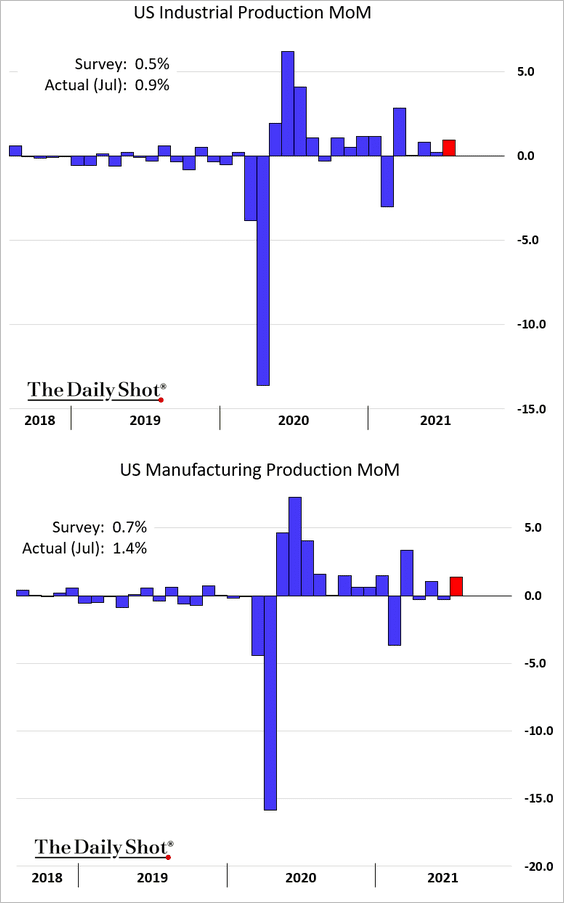
• Manufacturing output is now above pre-COVID levels.
• The report showed a jump in automobile production last month.
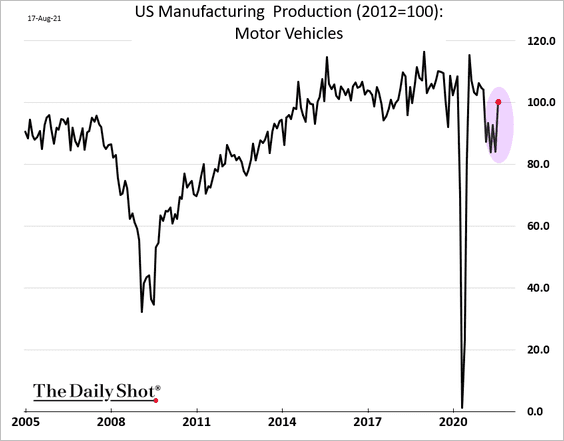
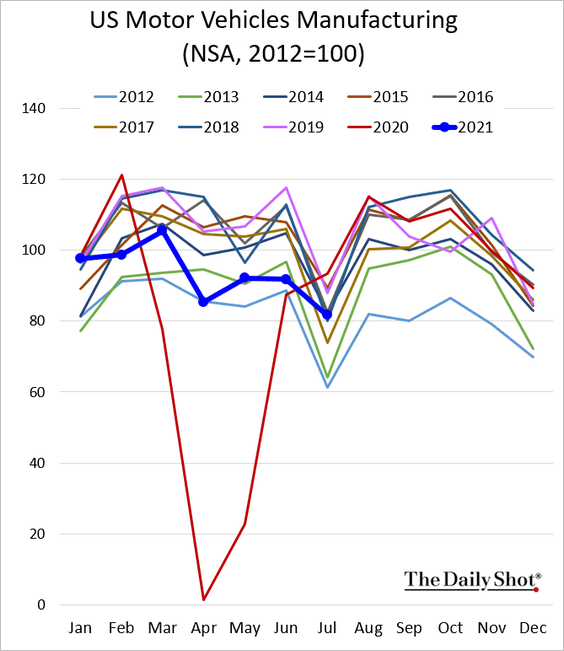
However, this increase was due to an atypical pattern for auto-plant shutdowns. Here is the index without seasonal adjustments.
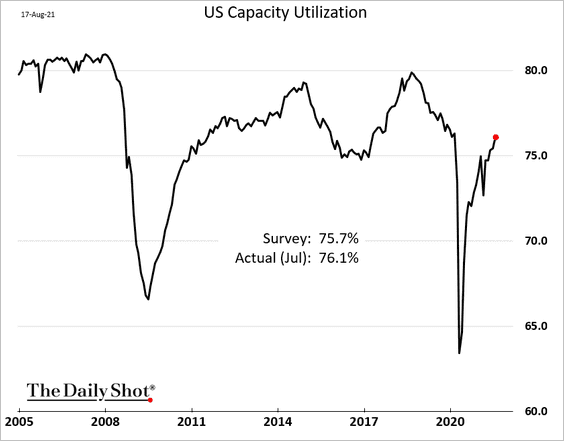
• Capacity utilization has almost fully recovered.
——————–
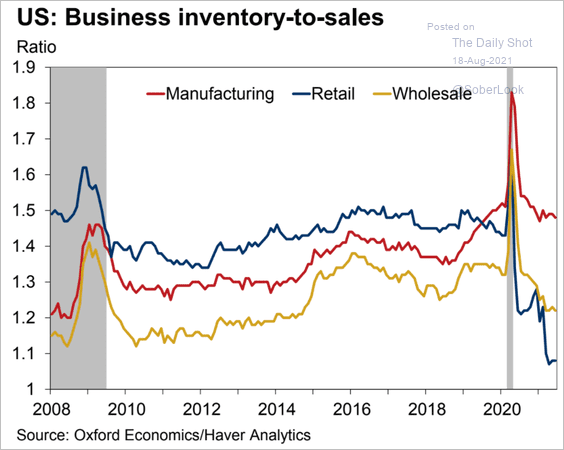
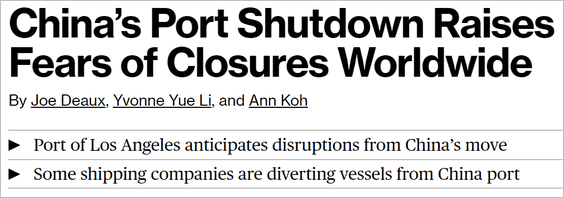
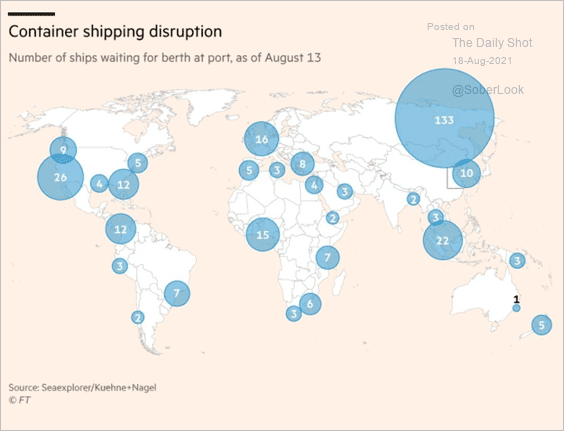
3. Inventory-to-sales ratios remain depressed due to global supply-chain challenges.
 Source: Oxford Economics
 Source: @markets Read full article
 Source: @acemaxx, @FT Read full article
——————–
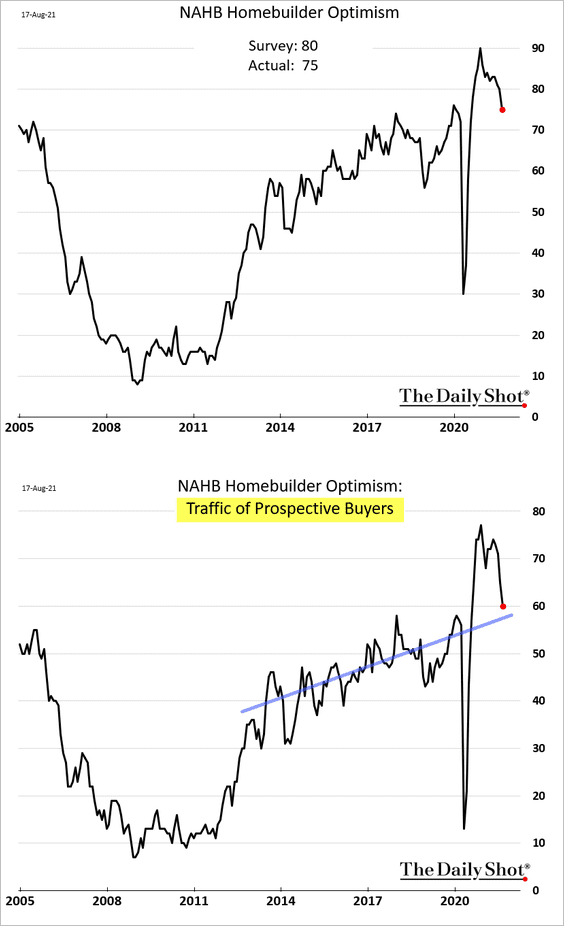
4. Next, we have some updates on housing.
• Homebuilder sentiment continues to ease as demand for new housing returns to the pre-COVID trend.
• New home sales point to moderating residential construction ahead.
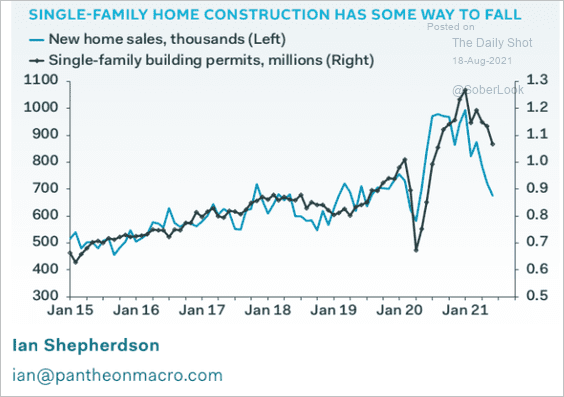 Source: Pantheon Macroeconomics
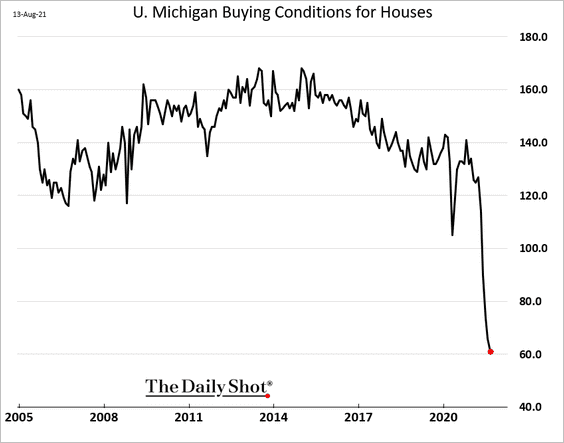
• Consumers continue to see buying conditions for houses as the worst in decades.
• Single-family housing rents are surging.
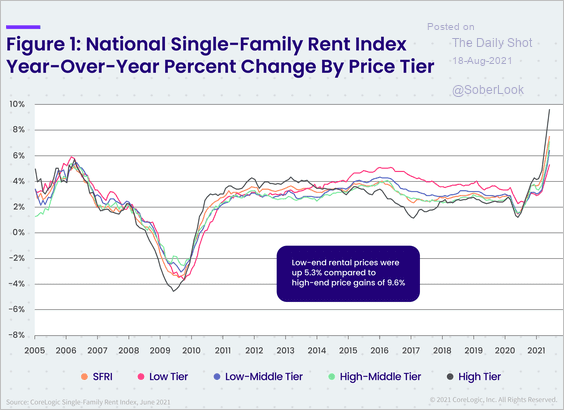 Source: CoreLogic
• This chart shows the amount of back rent owed (by the number of payments missed).
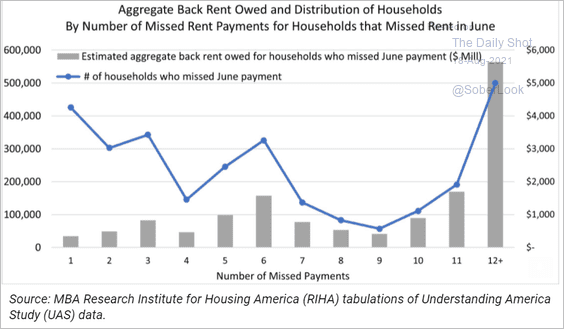 Source: Mortgage Bankers Association
• Mortgage application fraud has been on the rise.
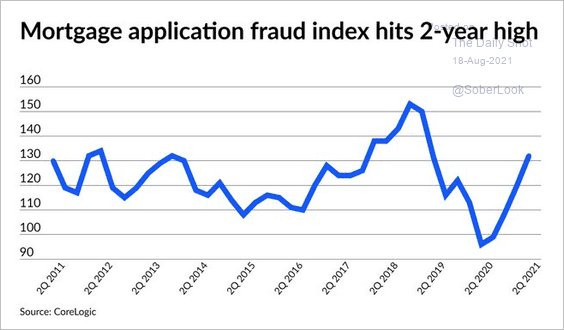 Source: @PCentopani Read full article
——————–
5. The Treasury market has been pricing in the debt ceiling risk. A technical default could occur in about three months when the US Treasury exhausts its sources of liquidity. Investors demand higher yields on T-bills maturing after that point.
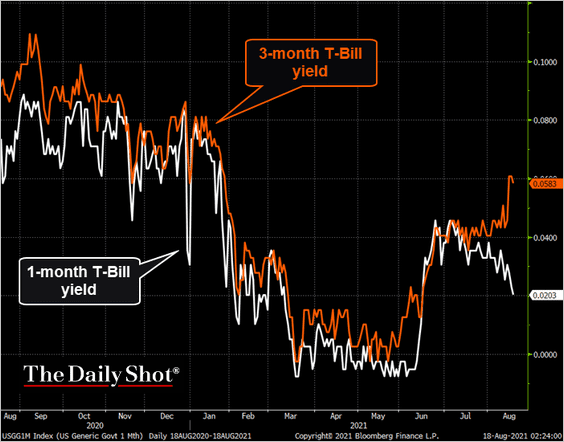 Source: @TheTerminal, Bloomberg Finance L.P.
Back to Index
The United Kingdom
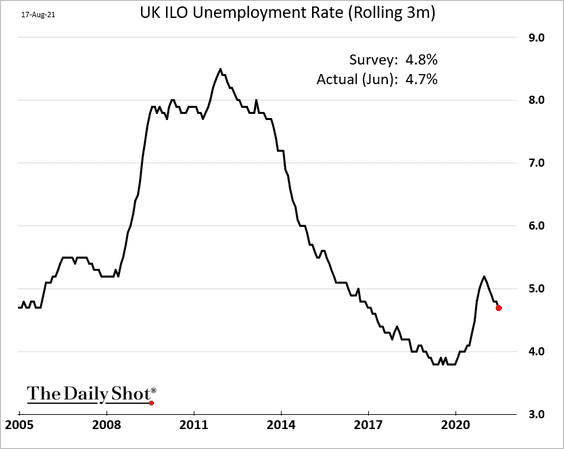
1. The labor market continues to improve.
• The unemployment rate:
• Job vacancies:
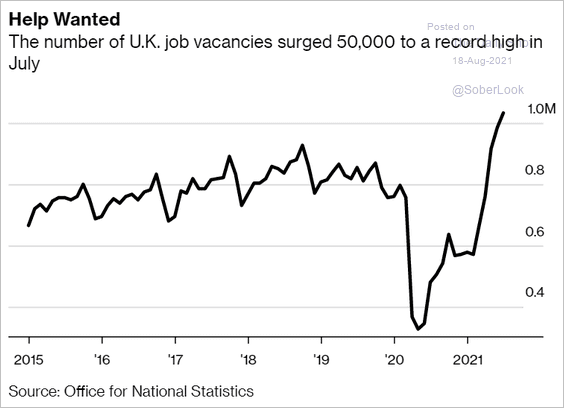 Source: Bloomberg Read full article
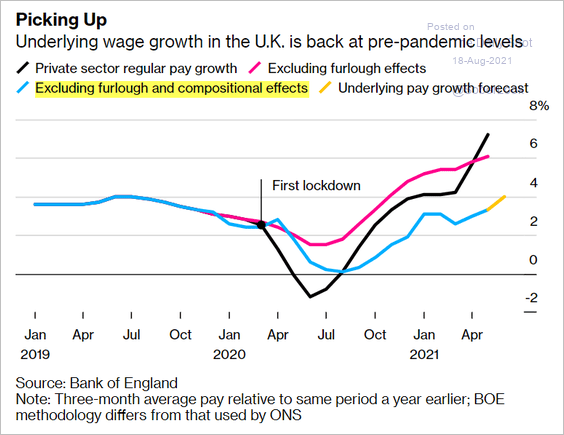
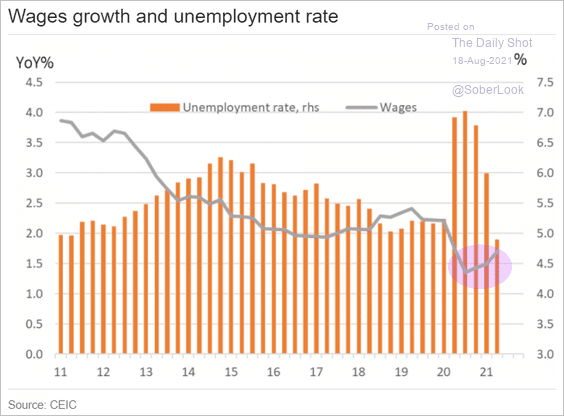
2. Wage growth is picking up momentum.
 Source: Bloomberg Read full article
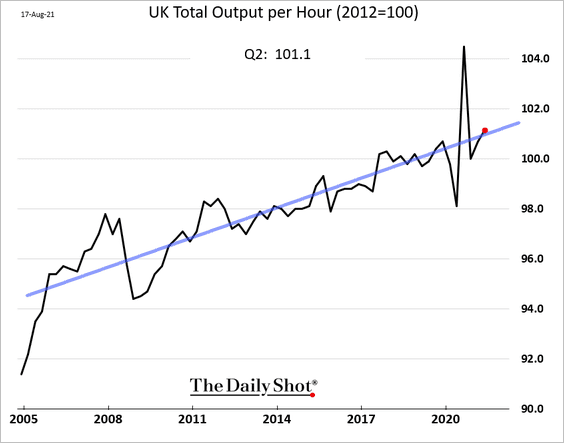
3. The trend of weak productivity improvements continues. UK productivity growth has been averaging aaround 0.42% per year (compounded).
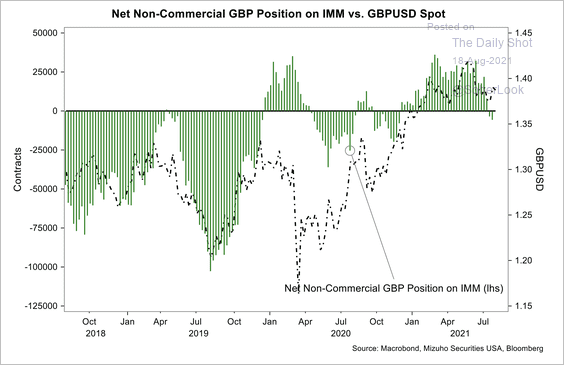
4. Speculators are net-short the pound for the first time in about a year.
 Source: Mizuho Securities USA
Back to Index
The Eurozone
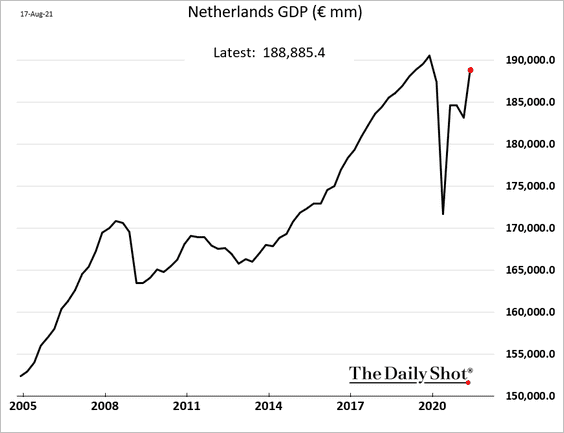
1. GDP growth in the Netherlands picked up momentum in Q2 (approaching full recovery).
Finland’s monthly GDP indicator is now above pre-COVID levels.
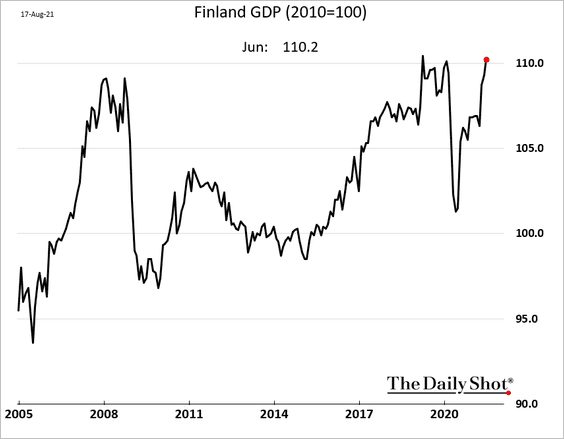
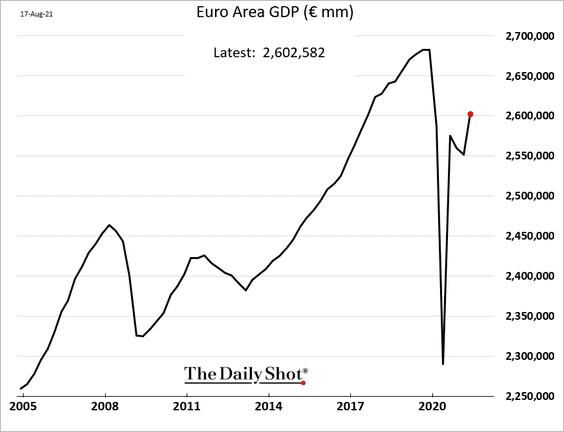
At the Eurozone level, full recovery will take some time.
——————–
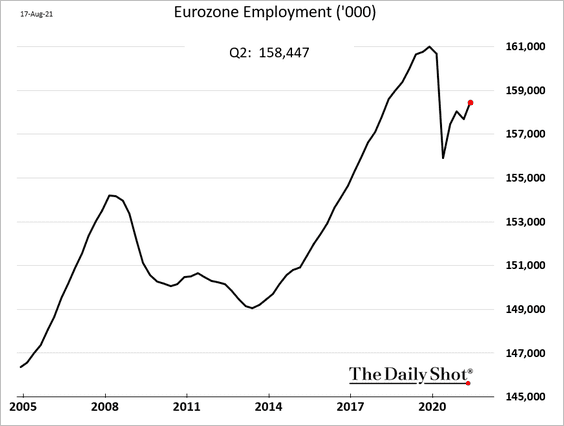
2. Employment will also take a while to recover.
3. This chart shows changes in Germany’s employment by sector.
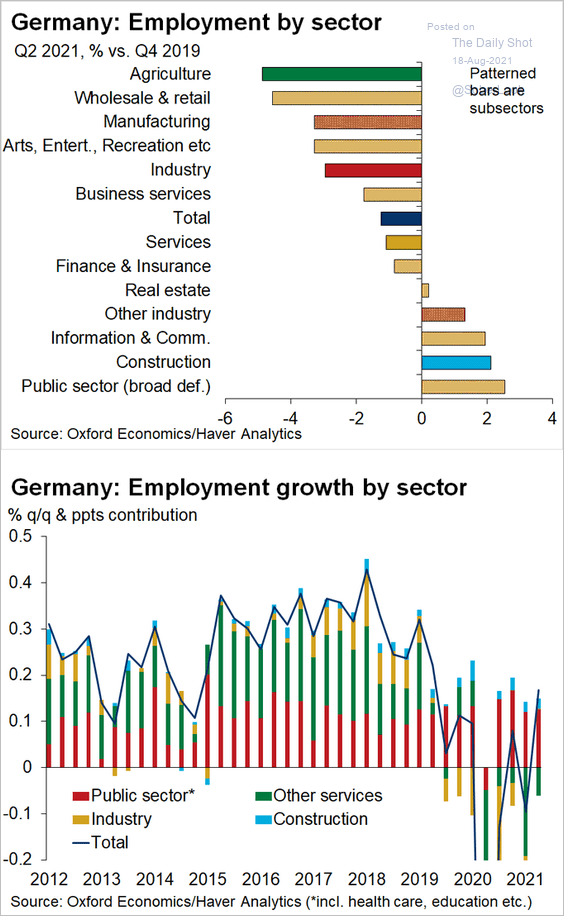 Source: @OliverRakau
4. Here is an update on new COVID cases.
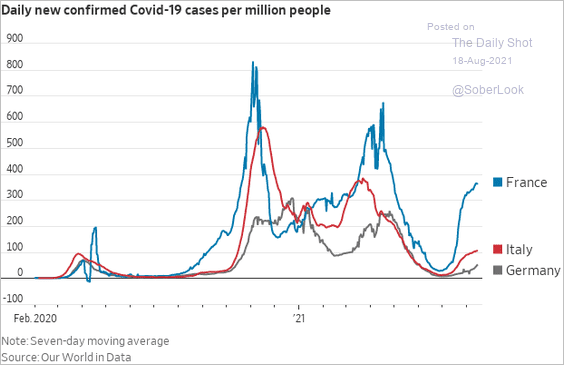 Source: @WSJ Read full article
5. There is less concern about disinflation in the markets.
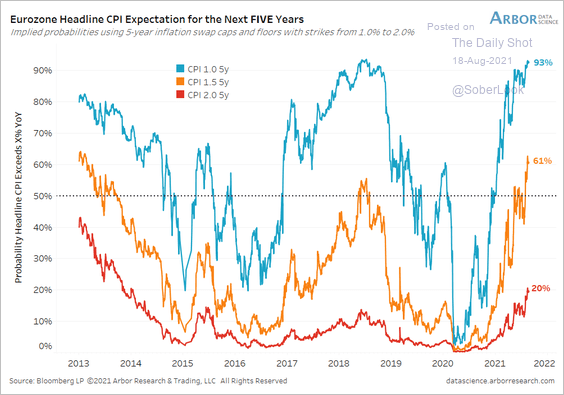 Source: Arbor Research & Trading
6. Speculators have reduced their net-long euro positions over the past year.
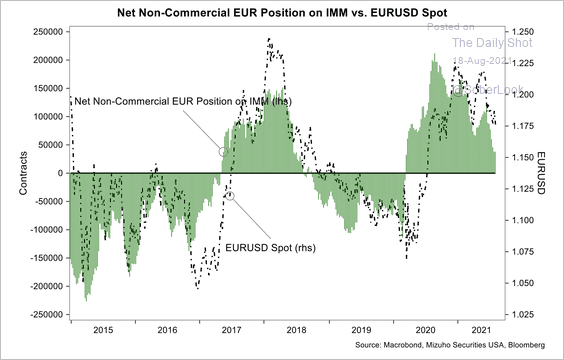 Source: Mizuho Securities USA
Back to Index
Asia – Pacific
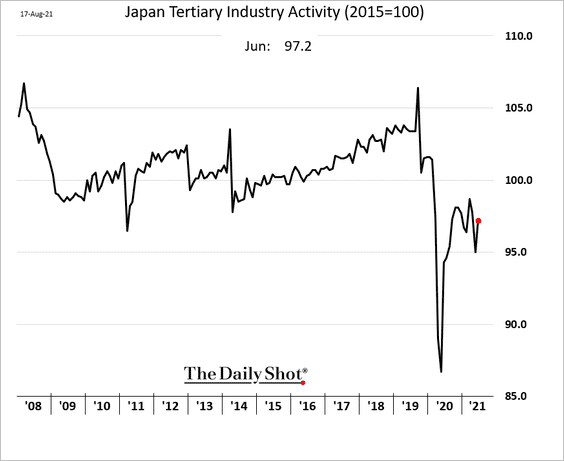
1. Japan’s exports held steady last month (an increase was expected).
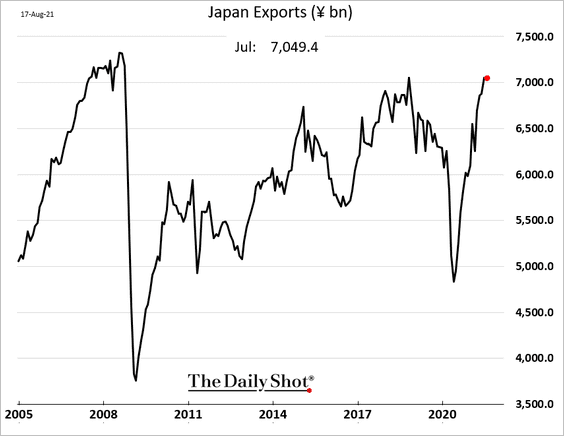
Japan’s service sector activity remains depressed.
——————–
2. The RBNZ held rates unchanged.
 Source: Reuters Read full article
But the central bank boosted its rate forecasts.
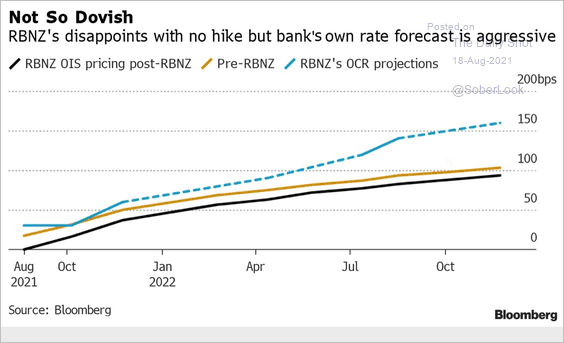 Source: @StephenSpratt
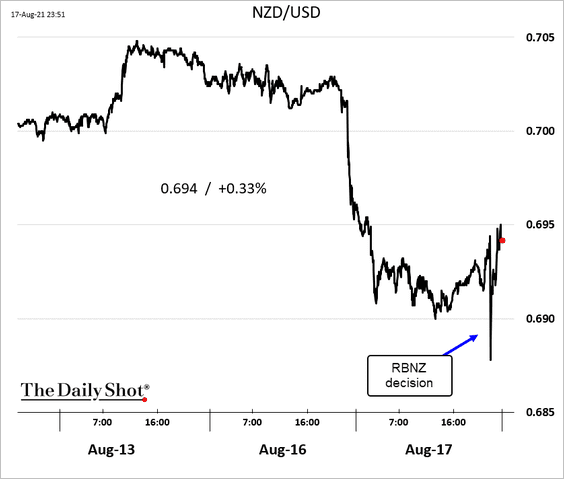
The Kiwi dollar dipped at first but rebounded as the market digested the rate projections.
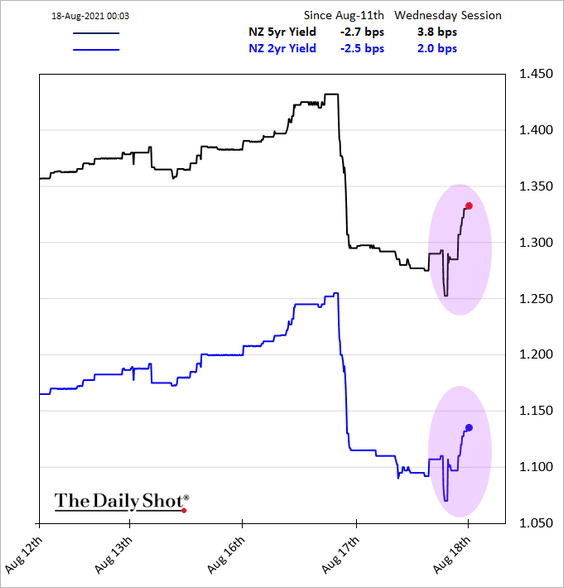
Bond yields jumped.
——————–
3. Australia’s wage growth is recovering.
 Source: ING
Back to Index
China
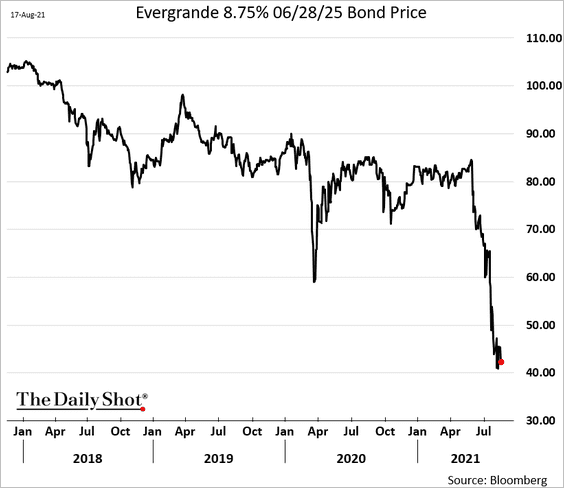
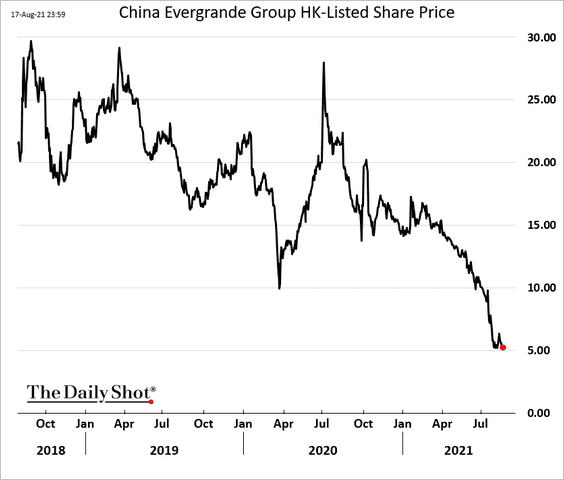
1. Investors remain concerned about the Evergrande situation.
 Source: @WSJ Read full article
– Bond price:
– Share price:
• Here is the maturity profile of the company’s debt.
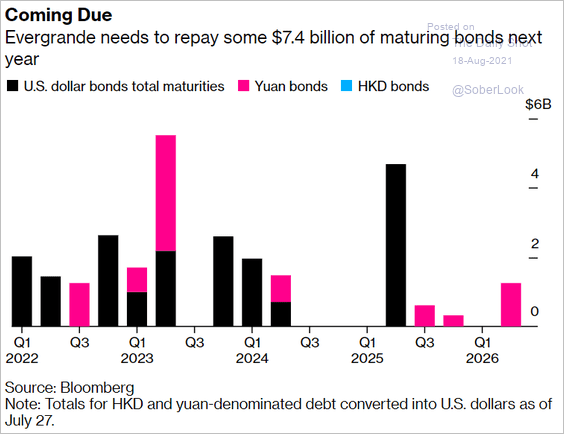 Source: @business Read full article
• This chart shows the number of China’s property bonds yielding above 10%.
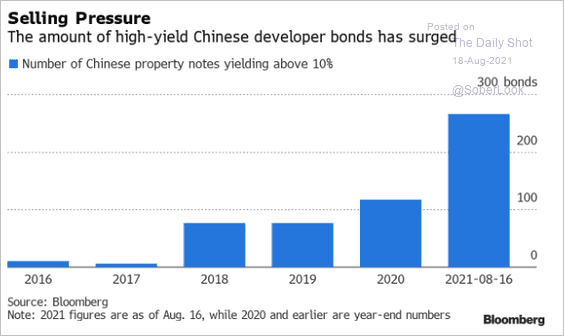 Source: @TheTerminal, Bloomberg Finance L.P.; @TradingandMore
——————–
2. Business loan demand has been moderating.
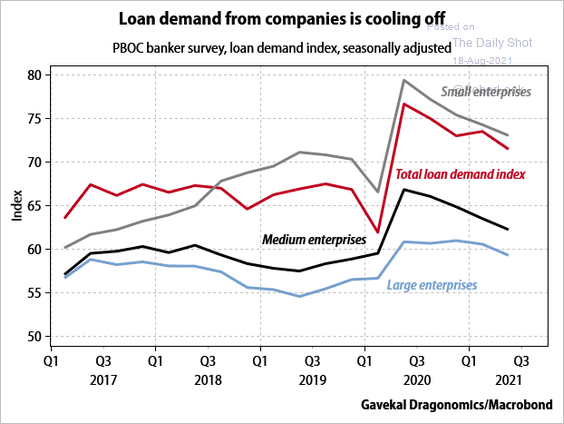 Source: Gavekal Research
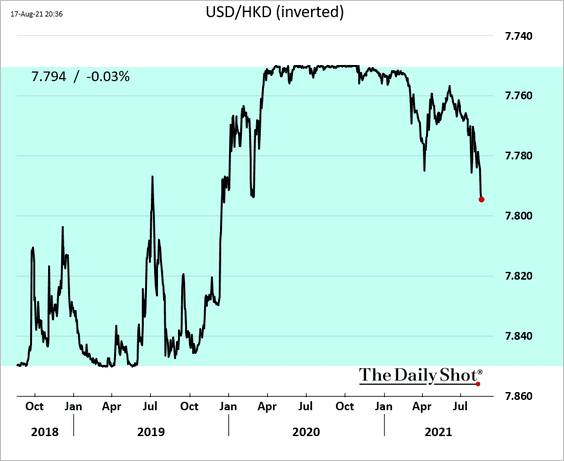
3. The Hong Kong dollar hit the weakest level since March.
Back to Index
Emerging Markets
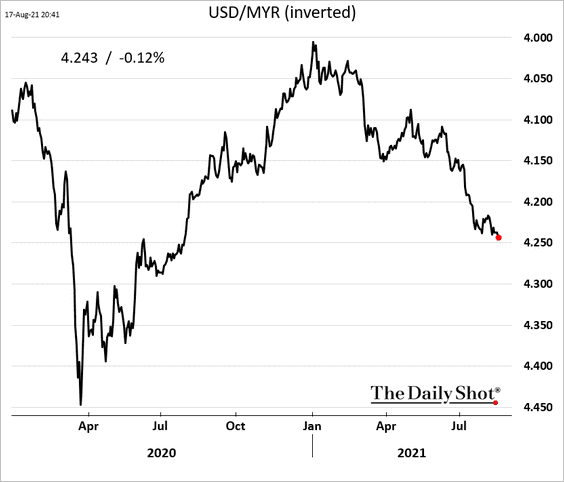
1. The Malaysian ringgit is drifting lower amid elevated COVID cases and political uncertainty.
 Source: The New York Times Read full article
——————–
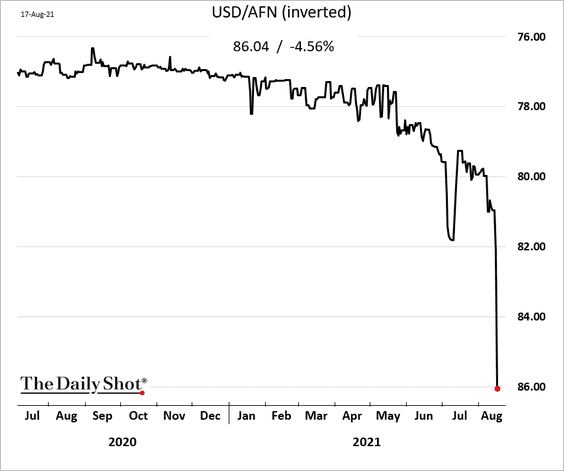
2. Afghanistan’s currency tumbled as the Taliban took control.
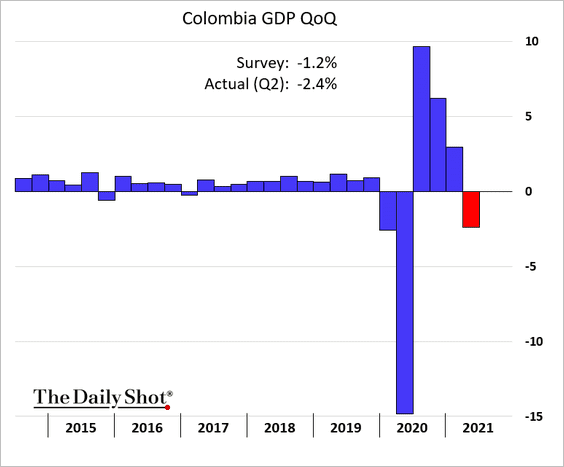
3. Colombia’s GDP declined more than expected last quarter.
Back to Index
Cryptocurrency
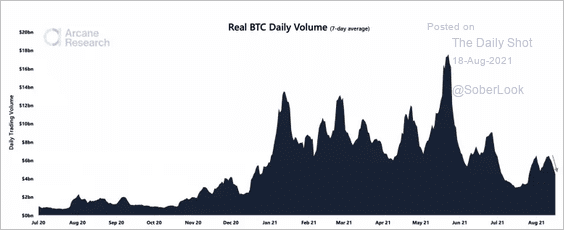
1. Bitcoin’s trading volume on spot exchanges declined over the past week as the short-squeeze rally stalled.
 Source: Arcane Research Read full article
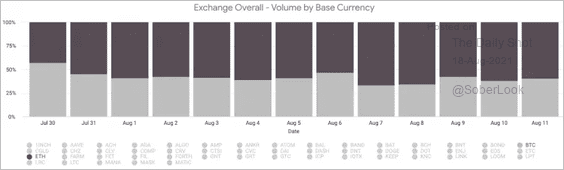
2. Ether trading volume continues to surpass bitcoin on the Coinbase exchange, with August 7 being the most extreme.
 Source: Coinbase
3. Bitcoin miners are experiencing greater revenue as blockchain’s hashrate recovers from July lows. The hashrate refers to the total combined computational power that is being used to mine and process transactions.
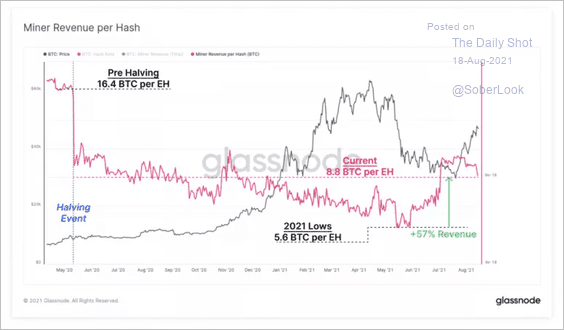 Source: Glassnode Read full article
4. The slowdown in global money supply growth could weigh on bitcoin.
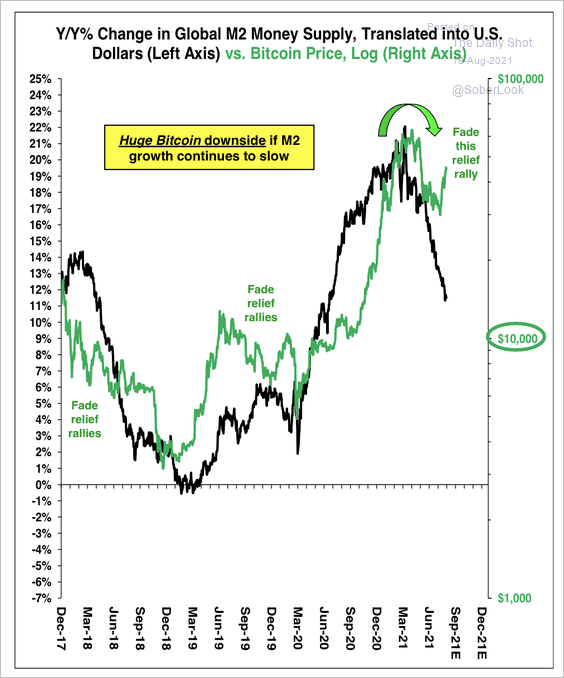 Source: Stifel
Back to Index
Commodities
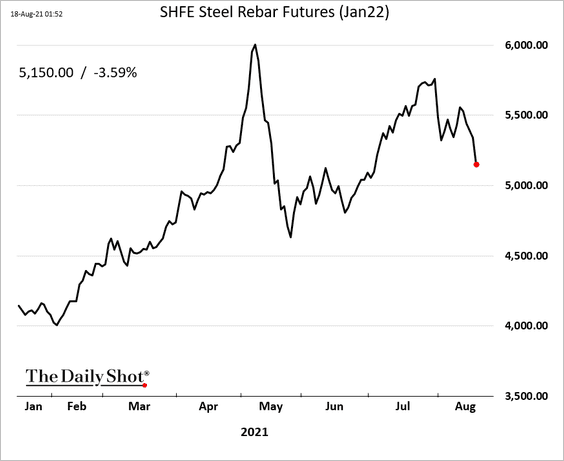
1. Iron ore prices continue to fall.
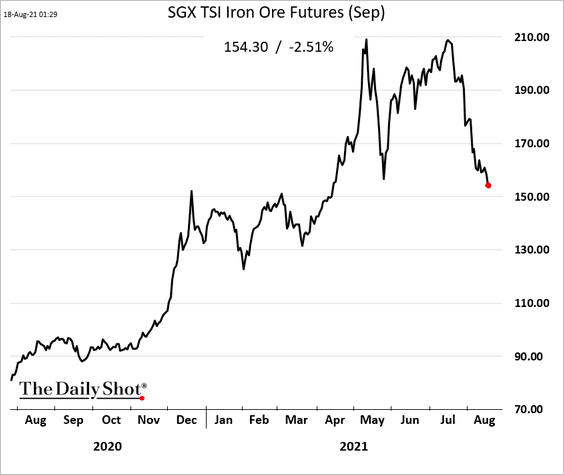
Steel prices in Shanghai are also weaker.
——————–
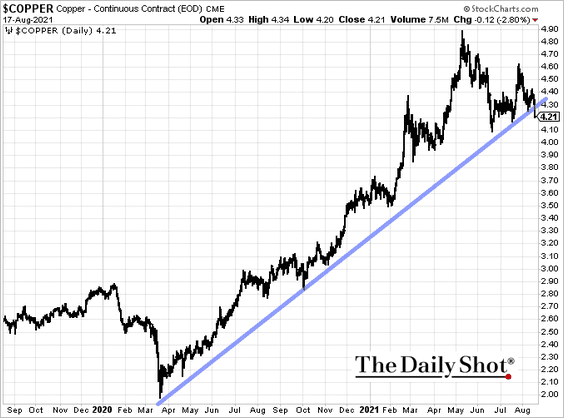
2. Copper is testing support.
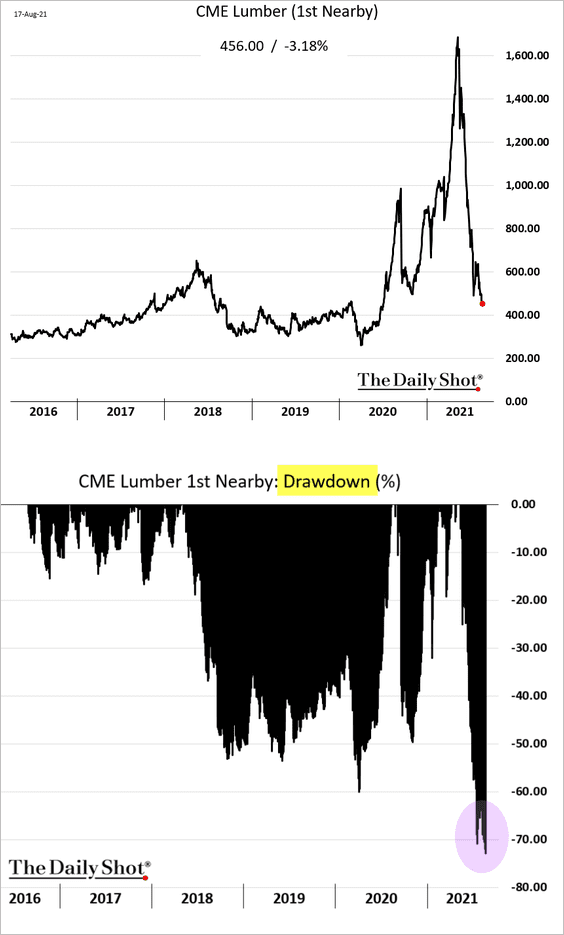
3. The drawdown in US lumber futures has exceeded 70%.
4. Will commodities enter a trading range?
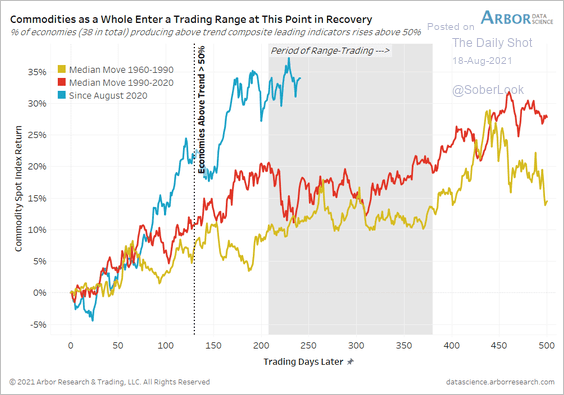 Source: Arbor Research & Trading
Back to Index
Energy
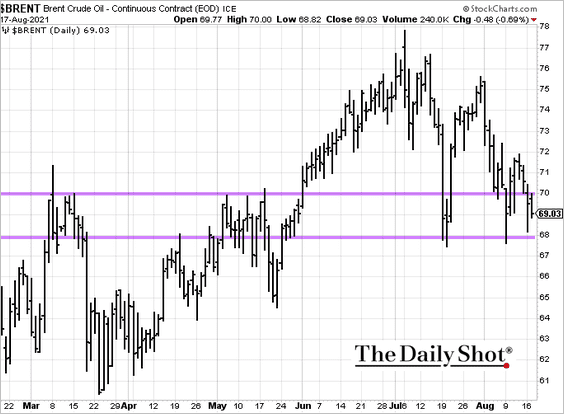
1. Brent is holding below $70/bbl.
2. Energy shares have been flat relative to the broader market despite higher oil prices.
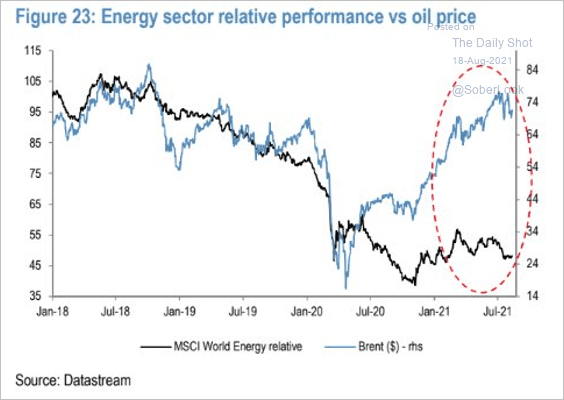 Source: JP Morgan; @Saburgs
3. These charts show Saudi oil production, exports, rig counts, and inventory.
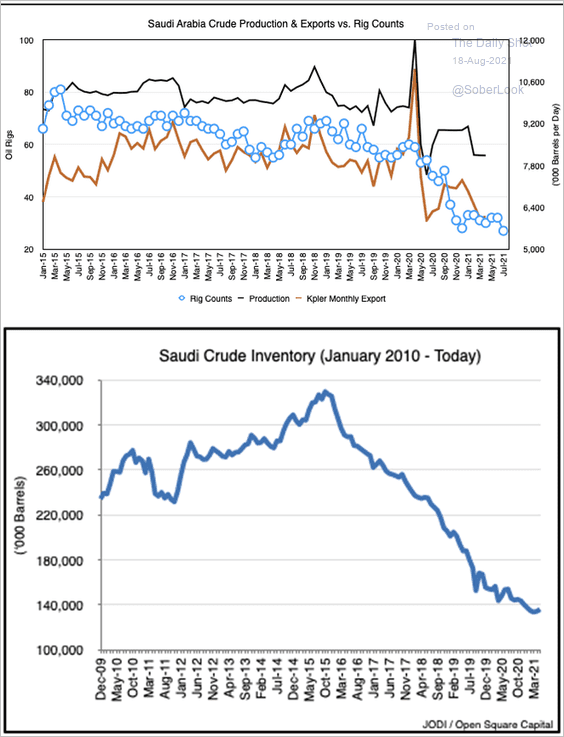 Source: @OpenSquareCap
4. Global oil inventories continue to shrink.
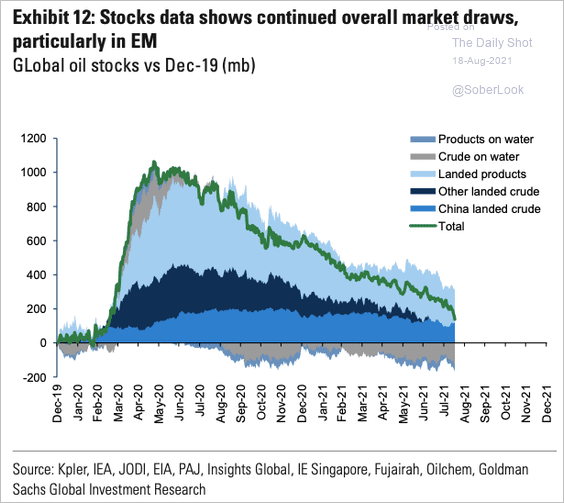 Source: Goldman Sachs; @OpenSquareCap
Back to Index
Equities
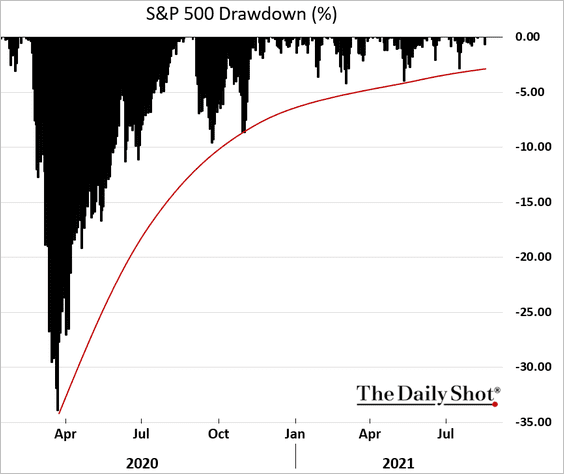
1. S&P 500 drawdowns continue to get smaller as dip-buying becomes a habit.
2. Scotiabank sees the S&P 500 finishing the year up 22%, but next year’s gains will be much smaller.
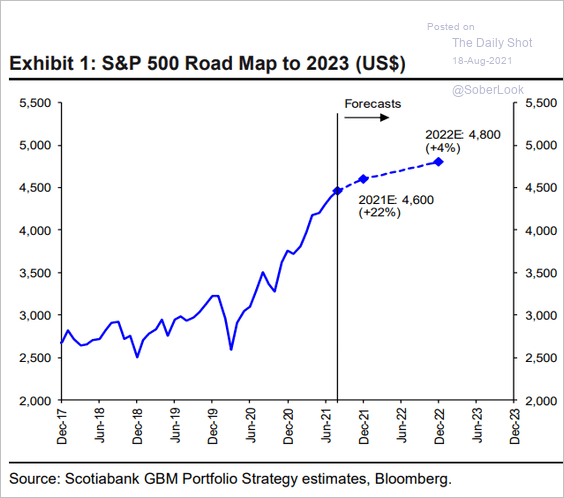 Source: Hugo Ste-Marie, Portfolio & Quantitative Strategy Global Equity Research, Scotia Capital
3. What do US companies see as the greatest threats to sales?
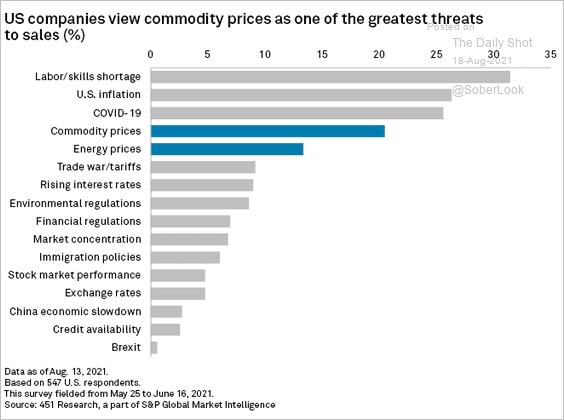 Source: S&P Global Market Intelligence
4. Earnings growth drove stock gains around the world this year.
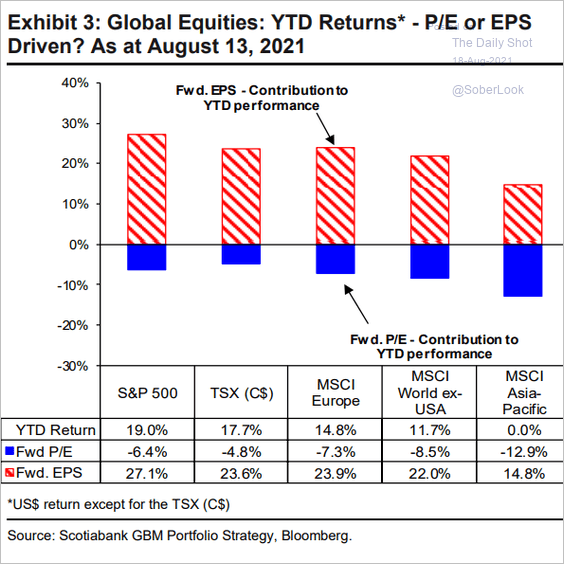 Source: Hugo Ste-Marie, Portfolio & Quantitative Strategy Global Equity Research, Scotia Capital
5. Goldman’s sentiment indicator suggests that equity positioning is not stretched.
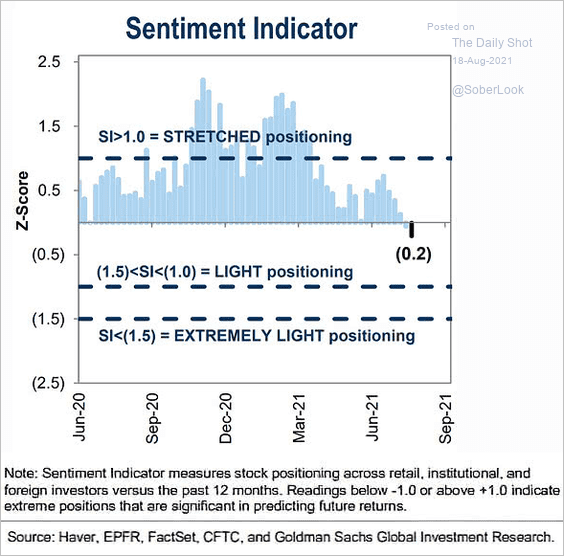 Source: @ISABELNET_SA
6. Cyclical stocks are testing resistance relative to defensive stocks.
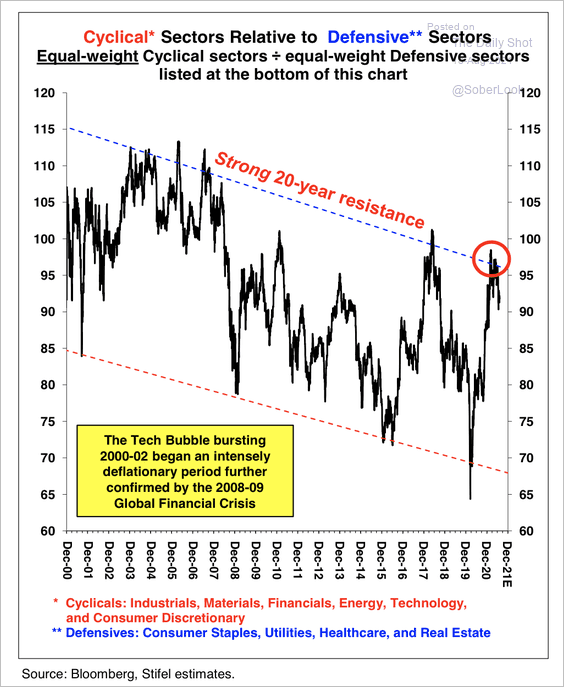 Source: Stifel
7. Next, we have some updates on the tech sector.
• The most crowded trade (according to fund managers):
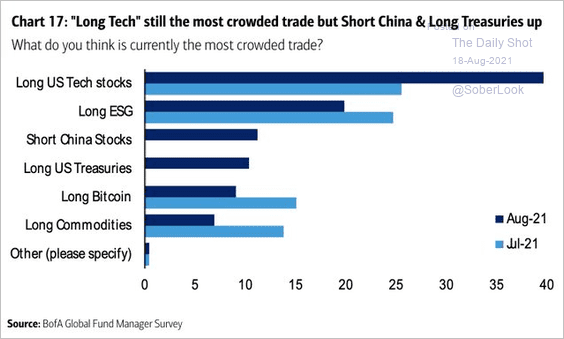 Source: BofA Global Research
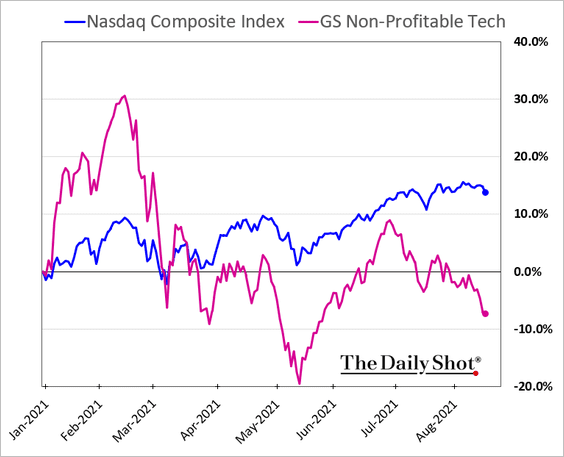
• Non-profitable tech relative performance:
• Tech’s relative earnings (weakening despite rising valuations):
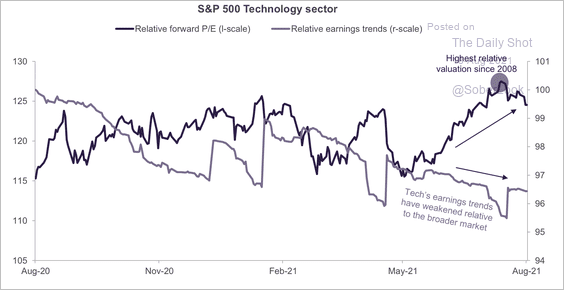 Source: Truist Advisory Services
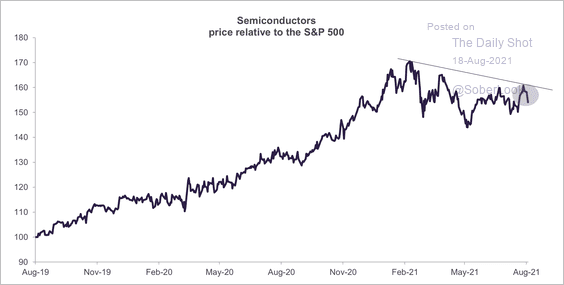
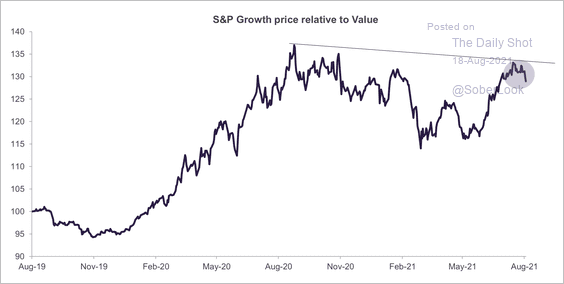
• Tech, semiconductors, and growth/value are all testing resistance relative to the S&P 500 (3 charts).
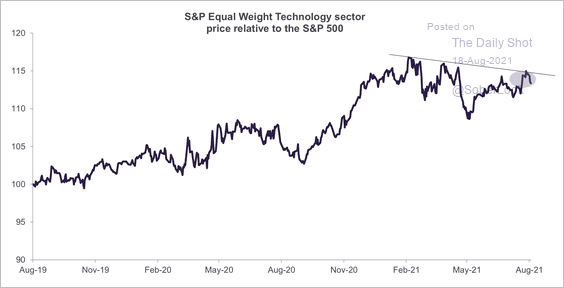 Source: Truist Advisory Services
 Source: Truist Advisory Services
 Source: Truist Advisory Services
——————–
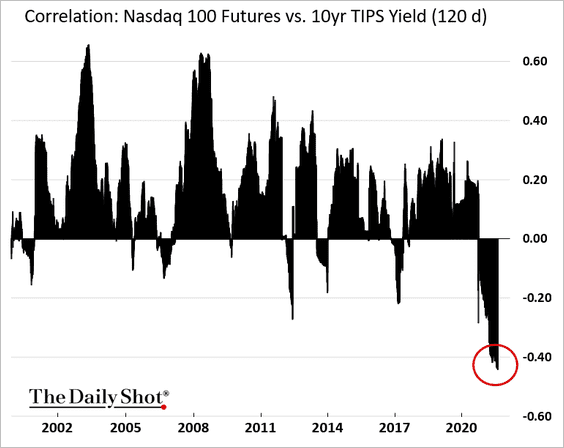
8. The Nasdaq 100 remains highly exposed to rising real yields.
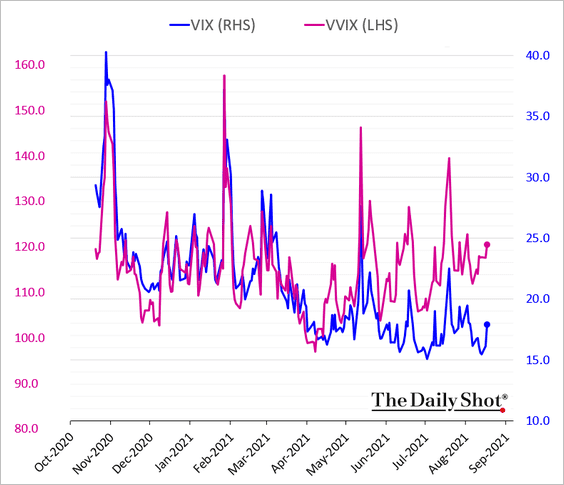
9. VVIX (vol of vol) remains elevated relative to VIX (due to high demand for VIX call options).
Back to Index
Global Developments
1. Currency traders are not concerned about large market moves, with tail risk priced at the lowest level since 2007.
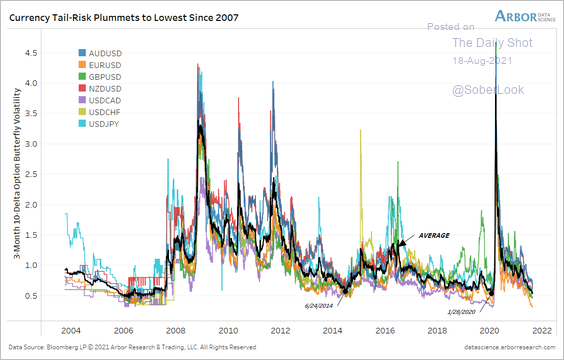 Source: Arbor Research & Trading
2. What do fund managers see as the biggest tail risk?
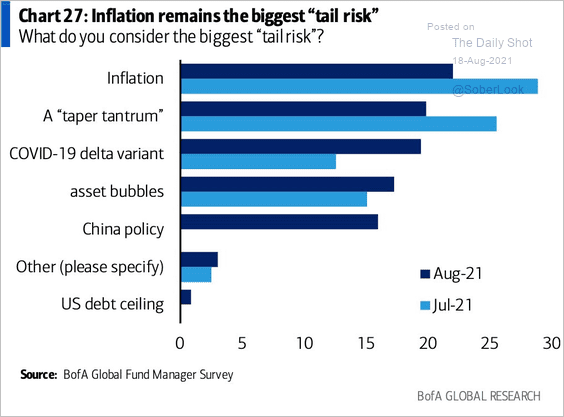 Source: BofA Global Research
3. The Citi G10 economic surprise index hit the lowest level in over a year.
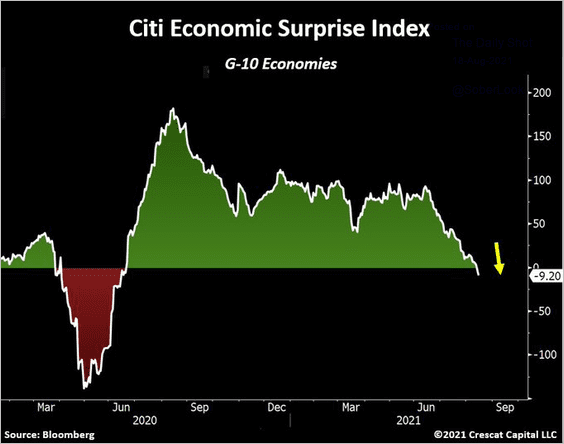 Source: @TaviCosta
4. Global economic momentum is starting to slow (2 charts).
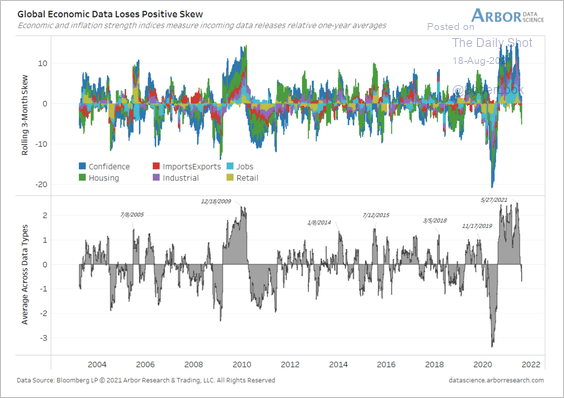 Source: Arbor Research & Trading
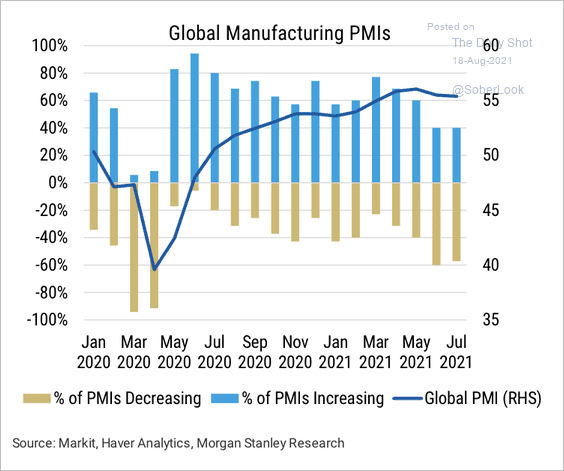 Source: Morgan Stanley Research
——————–
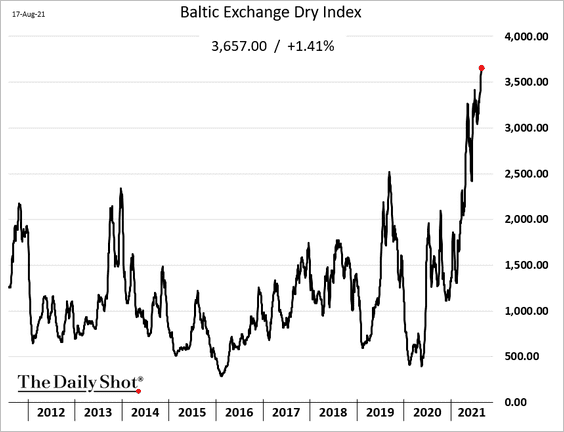
5. Dry bulk shipping costs continue to surge.
——————–
Food for Thought
1. US department store visits relative to 2019:
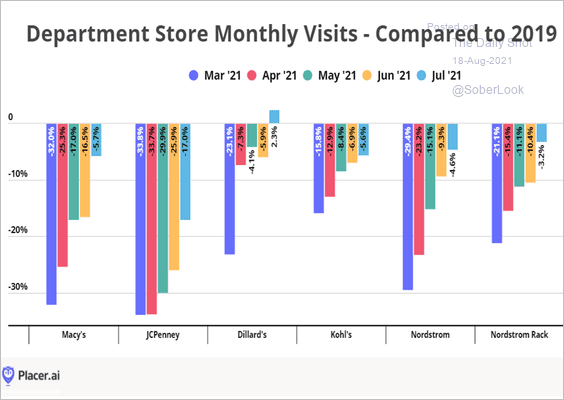 Source: Placer.ai
2. Cash vs. plastic:
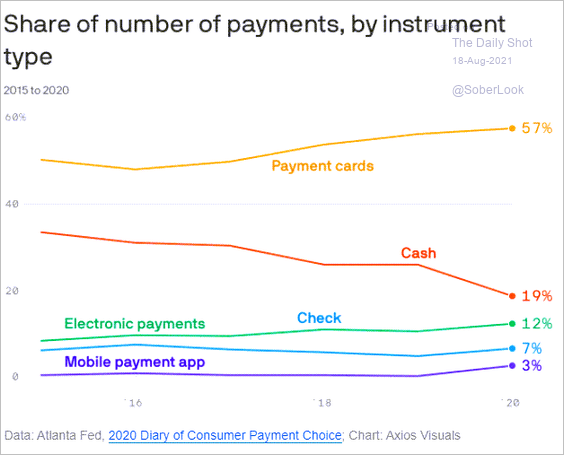 Source: @axios Read full article
3. US imports of European cheese:
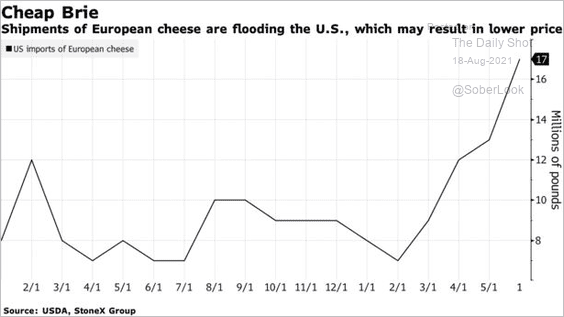 Source: Bloomberg Read full article
4. Expected increases in UHNW investable wealth:
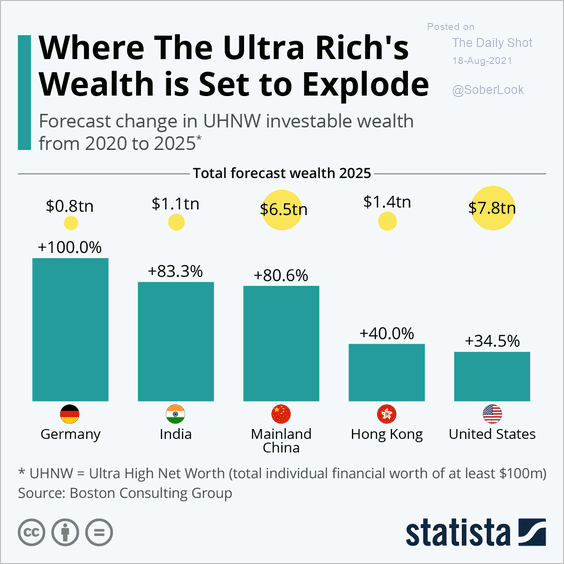 Source: Statista
5. Global chip demand by sector revenue:
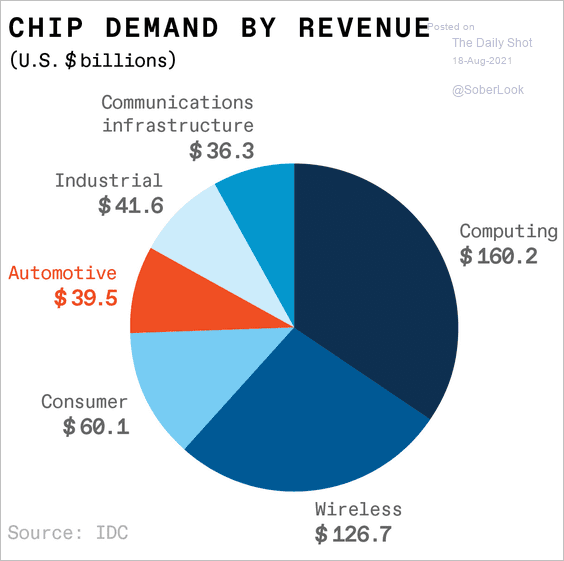 Source: IEEE Read full article
6. Marketing dollars earned by baseball stars:
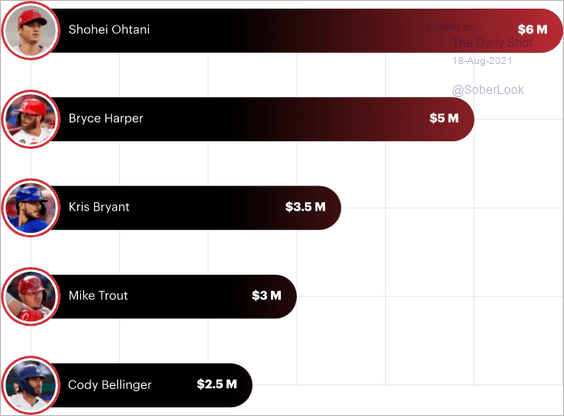 Source: Forbes Read full article
7. Afghanistan’s terrorism/violence indices:
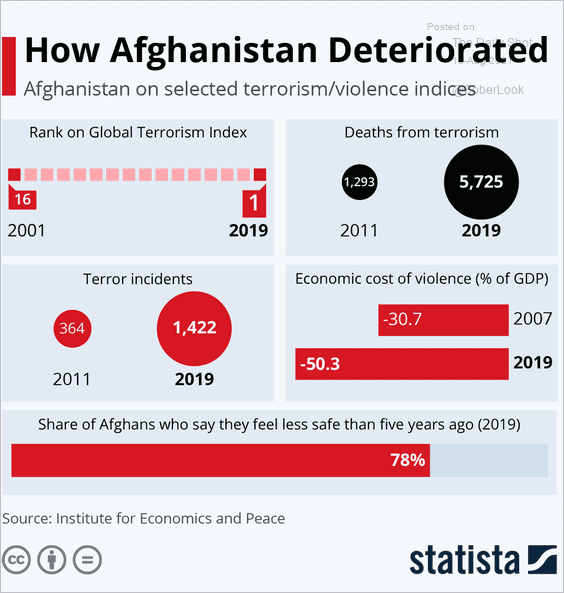 Source: Statista
8. President Biden’s approval ratings:
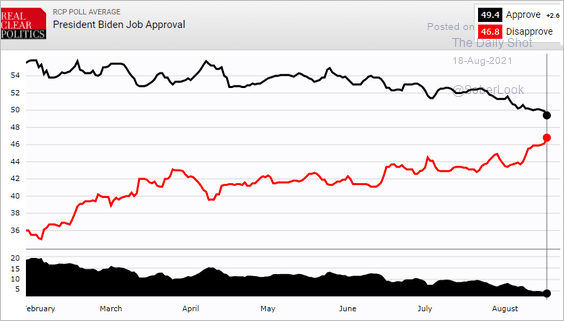 Source: RealClearPolitics
9. US vs. UK COVID hospitalizations and deaths:
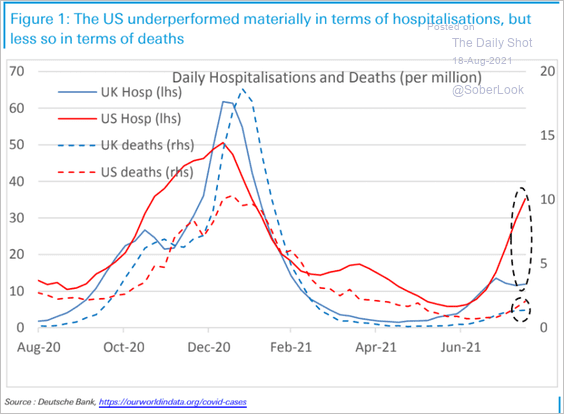 Source: Deutsche Bank Research
10. Near-Earth asteroids:
 Source: Statista
——————–
Back to Index