
The Daily Shot: 25-Aug-21
• The United States
• The United Kingdom
• The Eurozone
• Asia – Pacific
• China
• Emerging Markets
• Cryptocurrency
• Commodities
• Energy
• Equities
• Alternatives
• Credit
• Rates
• Global Developments
• Food for Thought
The United States
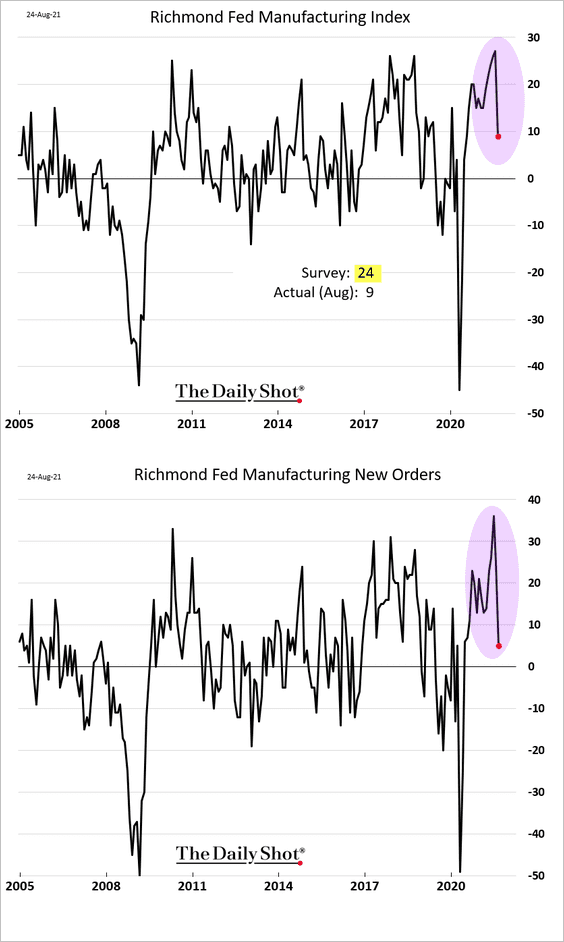
1. The Richmond Fed’s manufacturing index tumbled in August as order growth slowed. The map below shows the Richmond Fed’s district.
 Source: Wikimedia
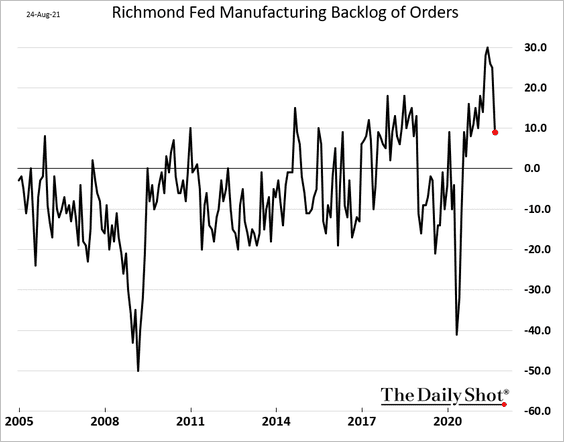
• Order backlog is easing.
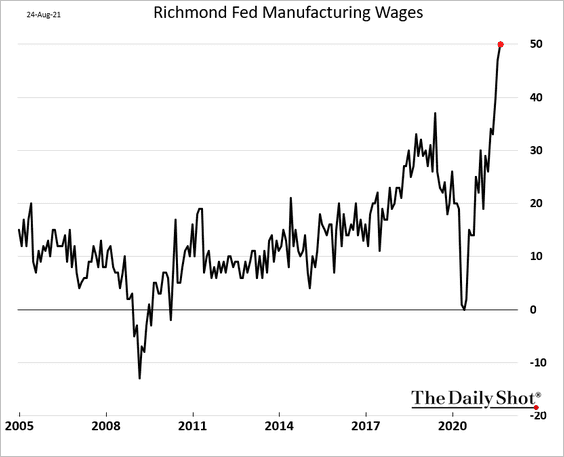
• Factories continue to boost wages at an accelerated pace.
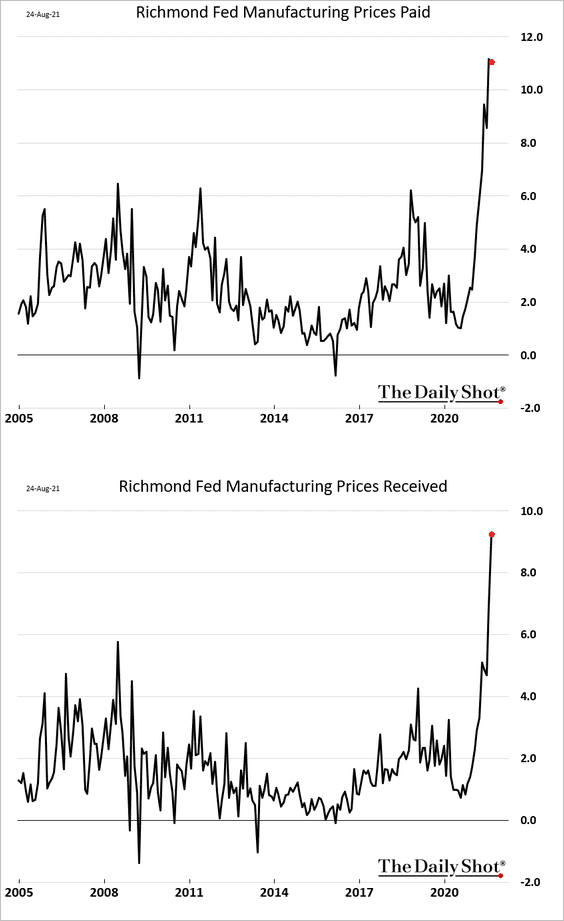
• Price pressures persist, with companies passing on some of the increased costs to their clients.
——————–
2. China’s manufacturing growth tends to lead the US, with the PMI index pointing to further moderation in US factory activity.
 Source: Pantheon Macroeconomics
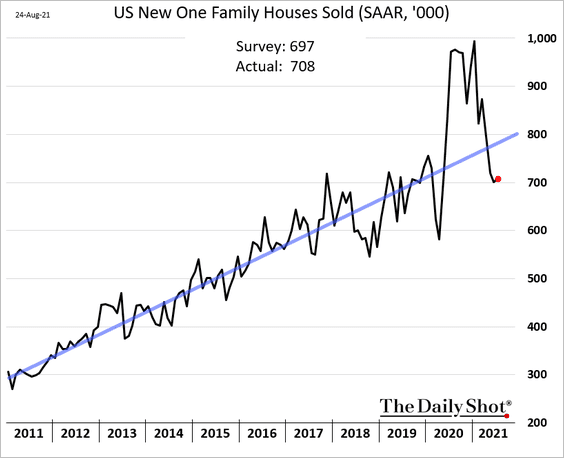
3. New home sales are back above 2019 levels.
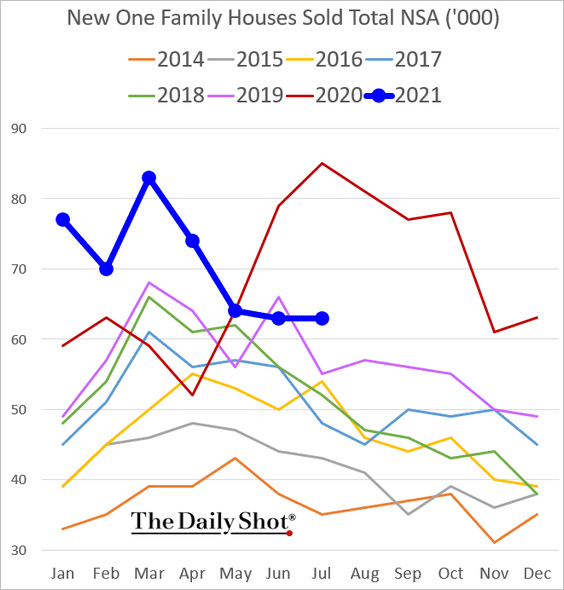
• Sales are below trend on a seasonally adjusted basis.
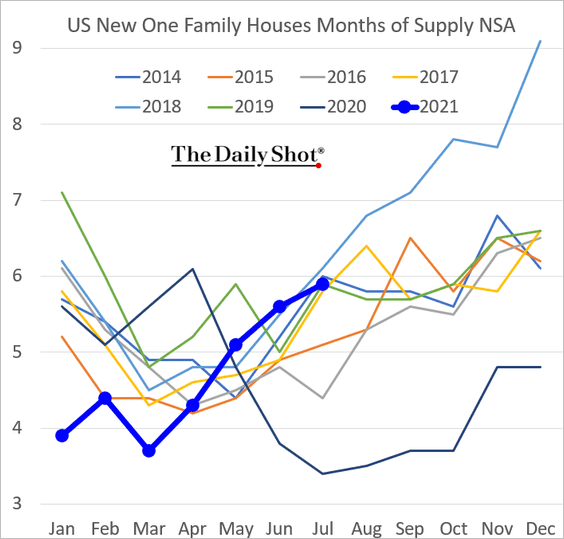
• Inventories of new homes have been rising.
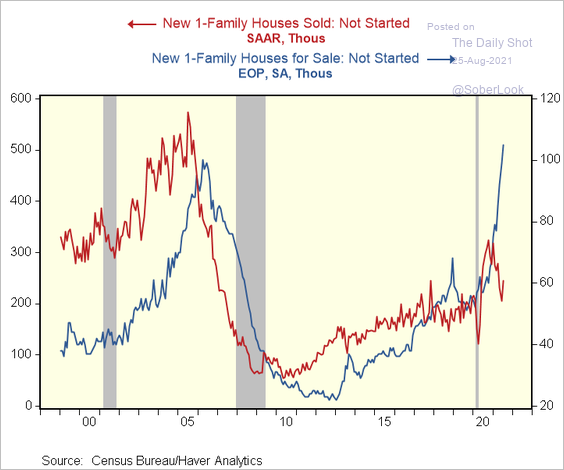
• This chart shows sold and for sale houses that have not been started yet (builders pre-selling).
 Source: @RenMacLLC
• By the way, the large, publicly-traded homebuilders increasingly control the nation’s residential construction market.
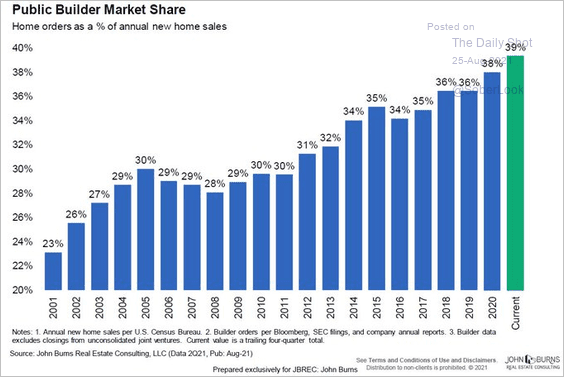 Source: @JBREC
• The median price of a new home is approaching $400k.
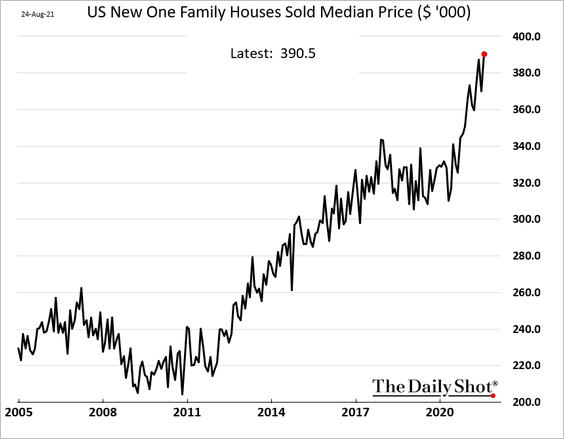
Here is the distribution of new home sales by price range.
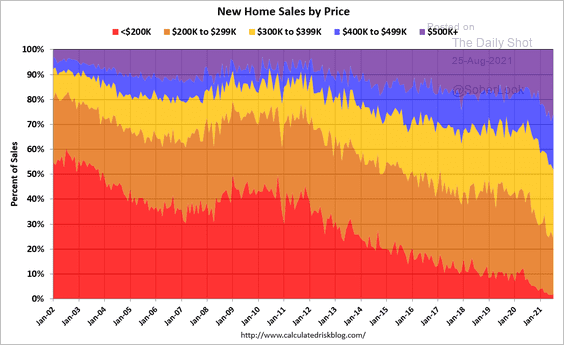 Source: @calculatedrisk Read full article
——————–
4. The average size of a mortgage in the US is now above $400k.
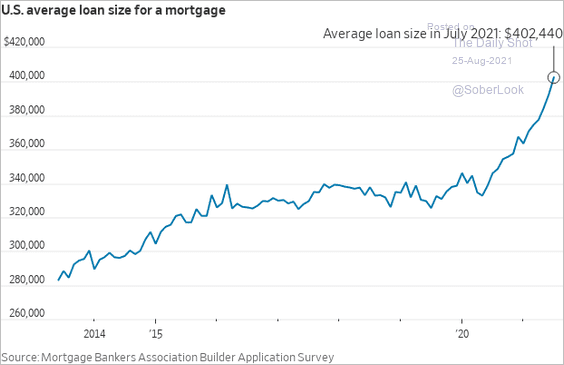 Source: @WSJ Read full article
5. This chart shows the distribution and growth of household cash balances.
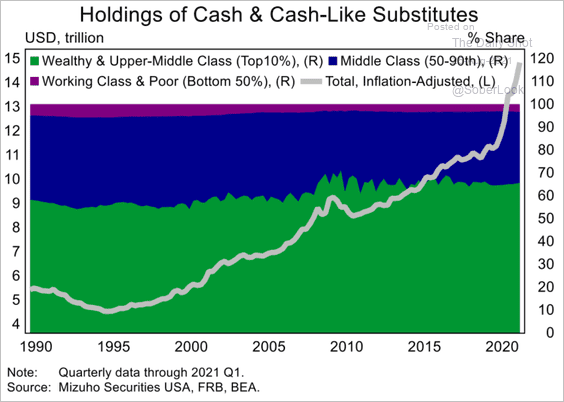 Source: Mizuho Securities USA
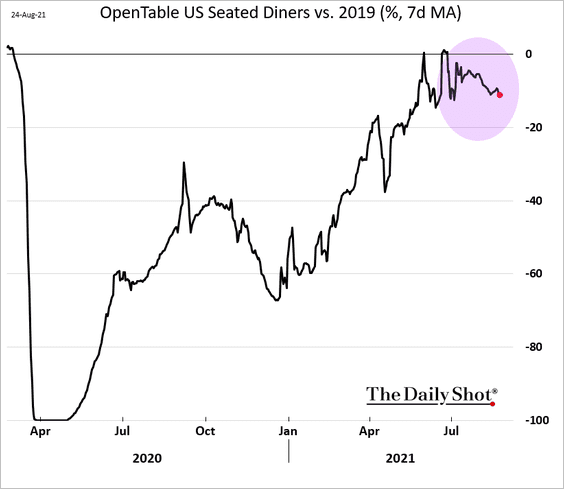
6. Next, we have some high-frequency data.
• Seated diners at US restaurants:
• COVID-related economic risk score by state:
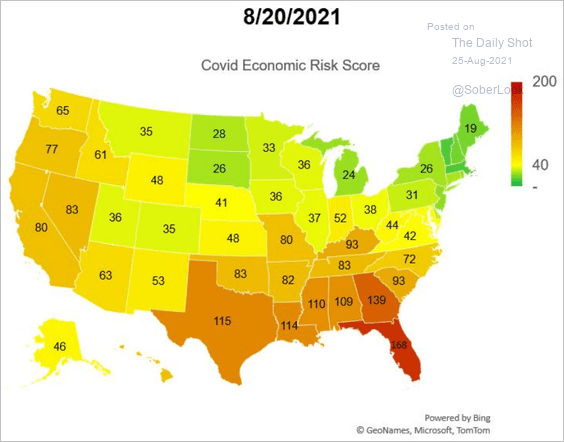 Source: Cornerstone Macro
• The U. Washington COVID model (infections peaking):
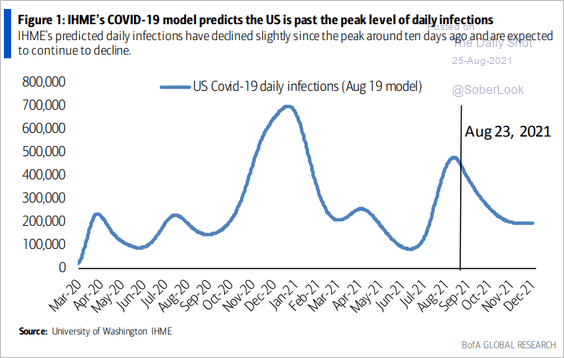 Source: BofA Global Research; @MikeZaccardi
——————–
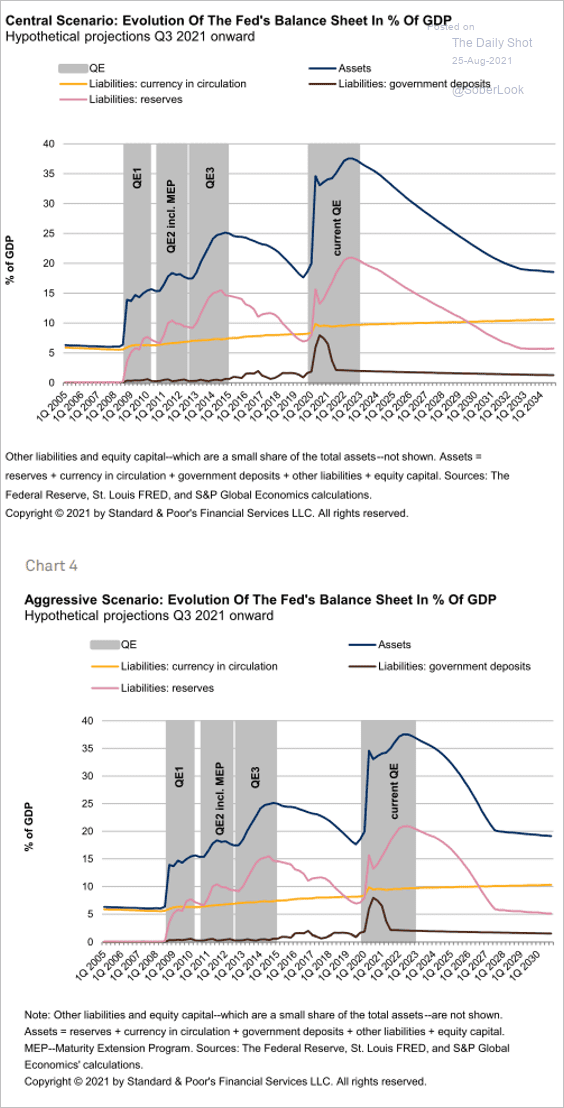
7. Finally, here are some updates on the US monetary policy.
• Two scenarios for the Fed’s balance sheet as a percentage of GDP (from S&P Global Ratings):
 Source: S&P Global Ratings
• An estimated timeline of Fed policy changes, according to BCA Research:
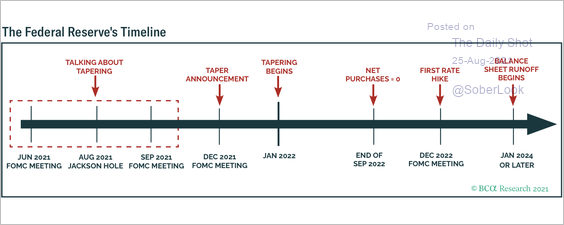 Source: BCA Research
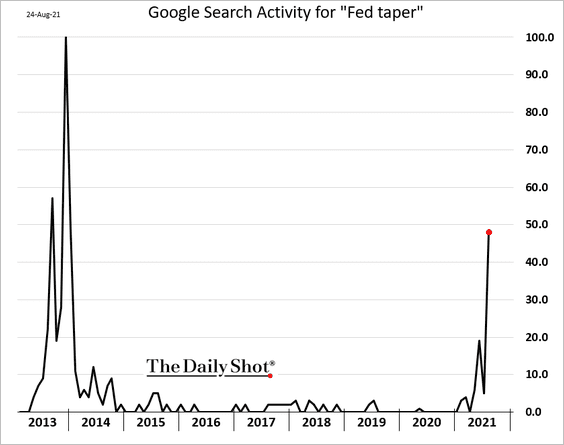
• Online search activity for “Fed taper”:
Back to Index
The United Kingdom
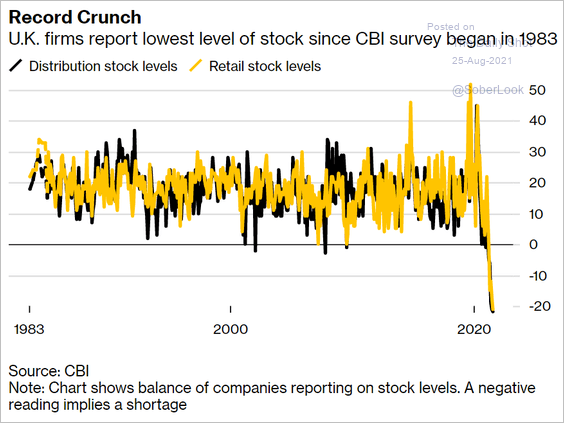
The CBI report showed retail sales surging in August, with the headline figure well above consensus.
 Source: ESM Read full article
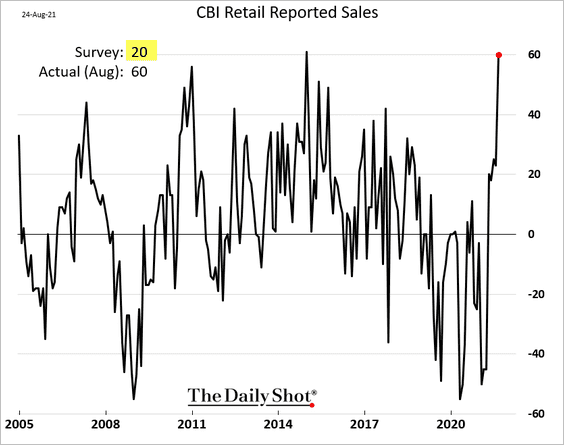
• Inventories are at their lowest levels in decades.
 Source: Bloomberg Read full article
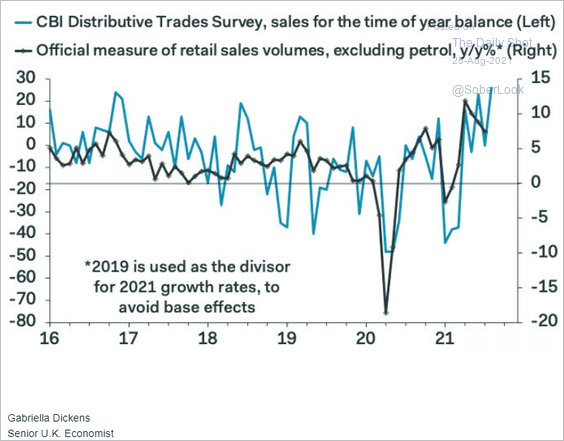
• We should see a pop in the official retail sales index.
 Source: Pantheon Macroeconomics
Back to Index
The Eurozone
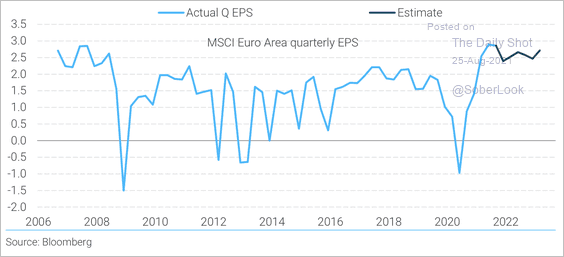
1. Consensus earnings forecasts are broadly flat over the next six quarters (at elevated levels).
 Source: TS Lombard
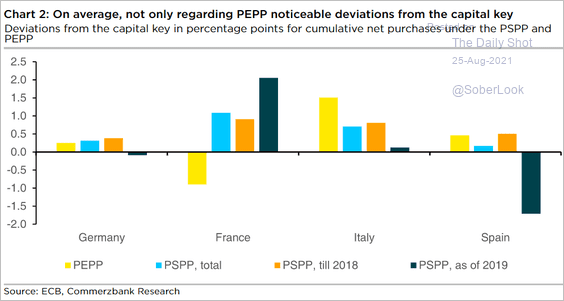
2. The ECB has been deviating from the capital keys proportions when purchasing securities.
 Source: Commerzbank Research
3. The Citi Economic Surprise Index continues to sink.
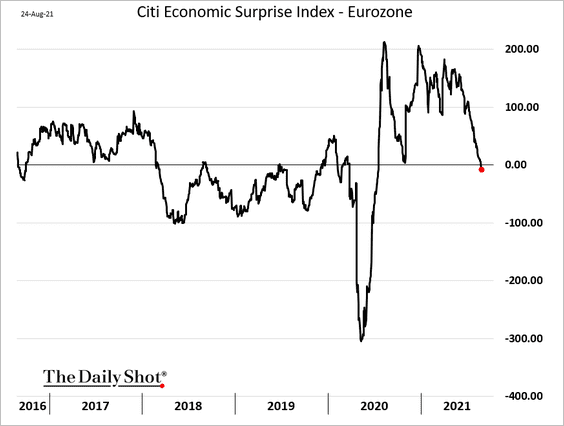 Source: Citi
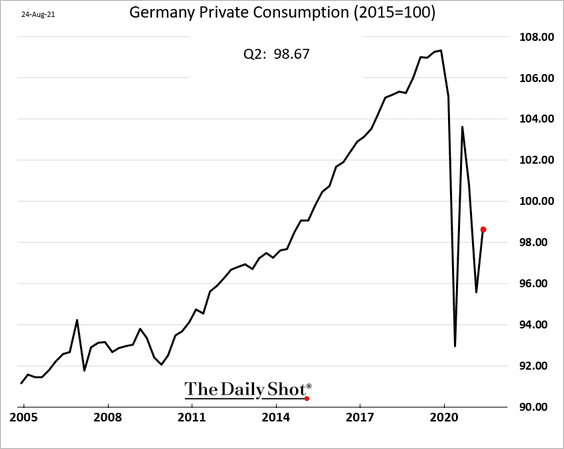
4. Next, we have a couple of updates on Germany.
• The recovery in private consumption has a long way to go.
• The betting markets now show roughly equal odds of a CDU/CSU vs. SPD victory.
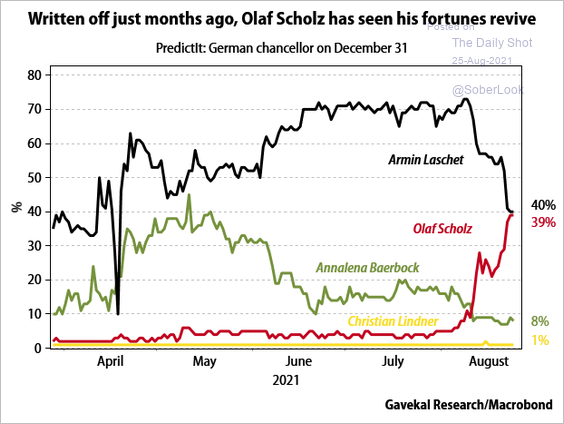 Source: Gavekal Research
 Source: Euronews Read full article
Here are some possible coalitions based on the latest polls.
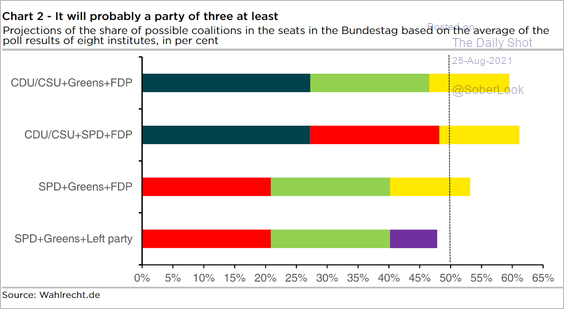 Source: Commerzbank Research
Back to Index
Asia – Pacific
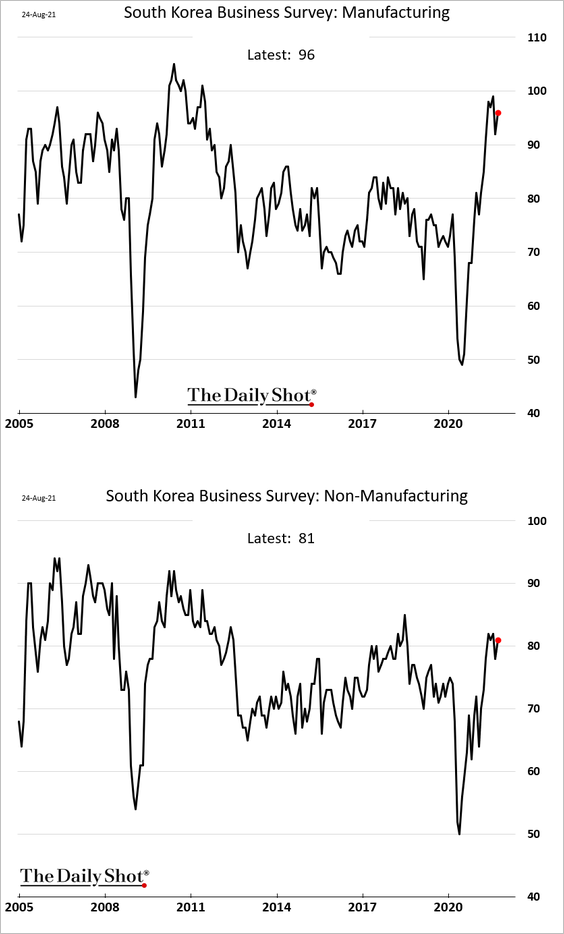
1. South Korea’s business surveys remain resilient.
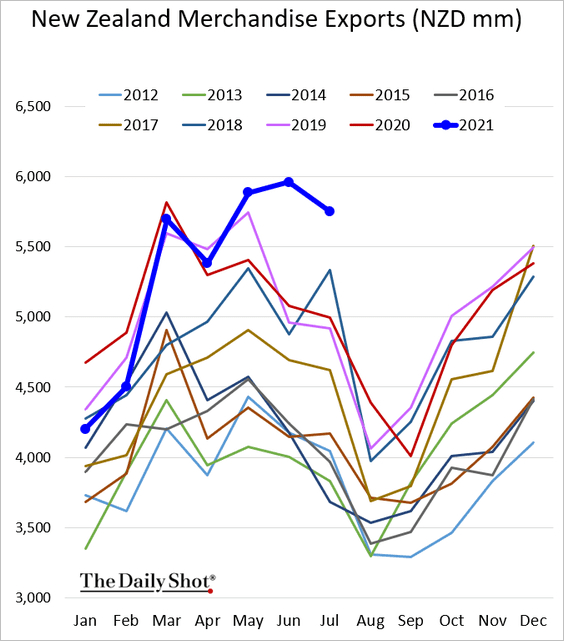
2. New Zealand’s exports are still at record levels for this time of the year.
3. Australia’s housing credit growth has been unusually strong.
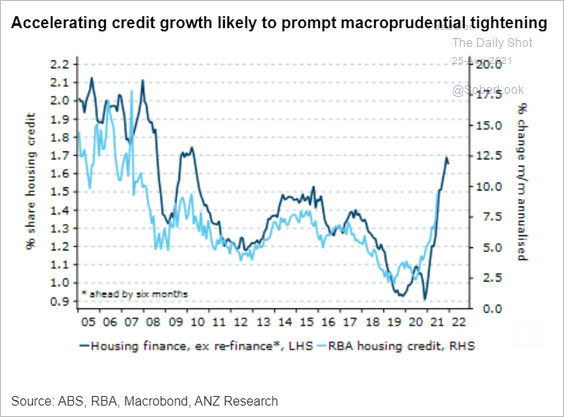 Source: ANZ Research
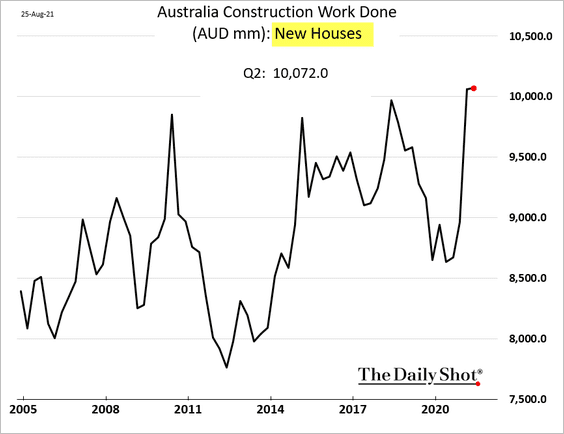
However, residential construction was almost unchanged last quarter.
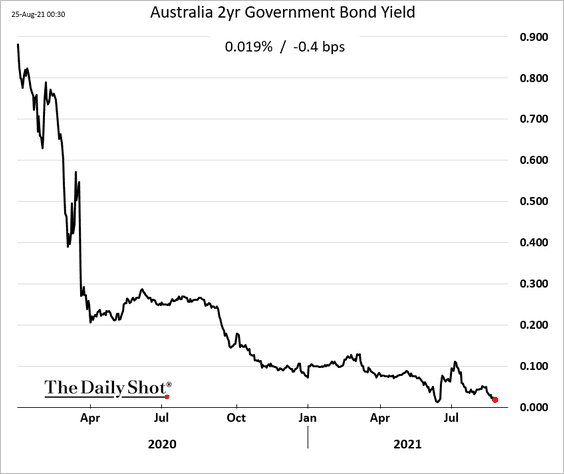
Australia’s 2yr yield is nearing zero again amid lockdowns.
Back to Index
China
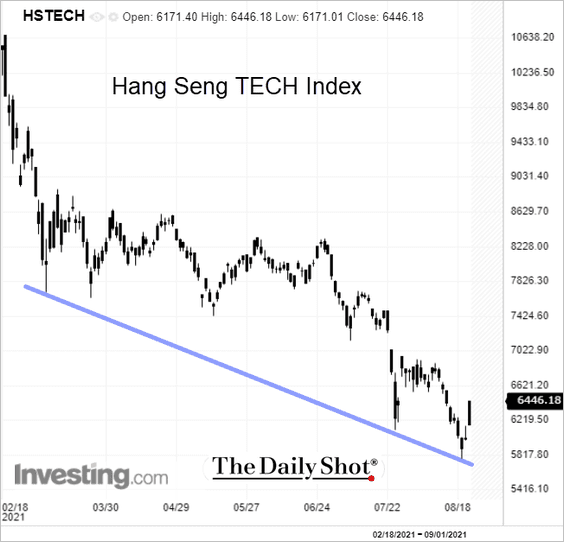
1. Tech stocks bounced from support in Hong Kong.
 Source: Bloomberg Read full article
——————–
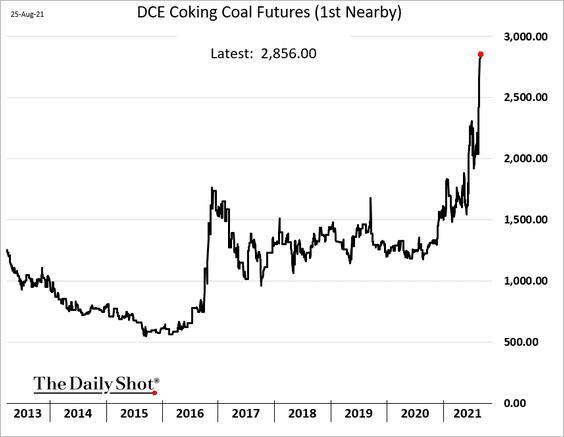
2. Coal prices continue to surge.
3. The World Economics SMI report shows surprisingly robust factory activity this month.
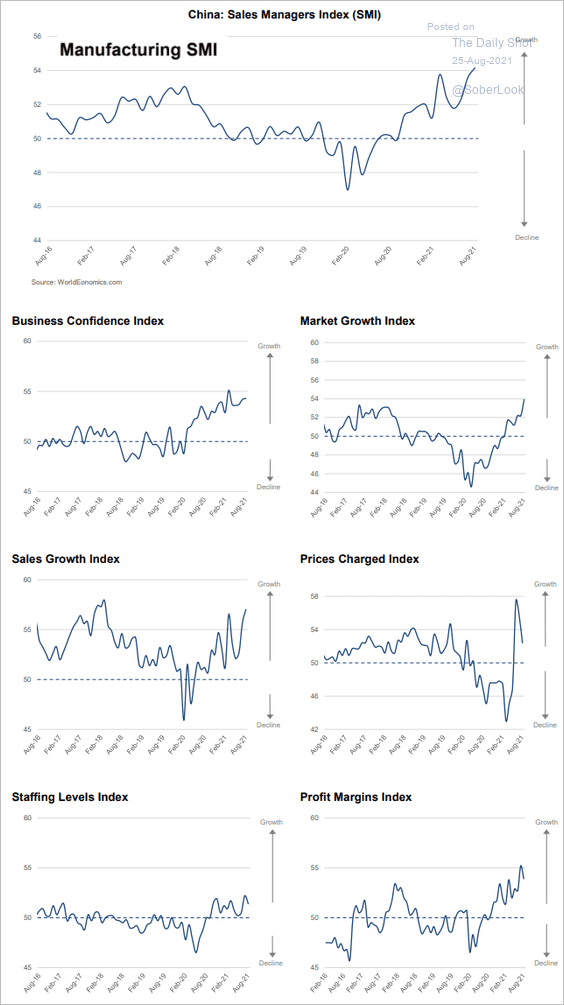 Source: World Economics
Service-sector growth is holding up as well.
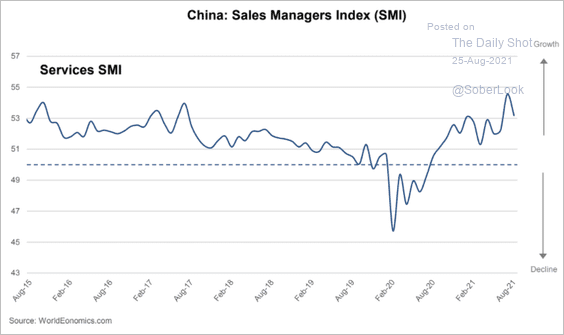 Source: World Economics
——————–
4. Will we see a rate cut from the PBoC in the coming months?
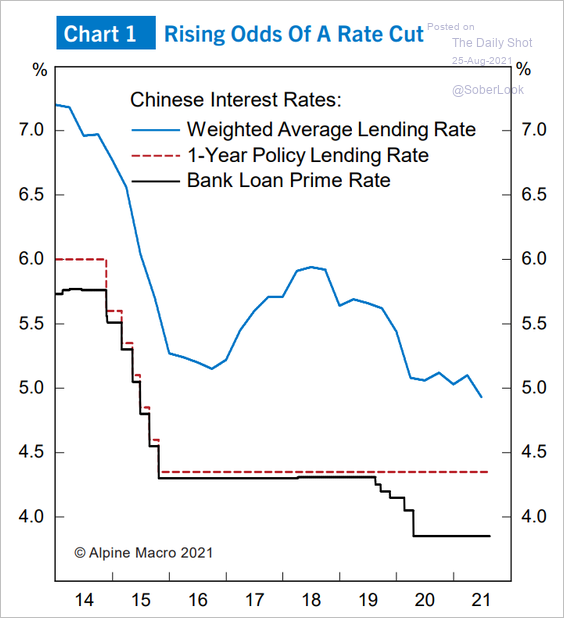 Source: Alpine Macro
5. Labor costs continue to climb, outpacing Mexico and Vietnam.
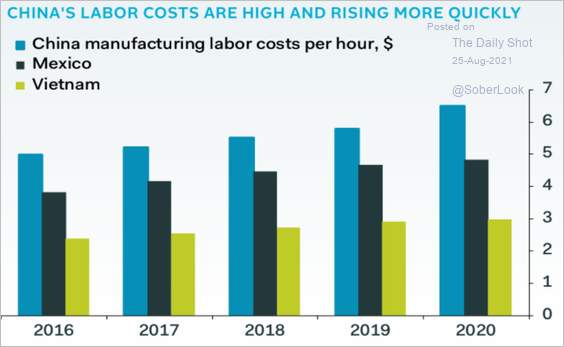 Source: Pantheon Macroeconomics
6. Beijing is increasingly concerned about China’s growing inequality.
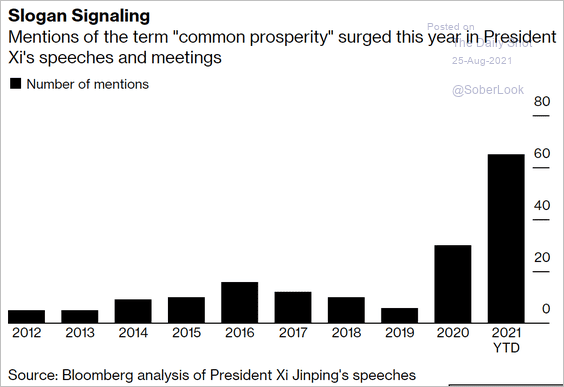 Source: Bloomberg Read full article
7. Assets under management of ETFs tracking sectors and themes have significantly risen over the past year, while other ETFs tracking the broad onshore/offshore indices have remained relatively flat over the same period.
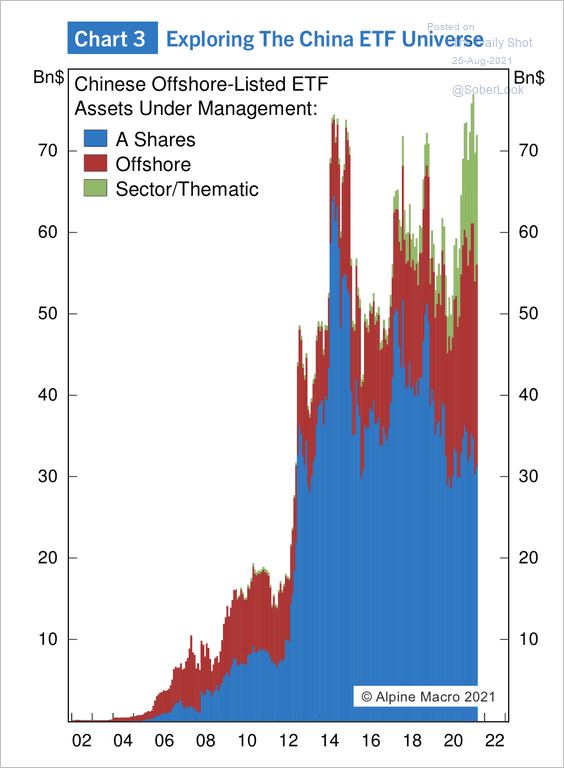 Source: Alpine Macro
Thematic ETFs exposed to internet, tech, ESG, and electric vehicle names have attracted fresh capital.
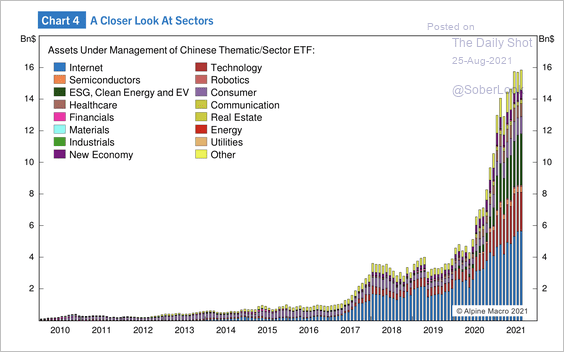 Source: Alpine Macro
——————–
8. This chart shows active users on Cina’s payment platforms.
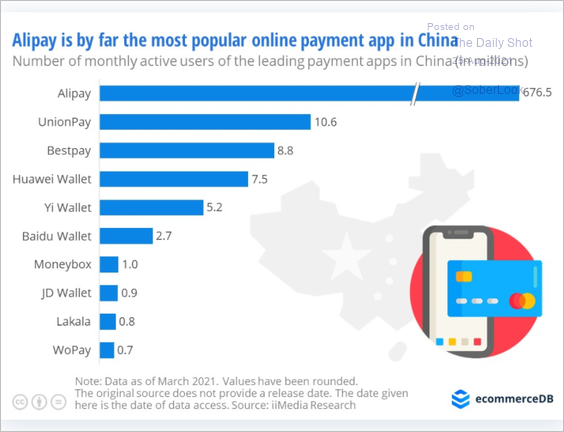 Source: ecommerceDB.com Read full article
Back to Index
Emerging Markets
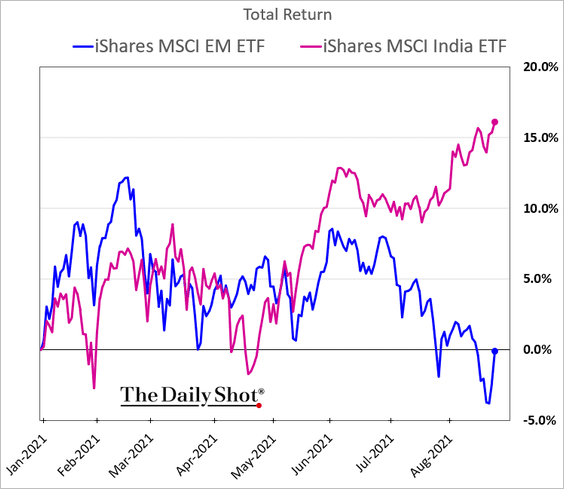
1. Indian equities have been outperforming as investors rotated out of China-sensitive economies.
3. Over a third of South Africa’s workers are unemployed.

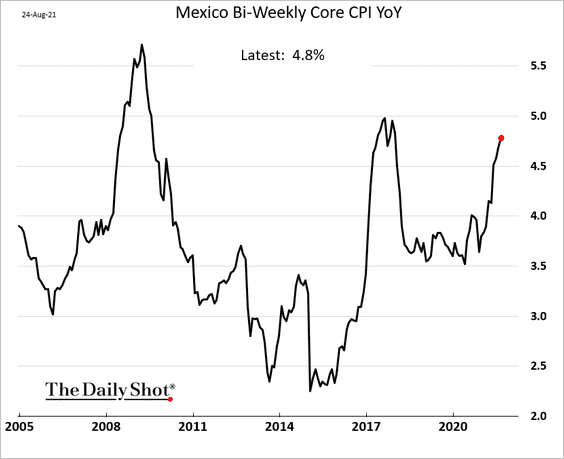
4. Mexican core inflation is approaching 5%.
5. More countries are turning yellow on the map below.
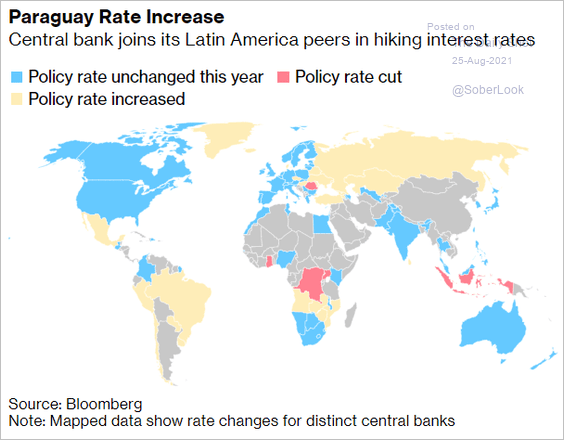 Source: @markets Read full article
6. This scatterplot shows MRB’s credit risk score vs. each country’s 10yr bond yield.
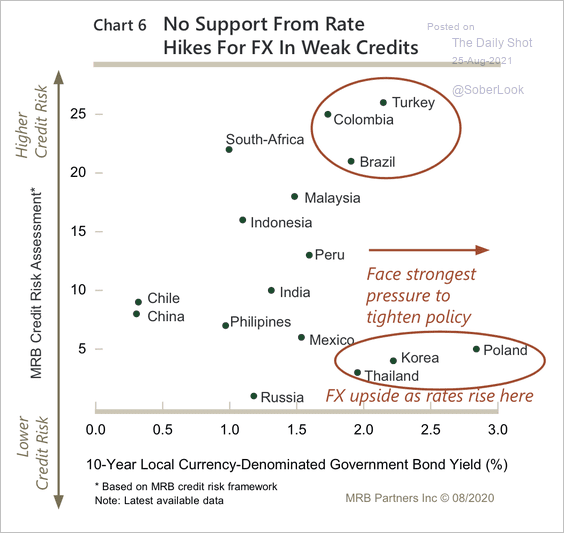 Source: MRB Partners
7. EM bond inflows increased this year while equity inflows have dried up, partly explained by movements in the dollar.
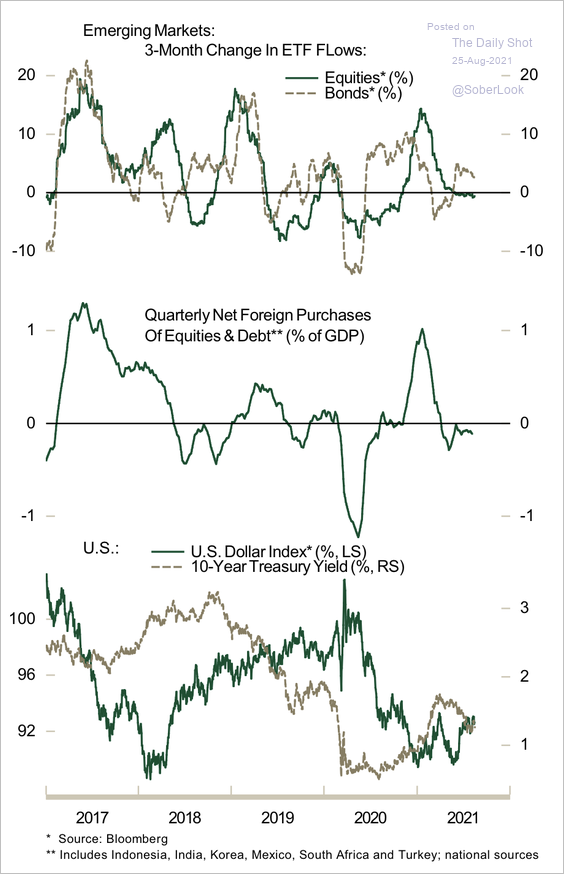 Source: MRB Partners
8. The middle class is expected to grow rapidly across EM, dominated by India and China (2 charts).
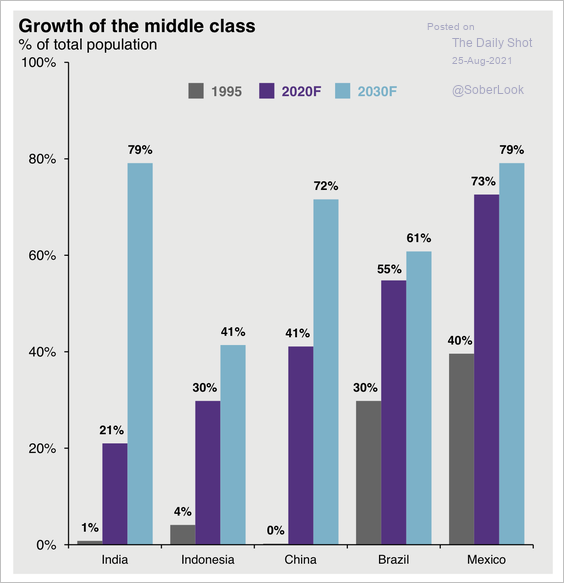 Source: J.P. Morgan Asset Management
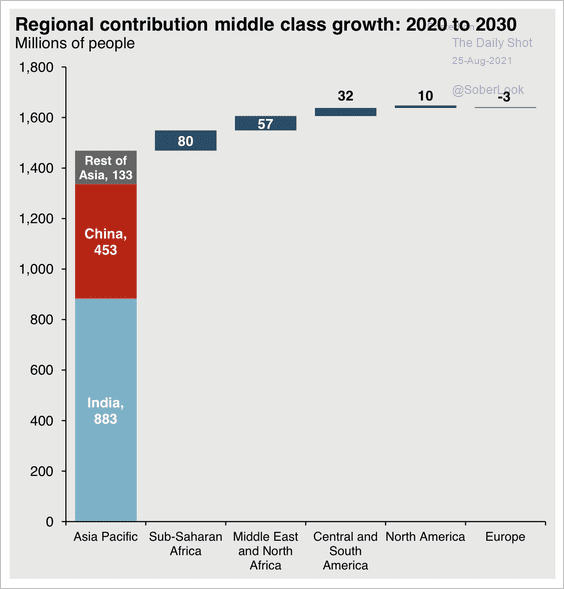 Source: J.P. Morgan Asset Management
Back to Index
Cryptocurrency
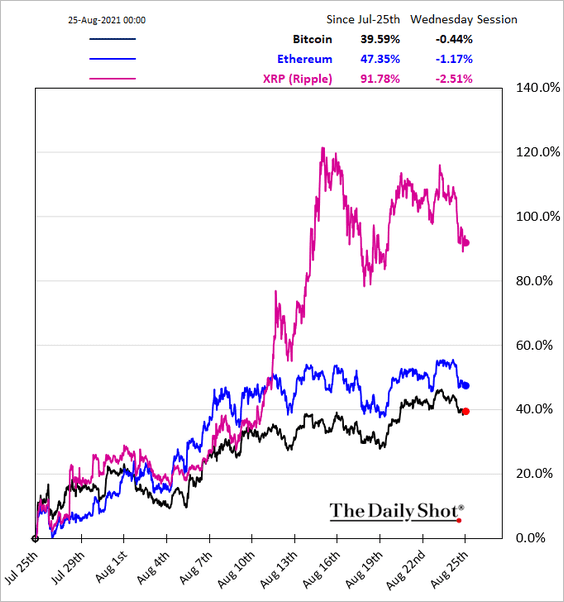
1. Cryptocurrencies are in pullback mode after a strong rally over the past month.
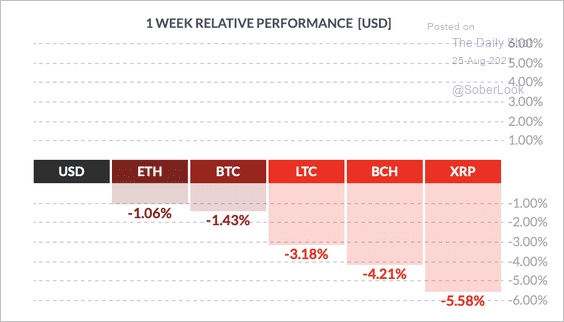 Source: FinViz
——————–
2. Bitcoin’s blockchain transaction counts are at historically low levels despite the recent price rally.
![]() Source: Glassnode
Source: Glassnode
3. Bitcoin’s hashrate has been recovering from a local bottom in late June.
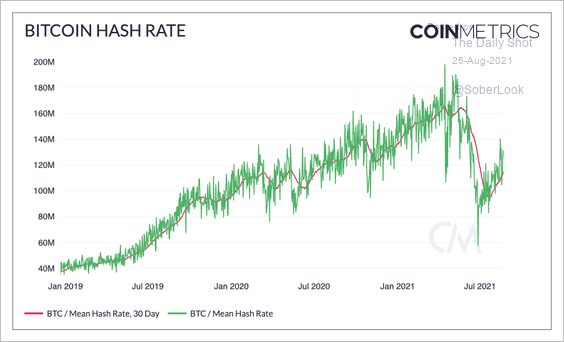 Source: Coin Metrics
4. The crypto Fear & Greed Index is approaching “extreme greed” territory.
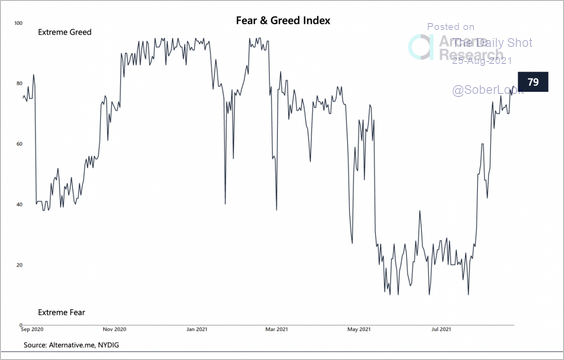 Source: Arcane Research Read full article
5. This spider chart illustrates the level of cryptocurrency adoption around the world.
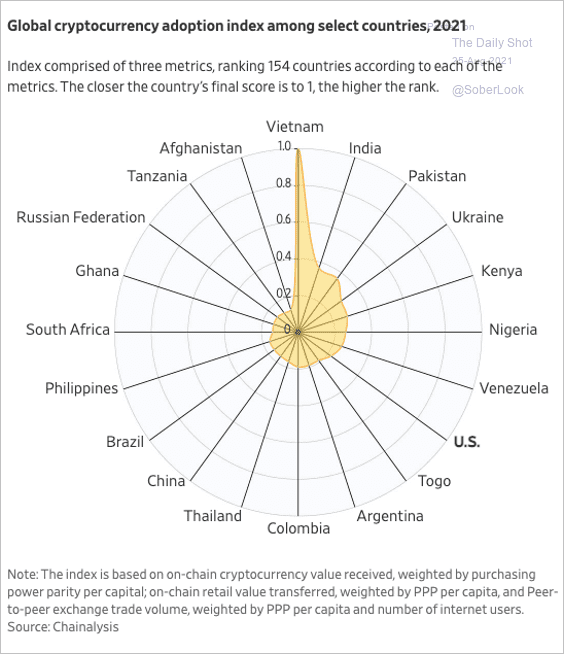 Source: @WSJ Read full article
Back to Index
Commodities
1. Fitch Solutions expects global steel prices to weaken.
 Source: Fitch Solutions Macro Research
US steel prices have surged more than Asia and Europe over the past year.
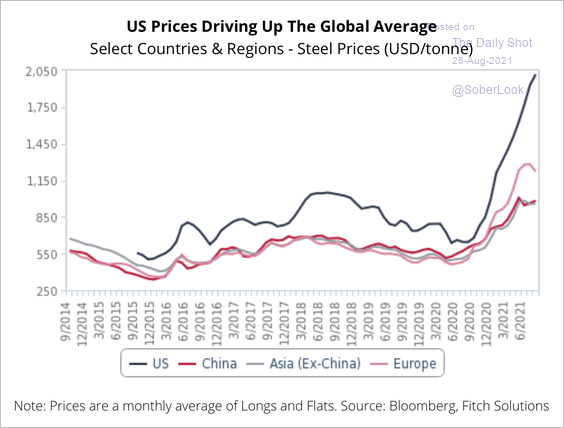 Source: Fitch Solutions Macro Research
——————–
2. Bloomberg’s agriculture index is at support.
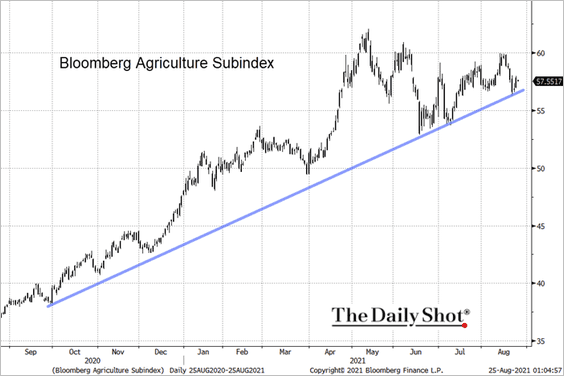 Source: @TheTerminal, Bloomberg Finance L.P.
3. US beef packers are enjoying near-record margins.
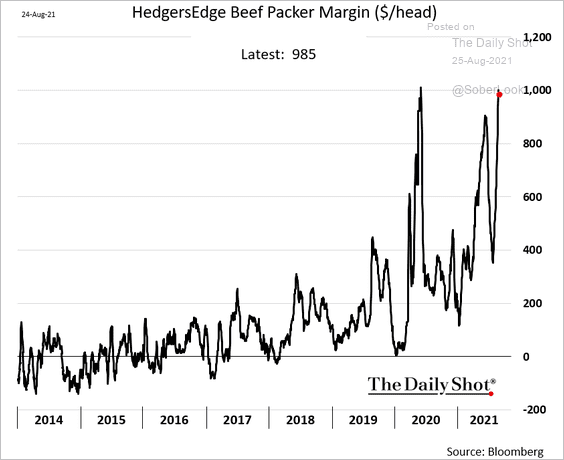 h/t @mhirtz
Back to Index
Energy
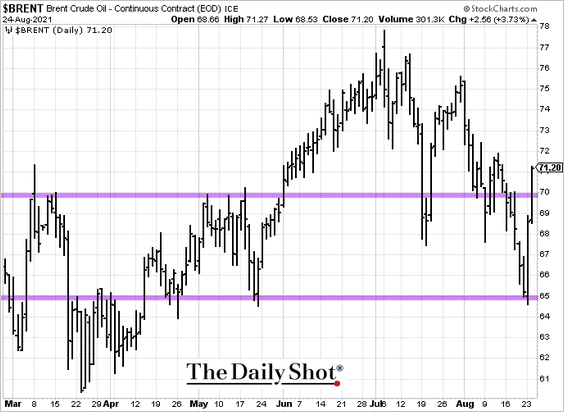
1. Brent is back above $70/bbl.
2. Backwardation is rebounding. Here is the Brent Oct-Nov futures spread.
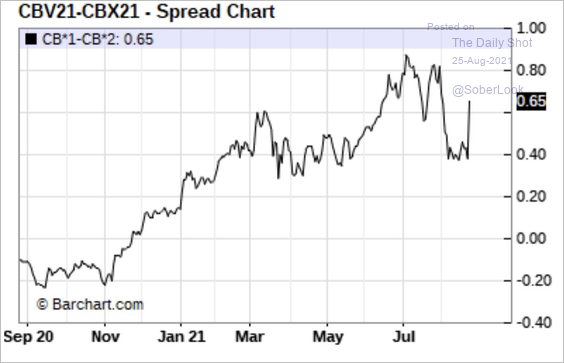 Source: @HFI_Research
3. Next, we have US solar panel imports by country of origin.
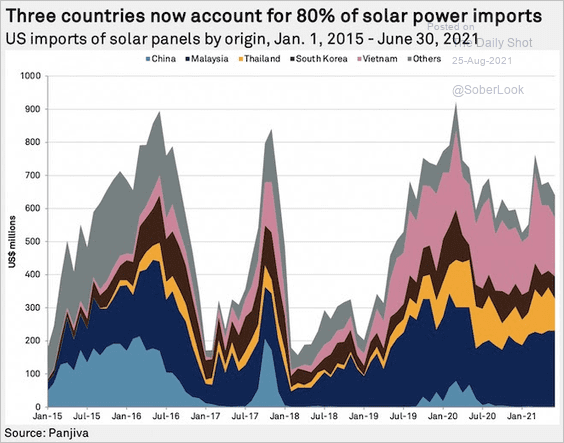 Source: S&P Global Market Intelligence
Back to Index
Equities
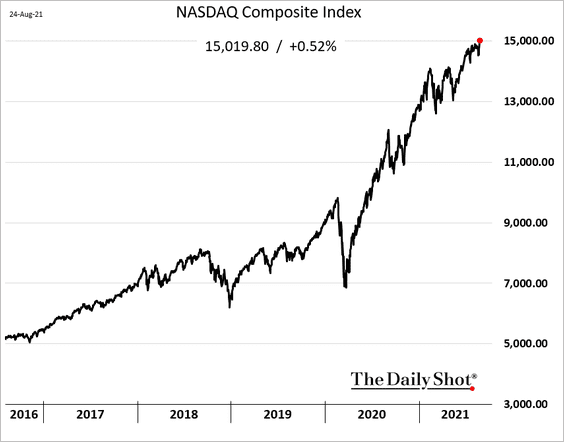
1. US indices hit record highs, with the Nasdaq Composite breaching 15k.
2. The correlation between stocks and bonds has been declining. This reversal points to growth fears rather than concerns about a hawkish Fed.

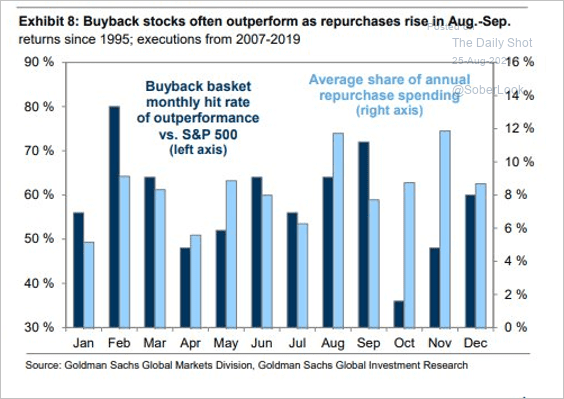
3. The market has been rewarding companies focused on dividends and share buybacks rather than those investing in their business.
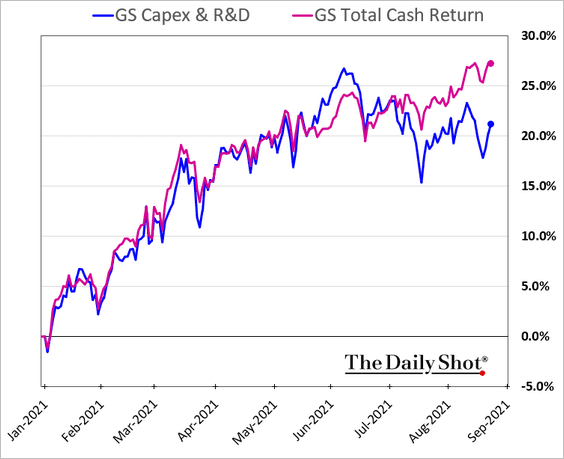
According to Goldman, buyback stocks outperform when repurchases increase.
 Source: Goldman Sachs; @Saburgs
——————–
4. Corporate cash holdings hit a new high this year.
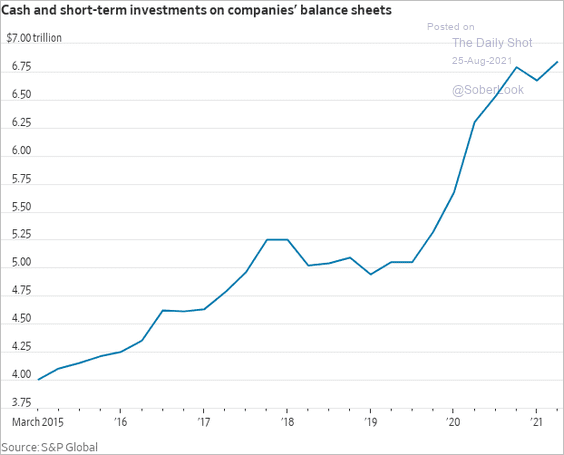 Source: @WSJ Read full article
5. Fund managers’ expectations of global corporate profits have been declining since March.
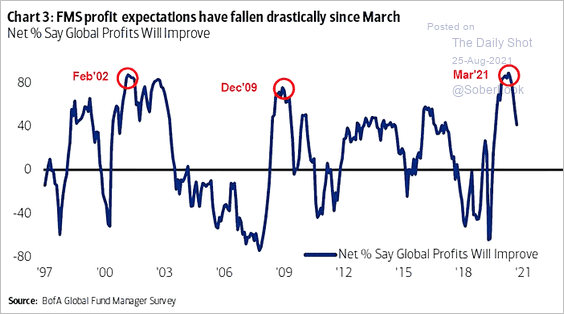 Source: BofA Global Research; @Saburgs
Goldman sees the S&P 500 EPS growth stalling next year.
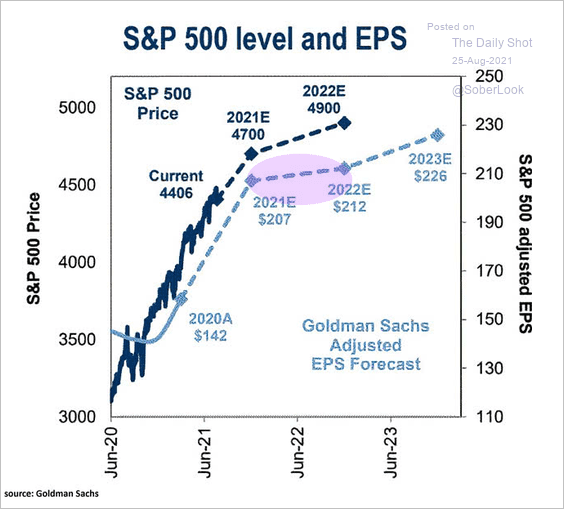 Source: @ISABELNET_SA, @GoldmanSachs
——————–
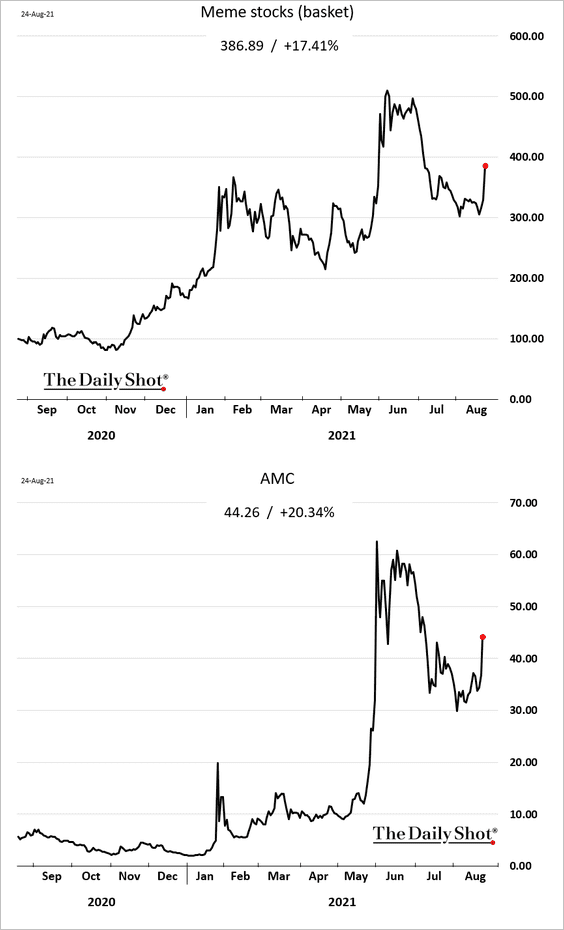
6. Meme stocks woke up this week.
7. Next, we have some updates on volatility (from Morgan Stanley).
• Volatility tends to pick up into September.
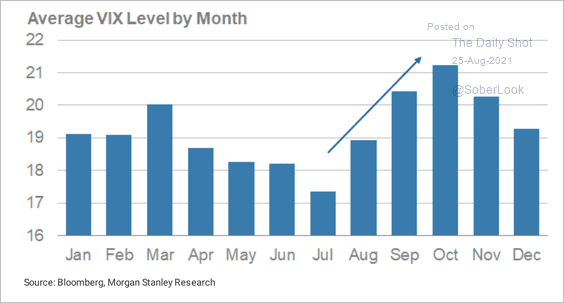 Source: Morgan Stanley Research
• The S&P 500 forward vols are still above average.
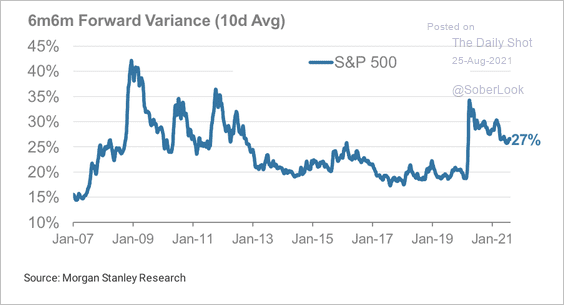 Source: Morgan Stanley Research
• Asset managers have trimmed their net-long VIX positions.
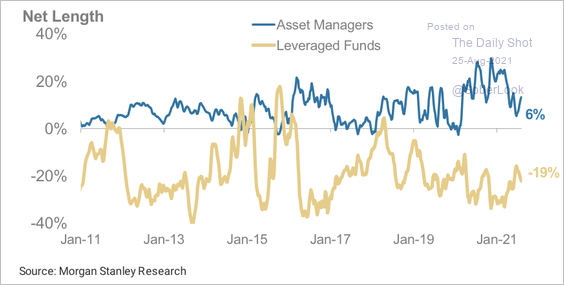 Source: Morgan Stanley Research
• For now, VIX carry remains strong (elevated contango).
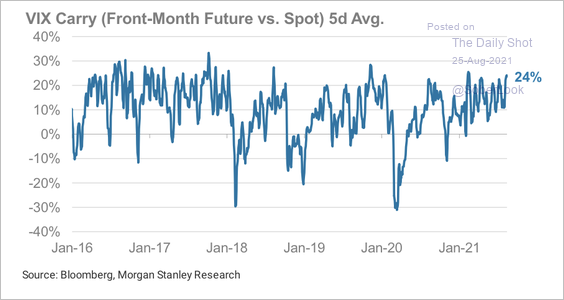 Source: Morgan Stanley Research
• Demand for out-of-the-money VIX calls has been growing as traders use VIX options to hedge against a downturn in stocks.
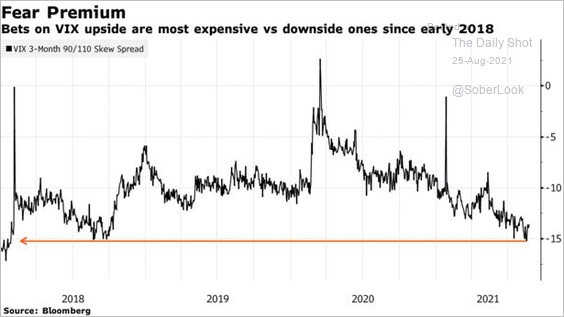 Source: @markets, h/t @WallStJesus Read full article
Back to Index
Alternatives
1. Hedge funds are increasingly rejecting new money as they try to manage redemption risks.
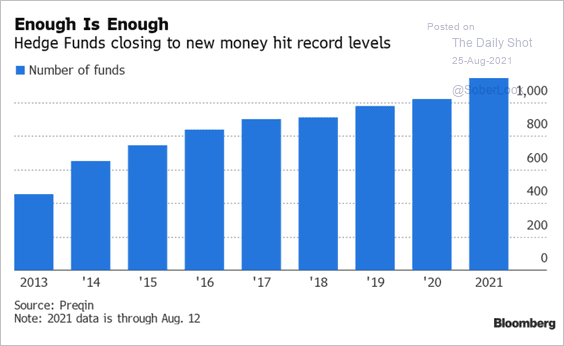 Source: @business Read full article
2. VC-backed company valuations are surging.
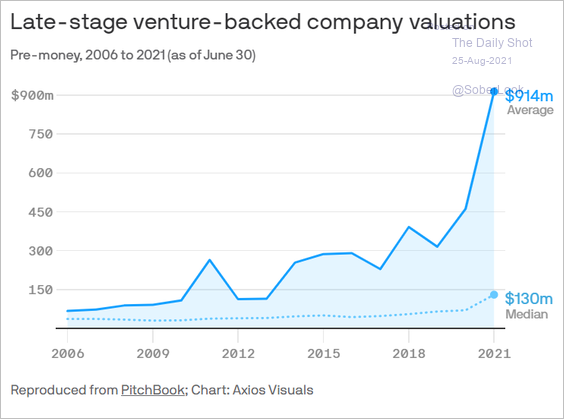 Source: @axios Read full article
Back to Index
Credit
1. CLO repricings surged recently due to strong demand from investors.
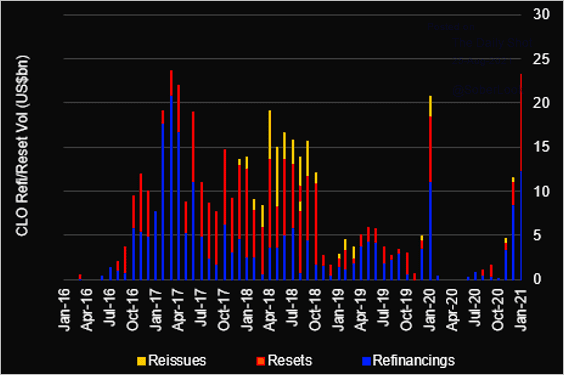 Source: @LPCLoans
2. Muni yields continue to trend lower amid concerns about higher tax rates ahead.
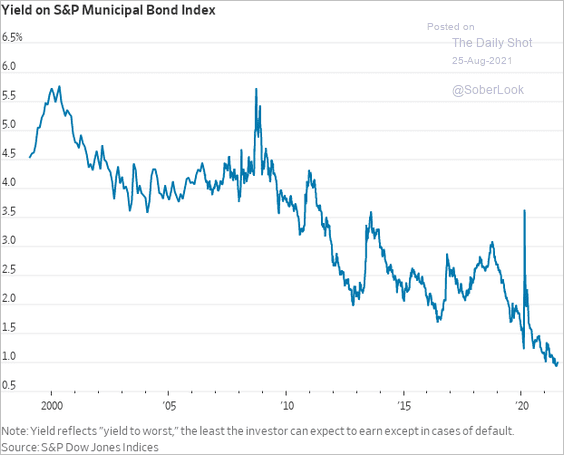 Source: @WSJ Read full article
3. Private-label MBS activity is still a shadow of the levels we saw before the financial crisis, but demand has been growing.
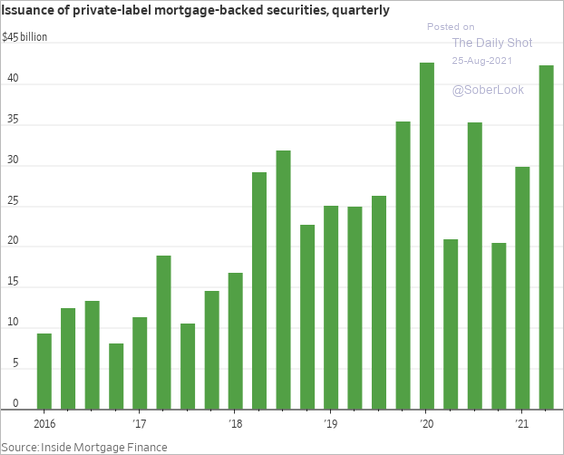 Source: @WSJ Read full article
Back to Index
Rates
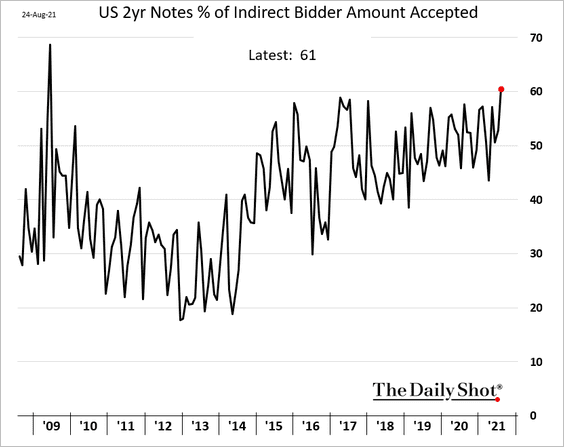
1. Demand for short-term Treasuries has been strong as US dollar money markets are flooded with liquidity.
 Source: TheStreet Read full article
Speculative accounts remain net-long the 2yr note futures.
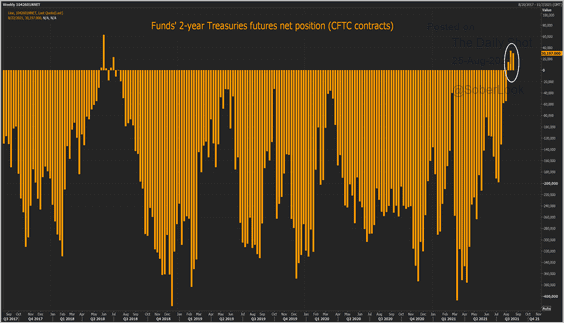 Source: @ReutersJamie Read full article
——————–
2. Goldman sees higher Treasury yields than is currently priced into the market.
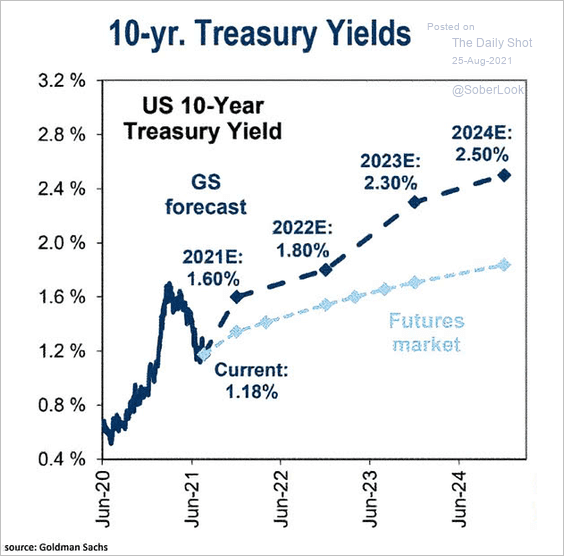 Source: @ISABELNET_SA, @GoldmanSachs
3. This chart shows Treasury issuance vs. demand.
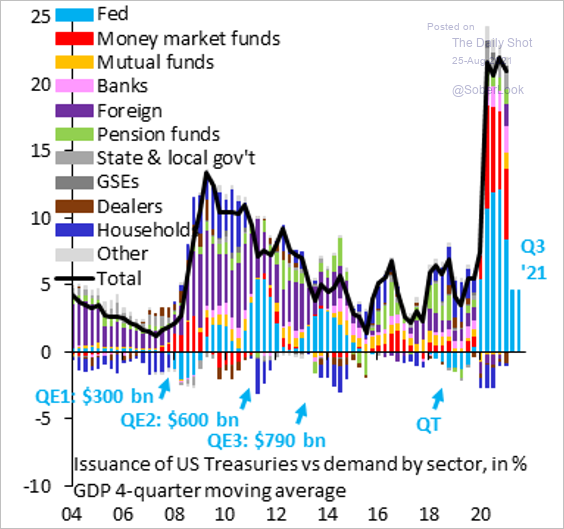 Source: @ReutersJamie, @pdacosta, @Lavorgnanomics, @RobinBrooksIIF
Back to Index
Global Developments
1. Advanced economies’ business activity trends (PMIs) have diverged.
 Source: BCA Research
2. The year-over-year impact of oil prices on inflation has peaked.
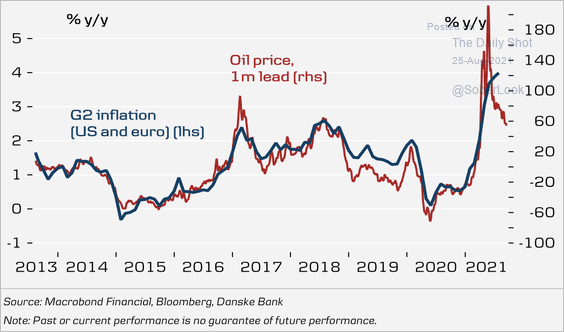 Source: Danske Bank
3. House prices are soaring across the globe.
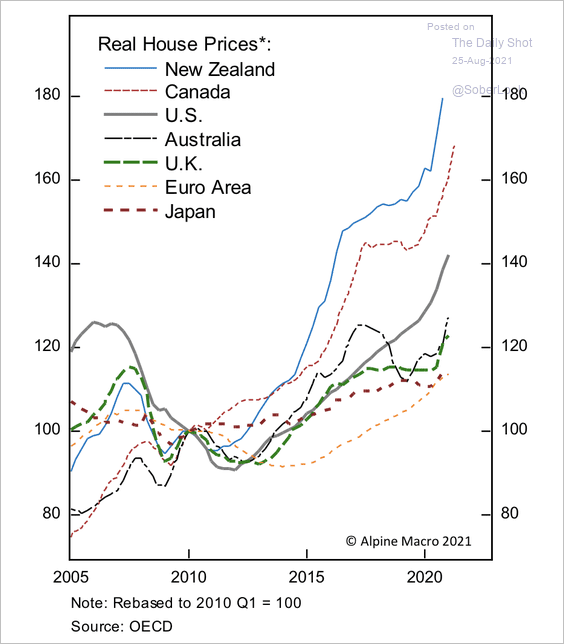 Source: Alpine Macro
4. Finally, we have debt-to-GDP ratios (gross debt) in advanced economies.
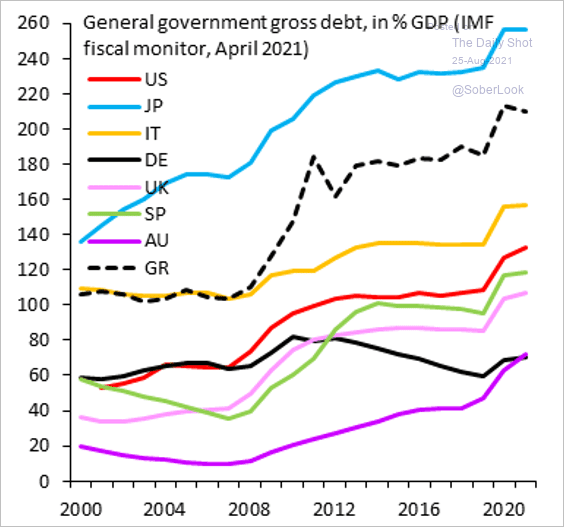 Source: @RobinBrooksIIF
——————–
Food for Thought
1. Net federal funding per resident, by state:
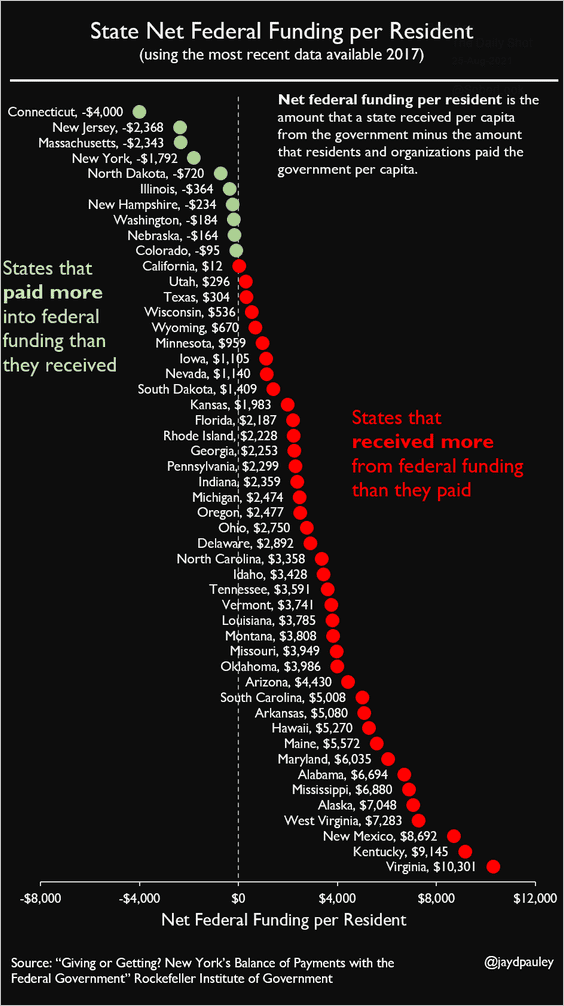 Source: @jaydpauley
2. The recent US fiscal interventions compared to the New Deal:
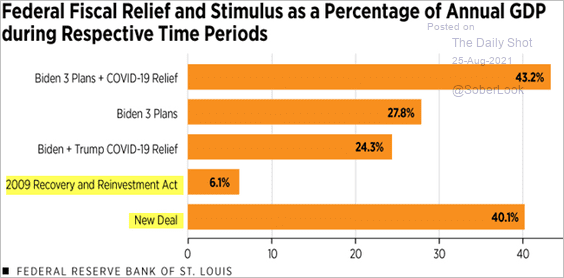 Source: @stlouisfed Read full article
3. Spending on new roads vs. road repair:
 Source: The Washington Post Read full article
4. Cash used in retail transactions:
 Source: @financialtimes Read full article
5. Time spent on select activities in 2020 vs. 2019:
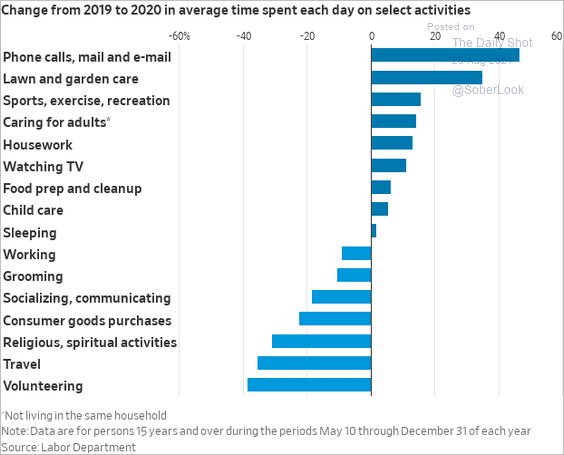 Source: @WSJ Read full article
6. Top 10 countries by changes in poverty headcount:
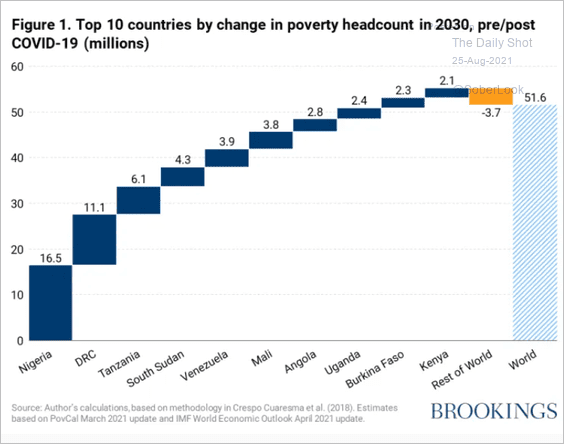 Source: Brookings Read full article
7. The uptake of mortgage forbearance plans in the US:
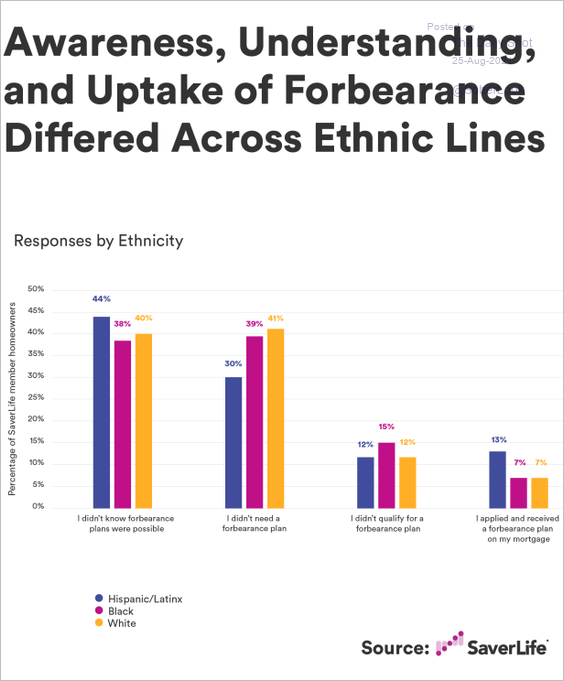 Source: Brookings Read full article
8. Urbanization over the past 500 years:
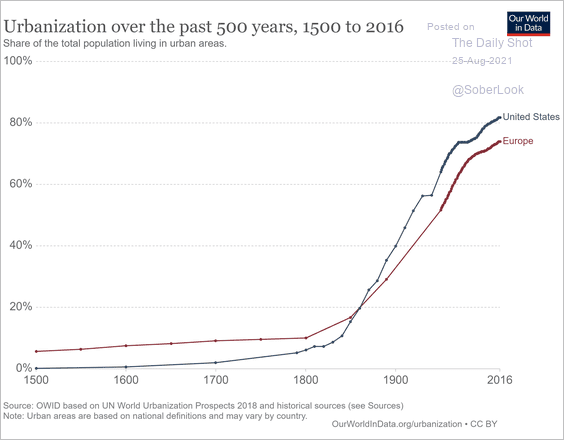 Source: Our World in Data Read full article
9. Vaccinated vs. unvaccinated hospitalization rates:
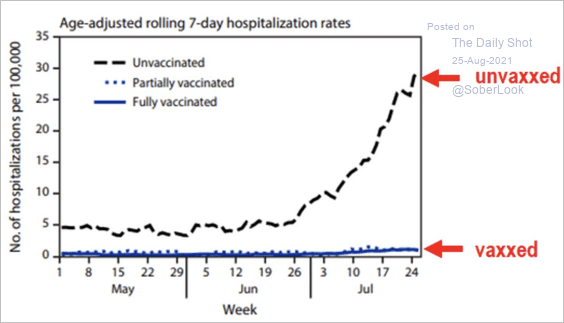 Source: @carlquintanilla, @CDCgov, @fundstrat Read full article
10. US daily COVID vaccinations:
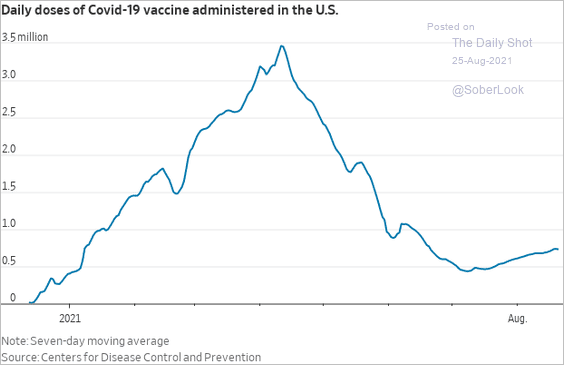 Source: @WSJ Read full article
11. Support for vaccination requirements in the workplace:
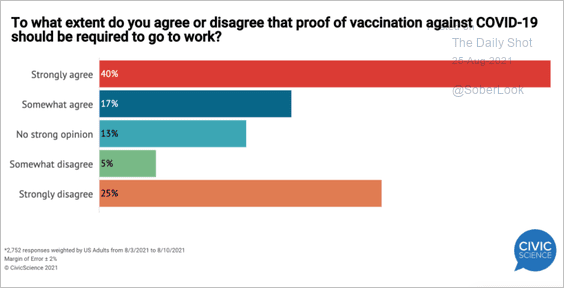 Source: @CivicScience
12. Top choices to host Jeopardy:
 Source: Morning Consult Read full article
——————–
Back to Index