
The Daily Shot: 22-Sep-21
• The United States
• Canada
• The United Kingdom
• The Eurozone
• China
• Emerging Markets
• Cryptocurrency
• Commodities
• Energy
• Equities
• Global Developments
• Food for Thought
The United States
1. Let’s begin with the housing market.
• Last month’s housing starts and construction permits were stronger than expected.
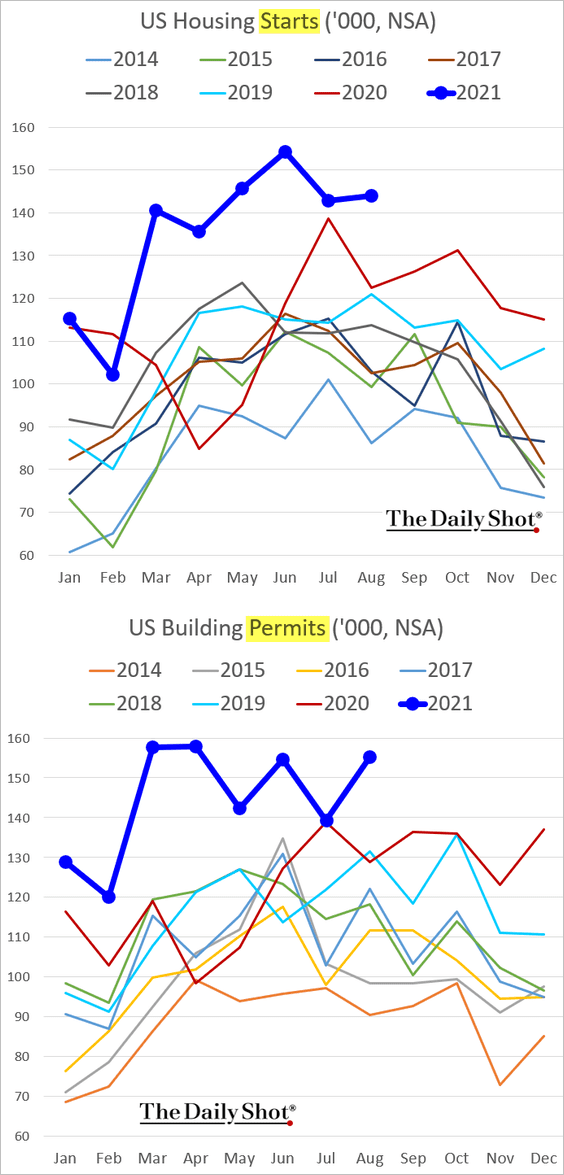
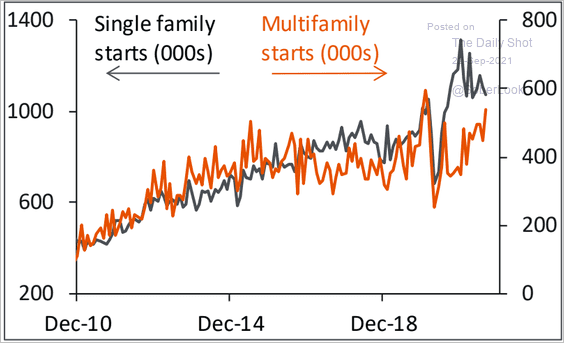
– The gains were driven by multi-family (apartment) construction.
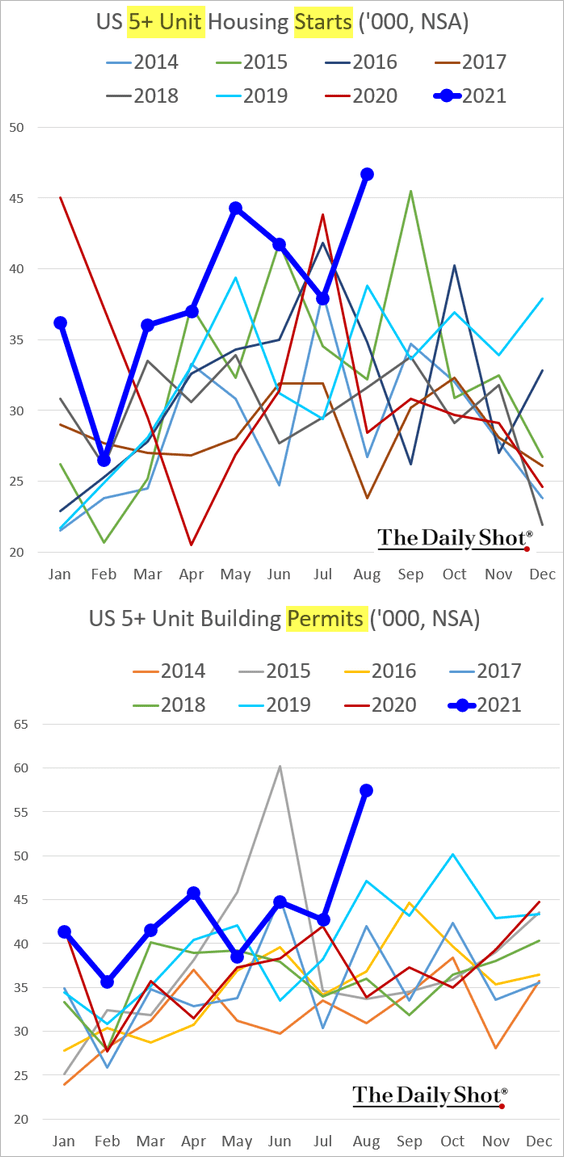
– Here are the seasonally-adjusted trends.
 Source: Piper Sandler
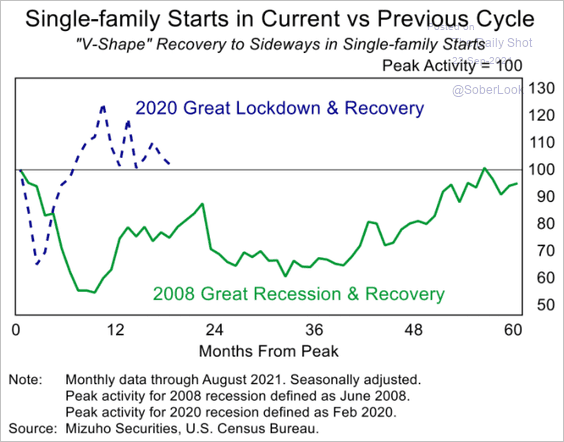
– Single-family construction activity is back near pre-COVID levels.
 Source: Mizuho Securities USA
• Authorized residential construction projects that haven’t been started yet reached a multi-year high. Builders are plagued by supply chain bottlenecks.
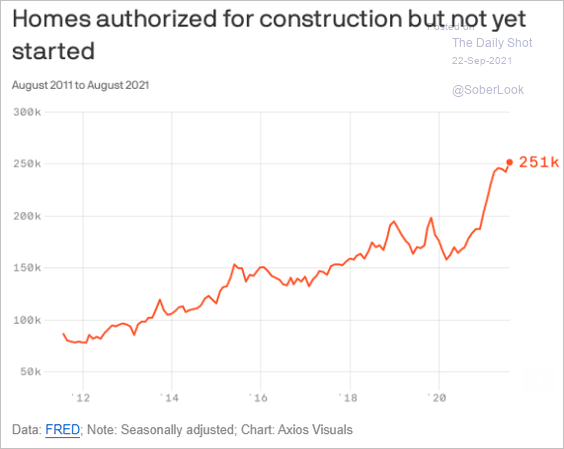 Source: @axios
• Single-family housing rents continue to surge, with detached units outpacing attached homes.
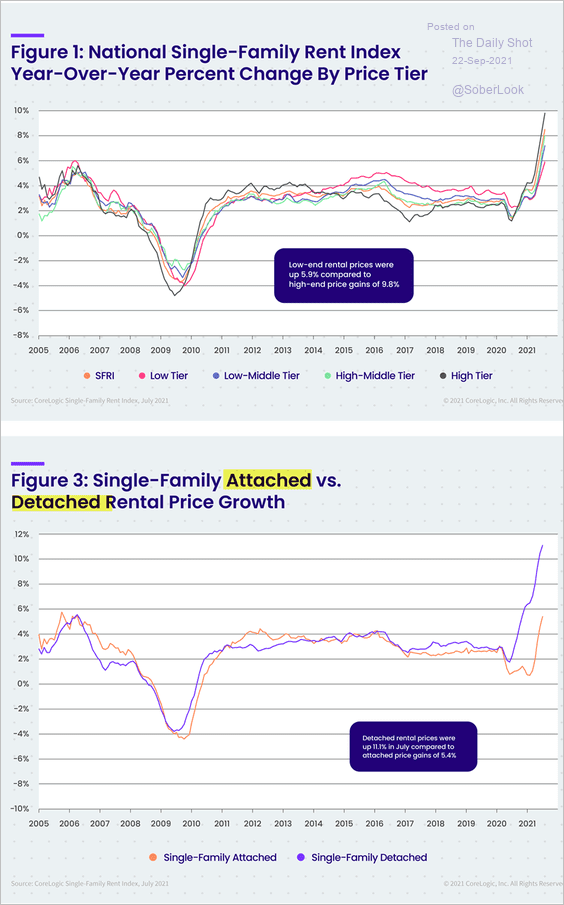 Source: CoreLogic
• Apartment occupancy continues to improve (chart shows Evercore’s occupancy indicator).
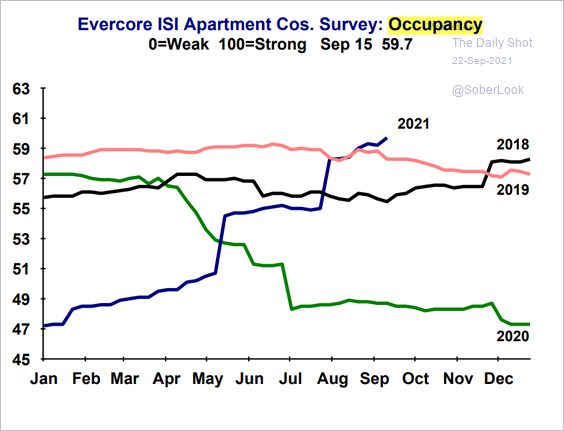 Source: Evercore ISI
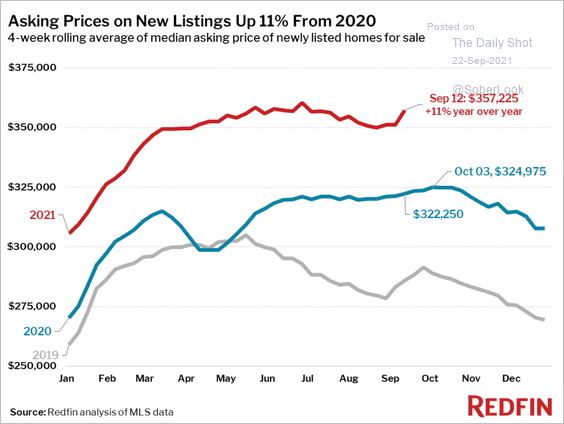
• Despite some recent talk of a pause in the housing market, high-frequency data from Redfin shows demand near multi-year highs.
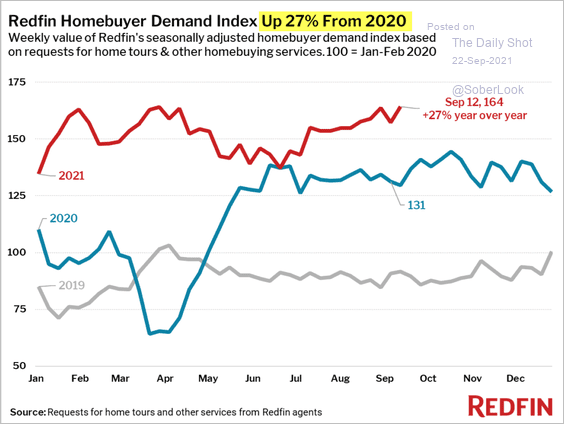 Source: @Redfin
And asking prices remain elevated.
 Source: @Redfin
——————–
2. Next, we have some updates on the monetary policy.
• When will QE taper start? When will it end?
 Source: Cornerstone Macro
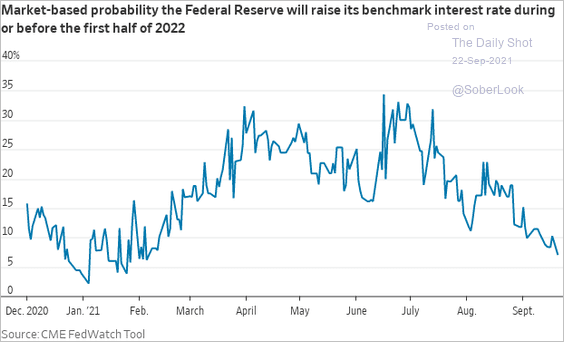
• Based on market pricing, a rate hike in the first half of next year is increasingly unlikely.
 Source: @WSJ Read full article
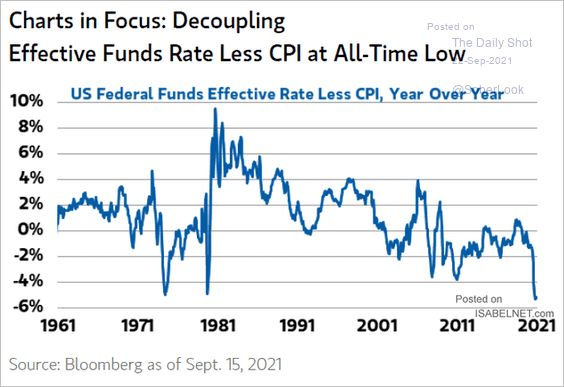
• The real fed funds rate points to extreme policy accommodation.
 Source: @ISABELNET_SA, @MorganStanley
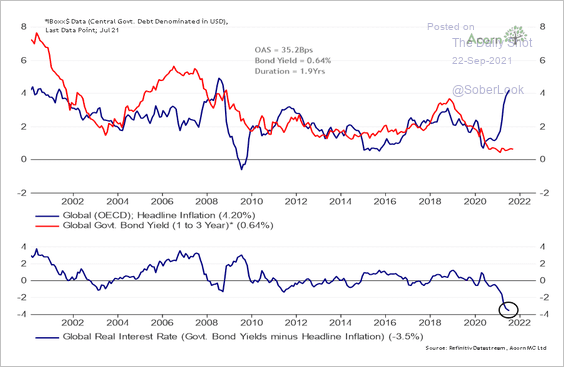
It’s a global trend.
 Source: @RichardDias_CFA
——————–
3. The X-date is coming next month. Democrats have the ability to lift the debt ceiling unilaterally through the reconciliation process, but the optics of raising the limit by $3.5 trillion may pose challenges for some politicians.
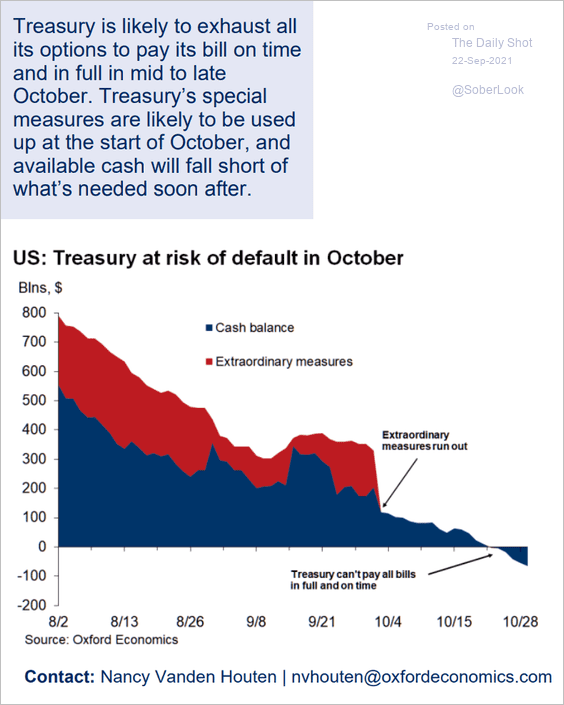 Source: Oxford Economics
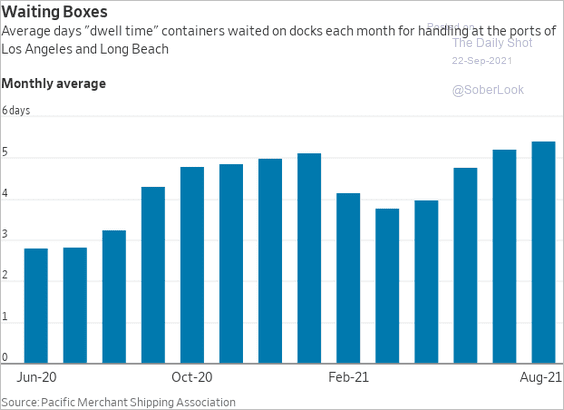
4. Import container wait times keep climbing.
 Source: @WSJ Read full article
5. Childcare has been a big issue during the pandemic and continues to keep many women out of the labor force.
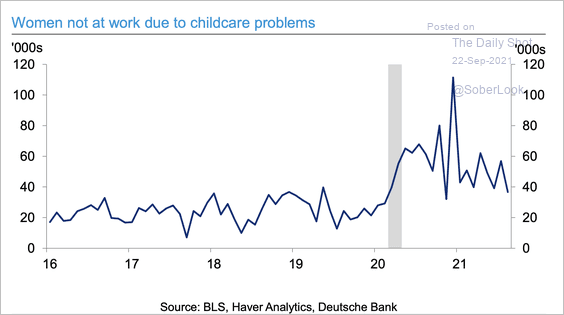 Source: Deutsche Bank Research
6. The 30+ day delinquency rate for credit cards is at a multi-year low.
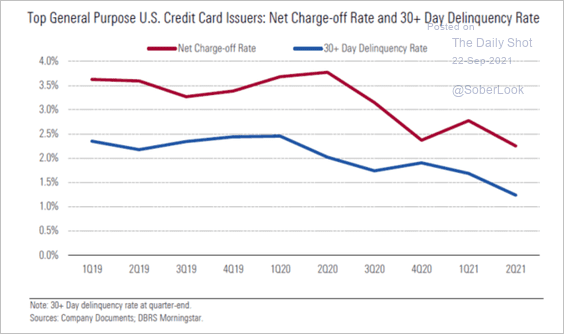 Source: DBRS Morningstar
Back to Index
Canada
1. Home price appreciation is now above 18%.
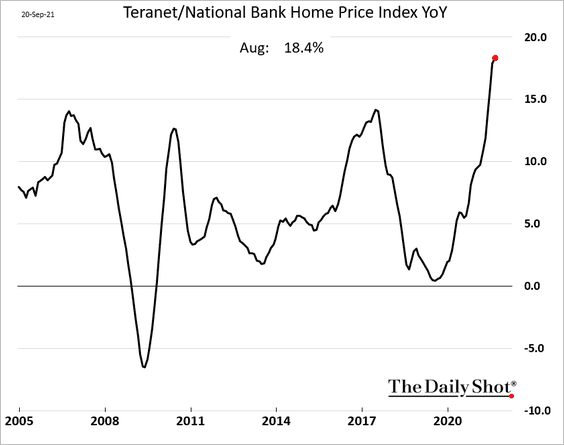
But home sales have been cooling.
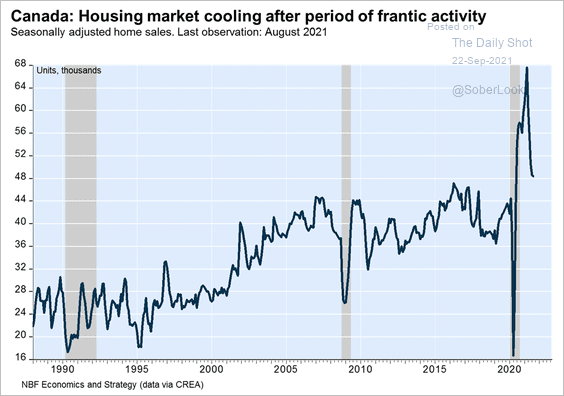 Source: Economics and Strategy Group, National Bank of Canada
——————–
2. Service-sector job recovery has some ways to go.
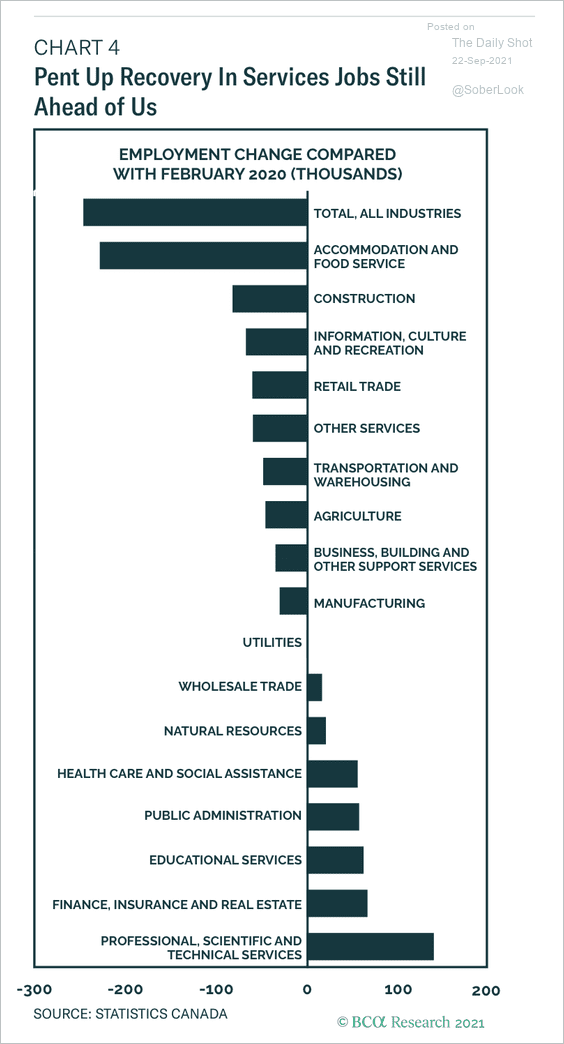 Source: BCA Research
3. Meet the new parliament …
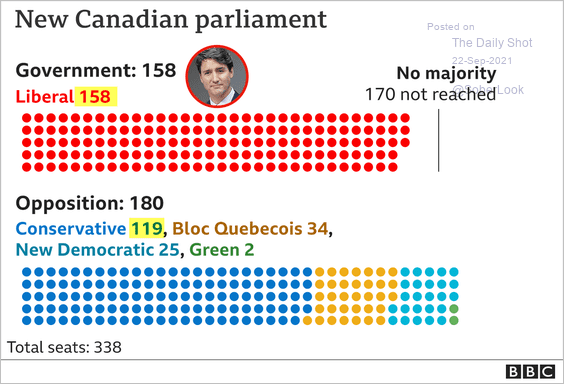 Source: BBC Read full article
…. the same as the old parliament (from 2019)? Was the election worth it?
 Source: The Guardian
4. Here are the Liberal Party’s thematic priorities.
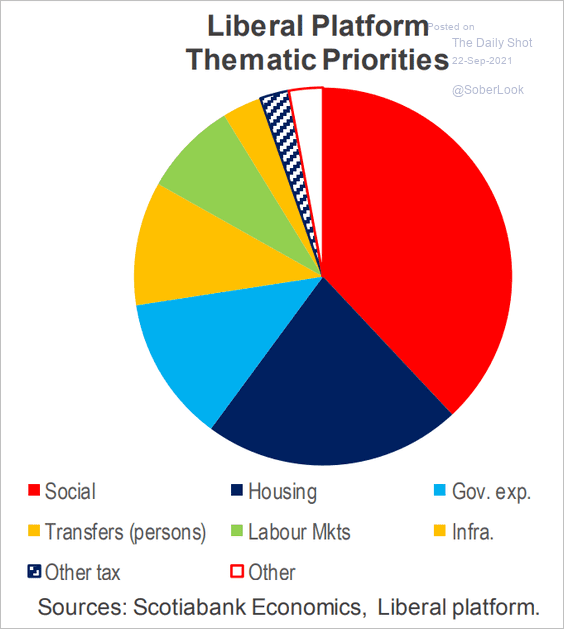 Source: Scotiabank Economics
Back to Index
The United Kingdom
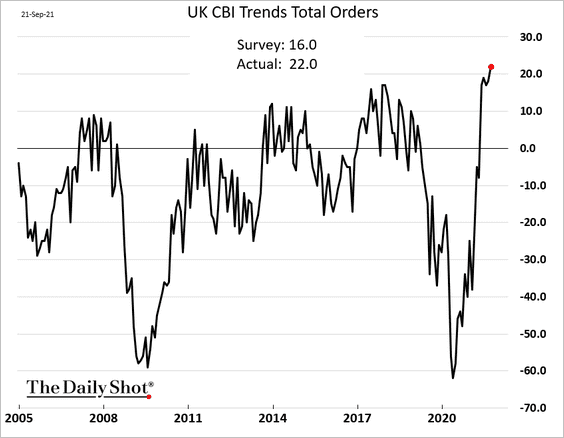
1. The CBI industrial orders index hit a record high this month.
 Source: Reuters Read full article
Will industrial production follow?
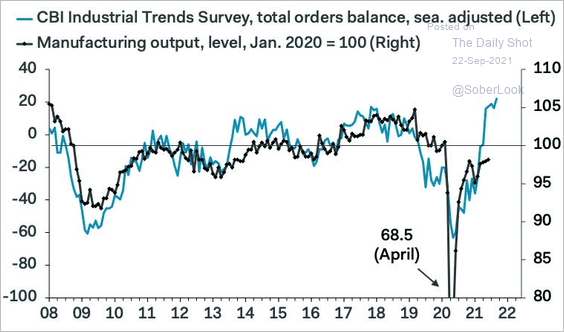 Source: Pantheon Macroeconomics
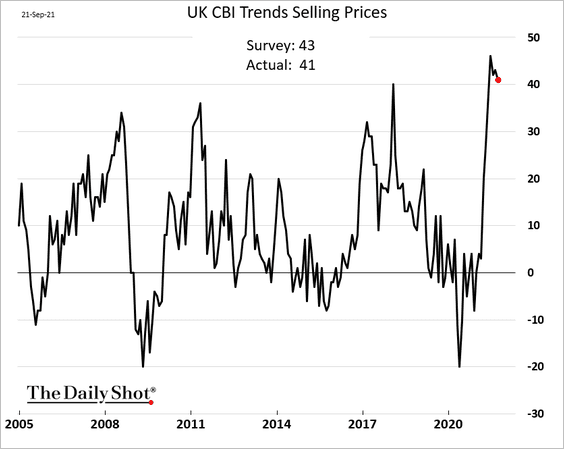
The index of selling prices remains near extremes but appears to have peaked.
——————–
2. The government borrowed more in August than economists expected.
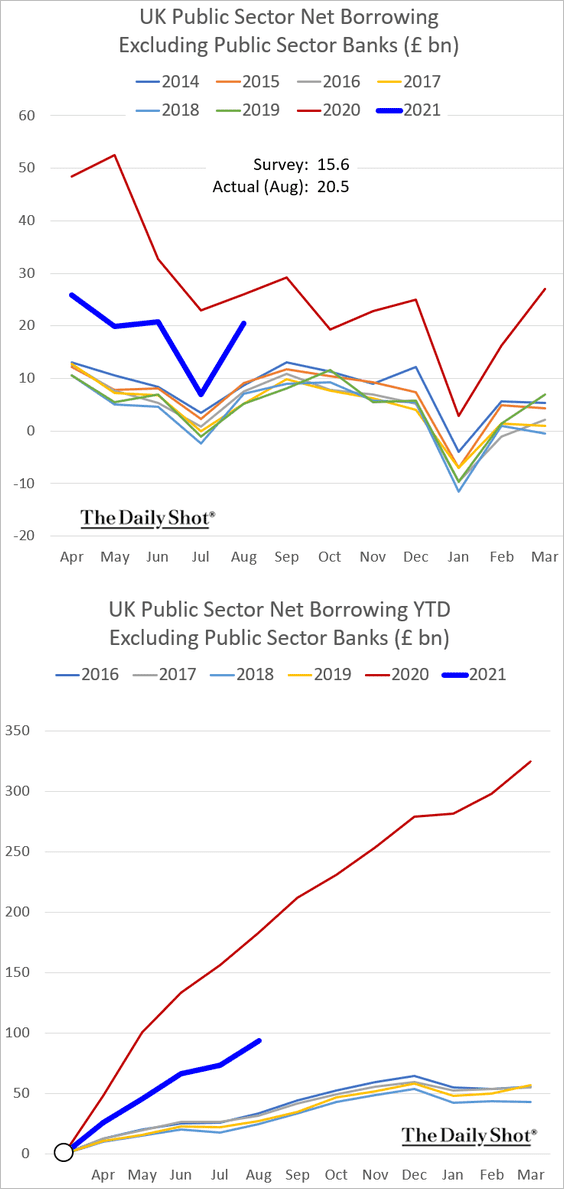
But the trend remains below the government’s forecasts.
 Source: Bloomberg Read full article
The debt-to-GDP ratio is at a multi-decade high.
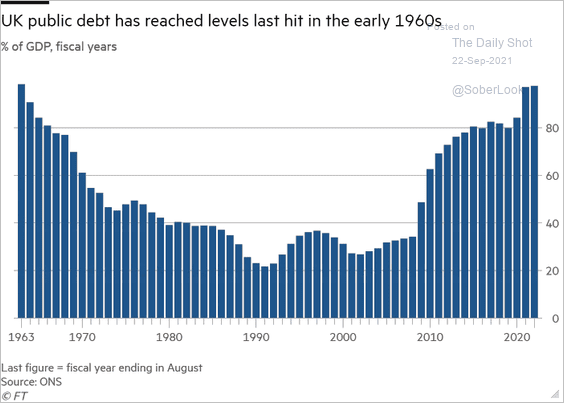 Source: @financialtimes Read full article
——————–
3. This chart shows the UK’s vaccinated population percentages by age.
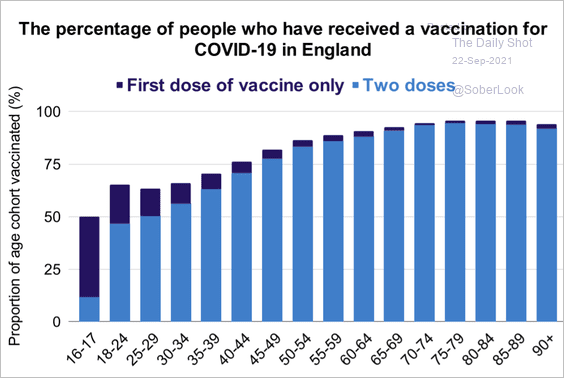 Source: UK Government Read full article
Back to Index
The Eurozone
1. The recent market volatility had a limited impact on bank credit spreads.
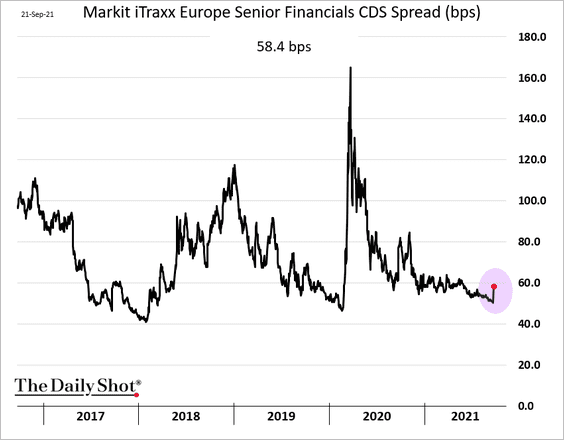 Source: Bloomberg
2. A significant increase in Bund issuance had no impact on yields.
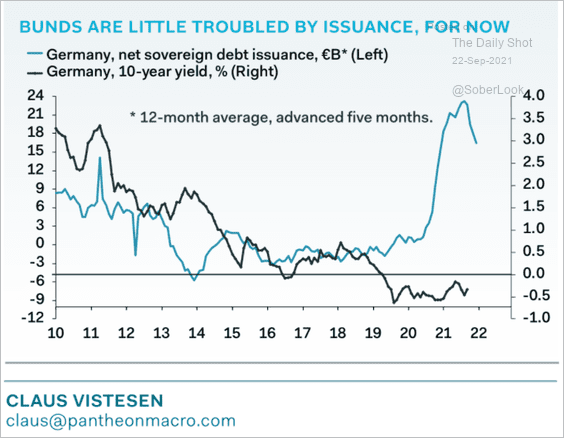 Source: Pantheon Macroeconomics
This scatterplot shows government bond spreads vs. credit ratings.
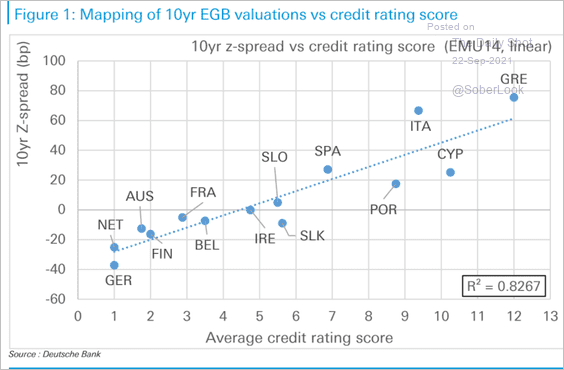 Source: Deutsche Bank Research
——————–
3. The “reopening” sector hiring rebound was not sustained.
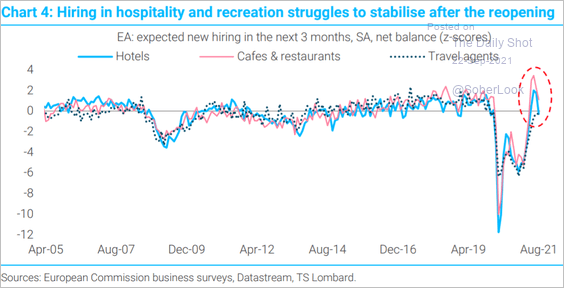 Source: TS Lombard
4. Barclays expects economic activity to return to pre-crisis levels next quarter, in line with the ECB.
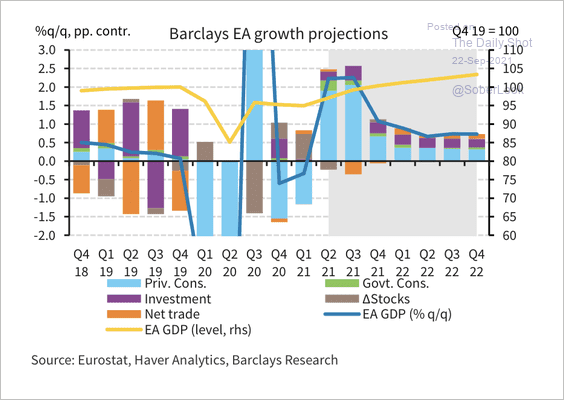 Source: Barclays Research
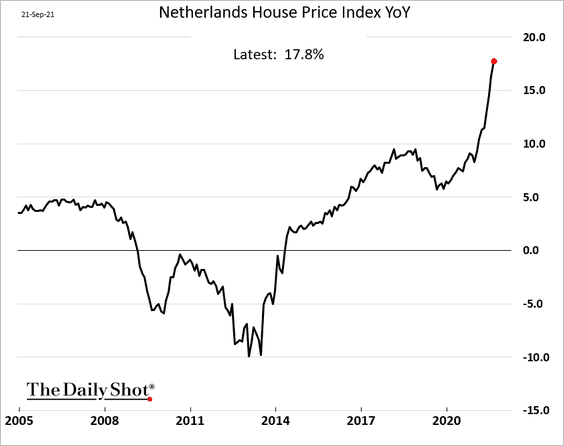
5. Home price gains in the Netherlands continue to accelerate.
Back to Index
China
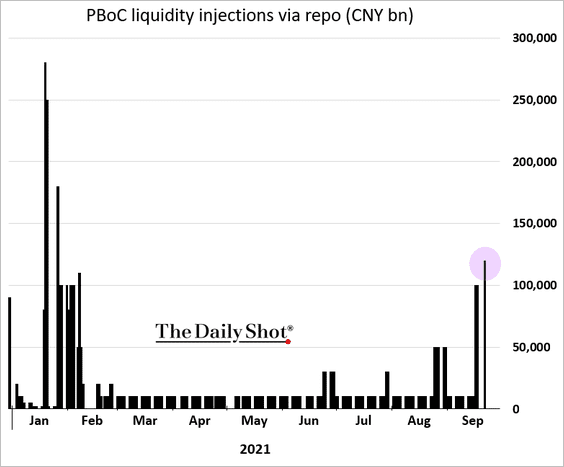
1. The PBoC injected more liquidity into the financial system.
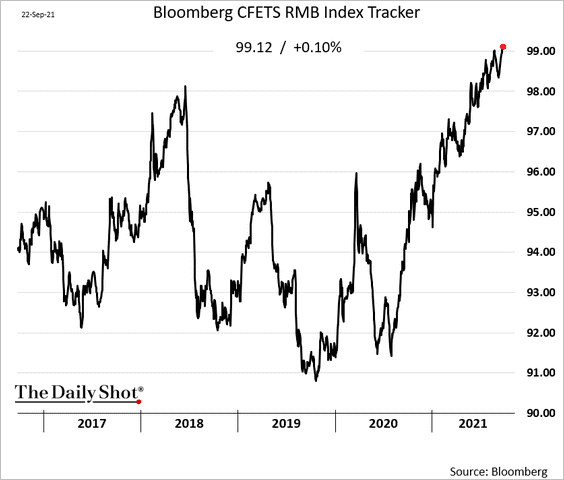
2. One of the headaches for China’s policymakers is the continued yuan strength (chart shows RMB vs. a basket of key currencies). This trend can have a substantial drag on economic growth.
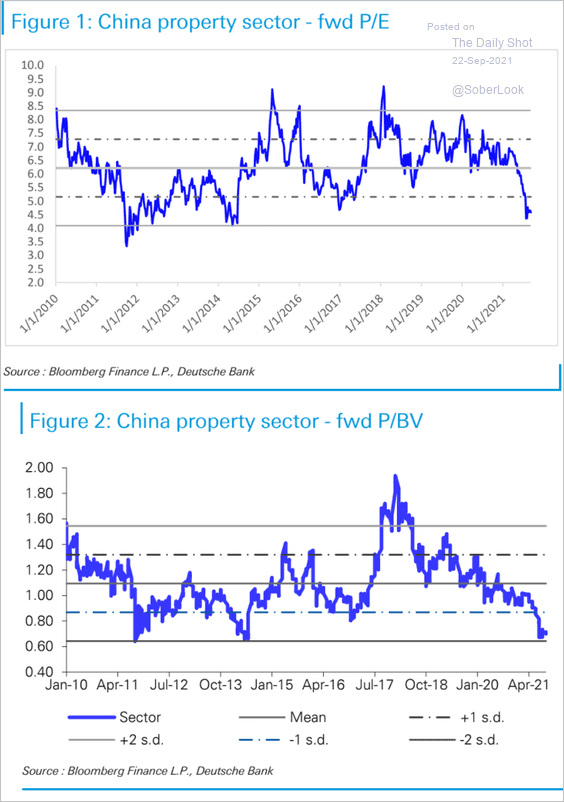
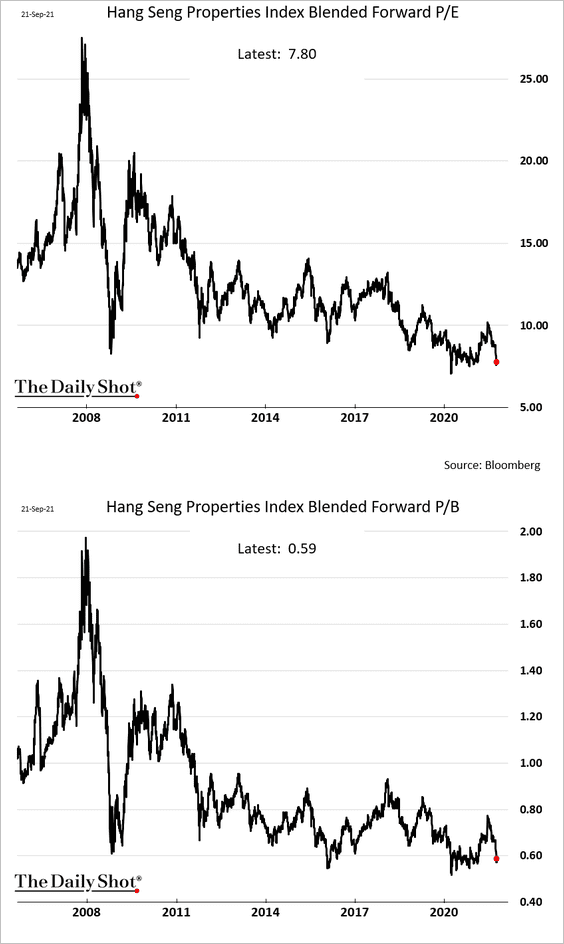
3. Property sector valuations are near extreme lows (charts show forward price-to-earnings and price-to-book ratios).
 Source: Deutsche Bank Research
• Hong-Kong-listed firms:
——————–
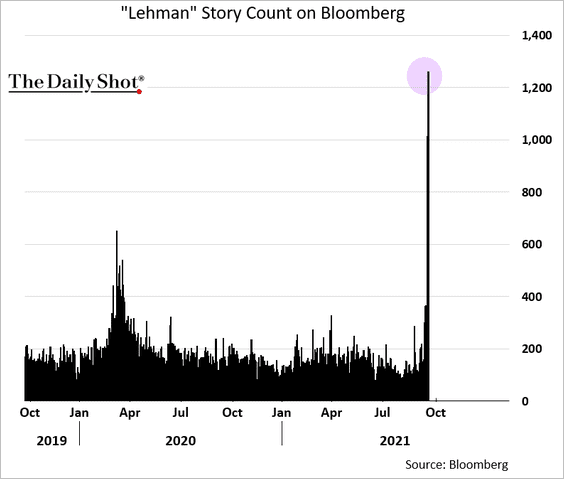
4. Stories mentioning “Lehman” (in reference to Evergrande) spiked recently.
 h/t @daniburgz
5. China’s housing market is not oversupplied (2 charts).
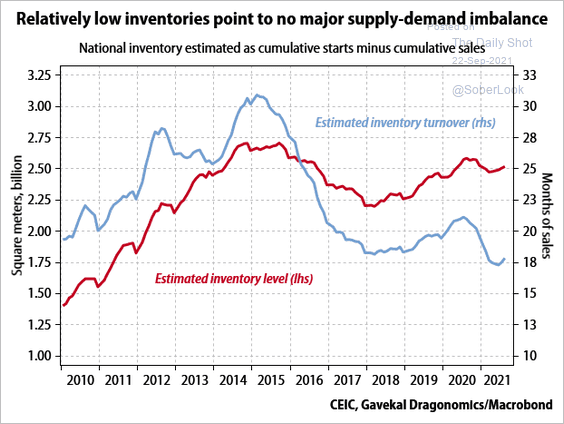 Source: Gavekal Research
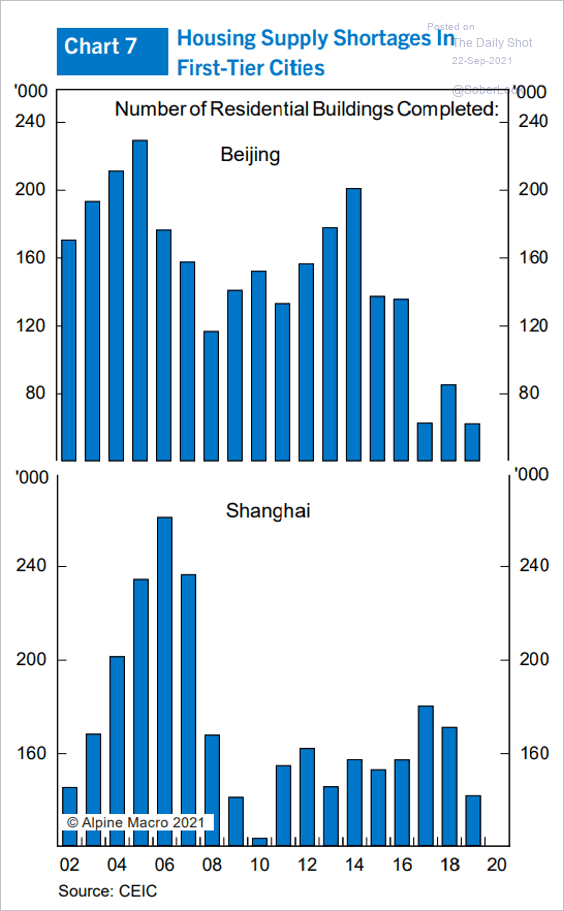 Source: Alpine Macro
——————–
6. There is no rebound in Macau’s visitor numbers.

Back to Index
Emerging Markets
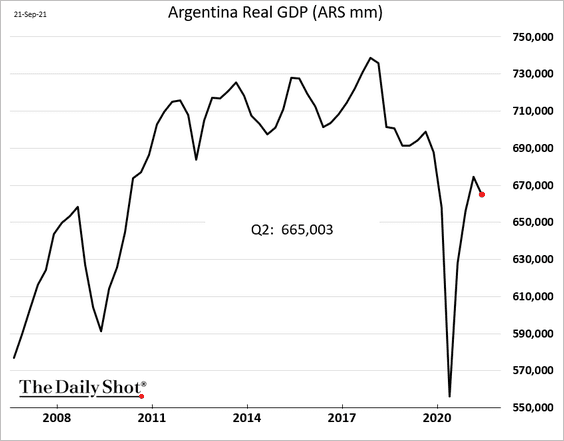
1. Argentina’s GDP slumped in the second quarter.
2. This chart shows the Oxford Economics forecast for LatAm GDP growth through the end of next year.
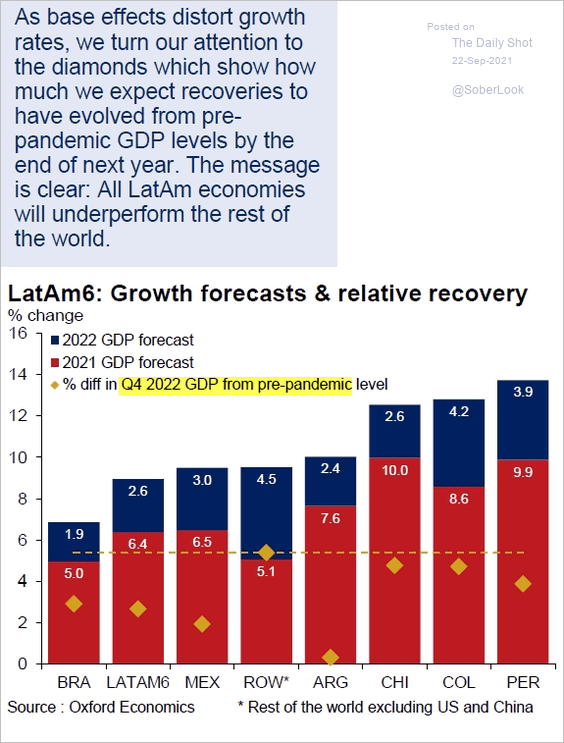 Source: @OxfordEconomics Read full article
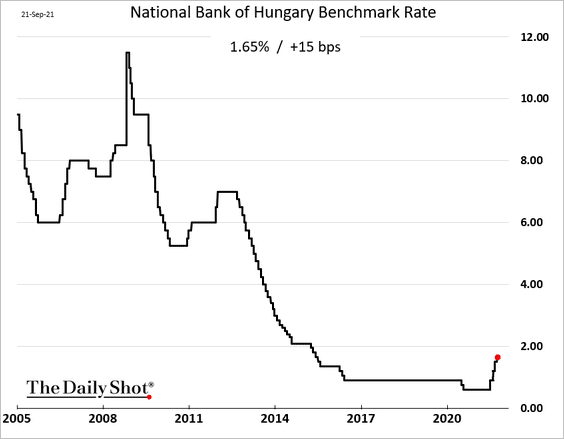
3. Hungary’s central bank hiked rates by 15 bps (25 bps was expected). These types of indecisive moves tend to confuse the market.
4. Herd immunity via vaccination hasn’t worked well in Israel, with new cases surpassing previous peaks.
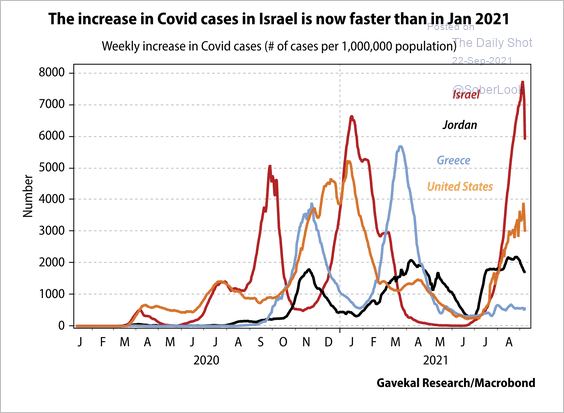 Source: Gavekal Research
Back to Index
Cryptocurrency
1. ETH tends to perform best during the New York and London market hours relative to Hong Kong hours.
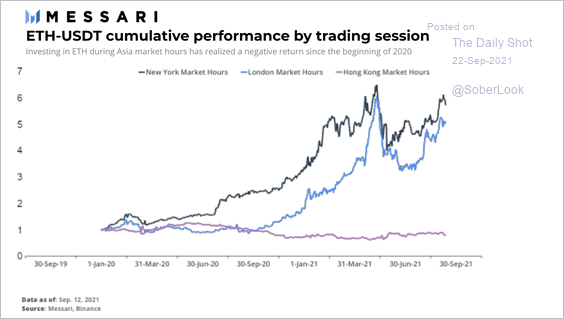 Source: Messari
2. Bitcoin has outperformed the S&P 500 and gold year-to-date, although its correlation with equities has increased over the past few months.
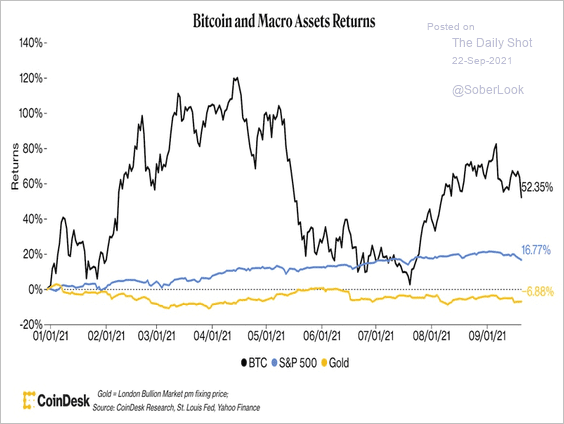 Source: CoinDesk Read full article
3. This chart shows bitcoin’s sharp drawdowns versus the S&P 500 and gold.
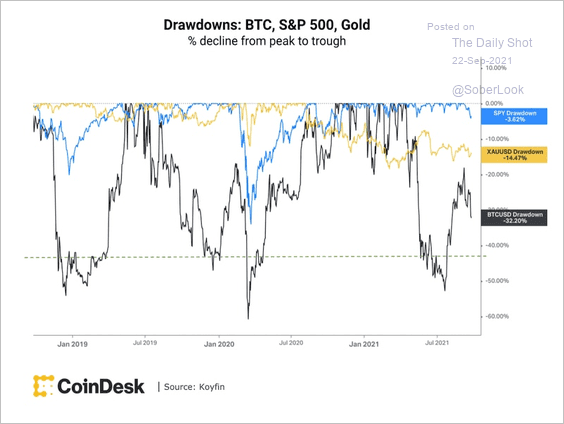 Source: CoinDesk Read full article
4. The realized net loss of all moved BTC over time is the largest since June 25 when bitcoin was trading around $31,600, according to blockchain data.
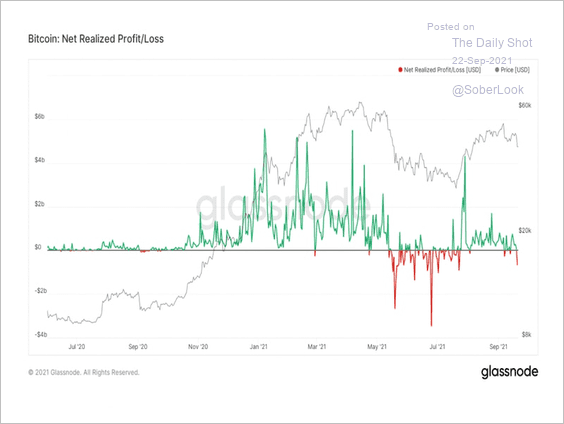 Source: @glassnode
5. SEC Chairman Gary Gensler had some tough words for stablecoins.
 Source: CoinDesk Read full article
Back to Index
Commodities
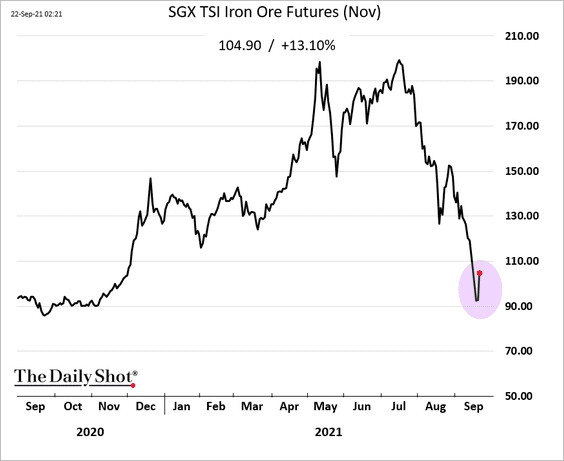
1. Iron ore futures found support.
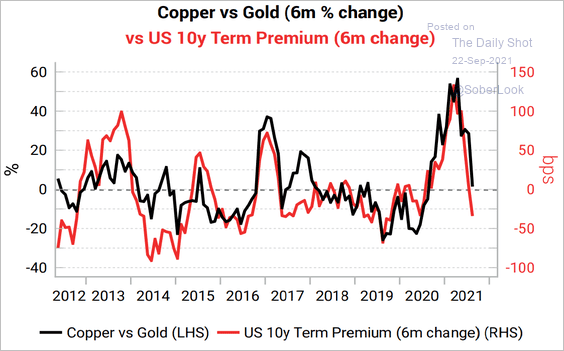
2. The copper-to-gold ratio movements tend to be correlated with the 10yr Treasury term premium.
 Source: Variant Perception
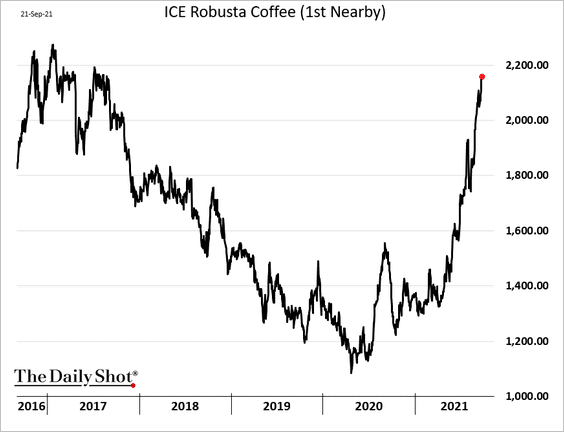
3. Robusta coffee futures have been surging.
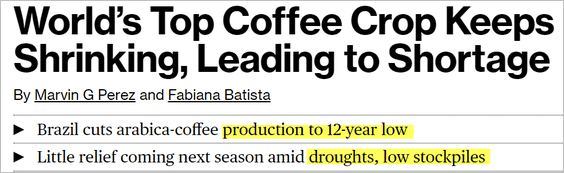 Source: @markets Read full article
Back to Index
Energy
1. The NYMEX natural gas one-year futures spread as a percent of the first contract price is nearing a peak, which typically precedes a pullback in price.
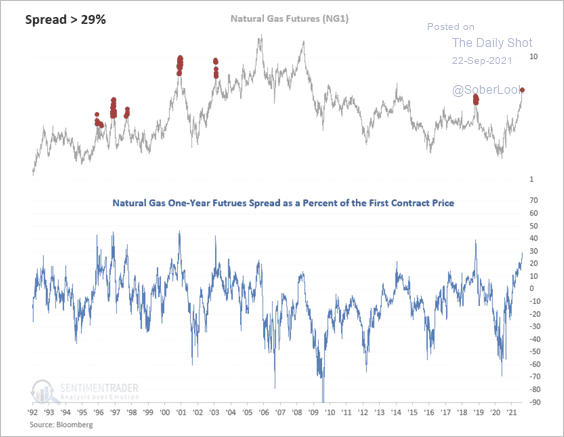 Source: SentimenTrader
2. Russia’s oil exports have been relatively soft.
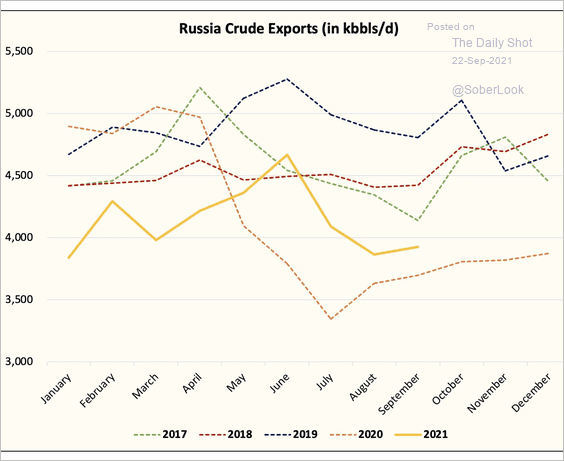 Source: @HFI_Research
3. This chart shows the options market-based probability distribution for WTI prices in December.
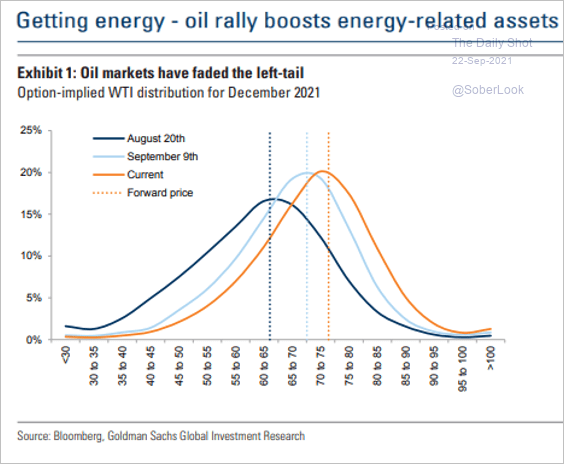 Source: Goldman Sachs
Back to Index
Equities
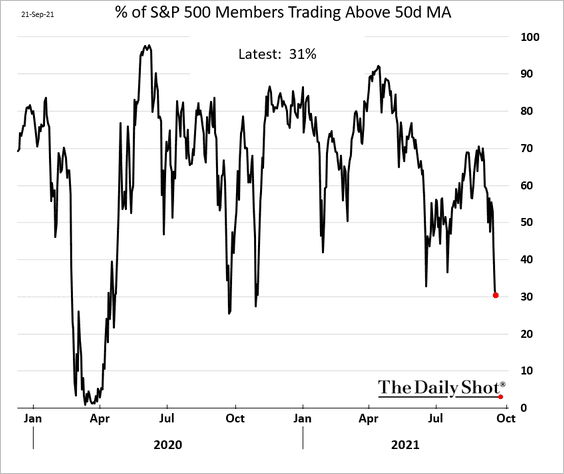
1. Only 31% of S&P 500 members now trade above their 50-day moving average.
2. Nearly 1,600 more stocks in the Russell 2,000 small-cap index declined than advanced on Monday. This is only the sixth time in the past year when selling pressure was so overwhelming.
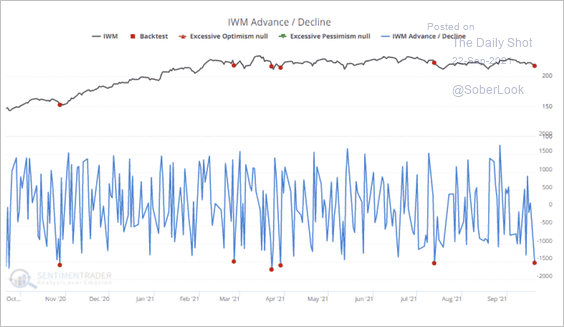 Source: SentimenTrader
3. The latest drawdown has been relatively modest (2 charts).
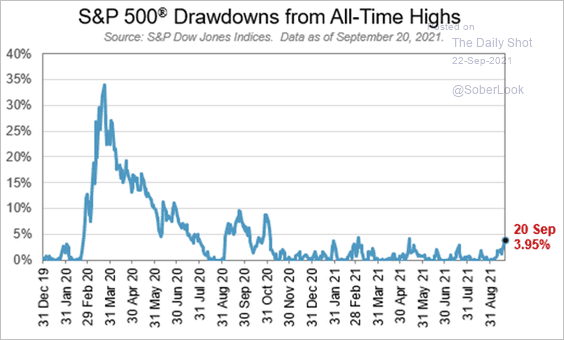 Source: S&P Global Market Intelligence
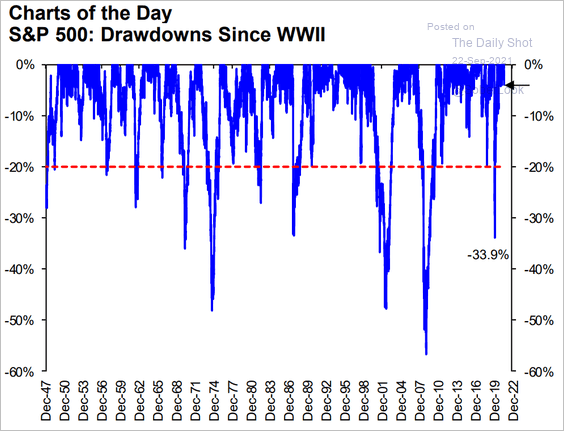 Source: Scotiabank Economics
——————–
4. The Fear & Greed index is near the lows for the year (a bullish sign).
 Source: CNN Business
5. Companies with weak balance sheets have been underperforming since June.

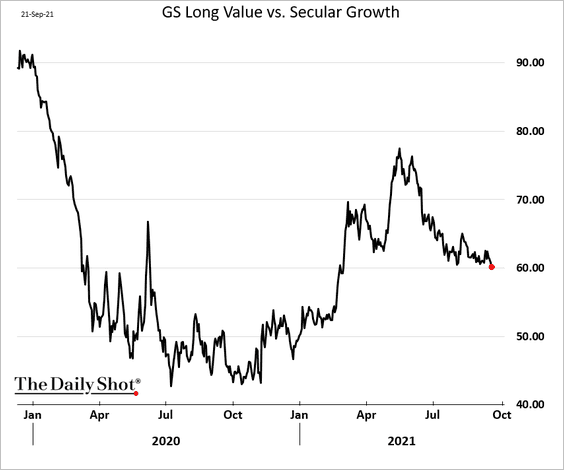
6. Related to the trend above, value stocks have been underperforming growth.
7. Is the slowing momentum in global economic growth going to pull share prices lower?
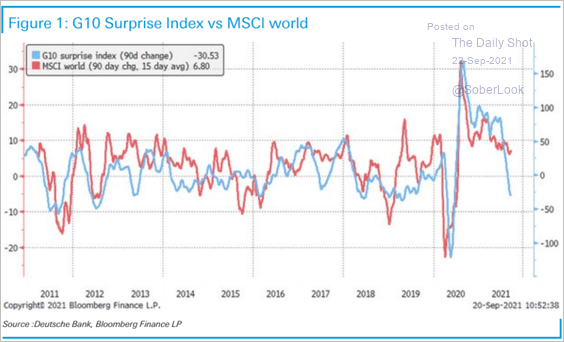 Source: Deutsche Bank Research
8. Defensive sectors are seeing net inflows versus cyclical sectors.
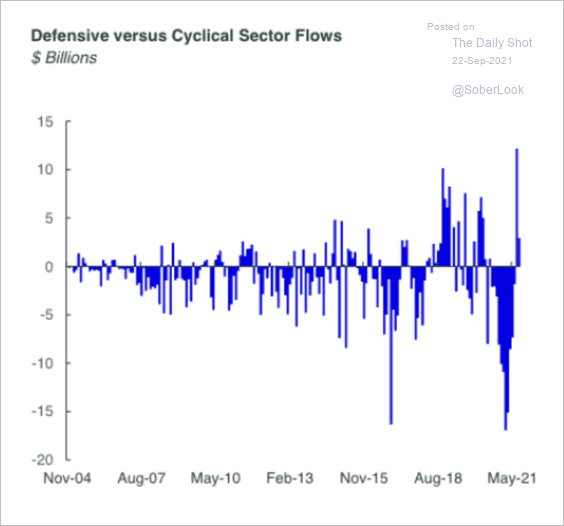 Source: SPDR Americas Research, @mattbartolini
9. This chart shows US stock ownership distribution over time.
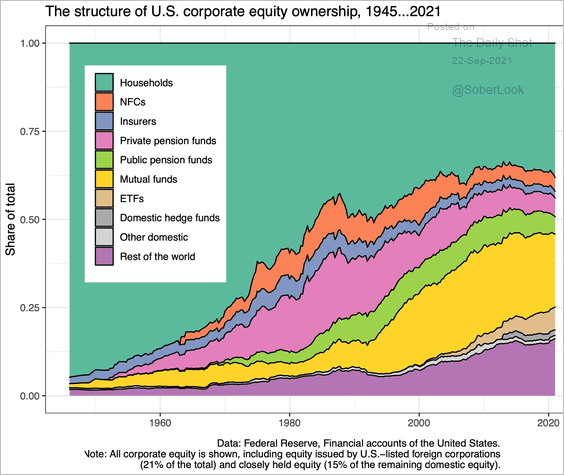 Source: @BJMbraun
Back to Index
Global Developments
1. Capital Economics expects interest rate differentials to provide further support for the dollar, especially against the euro, yen, and renminbi.
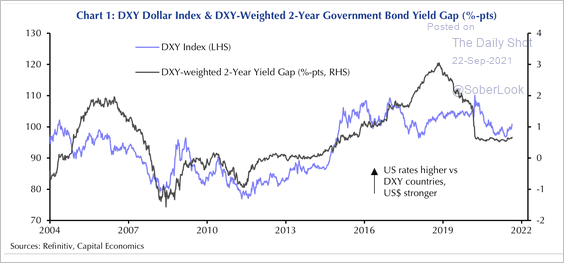 Source: Capital Economics
2. Here is the US dollar’s sensitivity to different market variables.
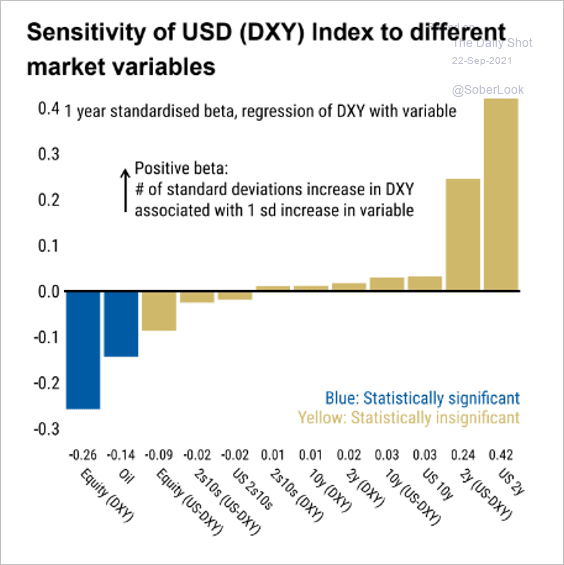 Source: Morgan Stanley Research
3. Inflation rates around the world have generally converged in the last few decades.
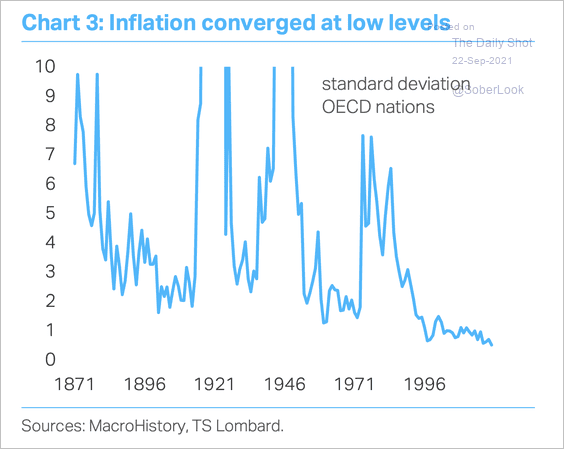 Source: TS Lombard
——————–
Food for Thought
1. Which payments will be held up first if the US debt ceiling is not raised?
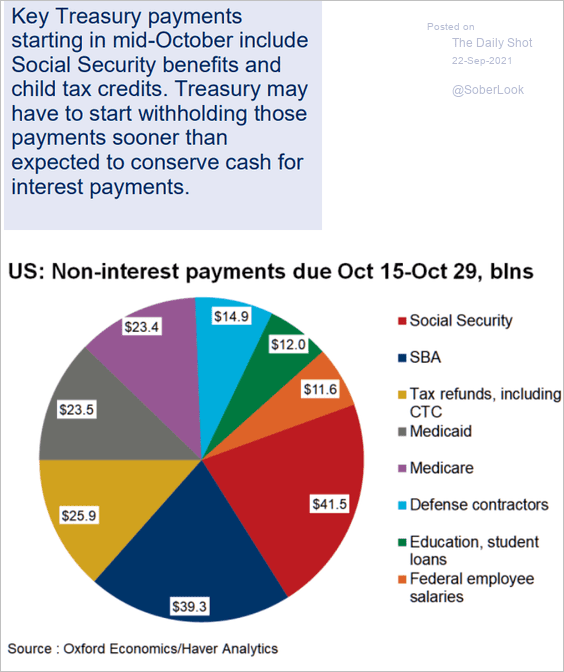 Source: Oxford Economics
2. The impact of COVID relief programs on US GDP:
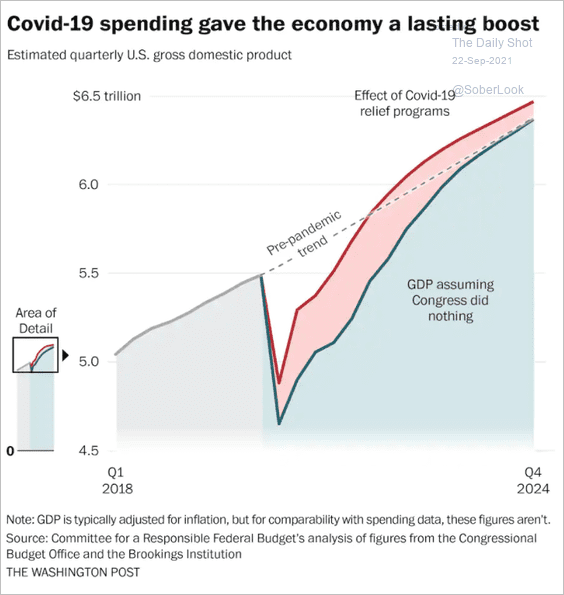 Source: The Washington Post Read full article
3. Intangible capital investments’ impact on productivity:
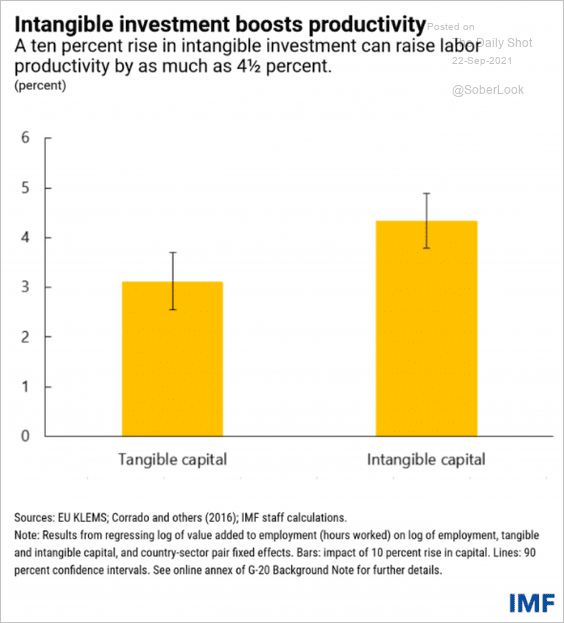 Source: IMF Read full article
4. US financial assets relative to GDP:
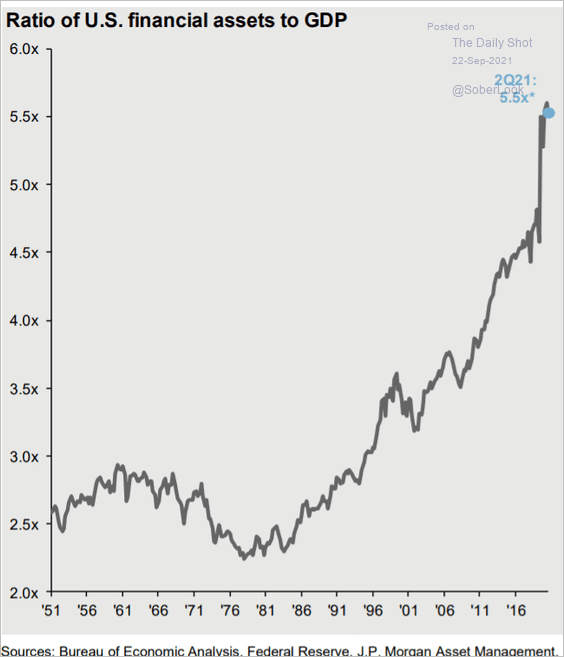 Source: J.P. Morgan Asset Management
5. US household cash deposits:
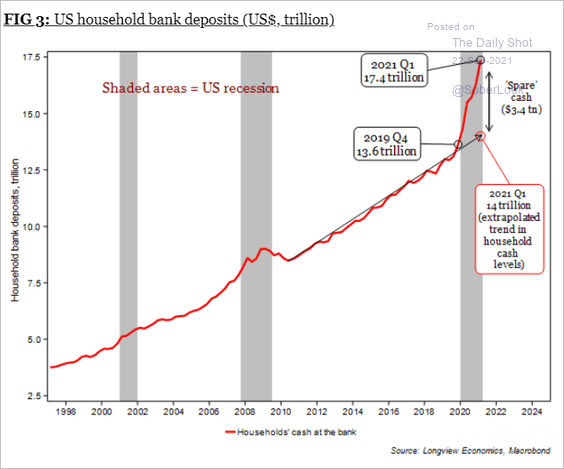 Source: Longview Economics
6. Utility costs by state:
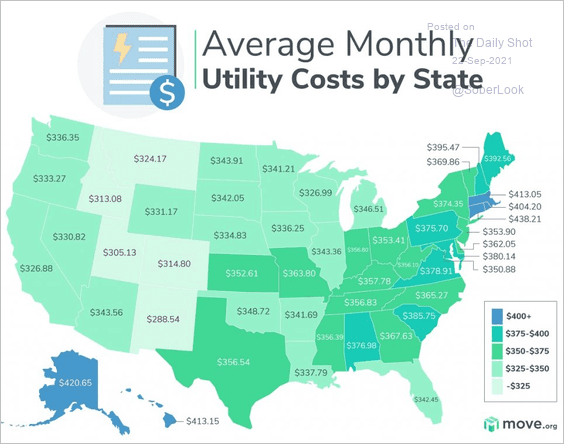 Source: Move.org; h/t @HTLasVegas, @rcgeconomics
7. Approved number of Afghan refugees:
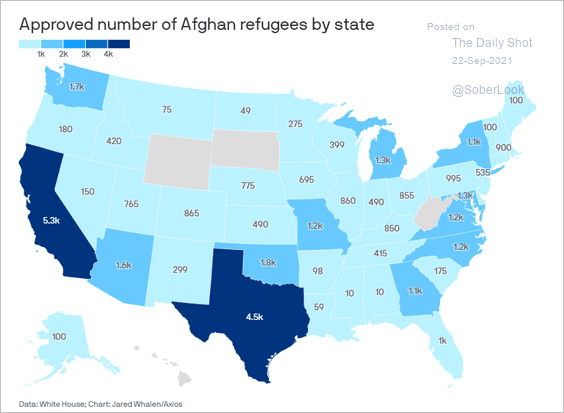 Source: @axios Read full article
8. Weight Watchers subscribers over time:
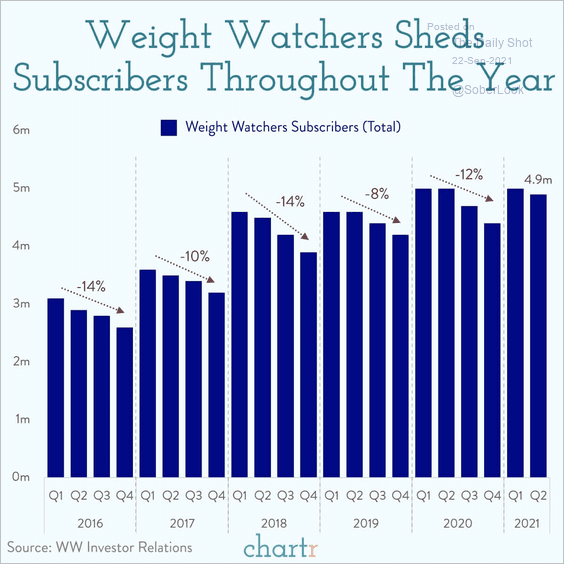 Source: @chartrdaily
9. Plastic in the ocean:
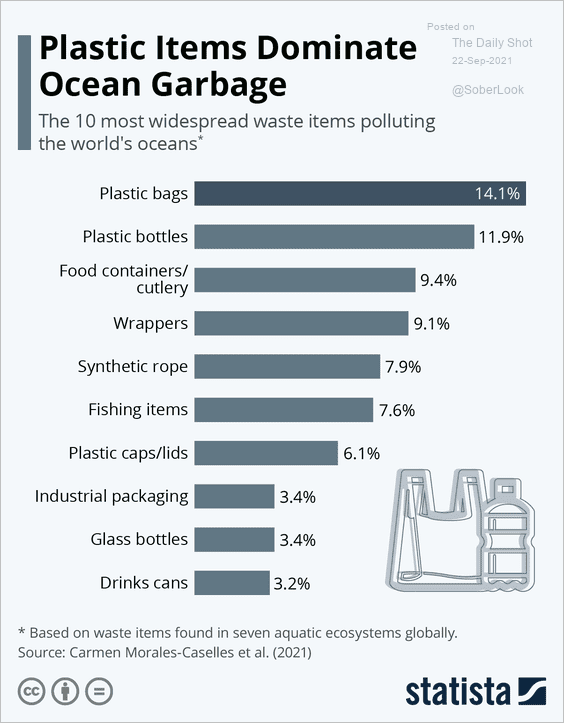 Source: Statista
10. Professionally-graded sports trading card prices vs. the S&P 500, since 2008:
 Source: PWCC, h/t III Capital Management
——————–
Back to Index