
The Daily Shot: 29-Sep-21
• The United States
• Canada
• The United Kingdom
• The Eurozone
• Europe
• China
• Emerging Markets
• Cryptocurrency
• Energy
• Equities
• Rates
• Global Developments
• Food for Thought
The United States
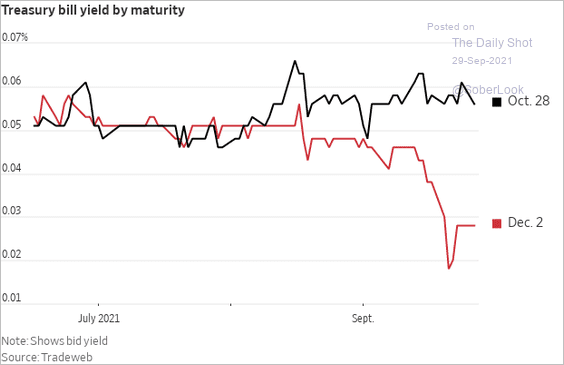
1. The risk of a technical default remains priced into the Treasury curve, which is inverted at the short end.
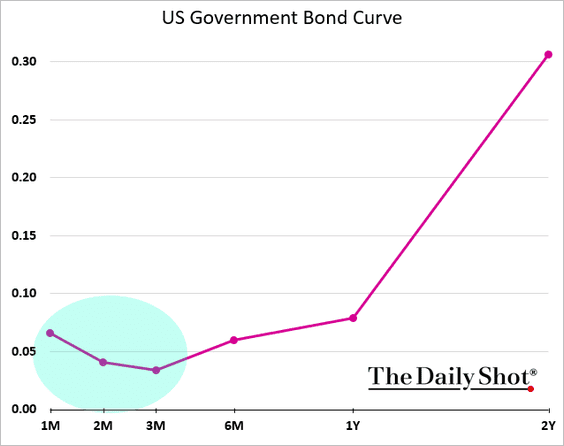
Bills maturing next month (the expected X-Date) are trading at a discount. Longer-dated bills are yielding less because the market expects the situation to be resolved by then.
 Source: @WSJ Read full article
——————–
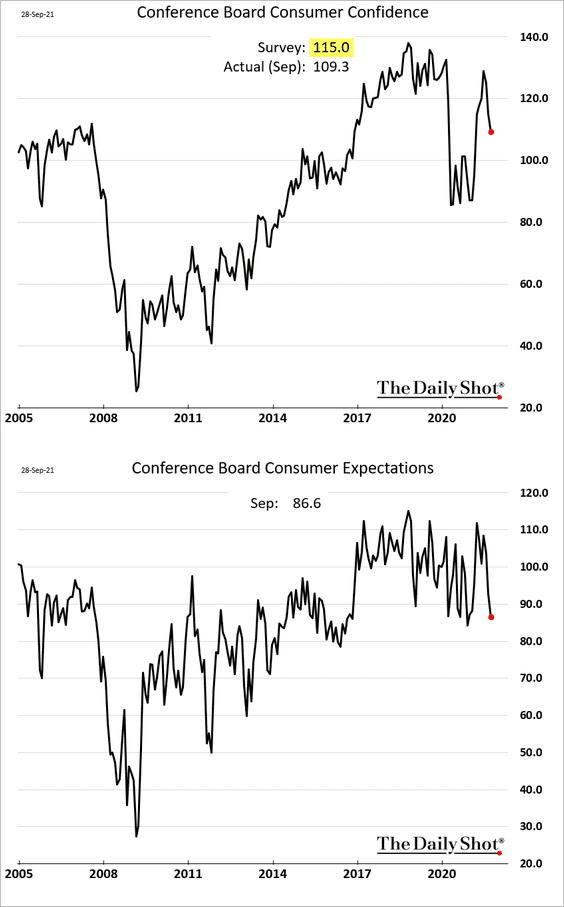
2. The Conference Board’s consumer confidence index surprised to the downside. Analysts blame it on the Delta variant – in which case we should see an improvement soon.
 Source: Reuters Read full article
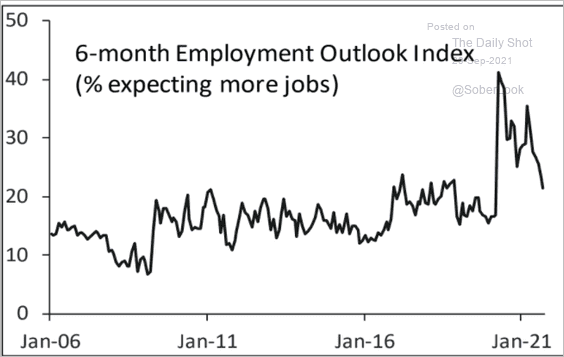
The labor differential (“jobs plentiful” – “jobs hard to get”) remains elevated, pointing to robust hiring activity.
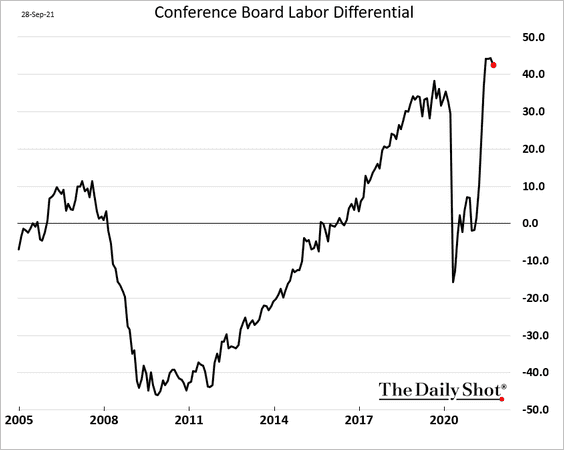
However, consumers are less certain about jobs going forward.
 Source: Piper Sandler
——————–
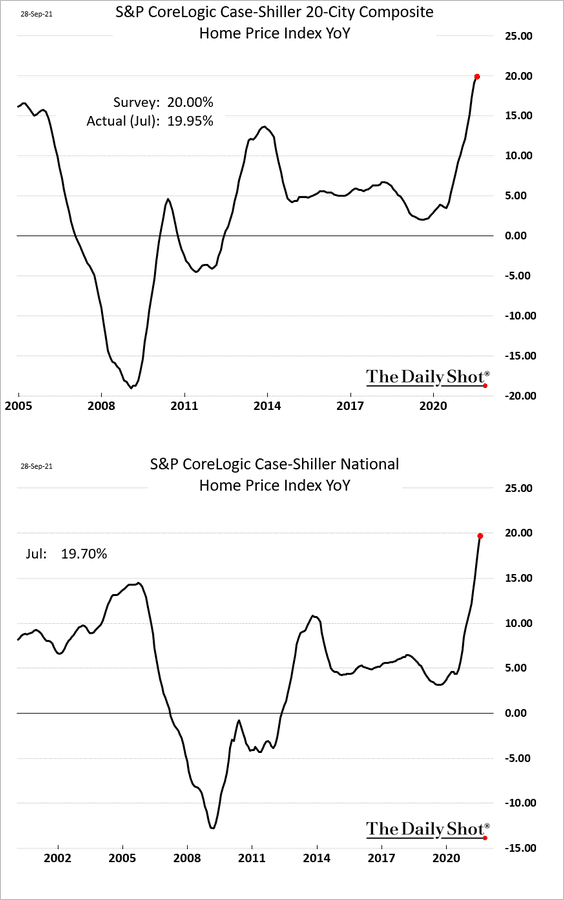
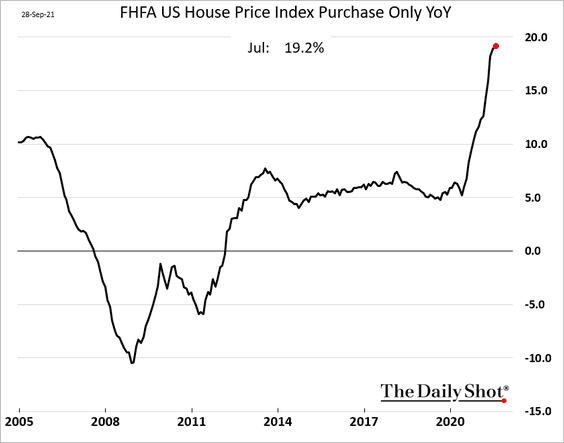
3. Home price appreciation approached 20% in July.
Here is the housing price index from FHFA.
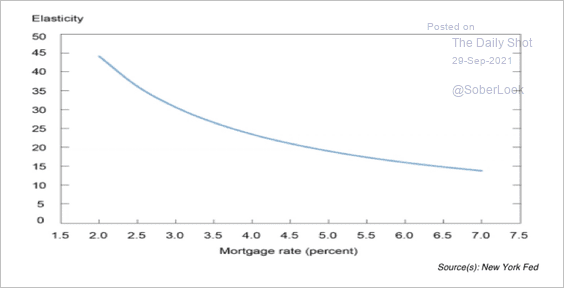
The divergence between home prices and wages is nearing extremes, making the housing market more vulnerable to higher mortgage rates.
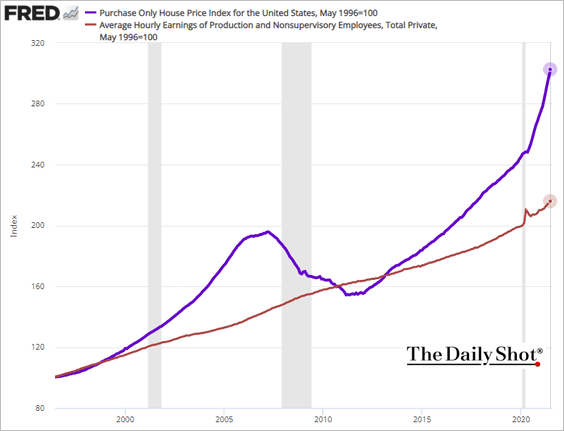
Moreover, housing prices are more sensitive to interest rate changes at lower rates.
 Source: III Capital Management
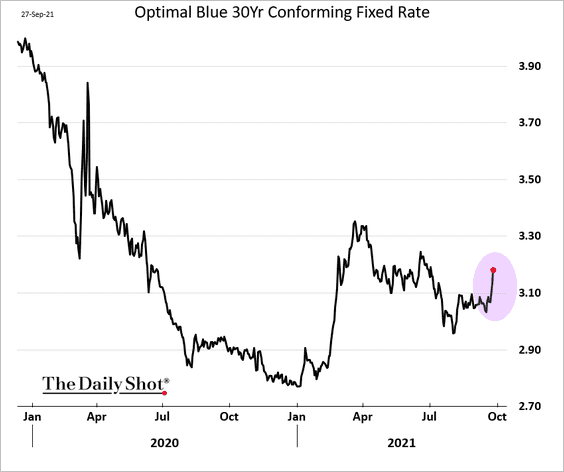
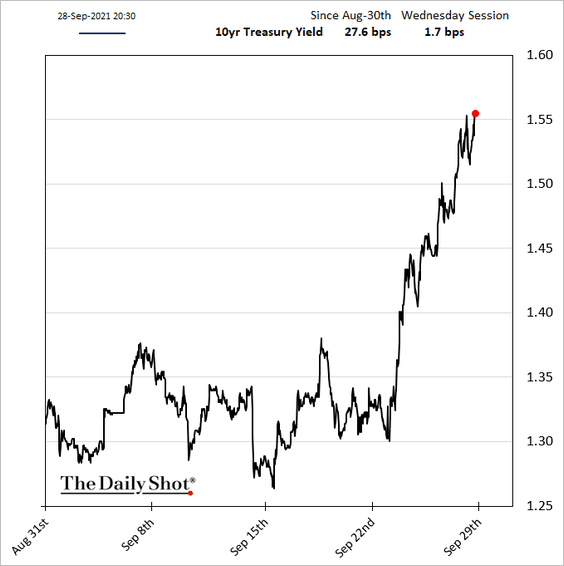
By the way, mortgage rates increased this week as Treasury yields climbed.
——————–
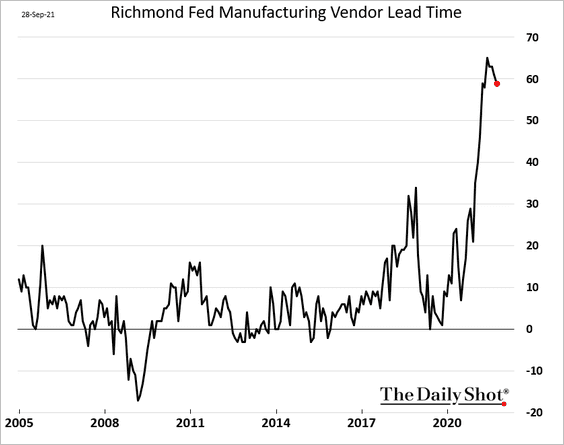
4. The Richmond Fed’s manufacturing index slumped this month.
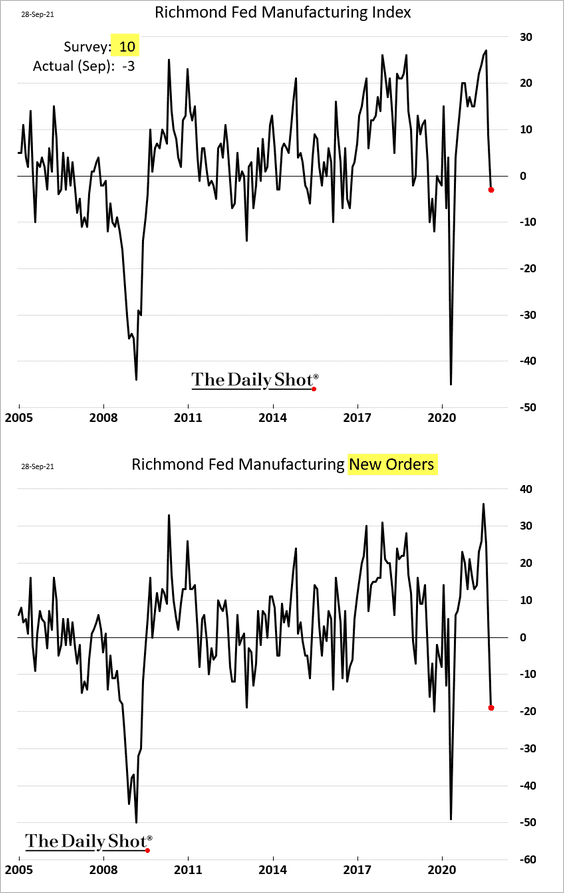
 Source: MarketWatch Read full article
Related to the trend above, the Evercore ISI business survey diffusion index shows softening activity for industrial firms.
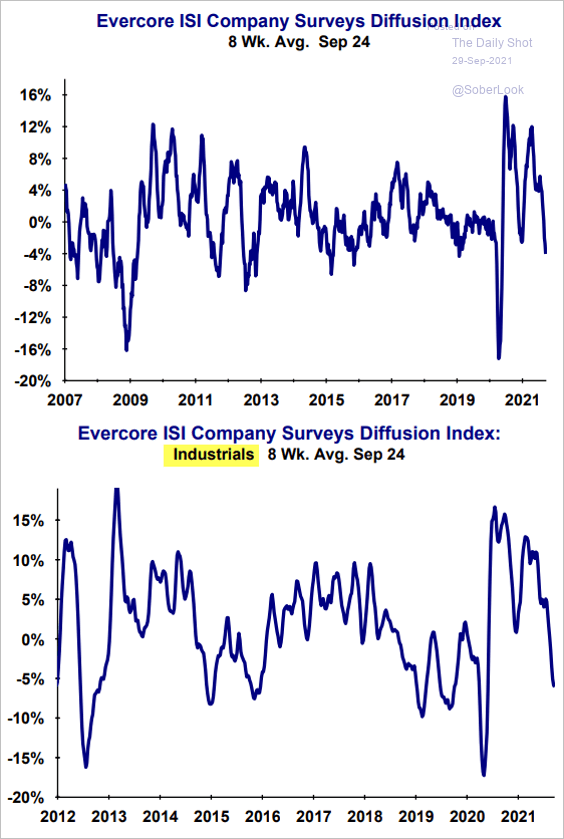 Source: Evercore ISI
Supply bottlenecks remain extreme, but the index of vendor lead times appears to have peaked.
Price pressures have been getting worse.
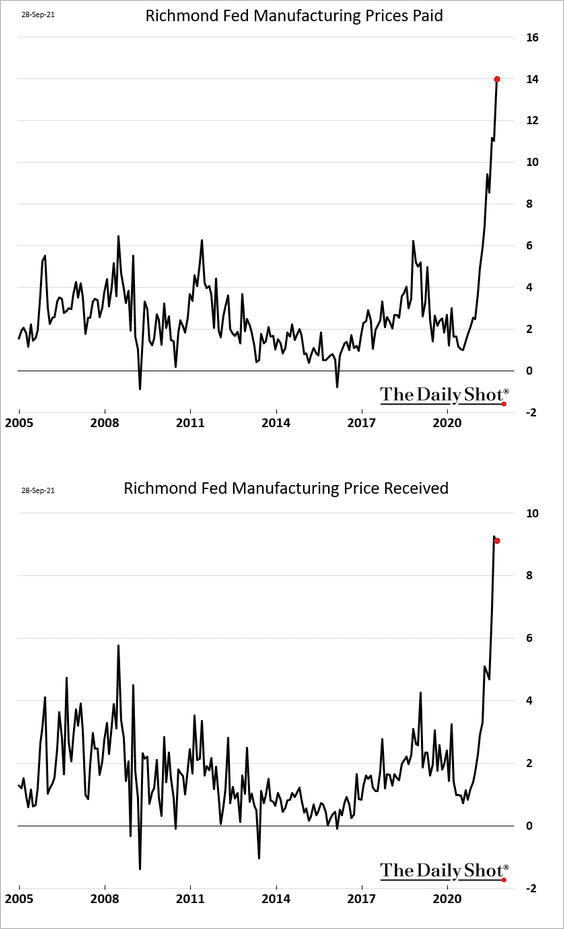
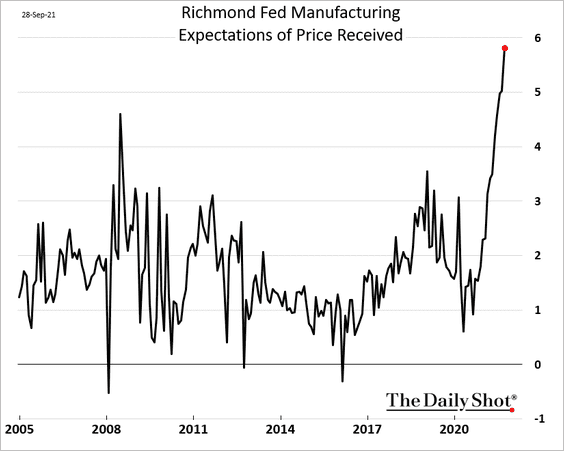
And factories expect to keep hiking prices in the months ahead.
——————–
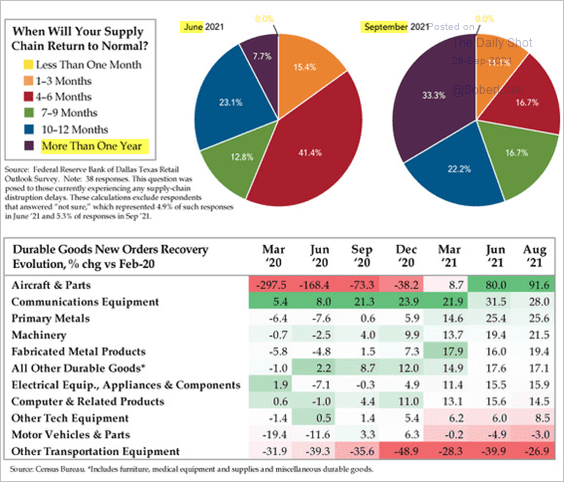
5. Companies now see supply chain issues as persisting for some time.
 Source: The Daily Feather
Shipping to the US has experienced far higher rates than other routes.
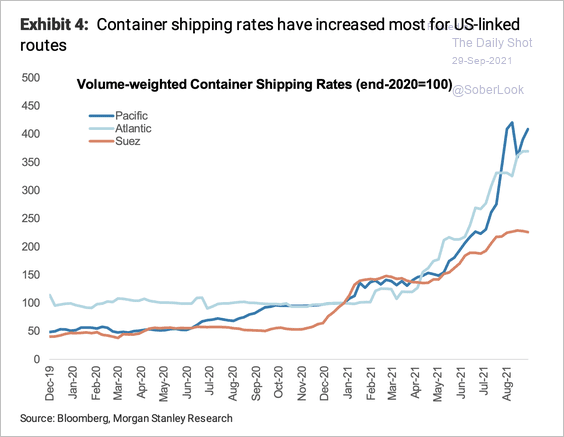 Source: Morgan Stanley Research
——————–
6. The Atlanta Fed’s GDPNow model forecast for Q3 GDP growth continues to move lower.
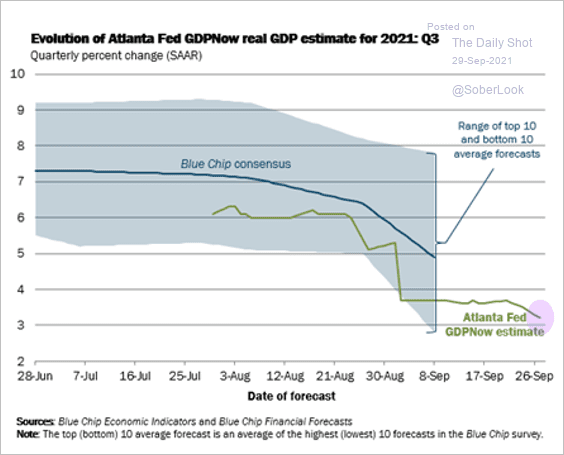 Source: Atlanta Fed
We also see this trend in the betting markets.
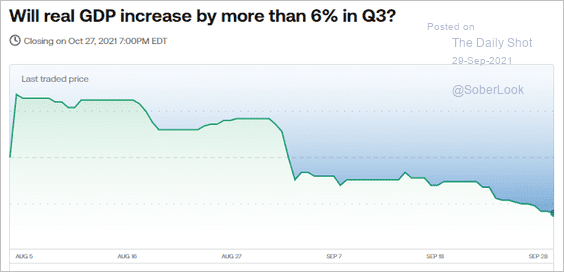 Source: Kalshi
——————–
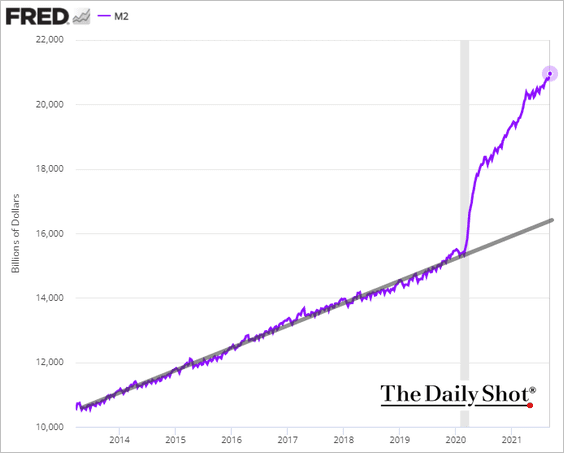
7. The M2 money supply shows plenty of “excess” liquidity in the economy (about $4.5 trillion above the pre-COVID trend).
Back to Index
Canada
1. Increasingly, small businesses expect to boost prices by 6% or more.
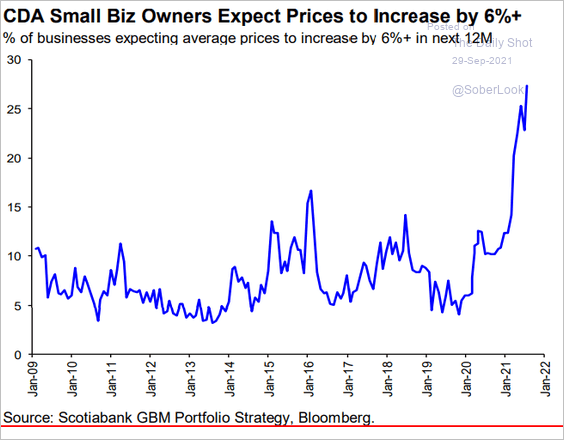 Source: Hugo Ste-Marie, Portfolio & Quantitative Strategy Global Equity Research, Scotia Capital
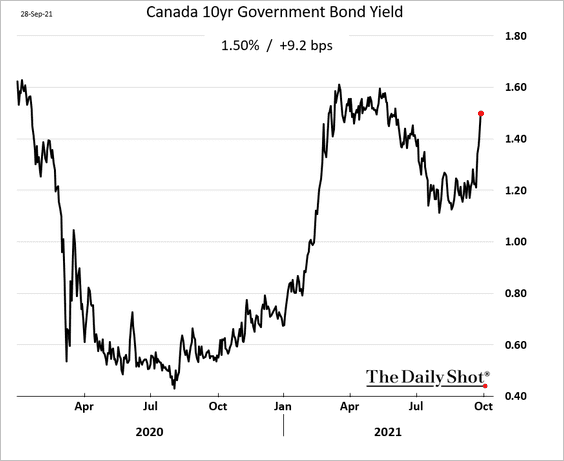
2. Bond yields have been climbing.
Back to Index
The United Kingdom
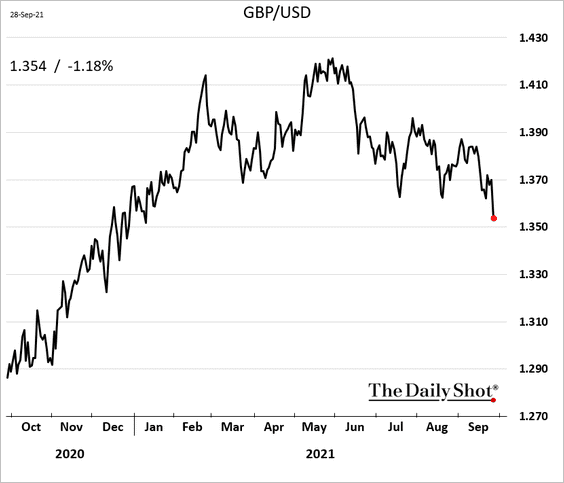
1. The pound sold off on Tuesday.
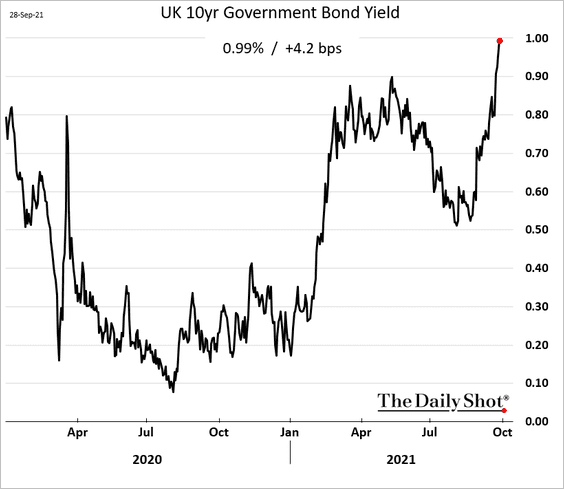
• Gilt yields keep moving higher.
Will higher rate differentials with the Eurozone (white line) put downward pressure on EUR/GBP?
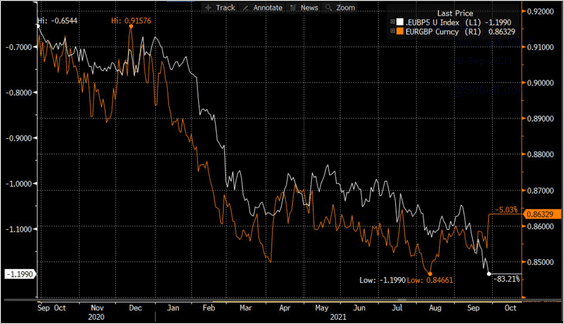 Source: @jnordvig
——————–
2. Next, we have some EV trends in the UK.
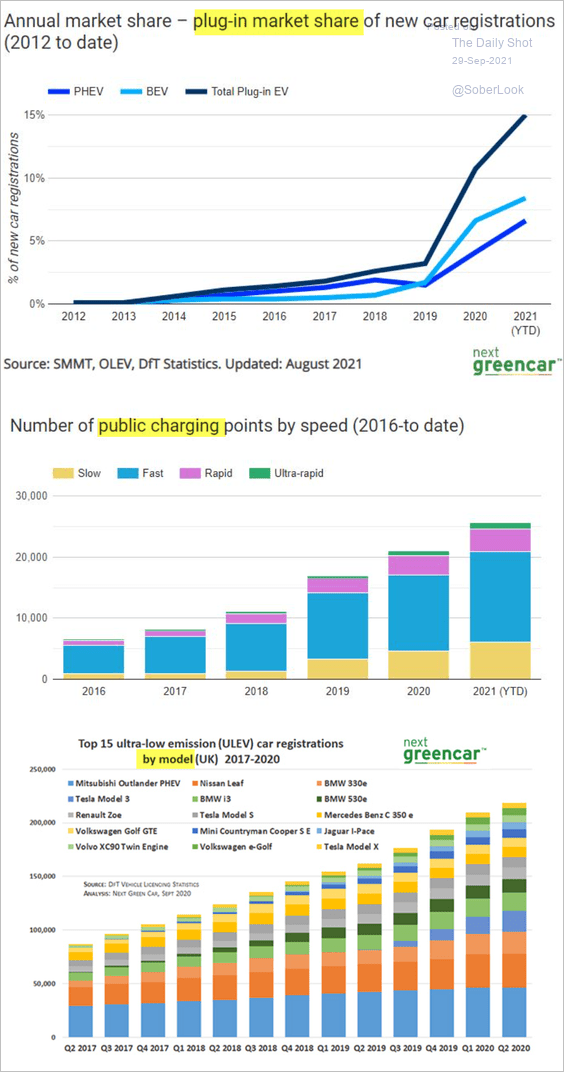 Source: Next Green Car Read full article
Back to Index
The Eurozone
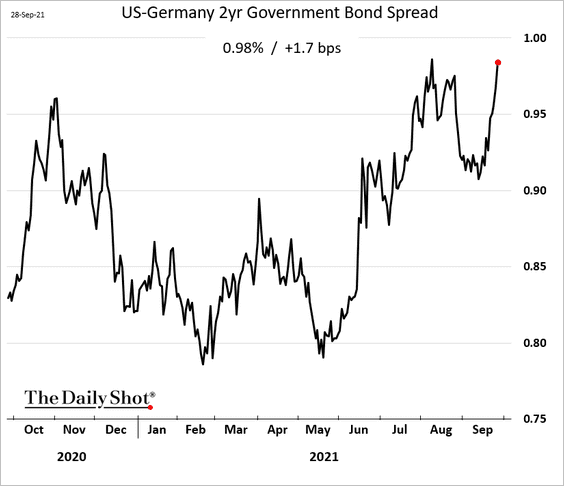
1. The euro is trading near 2021 lows.
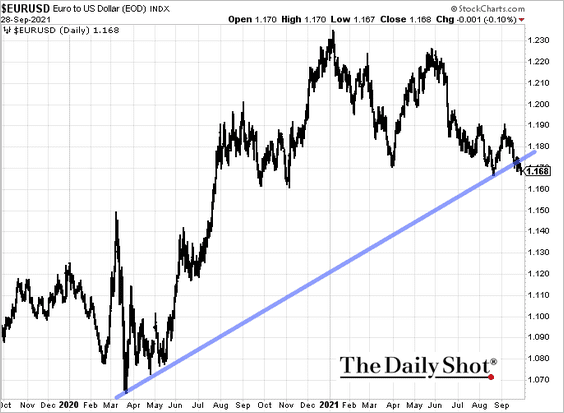
The rate differentials with the US are a drag on the euro.
——————–
2. Euro-area market-based inflation expectations continue to climb.
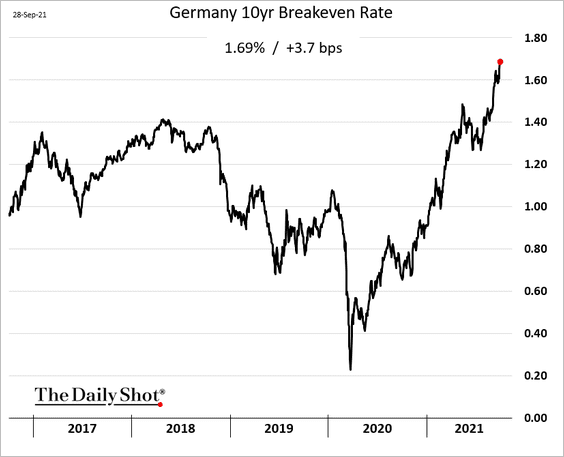
Capital Economics expects surging natural gas prices to bring the headline CPI to 4% this year.
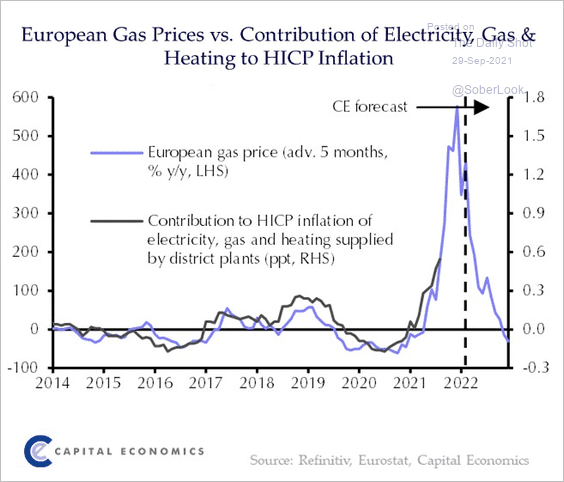 Source: @CapEconEurope Read full article
——————–
3. Short-term rates implied by the futures market have been moving higher.
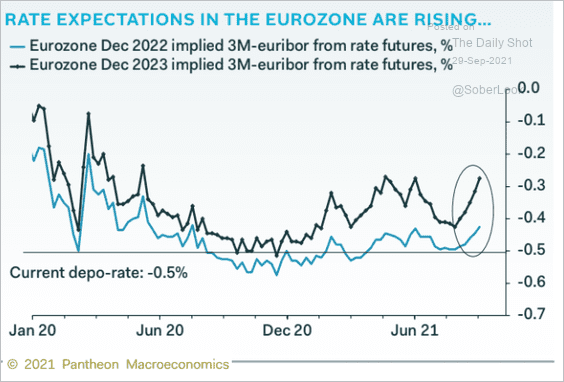 Source: Pantheon Macroeconomics
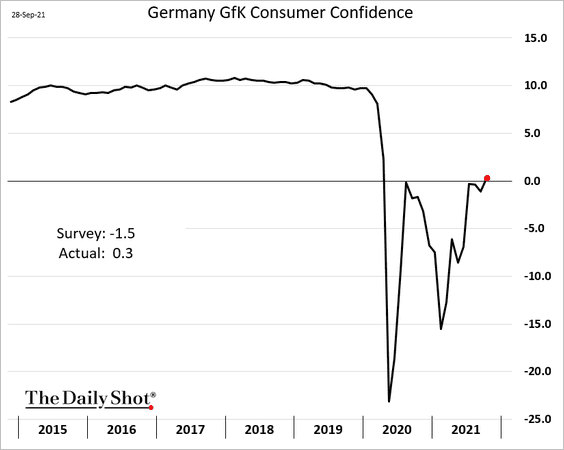
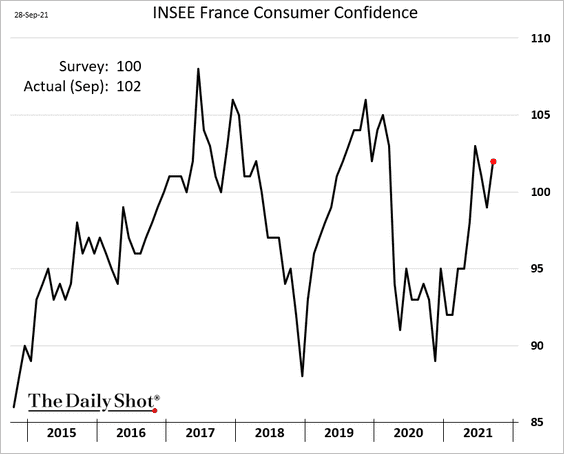
4. Consumer confidence improved this month.
• Germany:
• France:
——————–
5. Germany’s labor market continues to strengthen (chart shows falling unemployment).
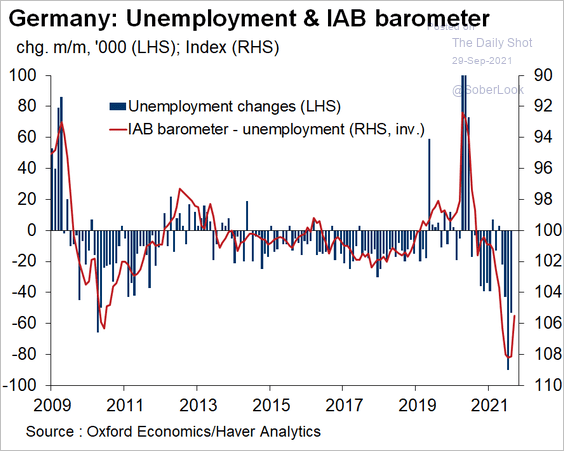 Source: @OliverRakau
Back to Index
Europe
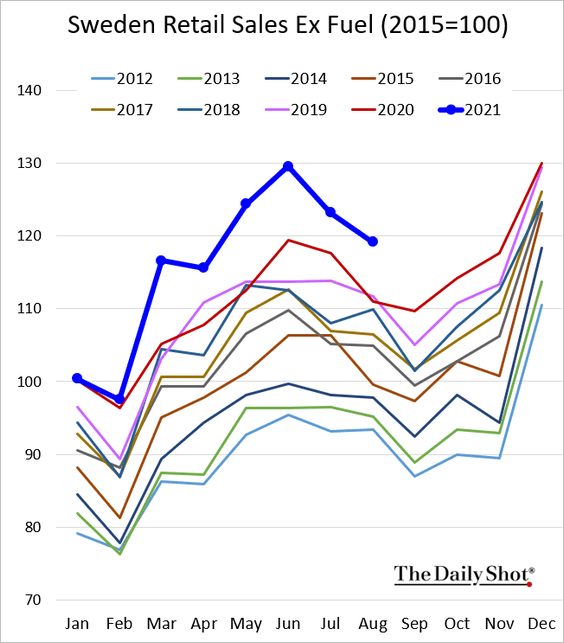
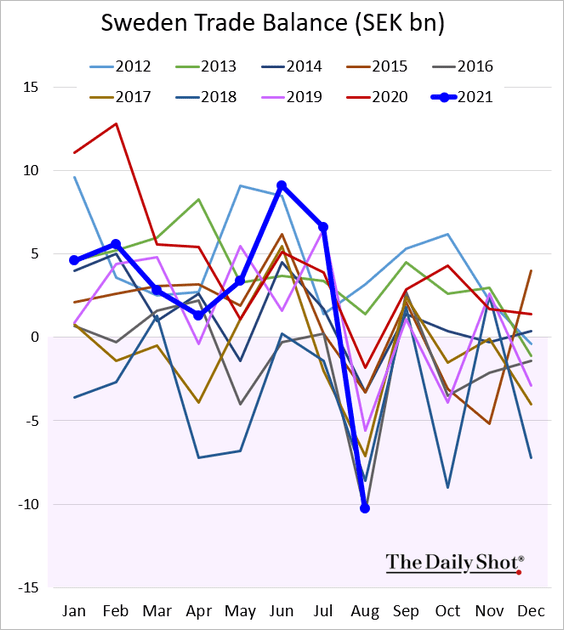
1. Sweden’s retail sales remain strong.
The trade deficit was worse than expected last month due to supply-chain issues.
——————–
2. Swiss economic activity continues to show improvement.
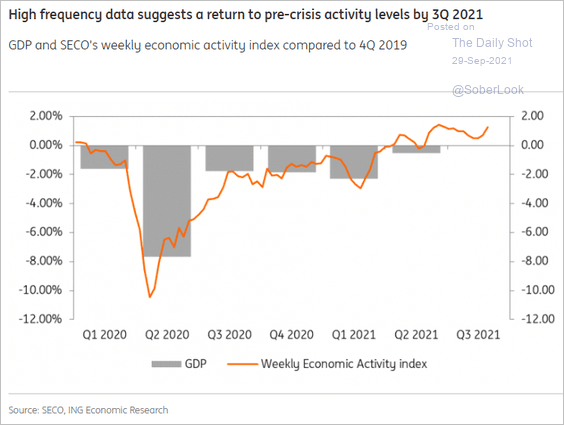 Source: ING
3. EU construction firms are increasingly facing material/equipment and labor shortages.
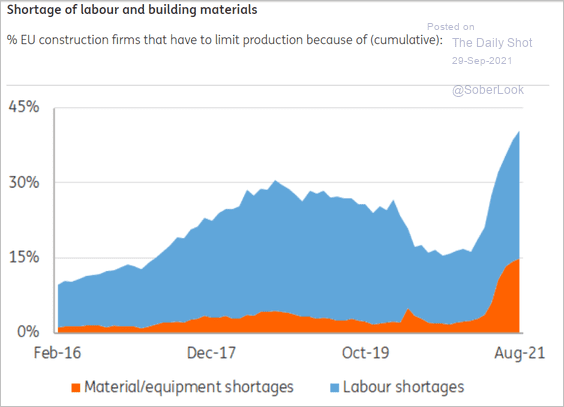 Source: ING
Back to Index
China
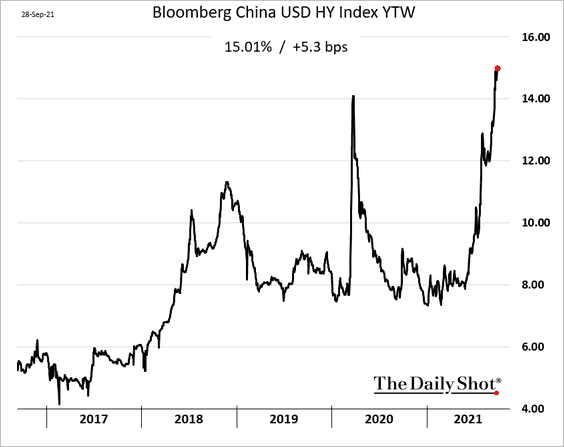
1. Financing for developers has been tightening (2 charts).
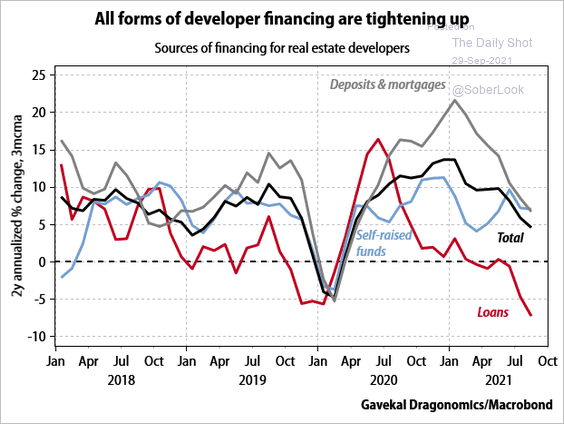 Source: Gavekal Research
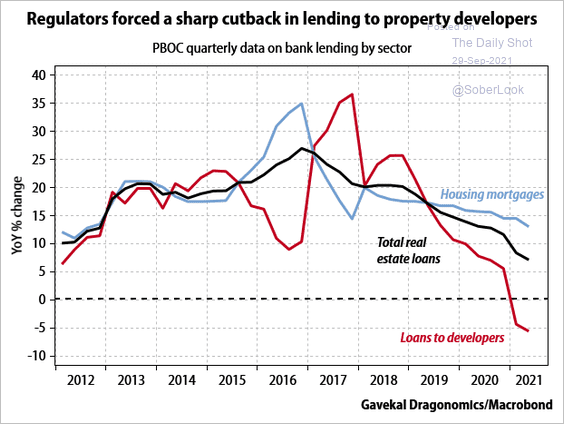 Source: Gavekal Research
And costs of bond financing for leveraged companies keep climbing.
——————–
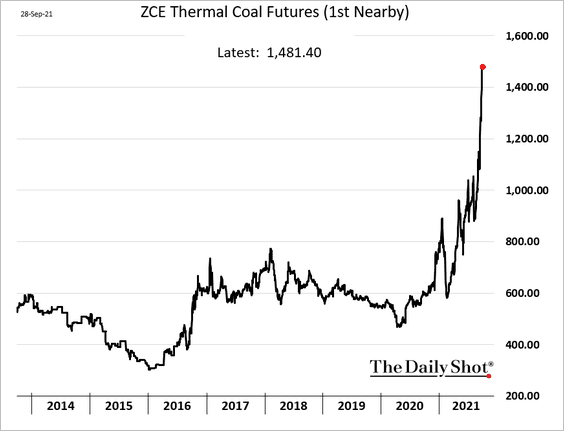
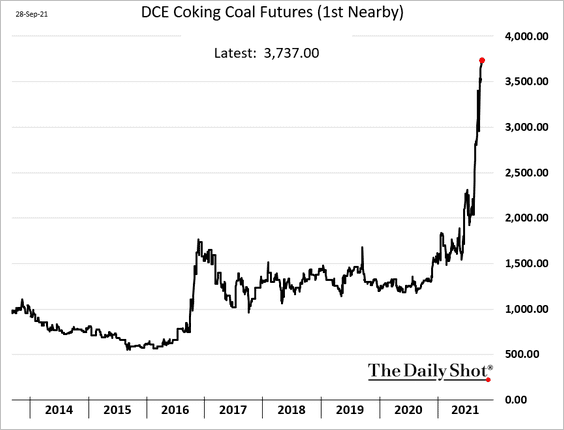
2. Coal prices continue to surge, which will put pressure on industrial activity.
——————–
3. Historically, cuts in the reserve requirement have preceded credit growth.
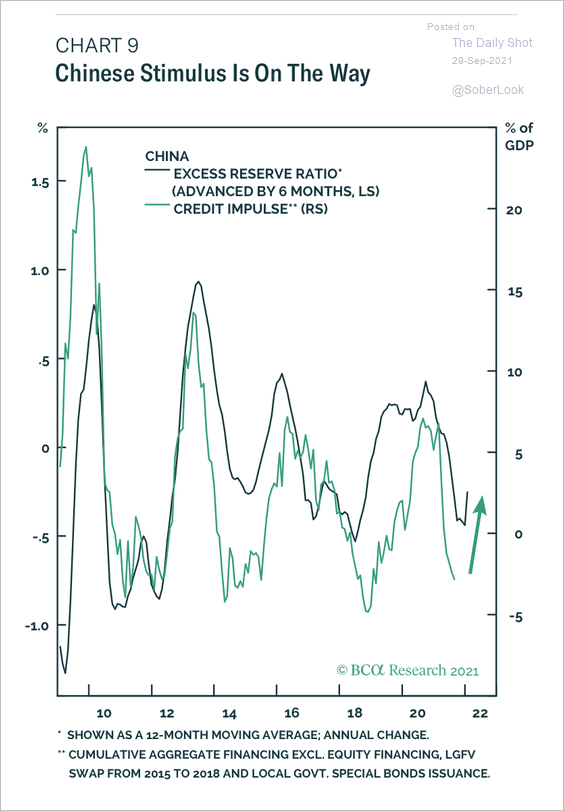 Source: BCA Research
There has been a downturn in China every 36 months, and usually authorities step in to boost liquidity.
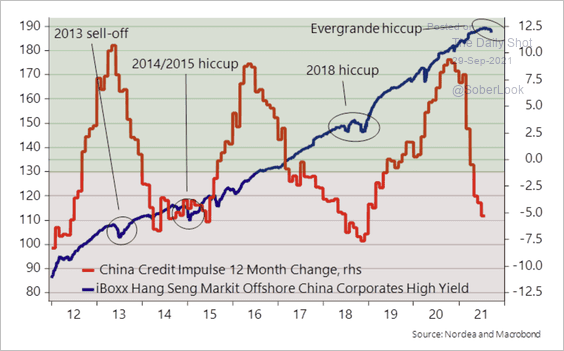 Source: Nordea Markets
——————–
4. Are China’s stocks oversold?
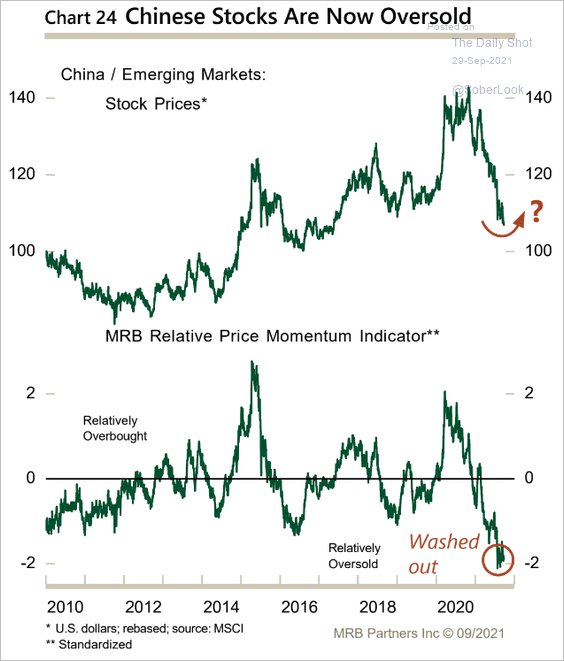 Source: MRB Partners
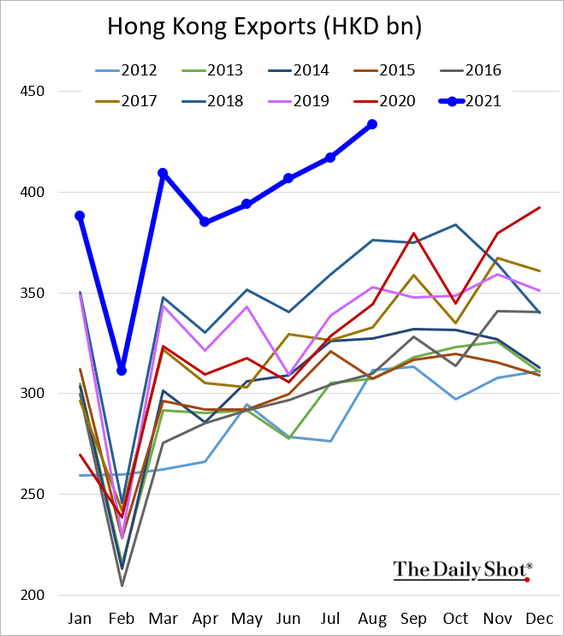
5. Hong Kong’s exports hit a record high.
Back to Index
Emerging Markets
1. The World Economics SMI shows the COVID-driven recession in India’s business activity easing this month.
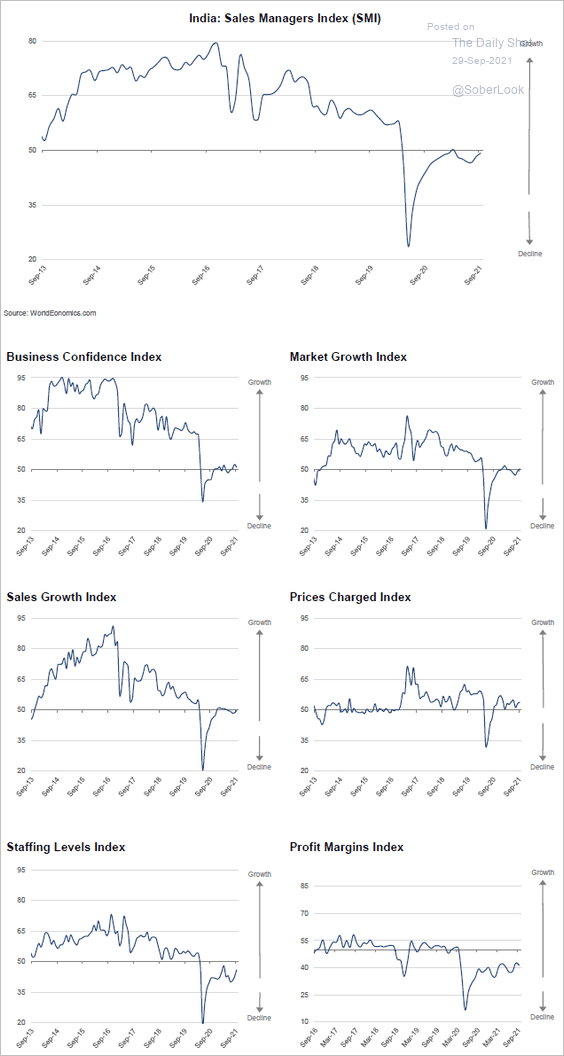 Source: World Economics
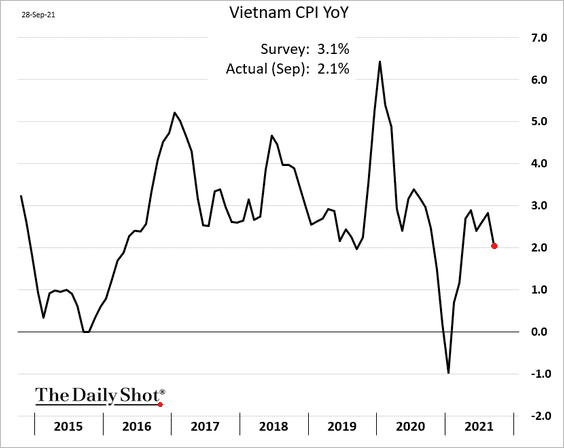
3. Vietnam’s GDP unexpectedly plummetted in Q3, as the pandemic took its toll.
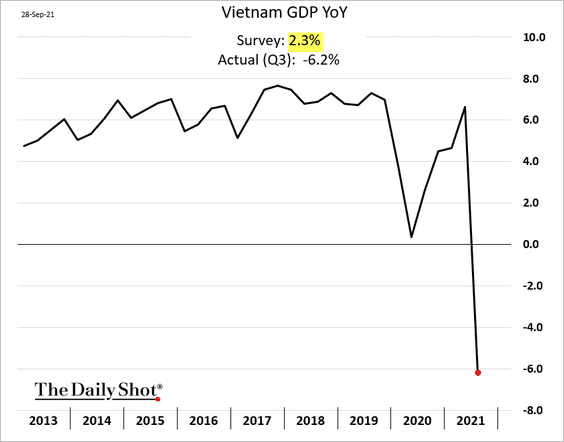
Inflation moderated this month.
——————–
4. Which countries are most vulnerable to a slowdown in China?
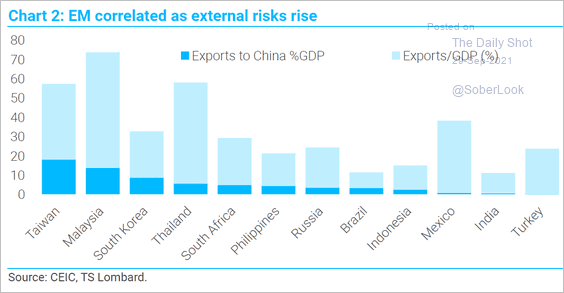 Source: TS Lombard
5. EM energy and material stocks performed well this year, while real estate and consumer stocks lagged.
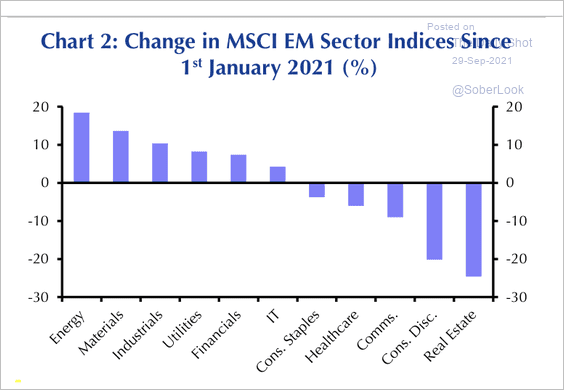 Source: Capital Economics
Back to Index
Cryptocurrency
1. Bitcoin’s beta to the S&P 500 has been rising.
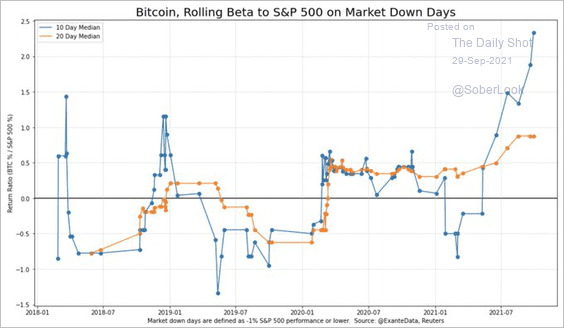 Source: @ExanteData
2. There are roughly 6,000 cryptos worldwide.
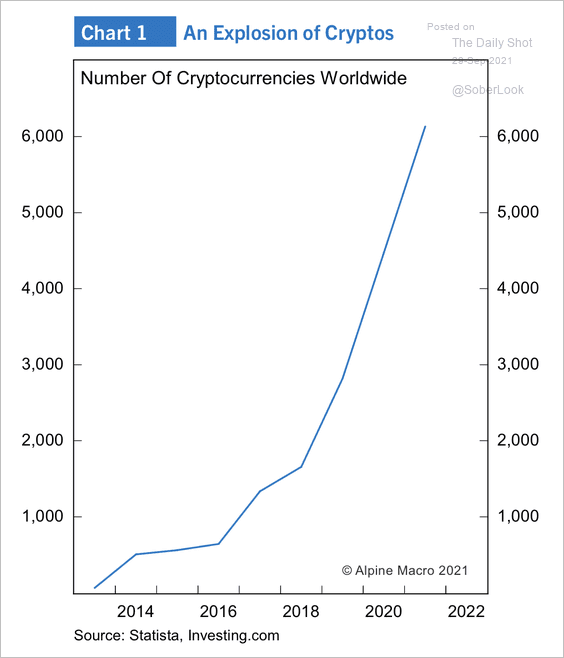 Source: Alpine Macro
3. This chart compares crypto user growth to internet users in the 1990s.
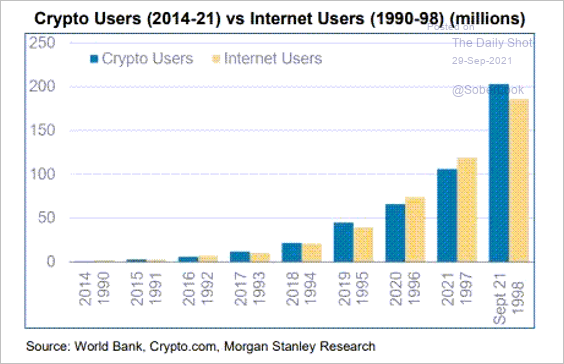 Source: Morgan Stanley Research
Back to Index
Energy
1. Futures prices for Henry Hub natural gas indicate continued undersupply expectations for the next year. Will producers respond to elevated prices?
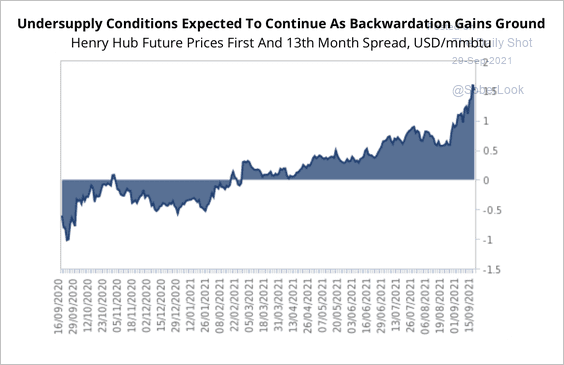 Source: Fitch Solutions Macro Research
The front-month natural gas futures contract is extremely overbought near resistance.
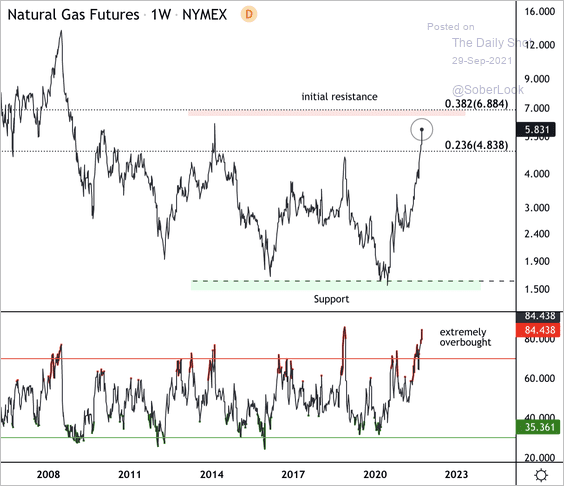 Source: Dantes Outlook
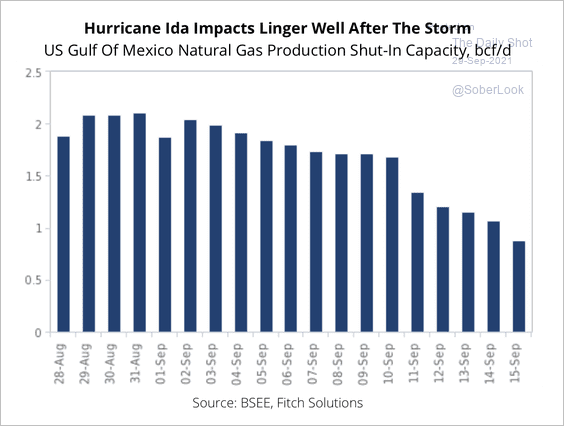
2. US natural gas production in the Gulf remains shut-in after Hurricane Ida. Fitch expects the bulk of output to be restored by the end of the month. However, if outages in upstream output continue, we could see more upside pressure on prices.
 Source: Fitch Solutions Macro Research
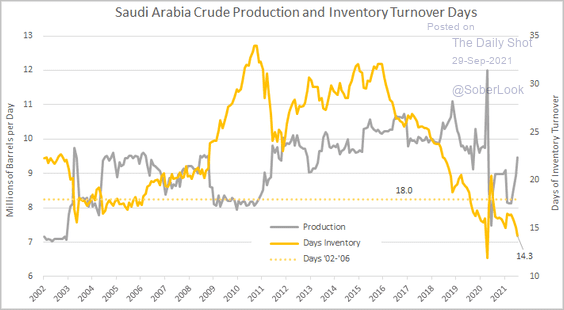
3. Saudi oil inventories are nearing multi-year lows.
 Source: Princeton Energy Advisors
Back to Index
Equities
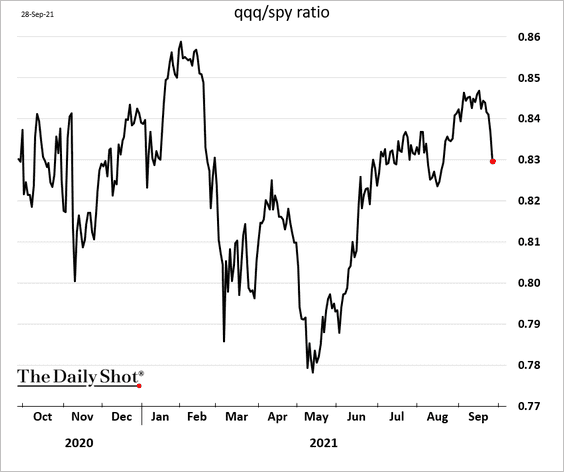
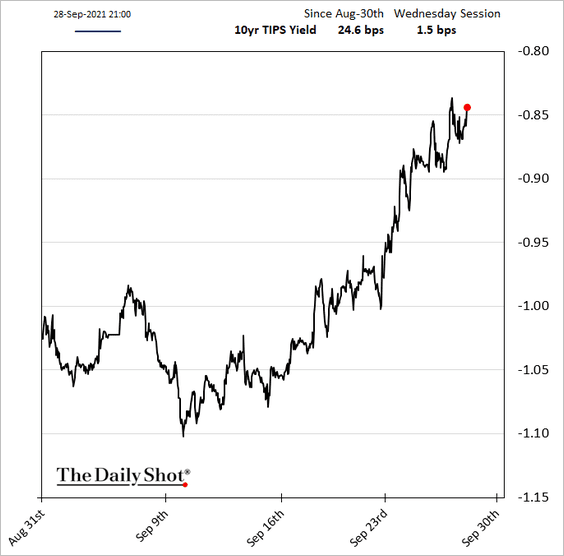
1. Rising bond yields …
… pressured stocks on Tuesday, with growth stocks underperforming (3 charts).
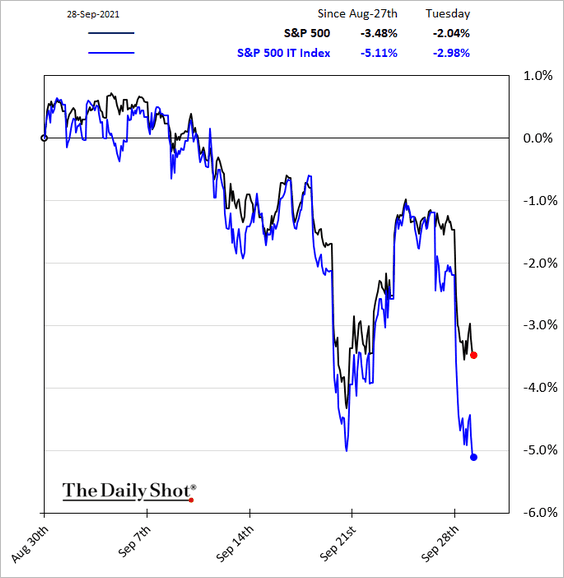
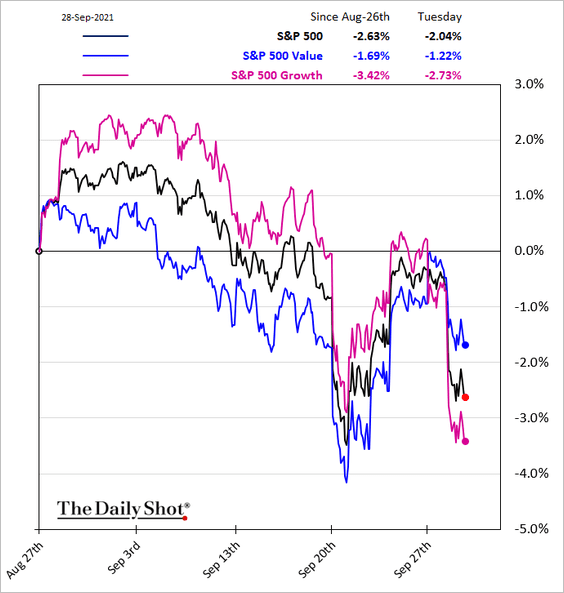
• Growth shares are particularly vulnerable to real rates (TIPS yields).
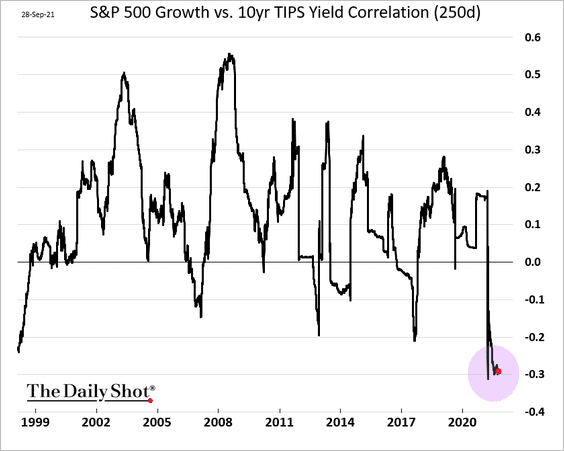
• More pain ahead?
 Source: @macro_daily
——————–
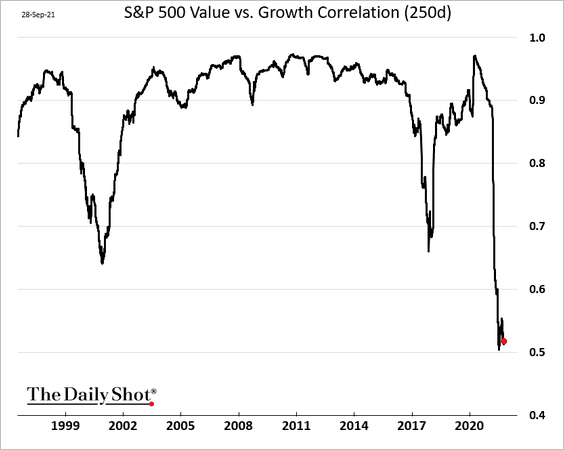
2. The correlation between growth and value stocks remains near multi-year lows.
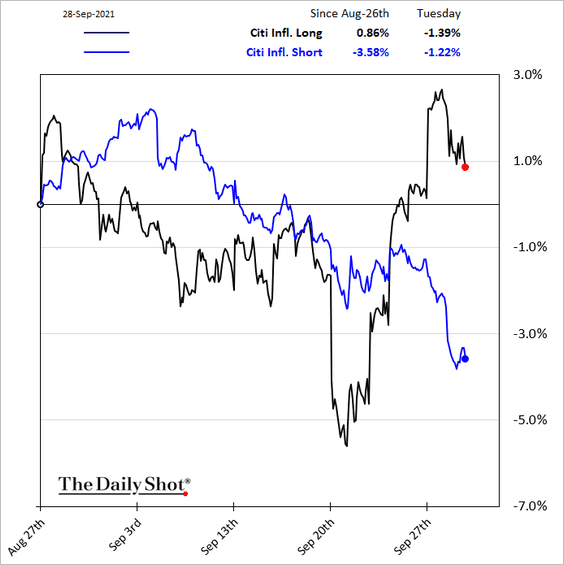
3. Stocks that respond positively to higher inflation have been outperforming.
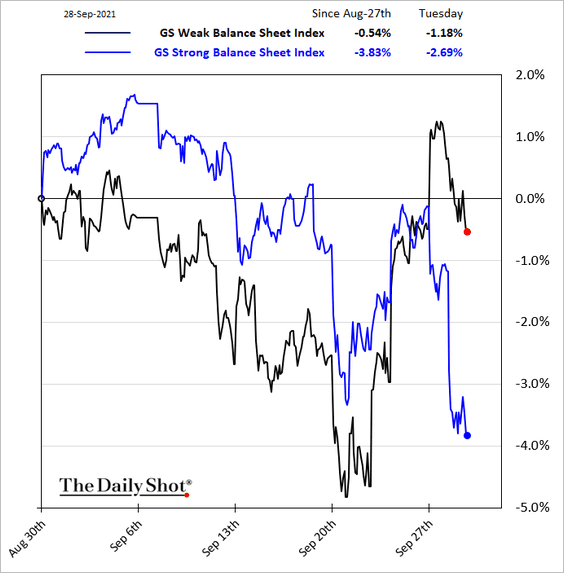
Related to the above, companies with weak balance sheets also outperformed.
——————–
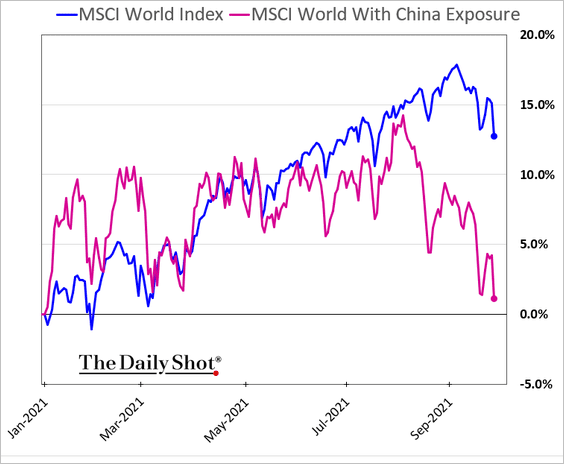
4. Companies with substantial sales in China continue to struggle.
5. Stock prices have diverged from consumer confidence.
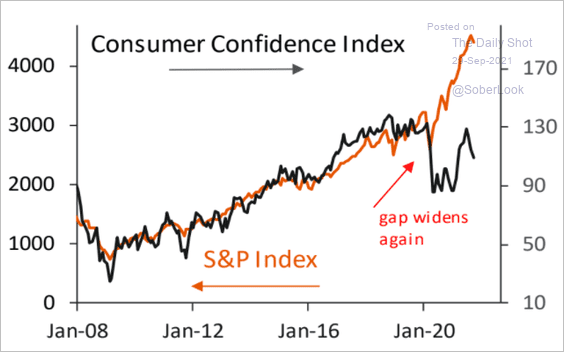 Source: Piper Sandler
6. Last week, only 43% of small option trader volume was attributed to speculative call positions. That’s the lowest concentration of outright bullish bets so far this year.
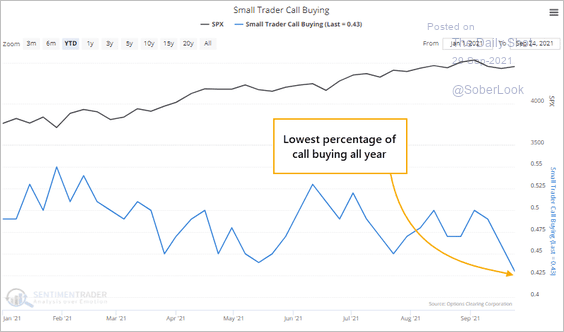 Source: SentimenTrader
Back to Index
Rates
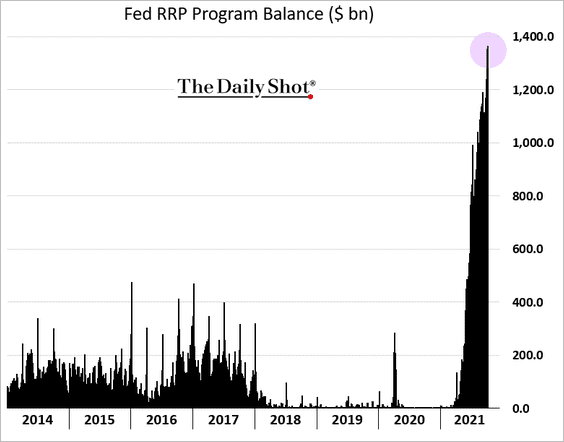
1. The Fed’s RRP facility balance hit a record high as the US Treasury’s withdrawal of cash from the Fed floods the market with liquidity.
2. The ratio of the US Treasury’s debt issuance vs. the Fed’s QE purchases (red line) will rebound after the debt ceiling is lifted.
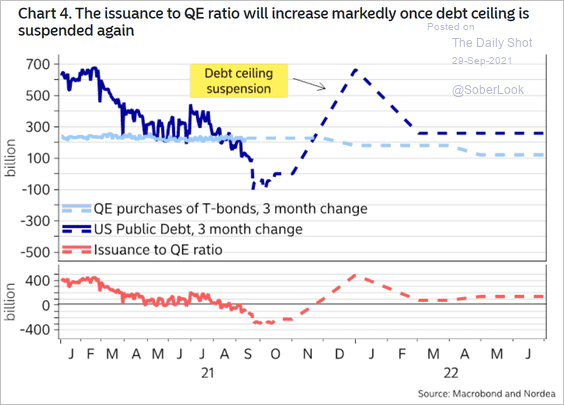 Source: Nordea Markets
3. On average, bond yields led the move in short-term rates by less than a month.
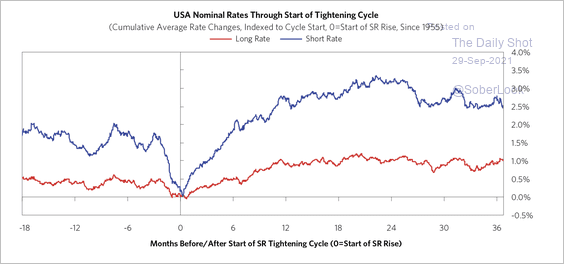 Source: Bridgewater Associates Read full article
In fact, the bond market has hardly ever led a rise in short-term rates by more than a few months (negative numbers indicate a lag).
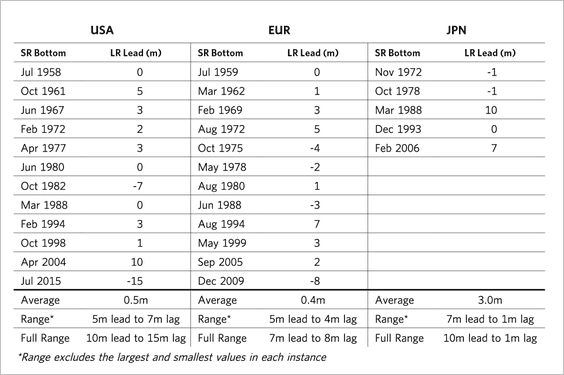 Source: Bridgewater Associates Read full article
——————–
4. SOFR (LIBOR replacement) is making some inroads in the USD swaps market.
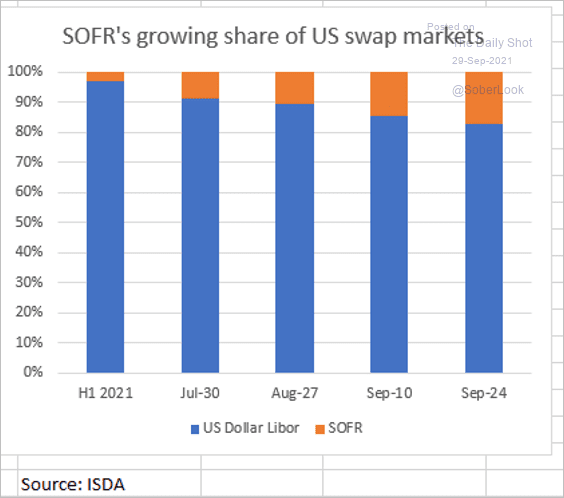 Source: @Chris_Whittall
Back to Index
Global Developments
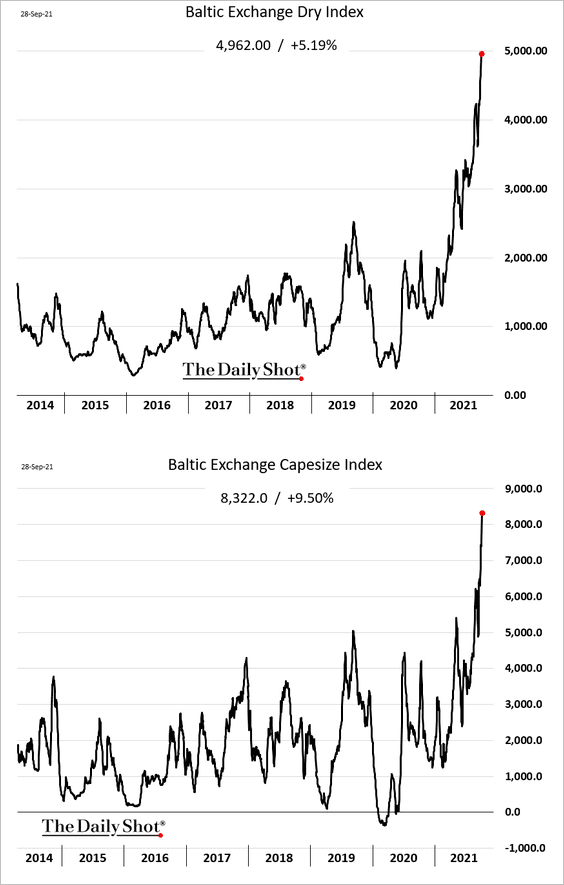
1. Shipping costs continue to surge.
• Containers from China:

• Dry bulk costs:
Shipping orders already hit a record high.
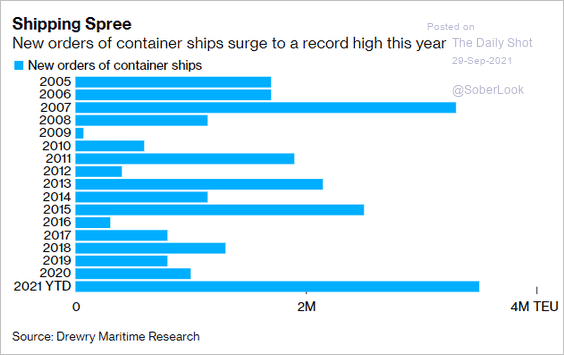 Source: @markets Read full article
——————–
2. Next, we have a couple of updates on the pandemic.
• Vaccinated population share:
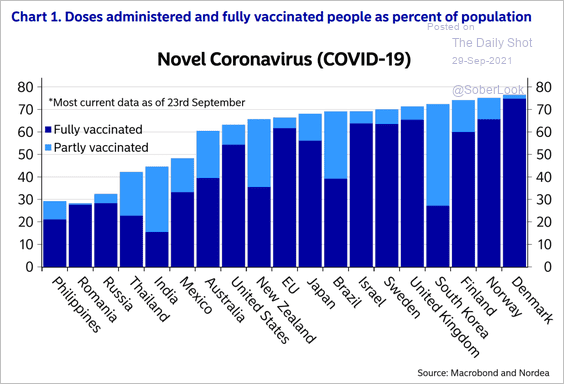 Source: Nordea Markets
• Fatalities:
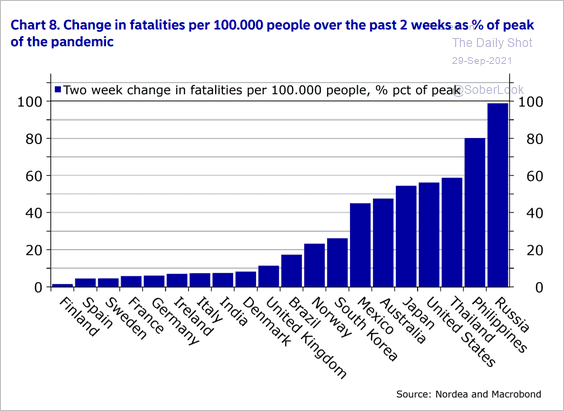 Source: Nordea Markets
——————–
3. Globally, imports of capital and intermediate goods are now taking the baton over from consumer goods.
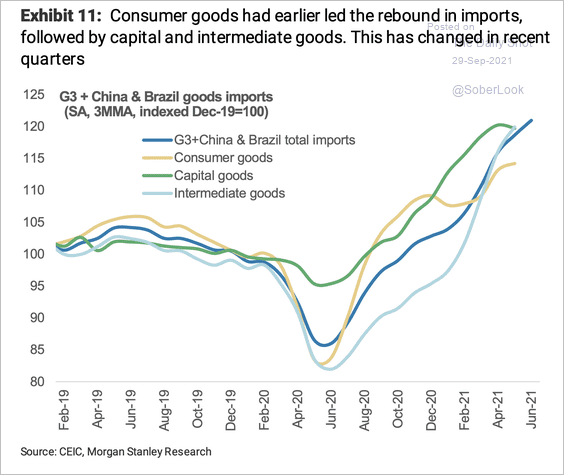 Source: Morgan Stanley Research
——————–
Food for Thought
1. US inbound flights from Europe:
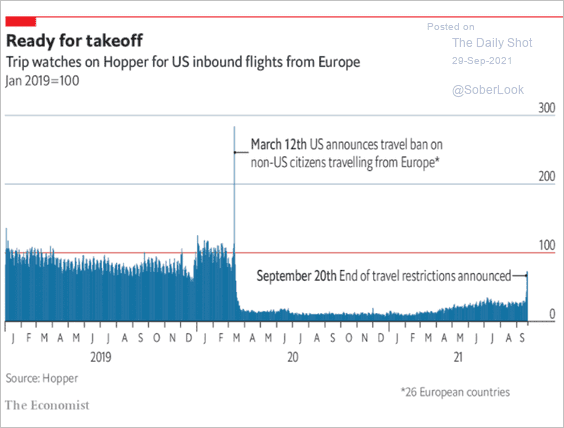 Source: The Economist Read full article
2. Apple’s balance sheet over time:
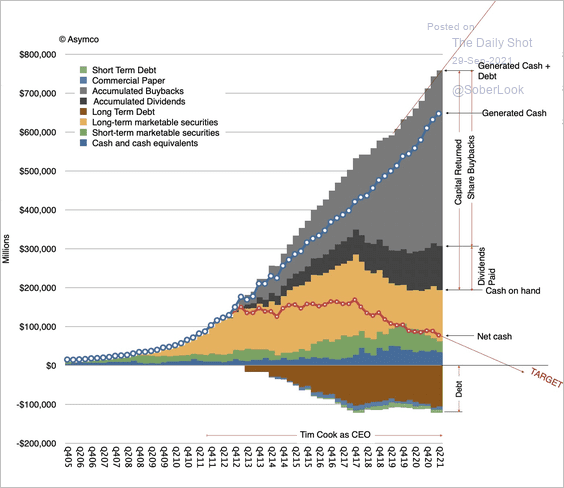 Source: @asymco
3. Companies that have gone public in 2021:
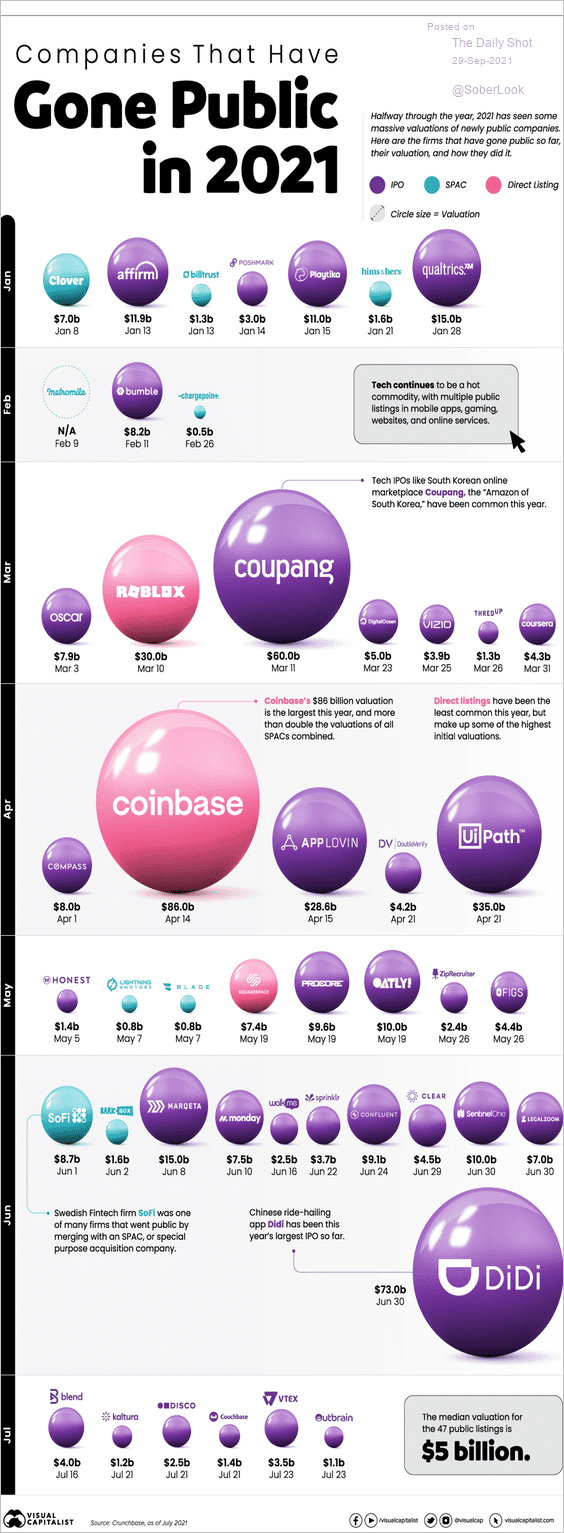 Source: Visual Capitalist Read full article
4. Locations of the world’s largest 100 companies by market capitalization:
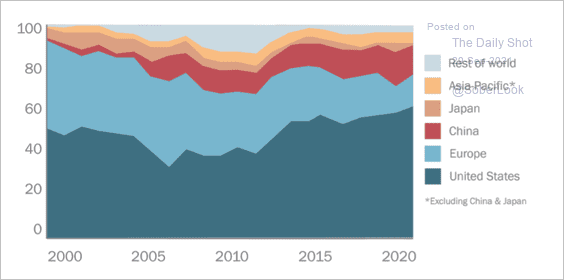 Source: Center for Data Innovation Read full article
5. Largest beef exporters:
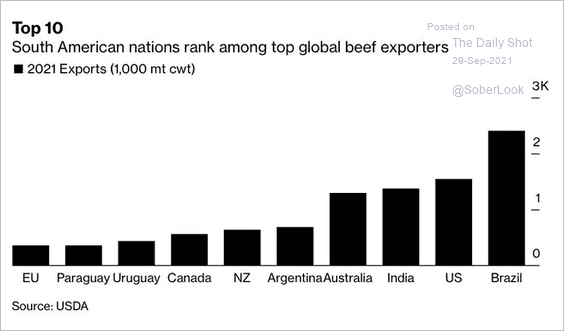 Source: @FarmPolicy, Bloomberg Read full article
6. US post-WWII debt burden:
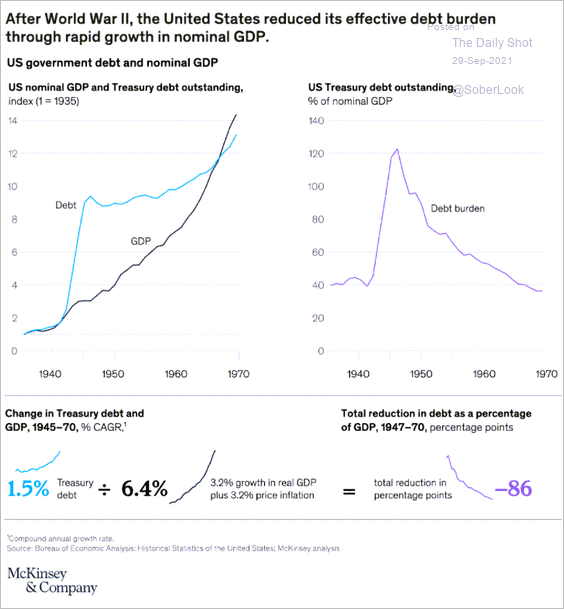 Source: McKinsey Read full article
7. US private-sector financial assets as a percent of GDP:
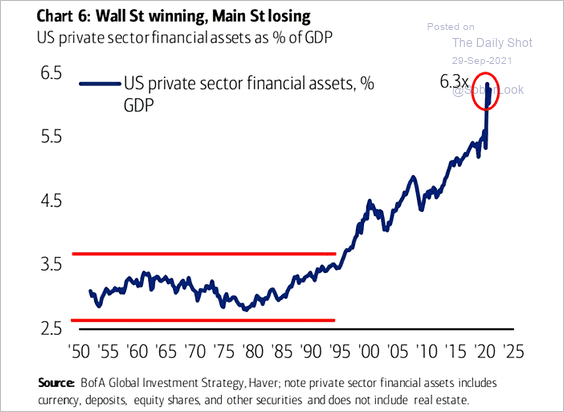 Source: @ISABELNET_SA, @BofAML
8. Will children be financially worse off than their parents’ generation?
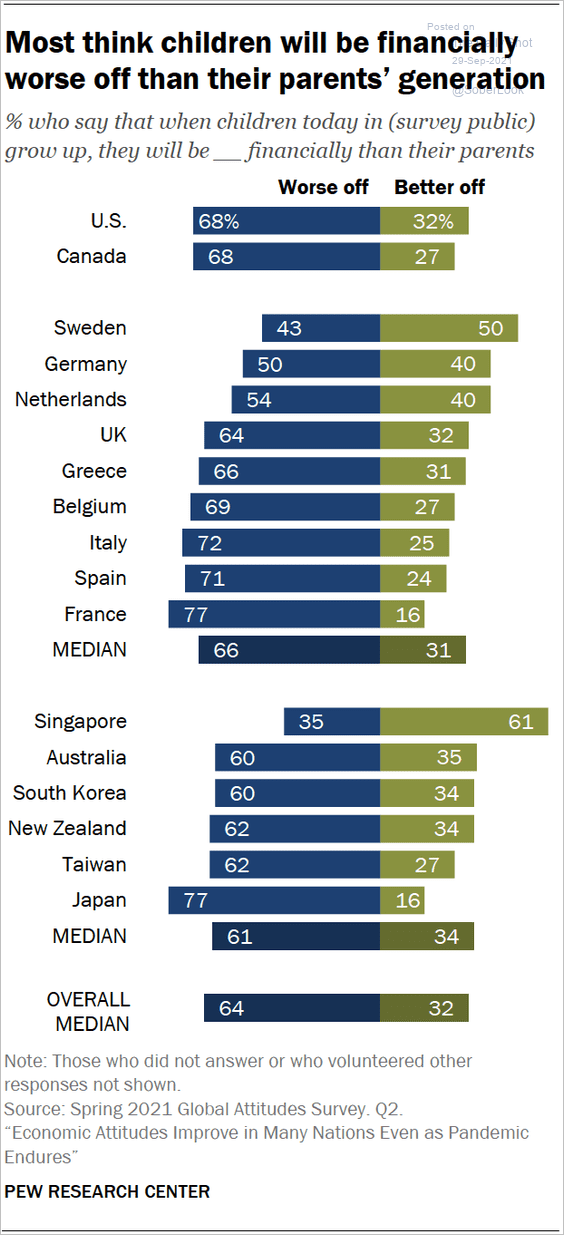 Source: Pew Research Center Read full article
9. Will over 225 million Americans be vaccinated by November 1st? The chart shows betting market odds.
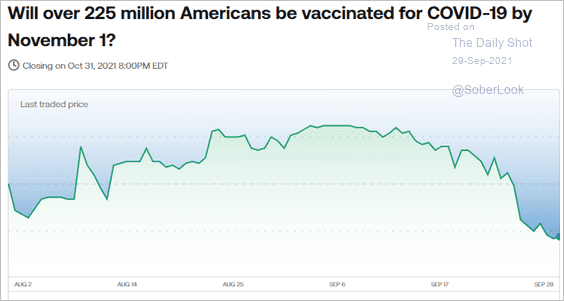 Source: Kalshi
10. Vaccinating children under 12:
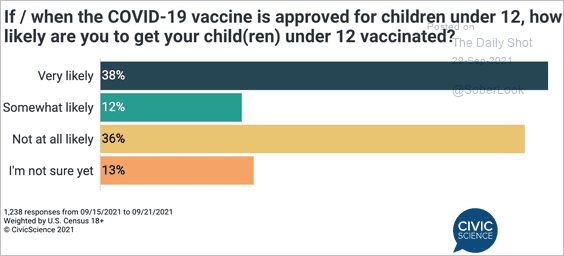 Source: @CivicScience
11. Most popular types of beer in the UK:
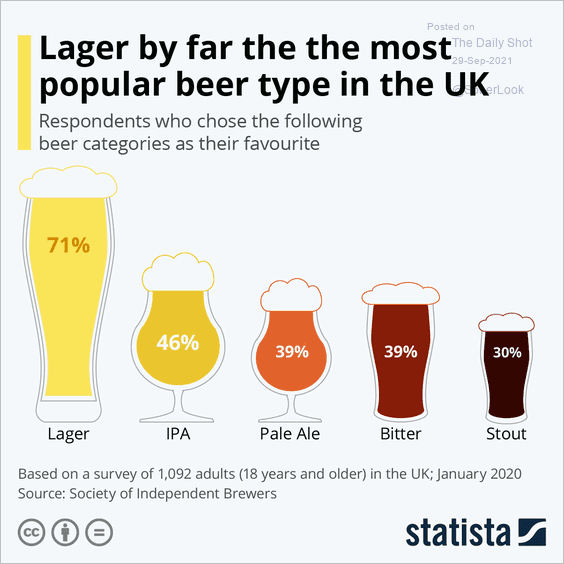 Source: Statista
——————–
Back to Index