
The Daily Shot: 07-Oct-21
• The United States
• The United Kingdom
• The Eurozone
• Europe
• Asia – Pacific
• China
• Emerging Markets
• Cryptocurrency
• Commodities
• Energy
• Equities
• Credit
• Rates
• Global Developments
• Food for Thought
The United States
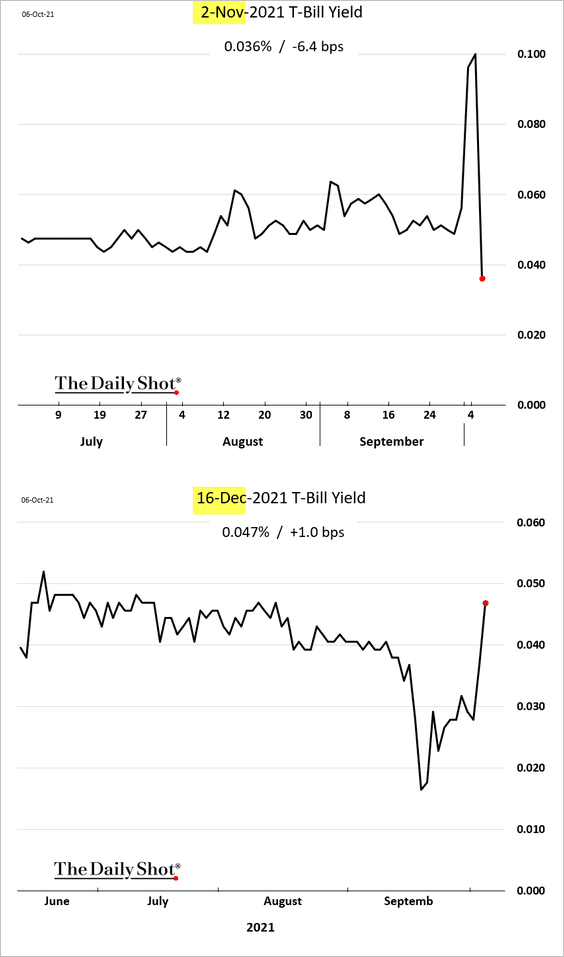
1. The debt ceiling “can” has been kicked down the road (into December).
 Source: Roll Call Read full article
Yields on shorter-term T-bills declined, while December bills sold off. Stocks rebounded.
——————–
2. The ADP private payrolls report surprised to the upside, …
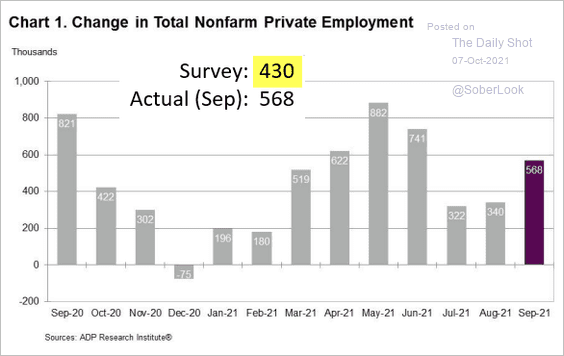 Source: ADP Research Institute
… with all major sectors gaining jobs last month.
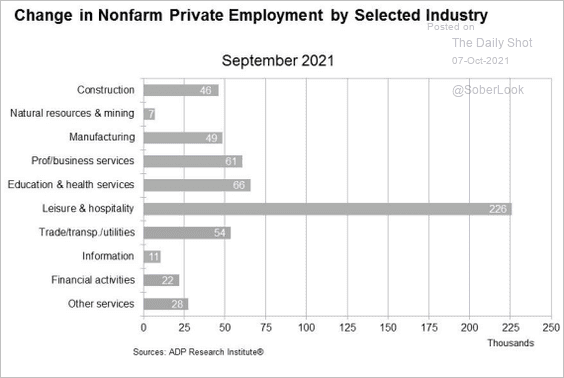 Source: ADP Research Institute
——————–
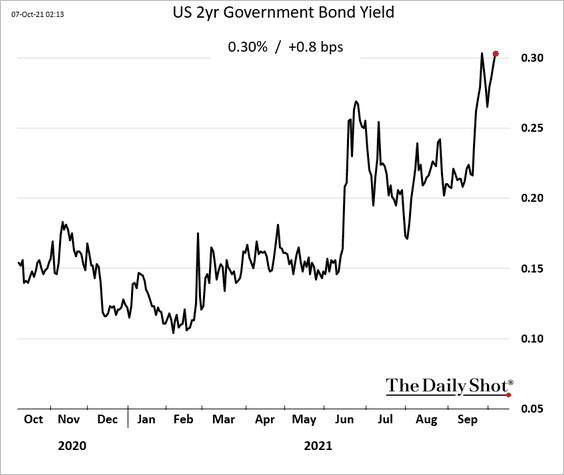
3. The upbeat ADP report and the debt ceiling reprieve (albeit temporary) sent the market-based probability of two Fed rate hikes next year to the highest level since June.
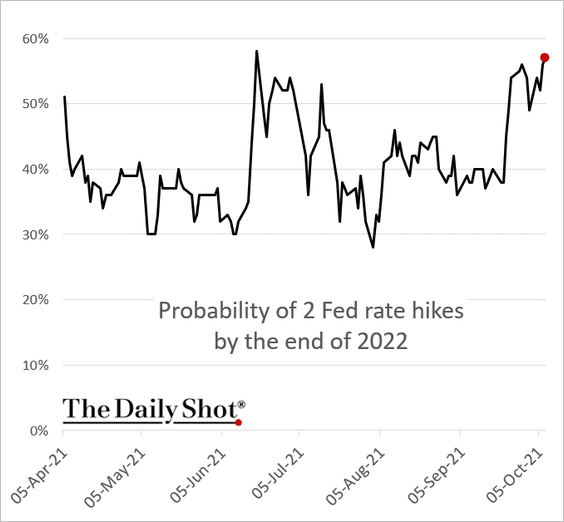
A steeper path for rate hikes is now priced into the 2yr Treasury yield.
——————–
4. The GDPNow model Q3 growth estimate has diverged from economists’ consensus.
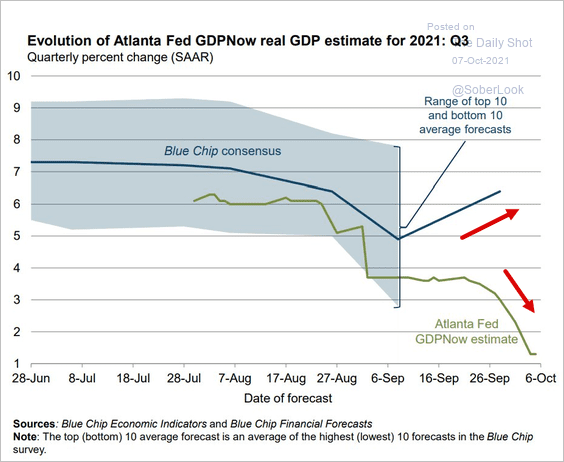 Source: @AtlantaFed Read full article
5. The Oxford Economics recovery tracker continues to show improvement as the pandemic eases.
![]() Source: @GregDaco
Source: @GregDaco
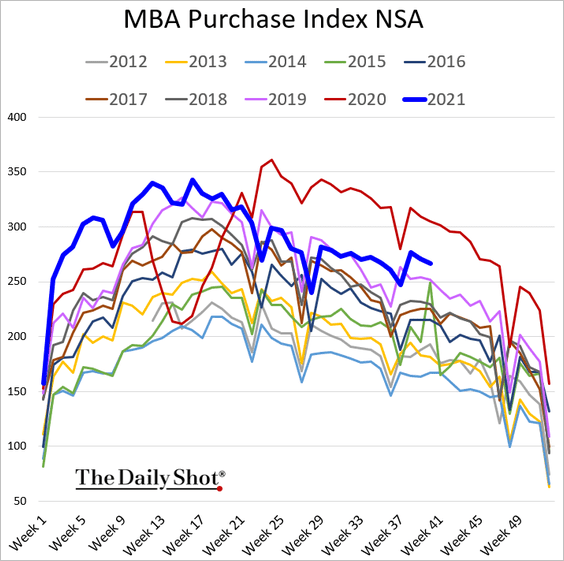
6. Loan applications to purchase a home are holding well above 2019 levels.
7. More Americans who are ready to return to work are not going back on the same conditions.
 Source: Desjardins
Back to Index
The United Kingdom
1. The market expects two BoE rate hikes by next May, …
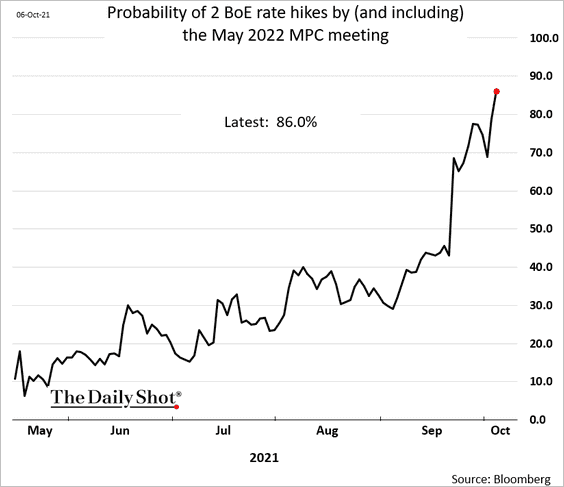
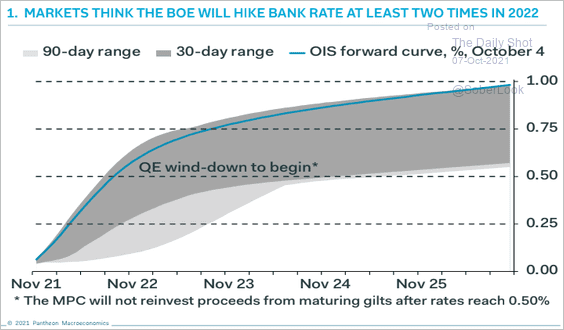 Source: Pantheon Macroeconomics
… as inflation expectations spike (driven by an unprecedented surge in energy prices).
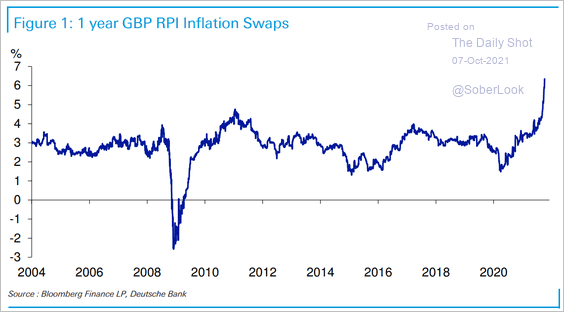 Source: Deutsche Bank Research
——————–
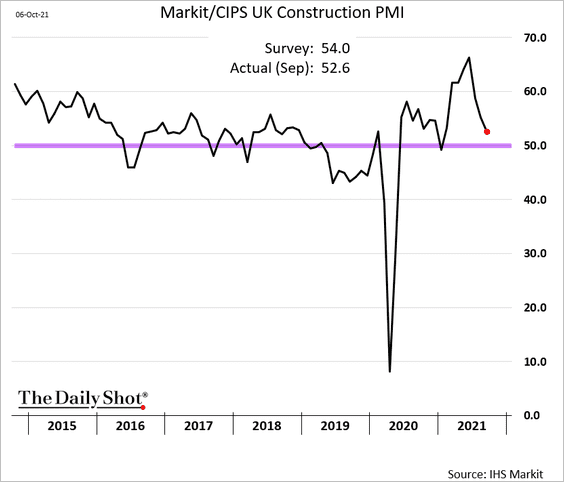
2. Growth in the nation’s construction sector has slowed sharply.
Back to Index
The Eurozone
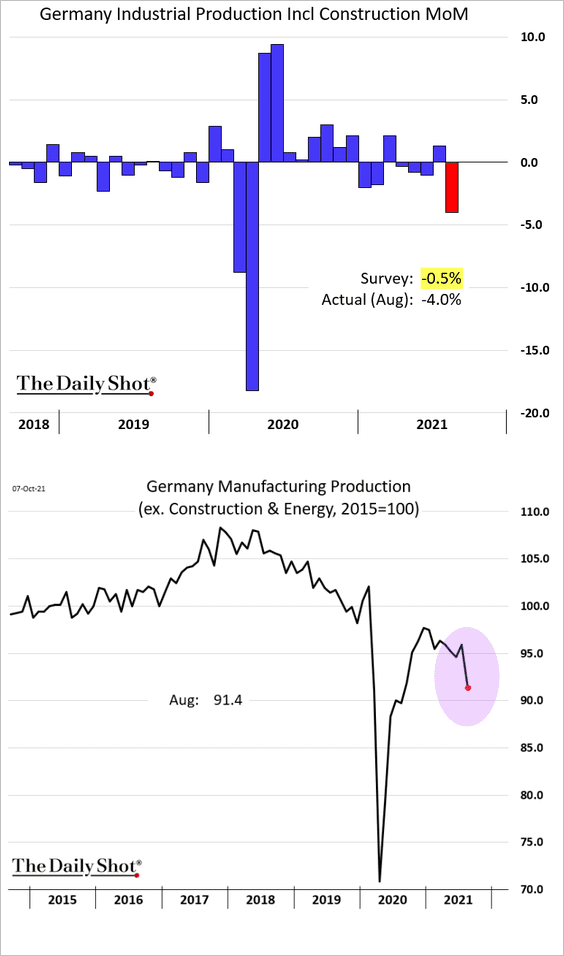
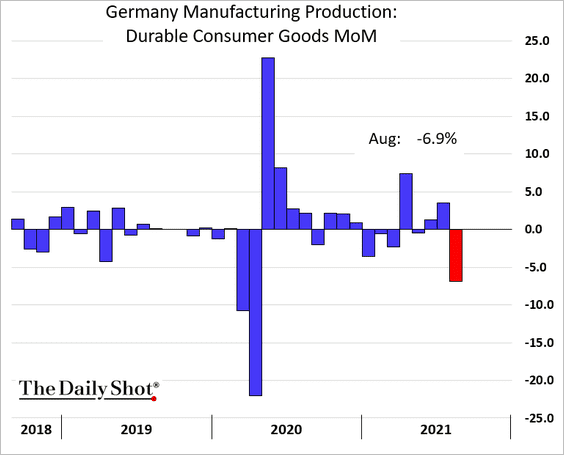
1. Germany’s factory orders and manufacturing output tumbled in August as the automobile sector slumps.
• Factory orders:
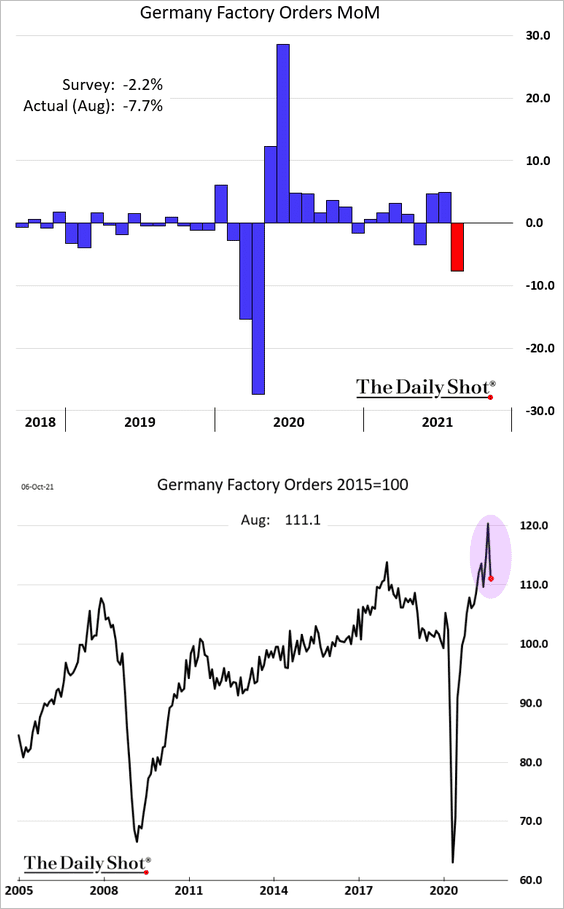
• Automobile orders:
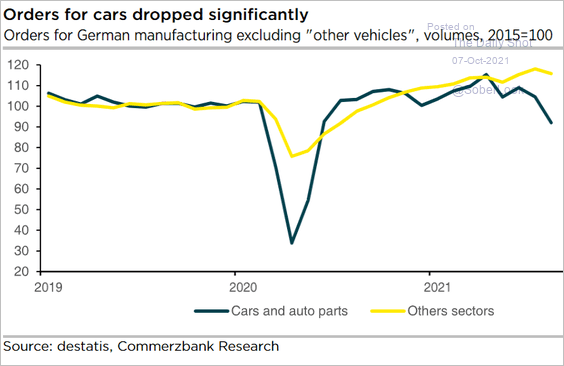 Source: Commerzbank Research
• Industrial production:
• Durable goods production (dominated by autos):
——————–
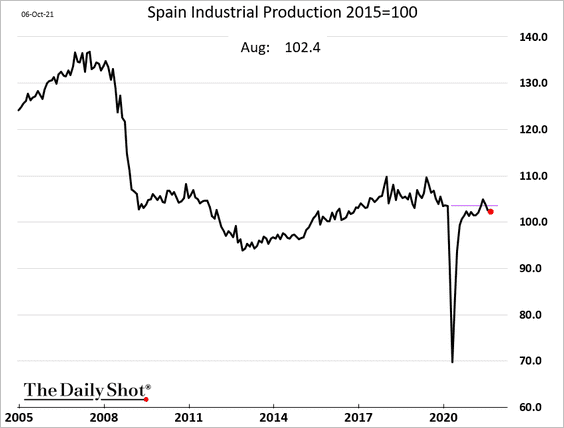
2. Spain’s industrial production is now below pre-COVID levels.
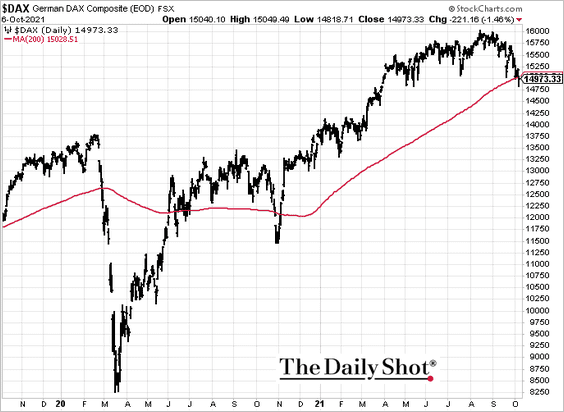
3. Germany’s DAX index is at the 200-day moving average.
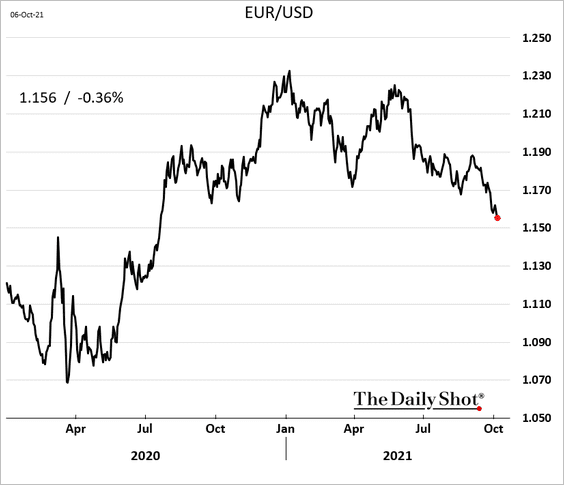
4. The euro continues to drift lower.
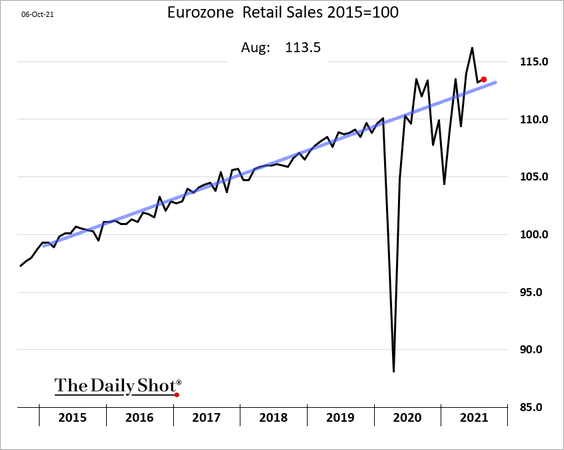
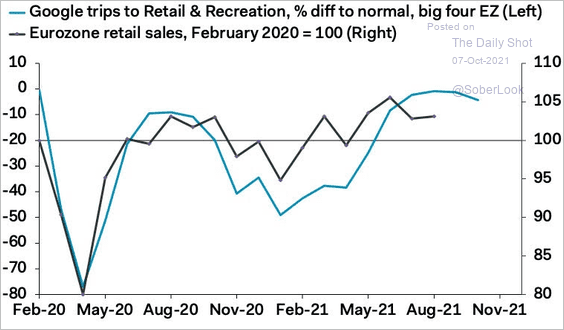
5. Euro-area retail sales were a bit softer than expected in August, …
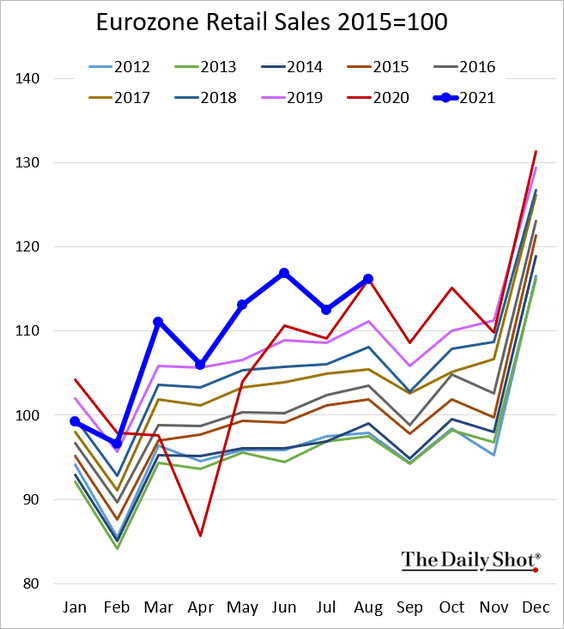
… remaining on the pre-COVID trend.
Google search activity suggests that we should see an improvement in retail sales in September.
 Source: Pantheon Macroeconomics
Back to Index
Europe
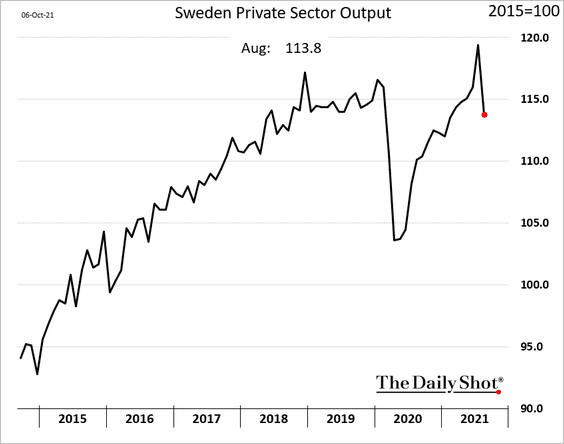
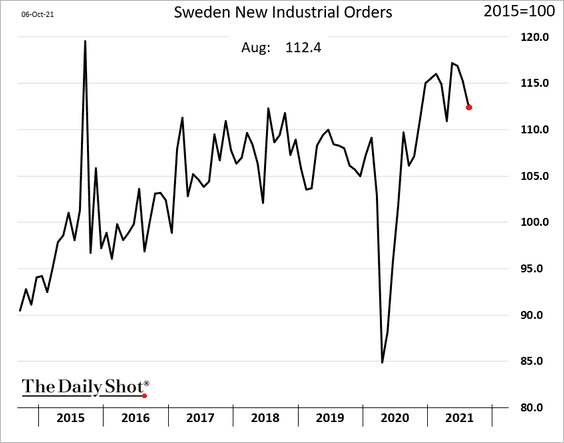
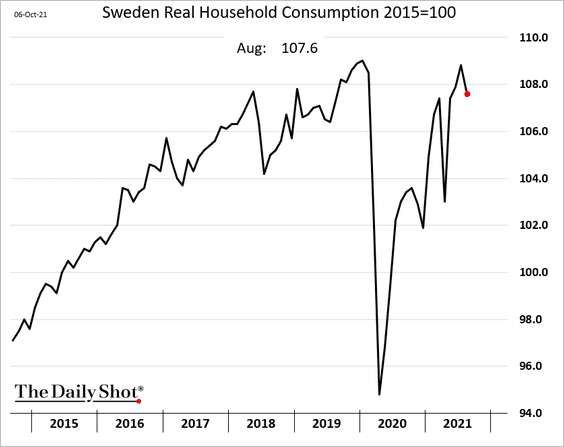
1. Let’s begin with Sweden.
• Economic activity slowed in August.
– Private-sector output:
– Industrial orders:
– Household consumption:
– GDP estimate:
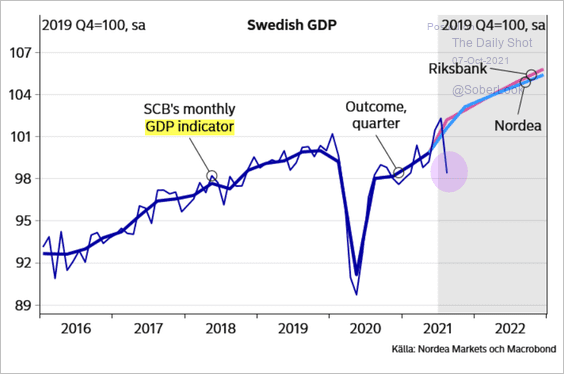 Source: Nordea Markets
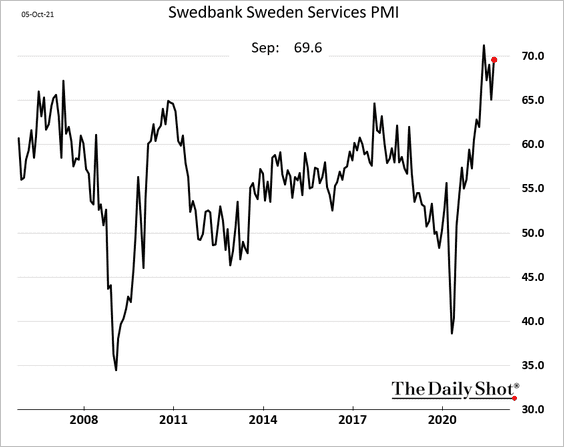
• But service activity accelerated in September, according to Swedbank.
——————–
2. European energy stocks have significantly improved relative to the overall market over the past few months.
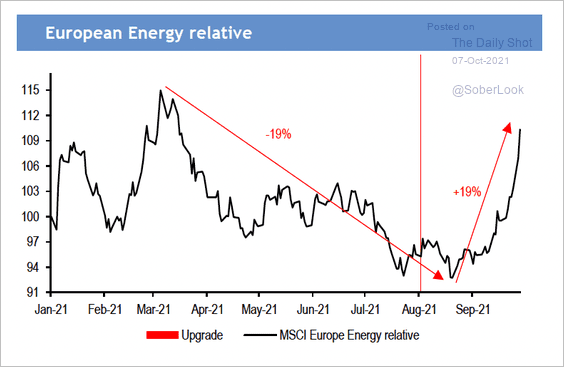 Source: JPMorgan
But they are still lagging oil.
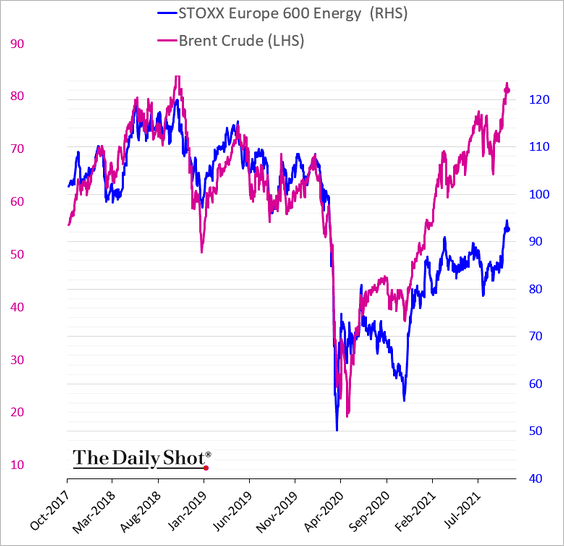 h/t @mikamsika
——————–
3. This chart shows Europe’s automobile sales trends.
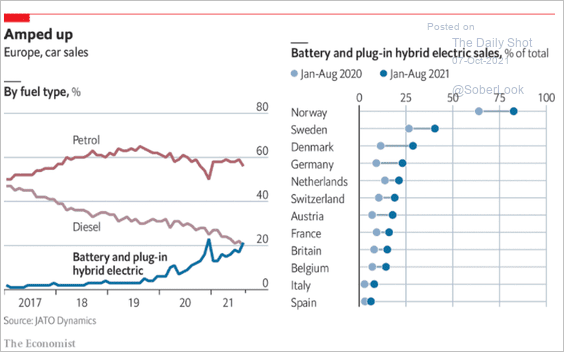 Source: The Economist Read full article
4. Which countries have the highest percentage of innovative firms?
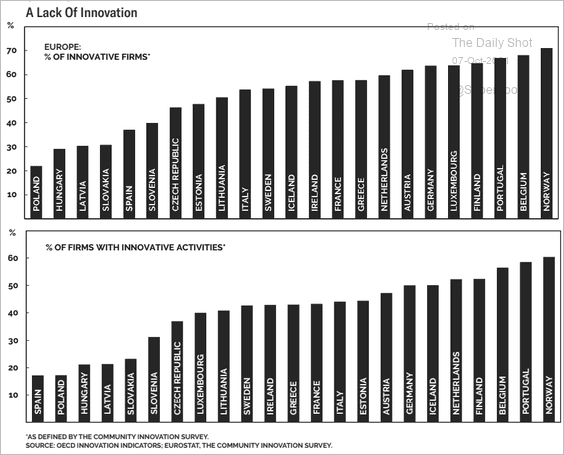 Source: BCA Research
Which countries have the highest digital penetration?
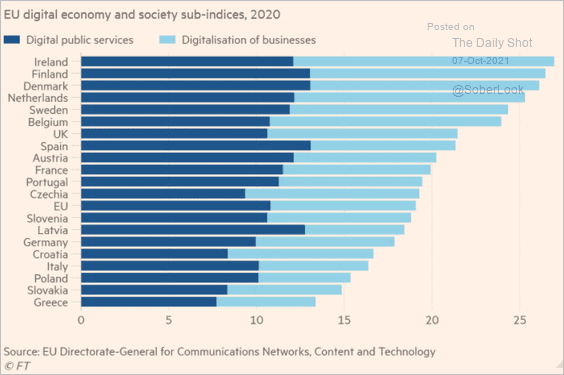 Source: @financialtimes Read full article
Back to Index
Asia – Pacific
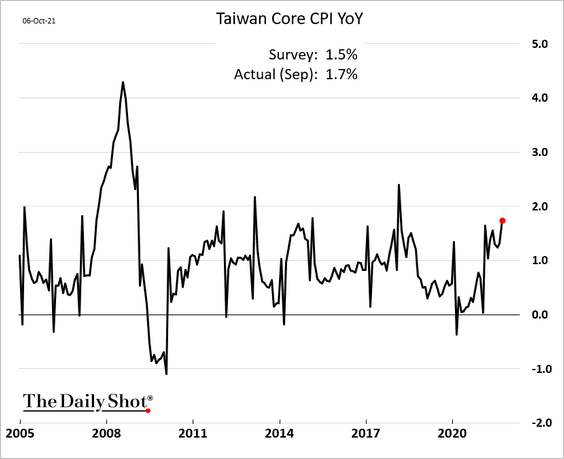
1. Taiwan’s inflation surprised to the upside.
2. Australian short-term yields are rebounding as the market prices in RBA rate hikes.
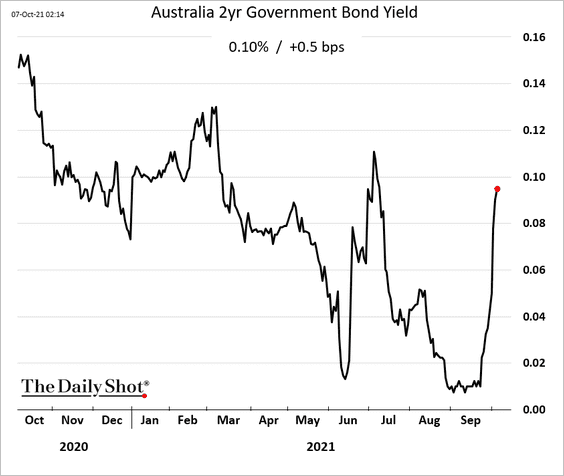
Separately, exports of resources (metals, LNG, and coal) drove Australia’s trade surplus to a new record.
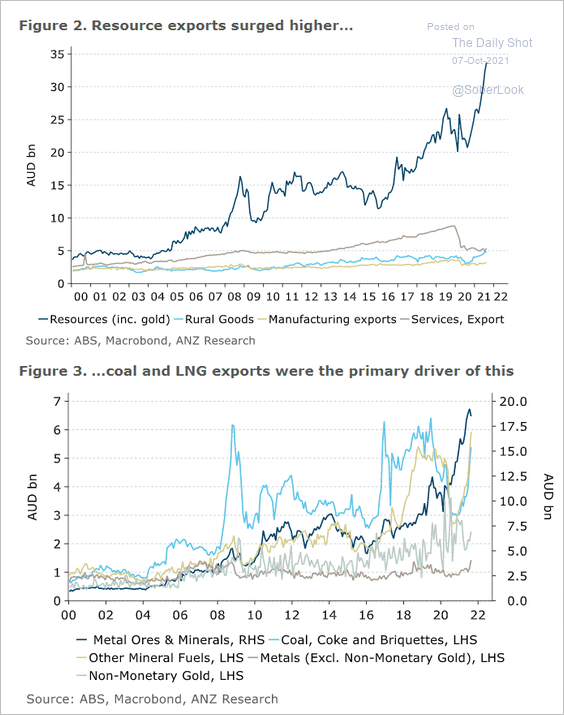 Source: ANZ Research
——————–
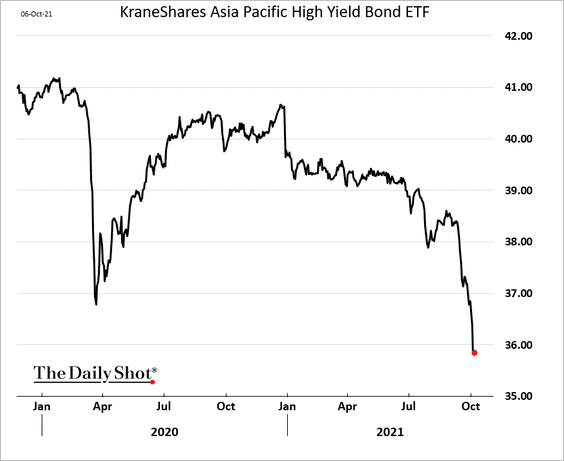
3. Asian high-yield bonds have been under pressure, driven by China’s developers.
Back to Index
China
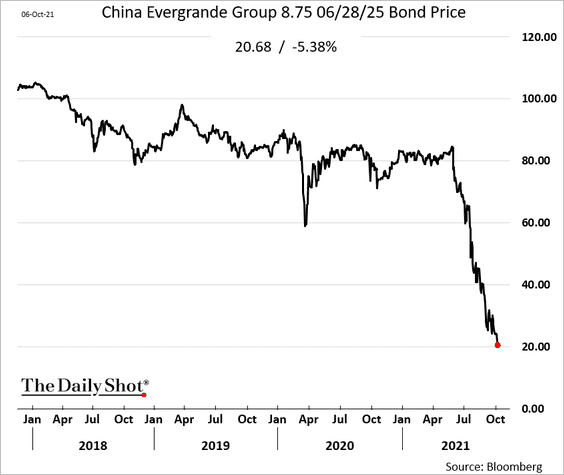
1. Investors continue to dump leveraged developers’ bonds.
• Evergrande:
• Sunac:
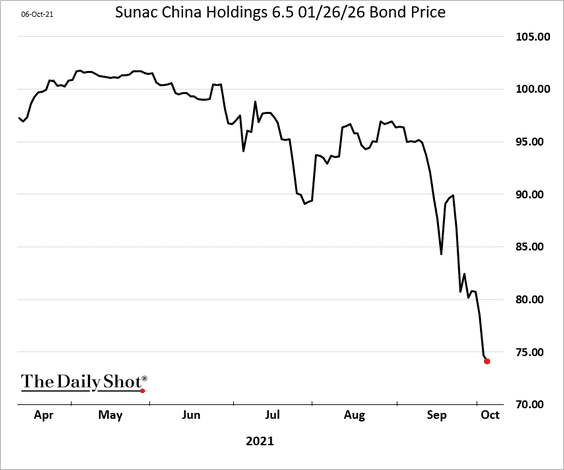
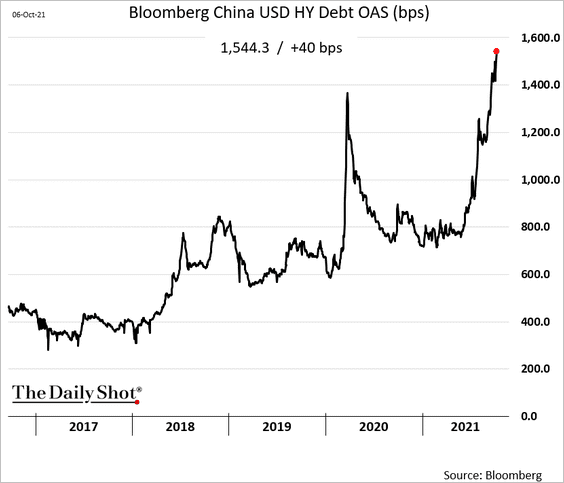
USD-denominated HY spreads have blown out further.
——————–
2. Lenders in China are reallocating resources toward the industrial economy.
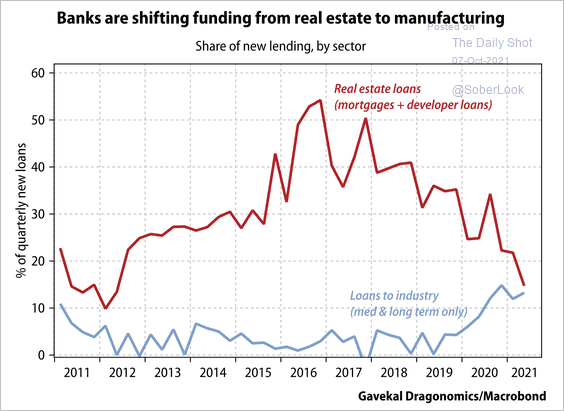 Source: Gavekal Research
3. Next, we have some data on inbound M&A activity.
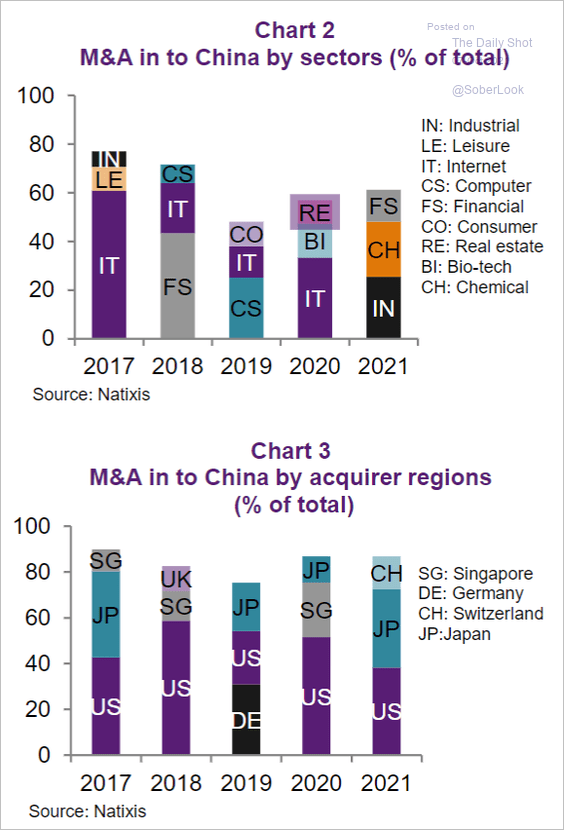 Source: Natixis
And here is inward and outward foreign direct investment.
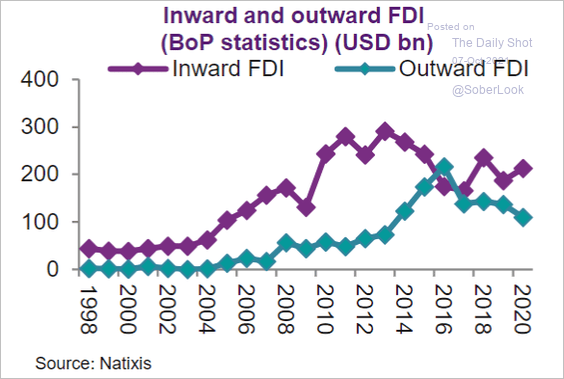 Source: Natixis
Back to Index
Emerging Markets
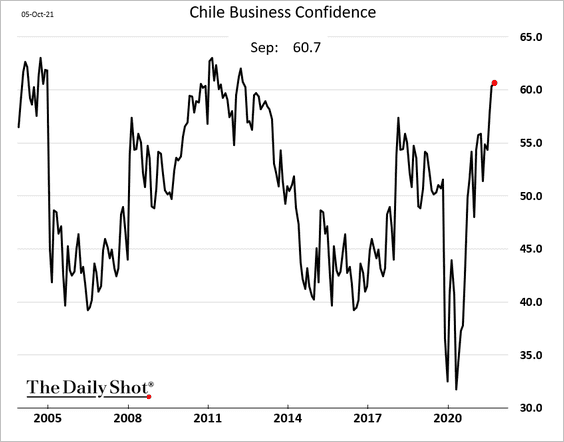
1. Chile’s business confidence remains robust.
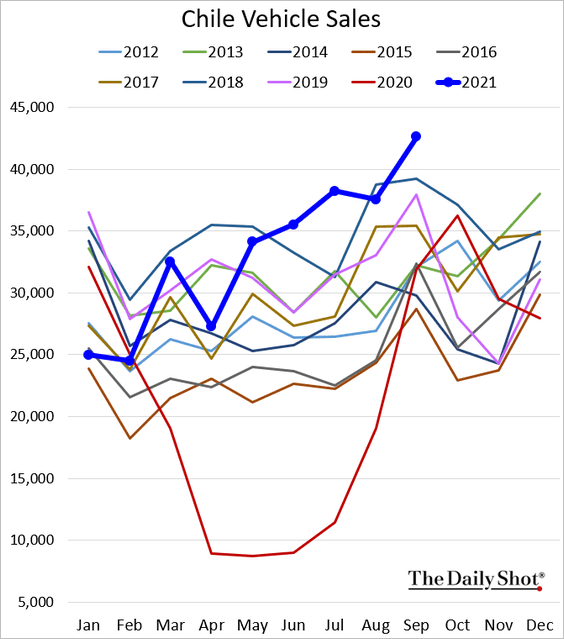
Automobile sales hit a record high. Chile is the only economy experiencing this trend.
——————–
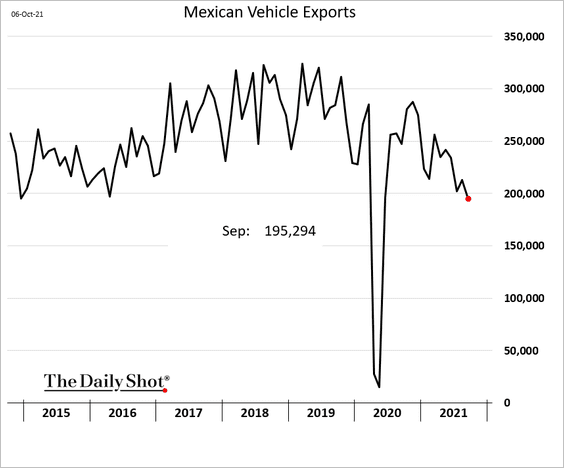
2. Mexico’s vehicle exports slumped.
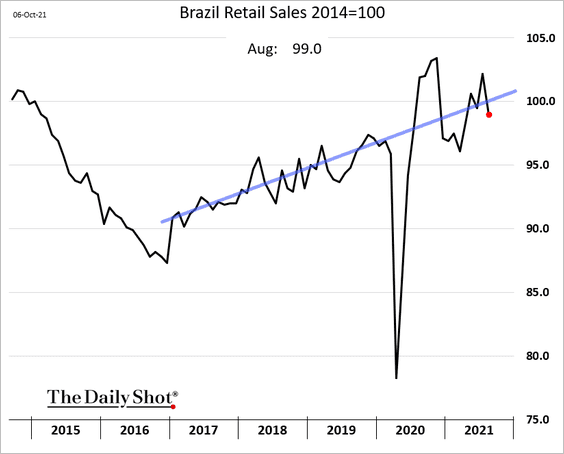
3. Brazil’s retail sales declined in August.
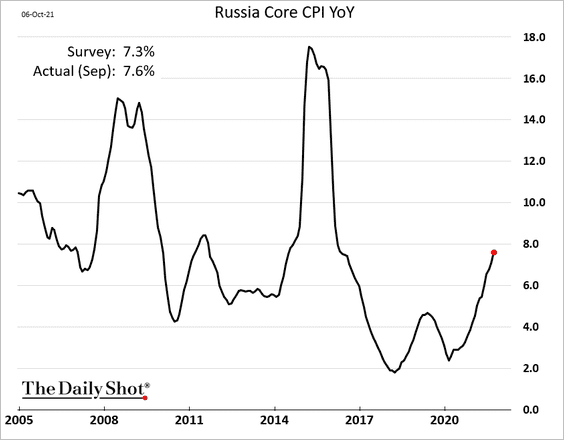
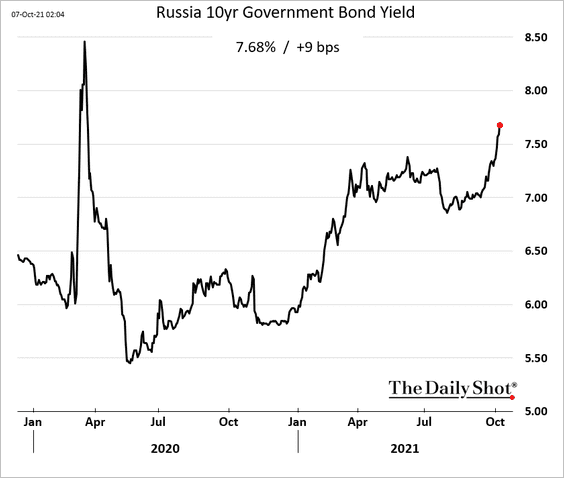
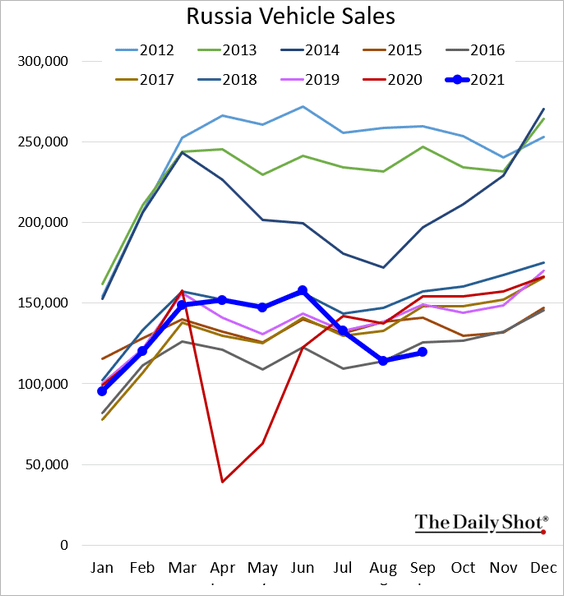
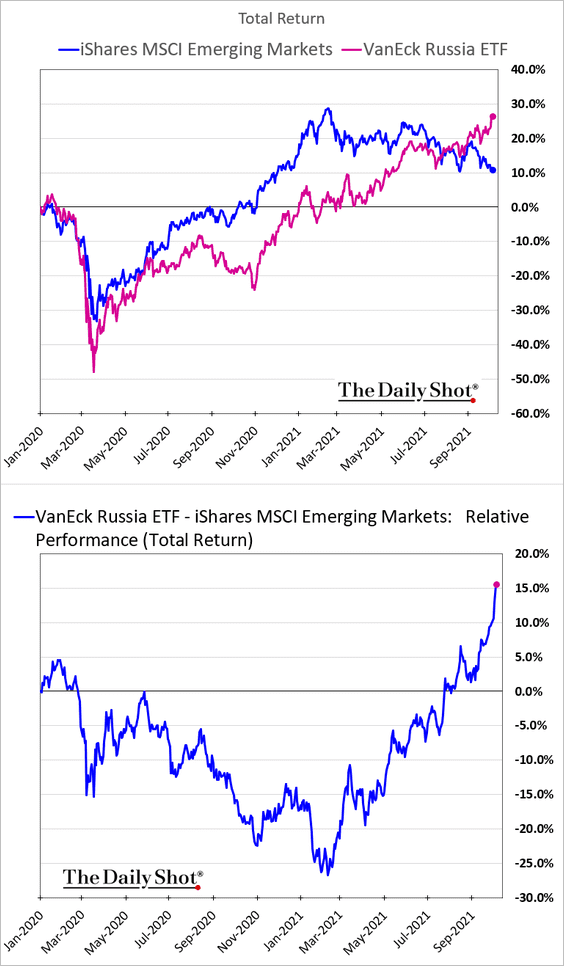
4. Next, we have some updates on Russia.
• Core inflation surprised to the upside.
• Bond yields continue to climb.
• Car sales remain depressed.
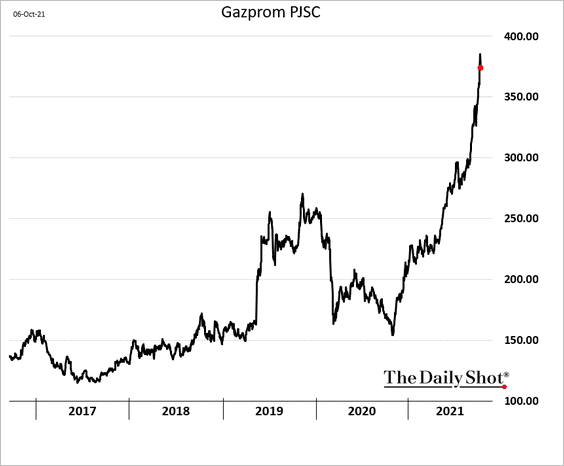
• The stock market has been outperforming as energy prices surge.
• Higher energy prices should boost the ruble.
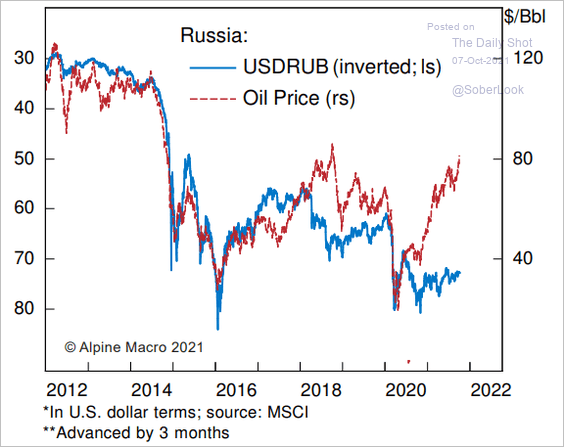 Source: Alpine Macro
Back to Index
Cryptocurrency
1. Bitcoin continues to rally.
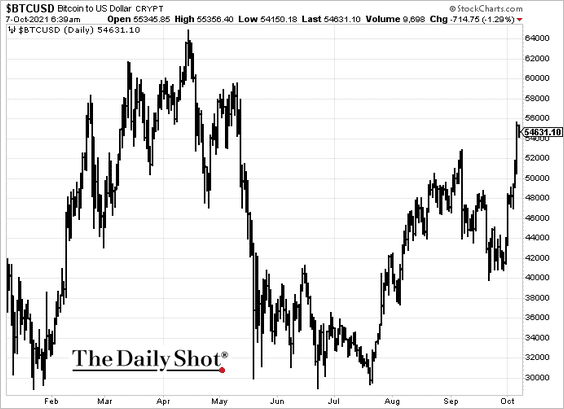
A large buyer (or buyers) placed $1.6 billion of BTC orders in a few minutes, fueling yesterday’s price rally.
 Source: CoinDesk Read full article
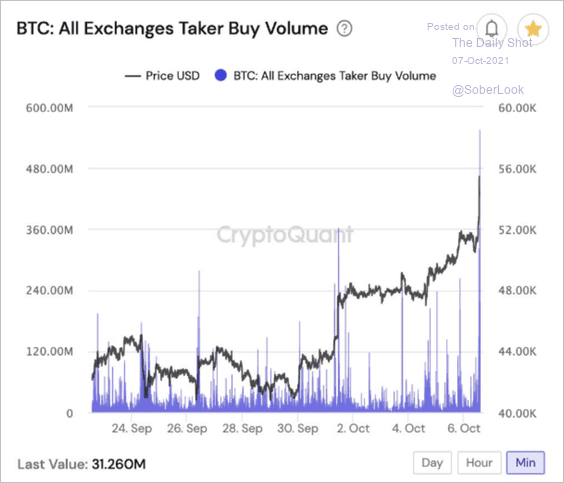 Source: @cryptoquant_com
——————–
2. Bitcoin’s market cap relative to the total crypto market cap is rising, reflecting BTC’s outperformance versus altcoins.
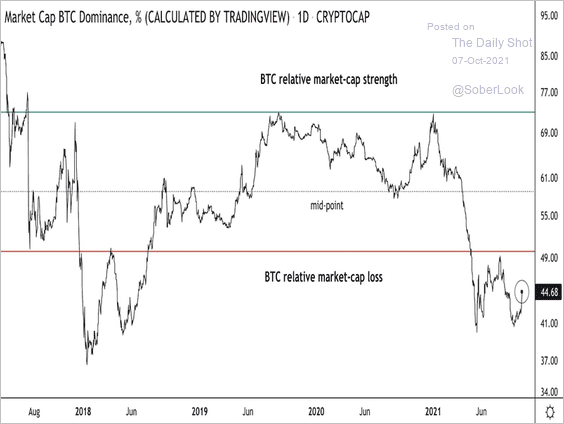 Source: CoinDesk Read full article
Outside of bitcoin, ether’s market cap continues to dominate other altcoins.
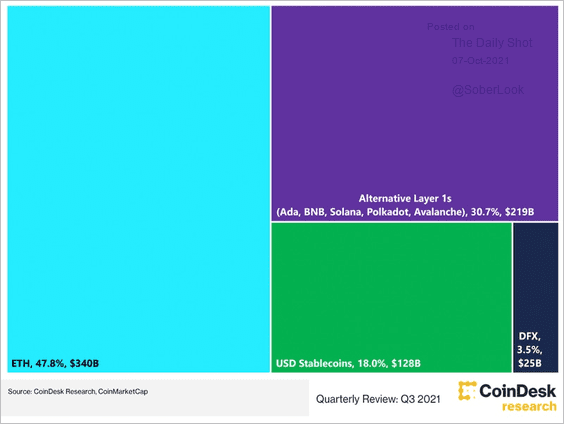 Source: CoinDesk Read full article
——————–
3. Bitcoin’s short-term optimism is at an extreme, which typically precedes a price pullback.
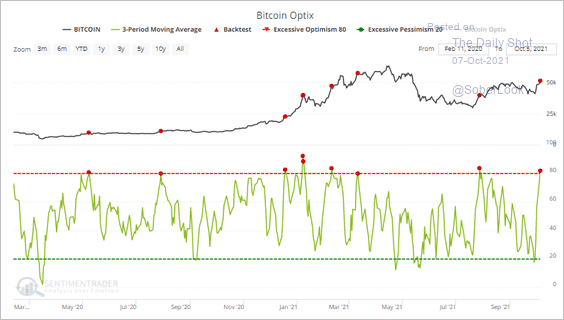 Source: SentimenTrader
4. Ether is underperforming bitcoin. This chart shows the ETH/BTC ratio testing initial support.
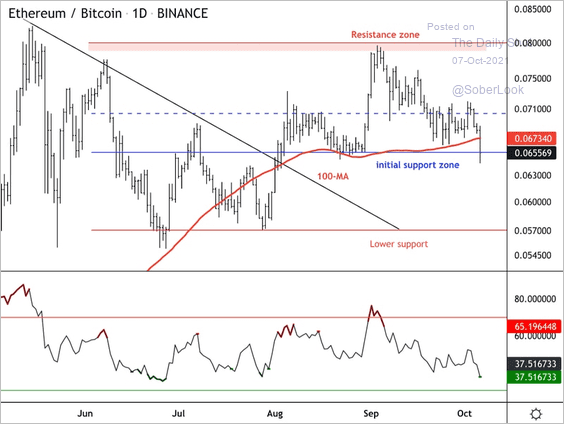 Source: Dantes Outlook
5. The FDIC is looking into whether stablecoins can count as deposits, which could make it eligible for pass-through insurance.
 Source: CoinDesk Read full article
What are the assets backing stablecoins?
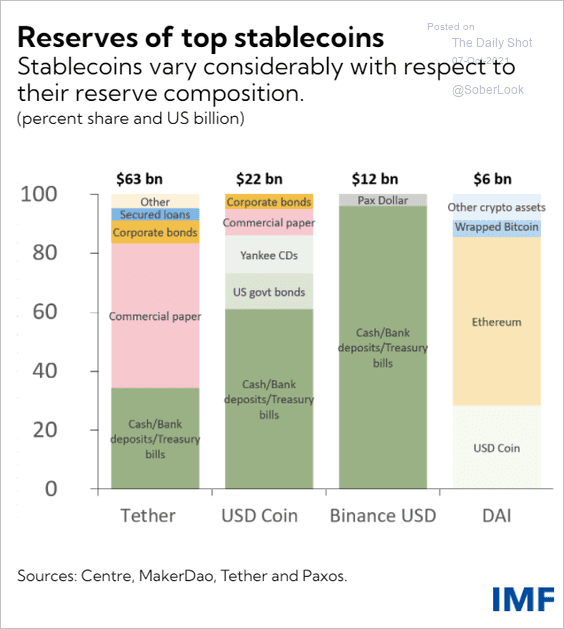 Source: IMF Read full article
Back to Index
Commodities
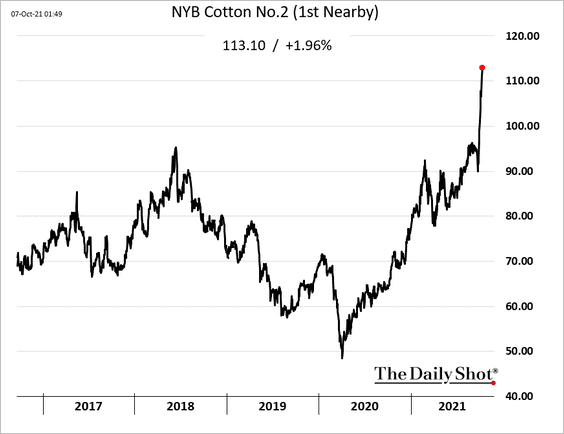
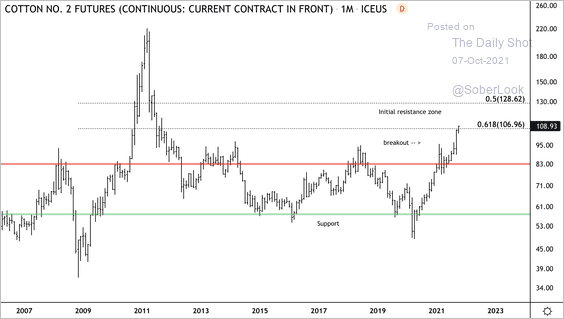
1. Cotton prices are surging.
 Source: Daily Mail Read full article
Cotton futures broke above a long-term range and appear overbought near resistance.
 Source: Dantes Outlook
——————–
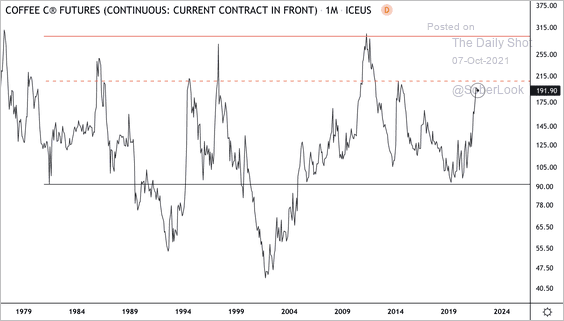
2. The front-month Arabica coffee futures contract is approaching long-term resistance.
 Source: Dantes Outlook
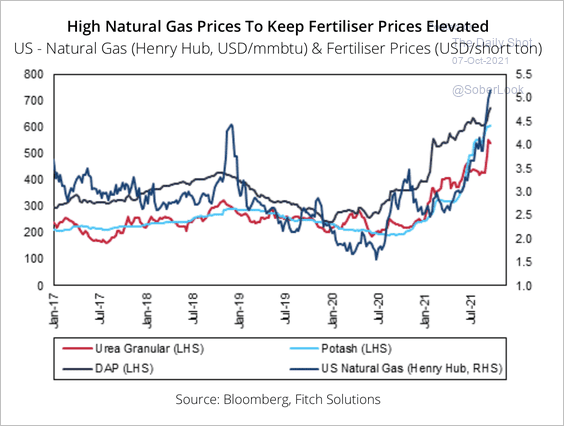
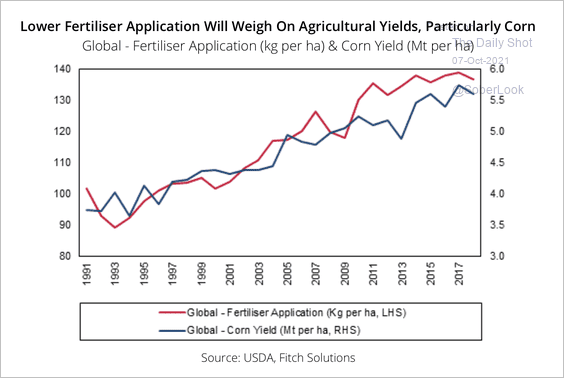
3. Fitch Solutions expects global natural gas prices to remain elevated throughout 2022, driven by subdued supply growth. Consequently, fertilizer prices look set to remain elevated as well.
 Source: Fitch Solutions Macro Research
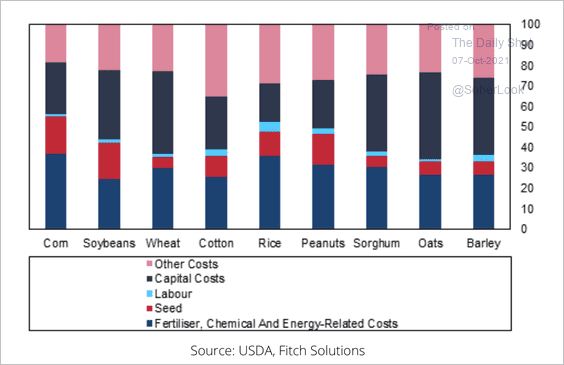
This also points to rising US farm costs, particularly in corn (2 charts).
 Source: Fitch Solutions Macro Research
 Source: Fitch Solutions Macro Research
——————–
4. Silver has been drifting lower.
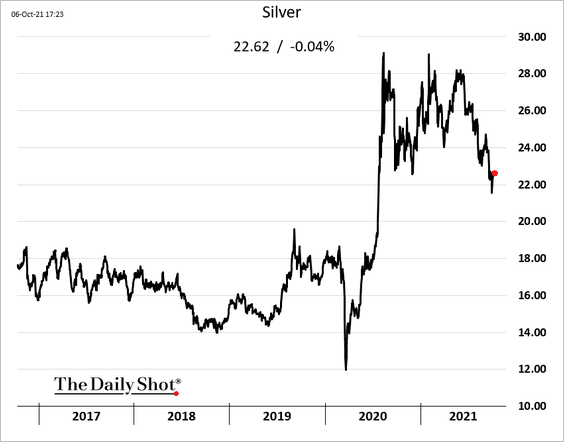
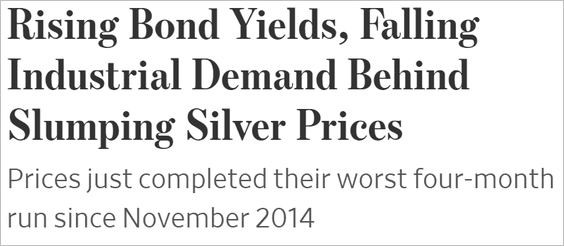 Source: @WSJ Read full article
——————–
5. A stronger US dollar could become a drag on commodities (white = US dollar, inverted; orange = commodities index).
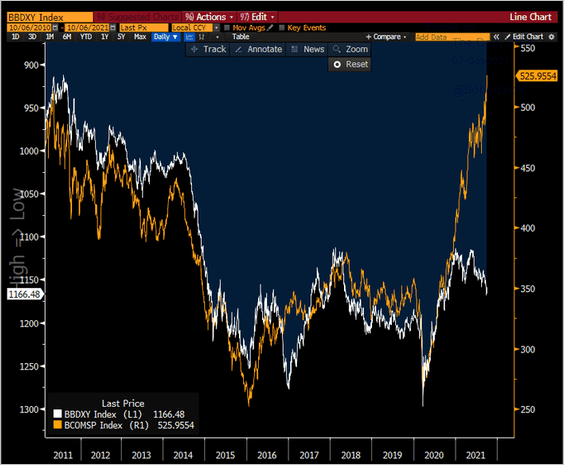 Source: @TeddyVallee
Back to Index
Energy
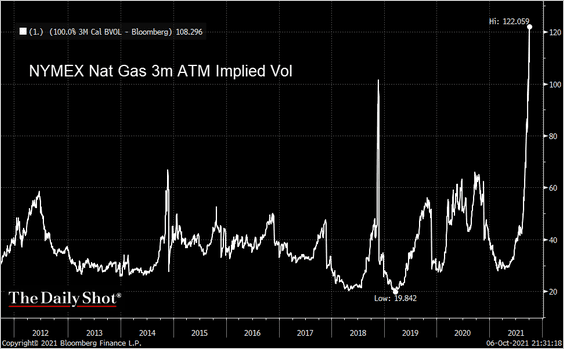
1. Henry Hub natural gas implied volatility hit a record high.
 Source: Reuters Read full article
——————–
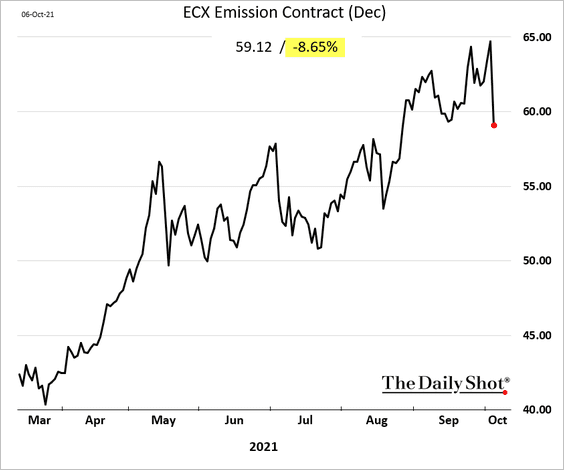
2. Prices on European emission allowances declined sharply amid calls on the EU to curb surging energy prices.
3. US oil and gasoline inventories were a bit higher than expected last week.
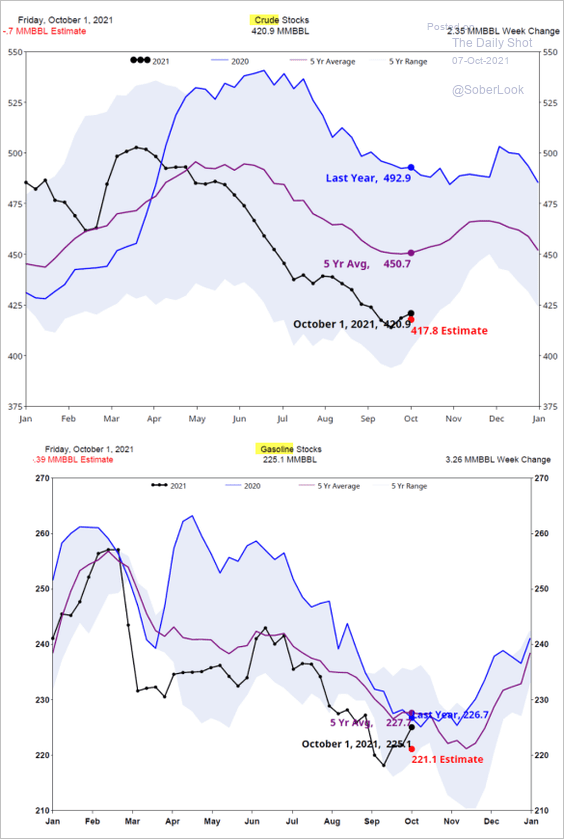 Source: Fundamental Analytics
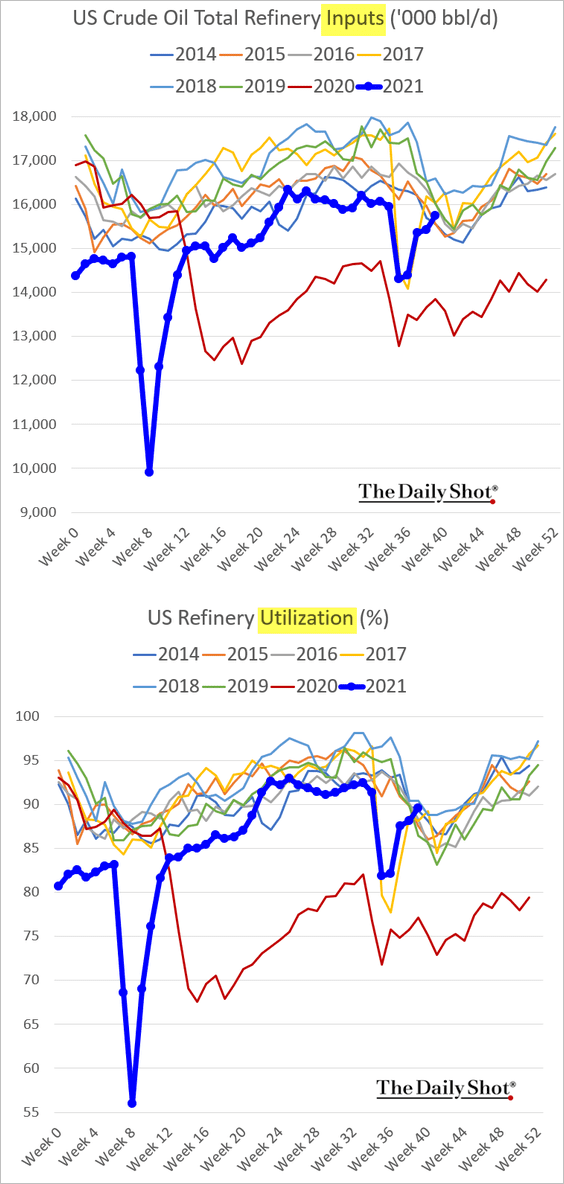
4. Refinery utilization continues to recover.
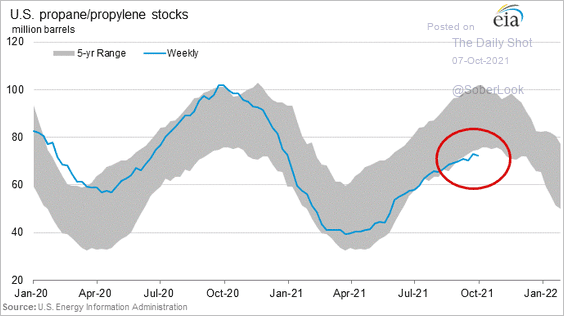
5. For those of us using propane to heat our homes, it’s going to be an expensive winter.
Back to Index
Equities
1. Stocks staged a sharp rebound as the debt-ceiling risks got moved into December (see the US section).
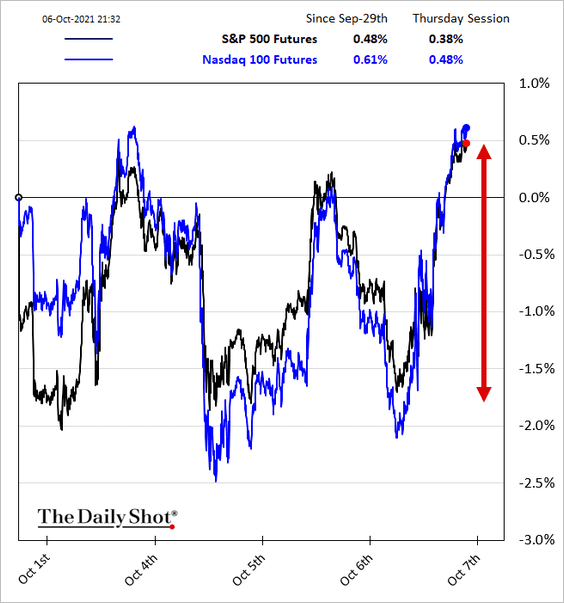
 Source: Bloomberg Read full article
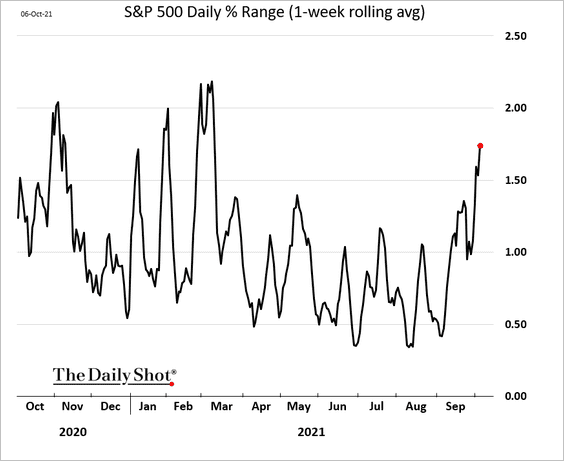
Market swings have been getting larger.
——————–
2. Dividend growers tend to outperform high-yield bonds during times of stress.
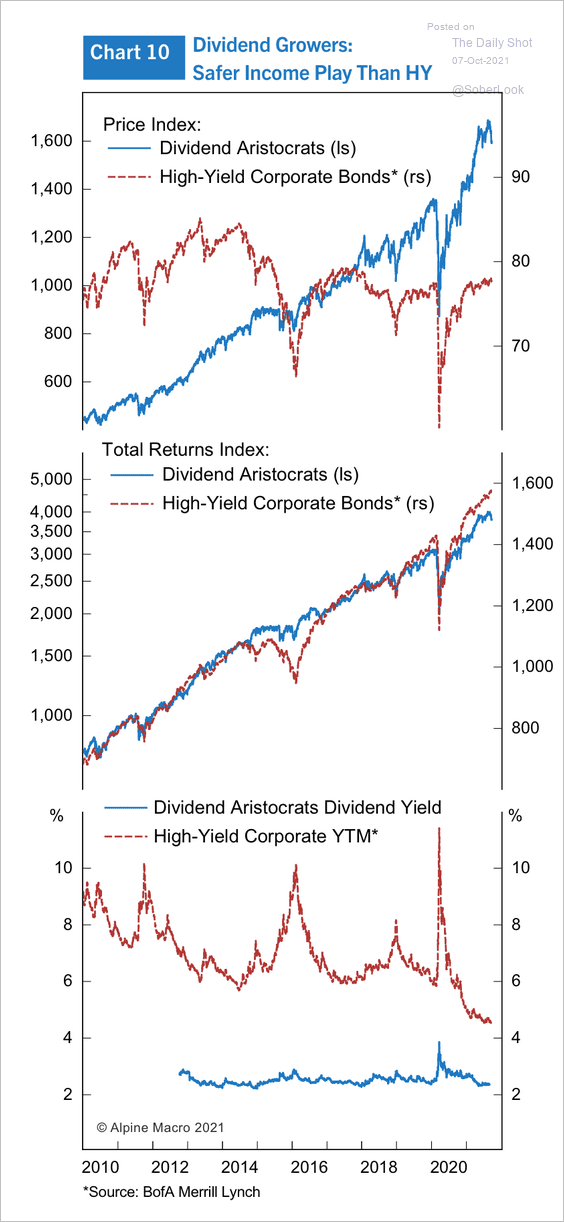 Source: Alpine Macro
3. This chart shows factor excess returns in different volatility regimes.
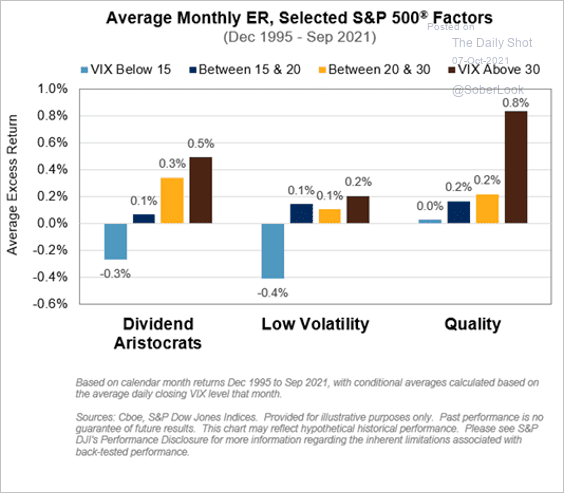 Source: S&P Global Market Intelligence
4. Sector return dispersion collapsed last quarter. Was that the bottom?
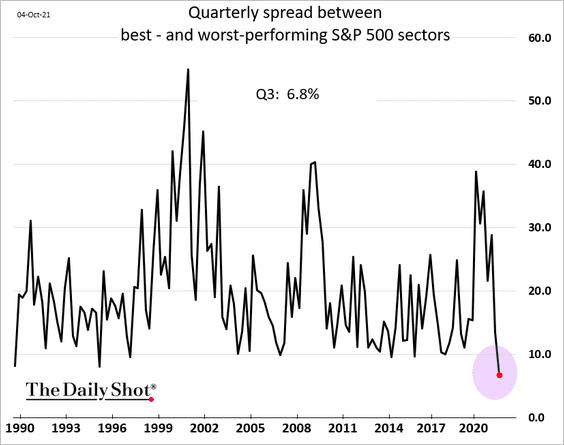 h/t @TheOneDave
5. Hotel and airline stocks are still trading below pre-pandemic levels.
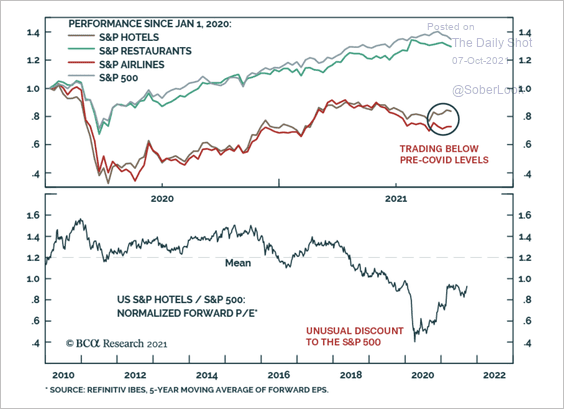 Source: BCA Research
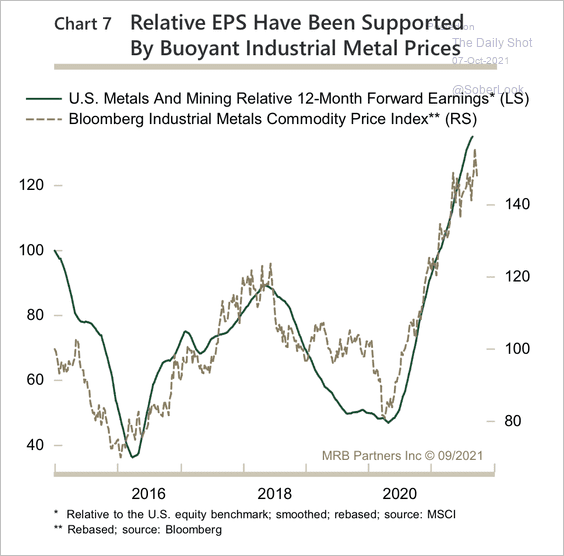
6. US metals and mining stocks have underperformed despite the improvement in forward earnings. Although, relative earnings appear to be peaking (2 charts).
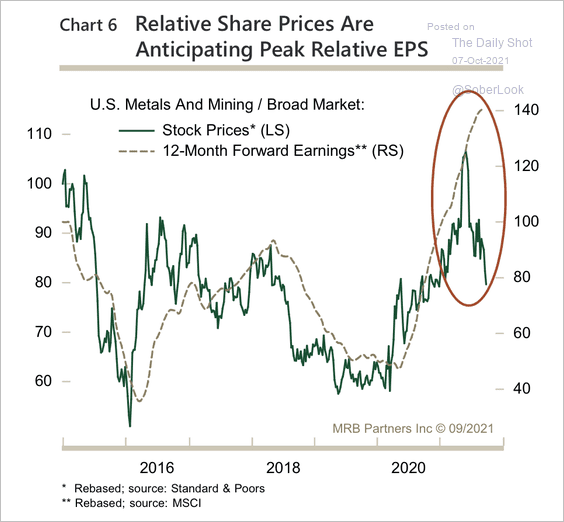 Source: MRB Partners
 Source: MRB Partners
——————–
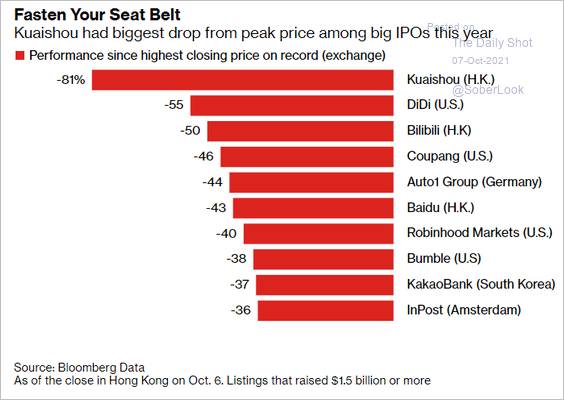
7. Here are some of the biggest drawdowns among recent IPOs (globally).
 Source: Bloomberg Read full article
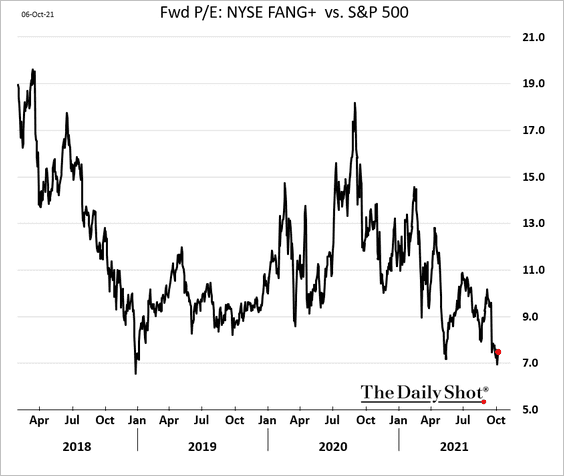
8. The tech mega-caps are trading near the cheapest level in years relative to the S&P 500 (chart shows the forward P/E spread).
9. The median stock in the S&P 500 returned about 16% through Q3.
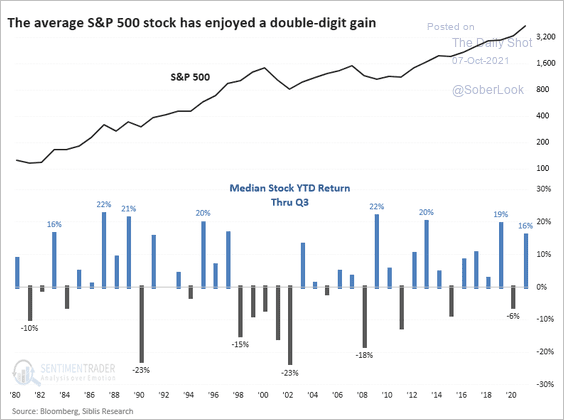 Source: SentimenTrader
10. Overall equity speculative positioning continues to decline.
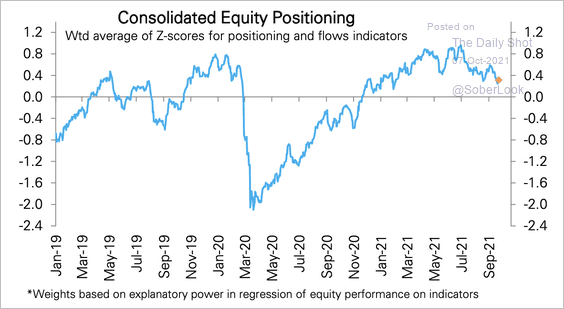 Source: Deutsche Bank Research
11. Despite being a lagging series, GDP growth correlates very well with sales growth and earnings growth. This suggests a persistency in economic cycles should keep both metrics growing.
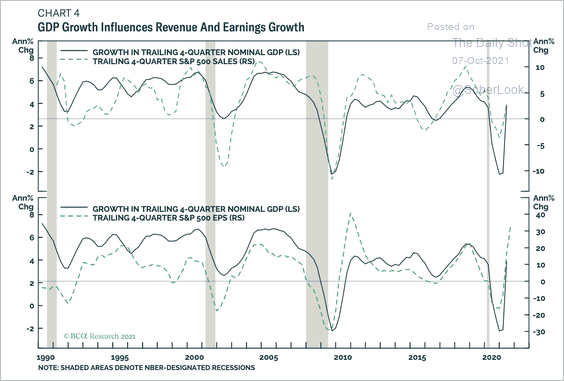 Source: BCA Research
Back to Index
Credit
1. US high-yield issuance this year has been impressive, with most proceeds used to refi existing debt.
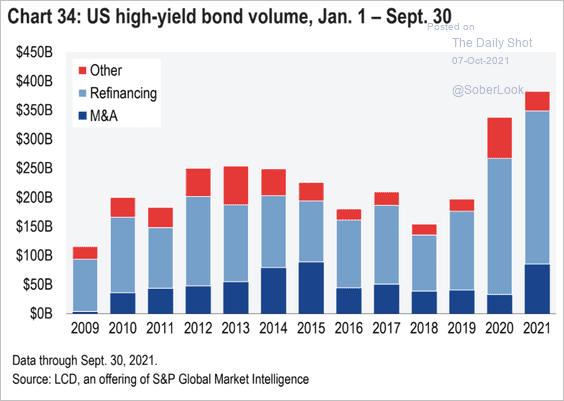 Source: S&P Global Market Intelligence
2. Leveraged loan balances hit $1.3 trillion.
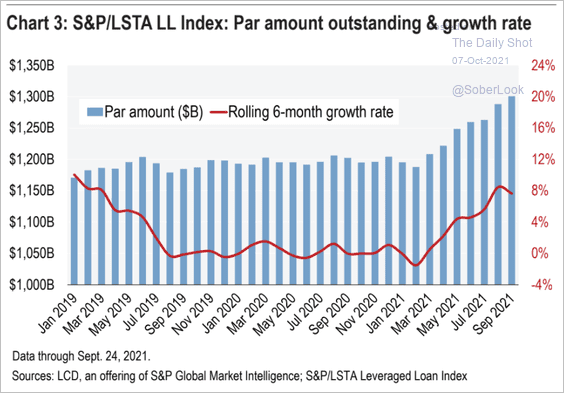 Source: S&P Global Market Intelligence
Back to Index
Rates
1. The copper-to-gold ratio continues to predict higher Treasury yields.
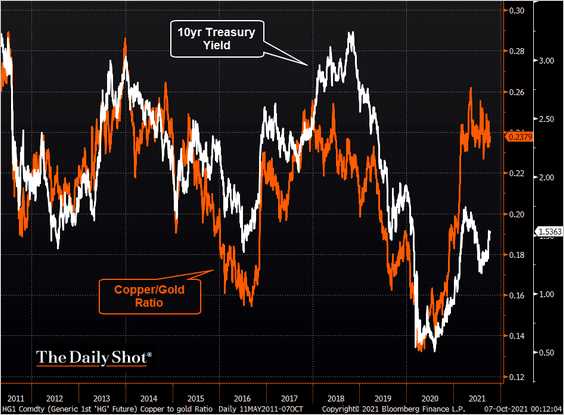 Source: @TheTerminal, Bloomberg Finance L.P.
Here is a similar chart using industrial metals to precious metals ratio.
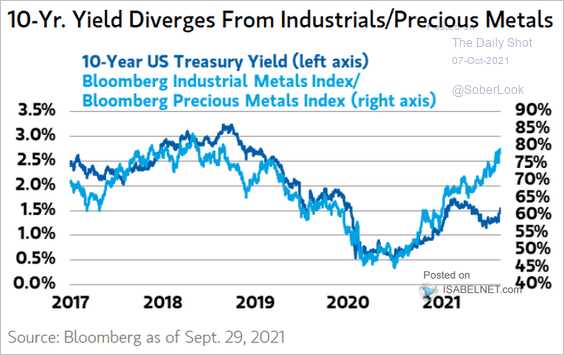 Source: @ISABELNET_SA, @MorganStanley
——————–
2. When do credit investors expect the Fed to hike rates?
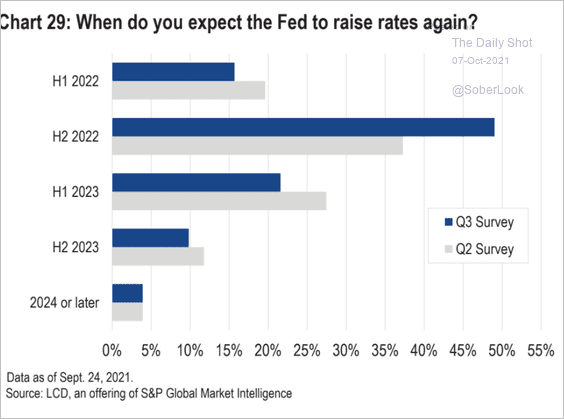 Source: S&P Global Market Intelligence
3. TLT (the iShares long-term treasury ETF) saw substantial outflows recently.
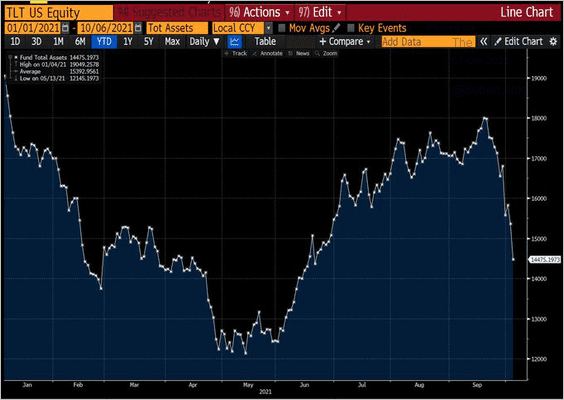 Source: @lisaabramowicz1
 Source: SentimenTrader
Back to Index
Global Developments
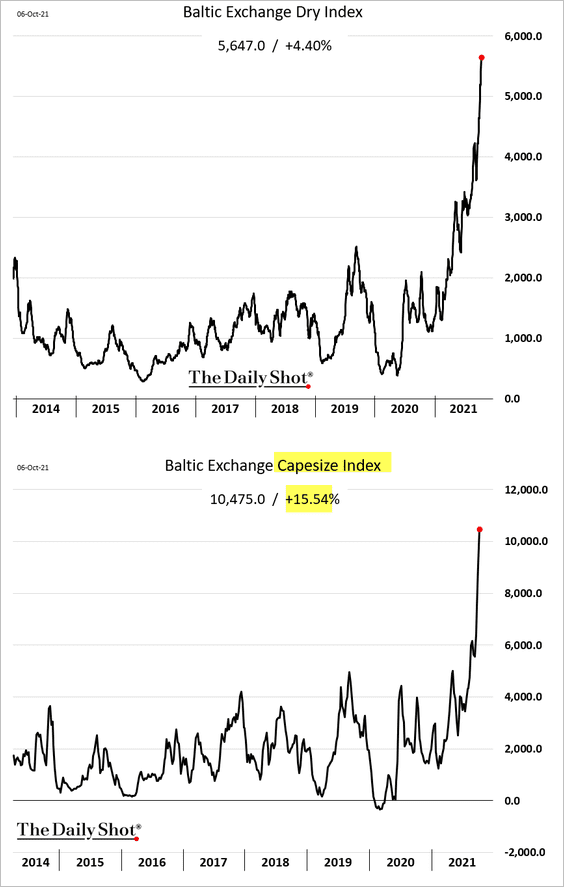
1. Dry bulk shipping costs continue to surge, with the largest ships (Capesize) seeing massive demand.
2. Next, we have long-term returns by asset class.
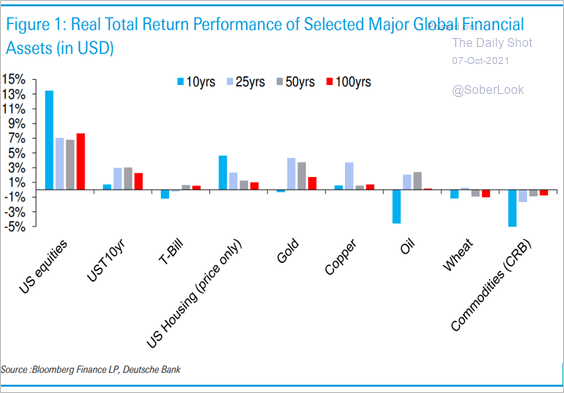 Source: Deutsche Bank Research
3. Oxford Economics estimates that the shortage of safe assets is likely to continue, despite central bank buying plateauing.
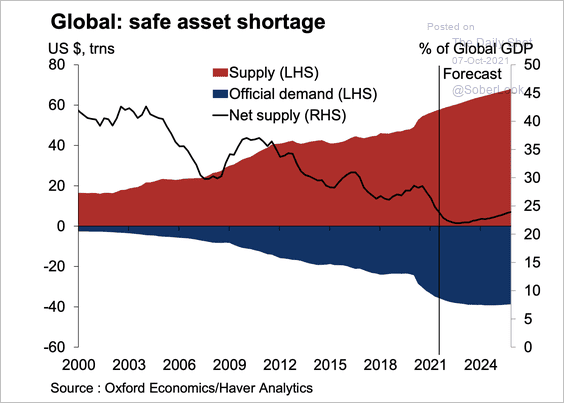 Source: Oxford Economics
——————–
Food for Thought
1. Changes in COVID fatalities:
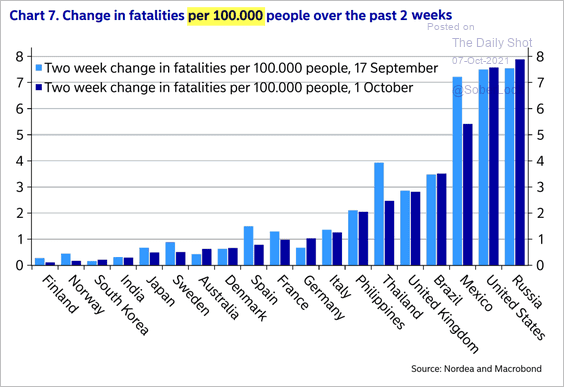 Source: Nordea Markets
2. US pandemic response vs. other advanced economies (% of GDP):
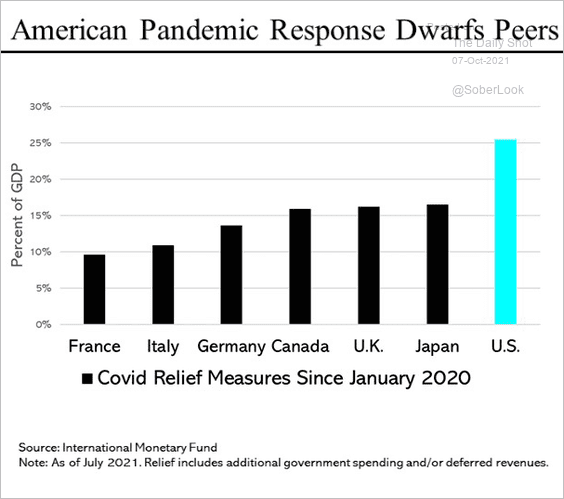 Source: @SteveRattner
3. Countries with the highest and lowest business cost affordability:
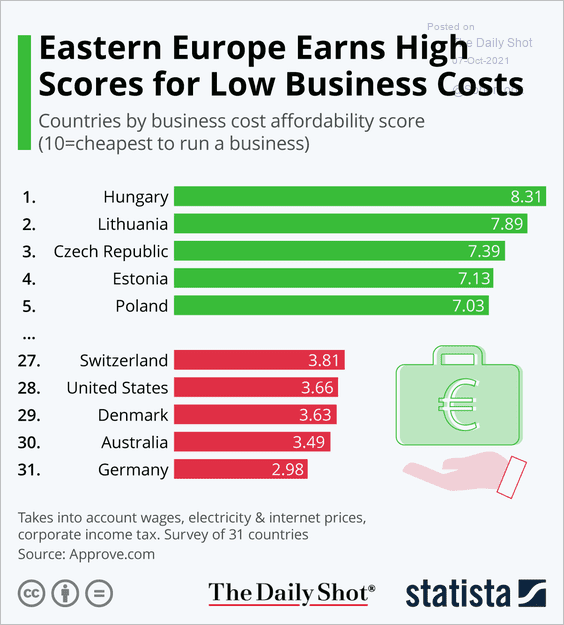 Source: Statista
4. Counties most reliant on coal:
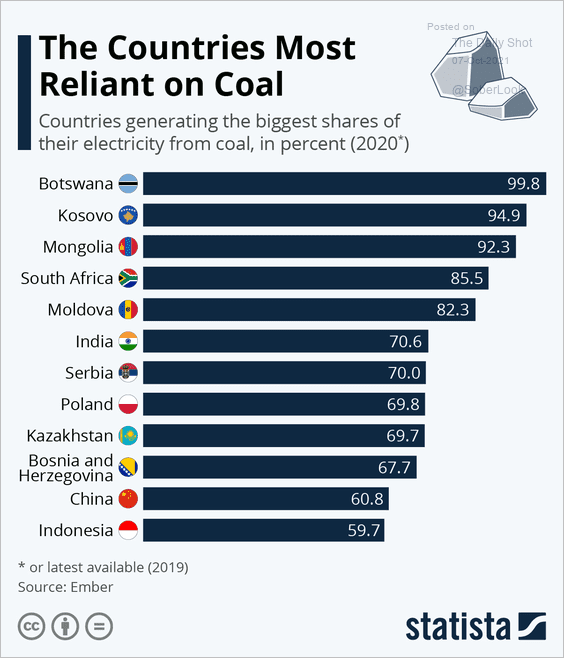 Source: Statista
5. The California oil spill:
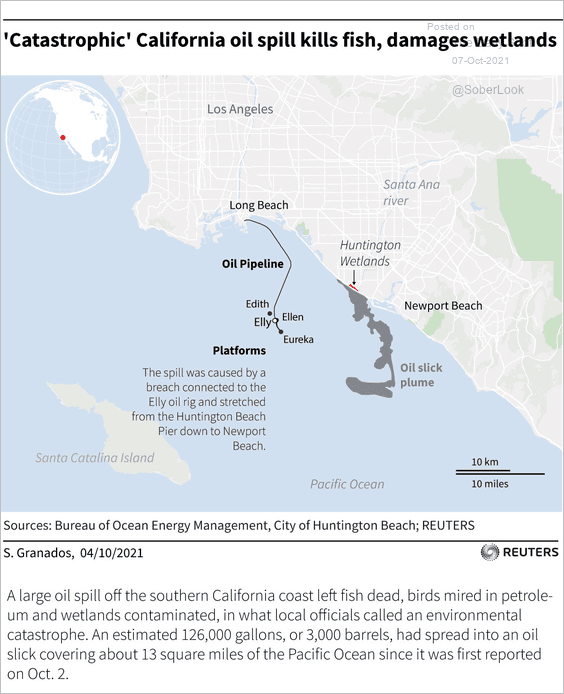 Source: Reuters Read full article
6. Greenhouse gas emissions from food:
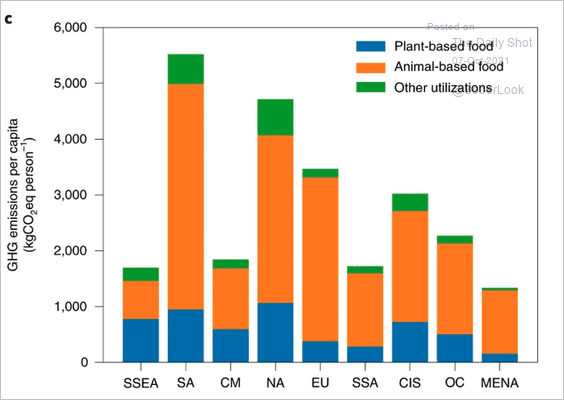 Source: @_HannahRitchie, @NatureFoodJnl Read full article
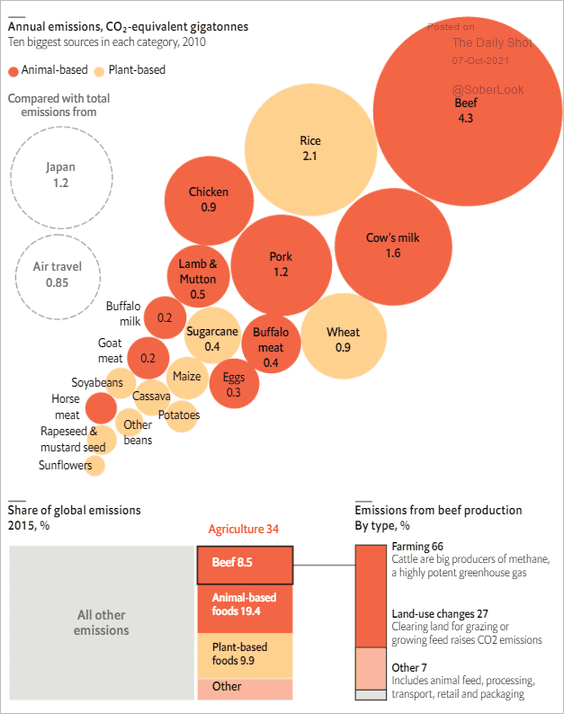 Source: The Economist Read full article
——————–
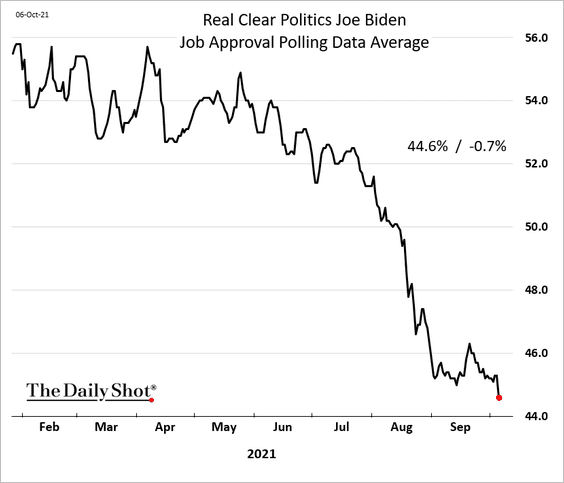
7. President Biden’s approval ratings:
8. Abortion laws by state:
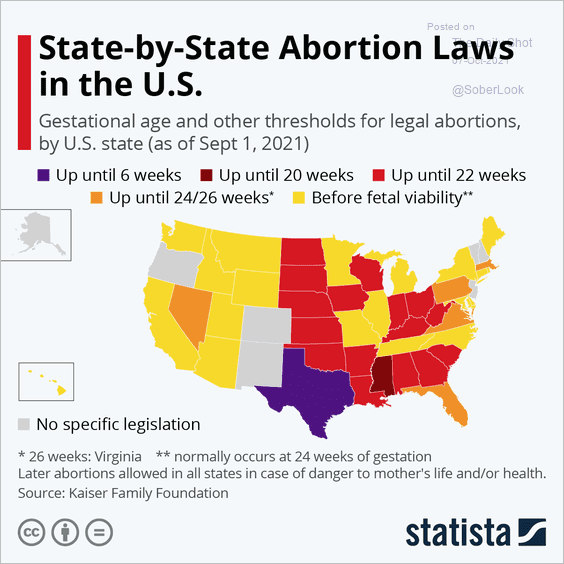 Source: Statista
9. Star Wars filming:
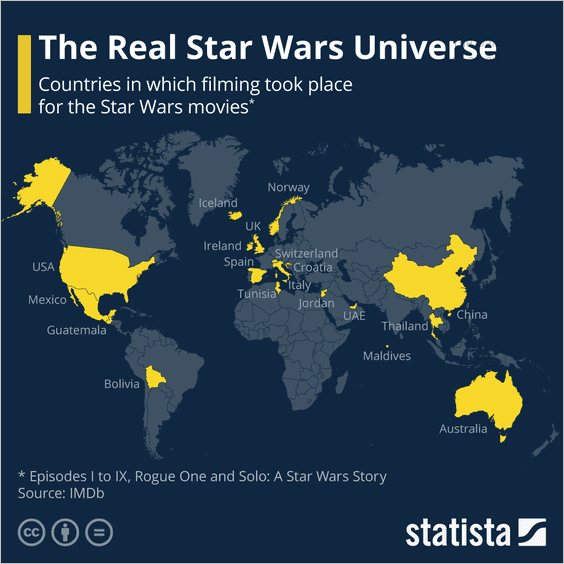 Source: Statista
——————–
Back to Index