
The Daily Shot: 11-Oct-21
• The United States
• Canada
• The United Kingdom
• The Eurozone
• Europe
• Japan
• China
• Emerging Markets
• Cryptocurrency
• Commodities
• Energy
• Equities
• Credit
• Rates
• Global Developments
• Food for Thought
The United States
1. At first glance, the September payrolls report looked hugely disappointing.
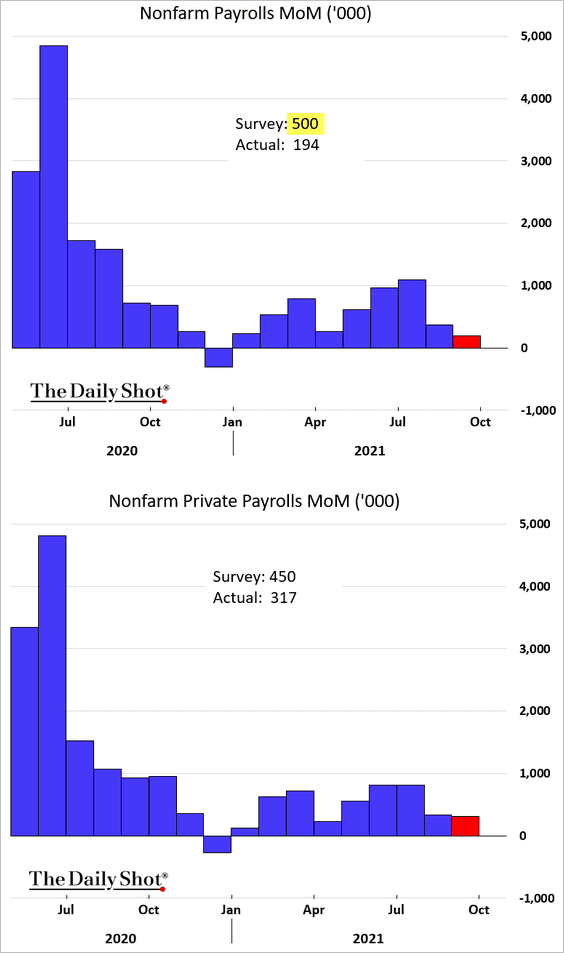
• Private payrolls (2nd chart above) were a bit better. The difference is due to weakness in teacher hiring, which on a seasonally adjusted basis looks like a significant loss in government jobs.
 Source: Scotiabank Economics
The rest of the job growth disappointment was attributed to the Delta variant spike. But there is more to the story. The report shows an ongoing tightening in the labor market and accelerating wage growth. It is certainly not weak enough to derail the Fed’s taper plans.
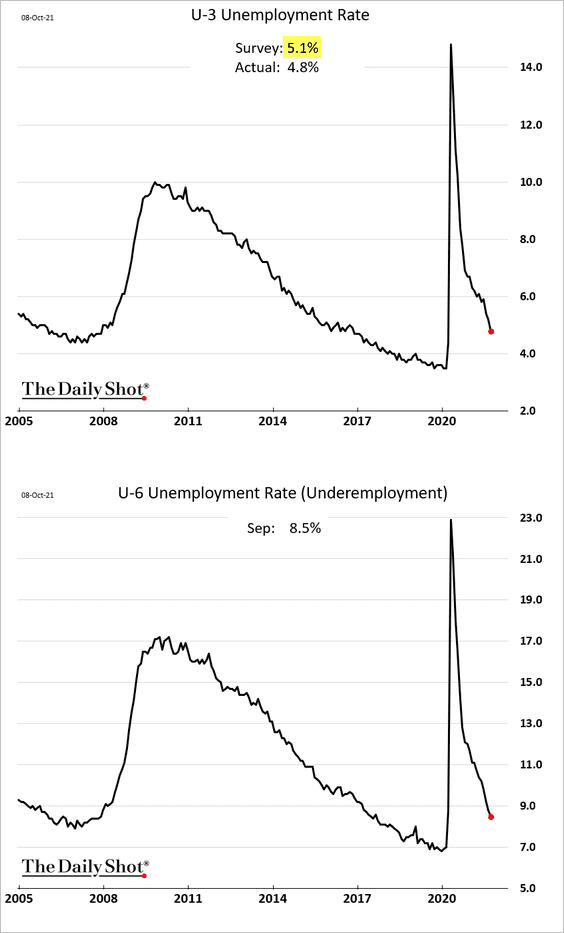
• The unemployment rate was lower than expected, dipping below 5%.
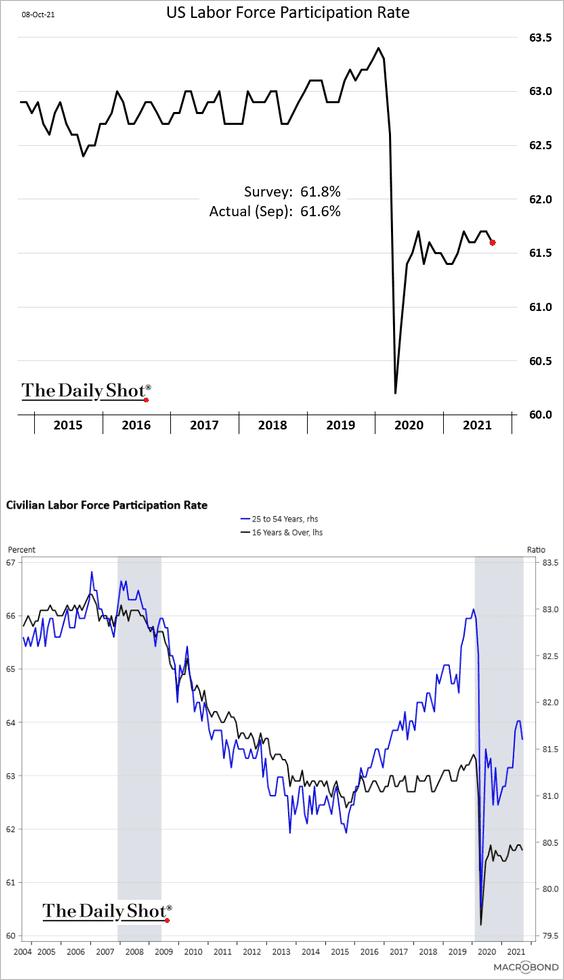
• The participation rate declined, contributing to labor shortages.
 Source: Chart and data provided by Macrobond
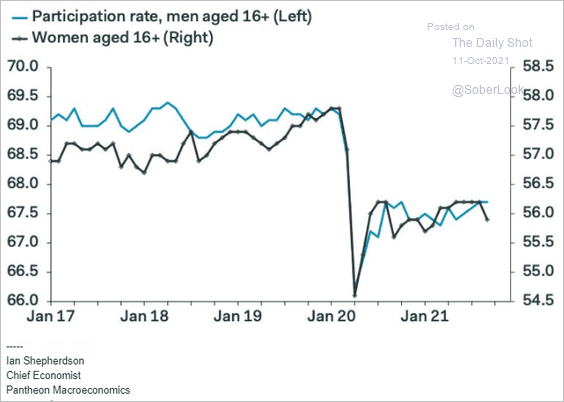 Source: Pantheon Macroeconomics
• Weekly earnings rose sharply, driven by both higher wages and more hours.
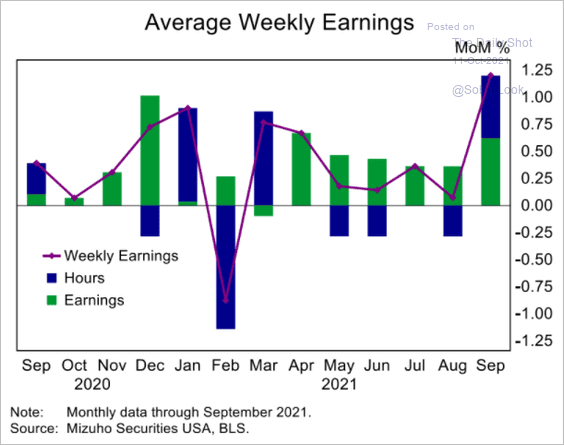 Source: Mizuho Securities USA
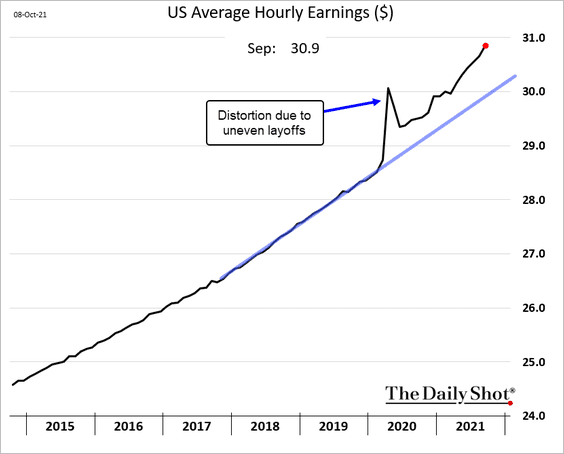
The pace of hourly wage increases is now well above pre-COVID levels.
• Of course, the labor market recovery has a long way to go (2 charts).
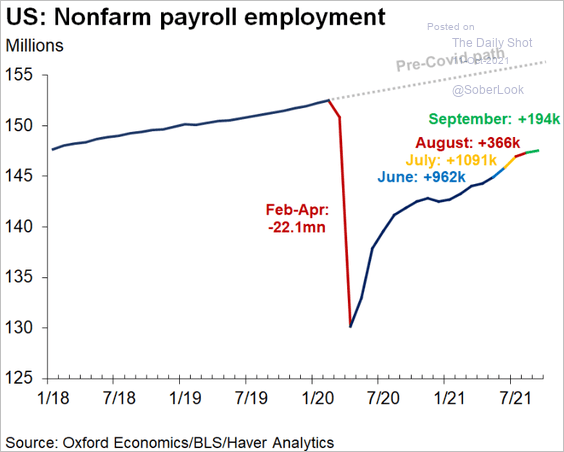 Source: @GregDaco
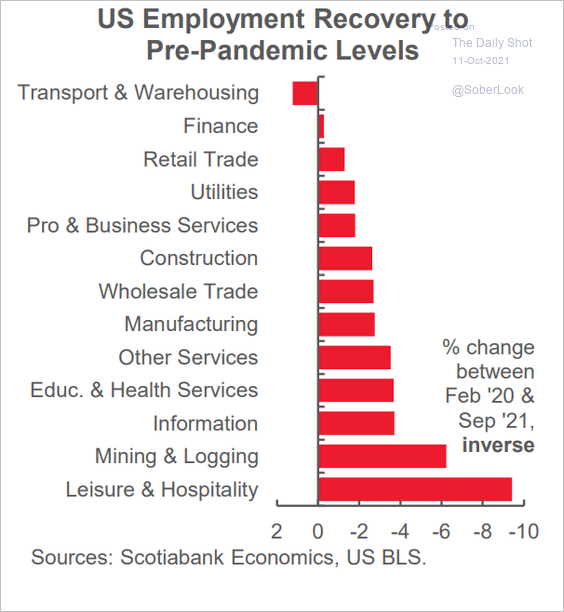 Source: Scotiabank Economics
Here is a comparison to the post-2008 recovery.
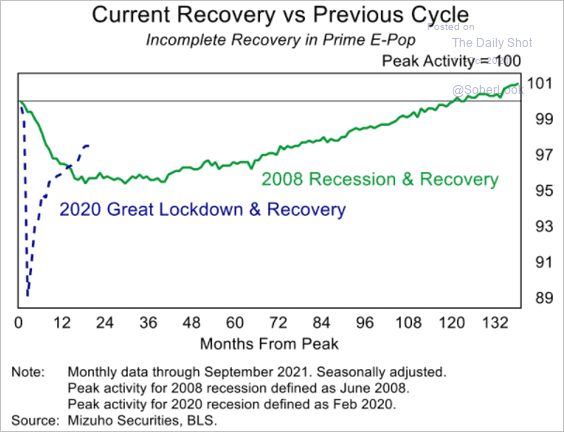 Source: Mizuho Securities USA
• This chart shows the contributions to changes in the unemployment rate (LF Enter = people entering the labor force, LF exit = exiting the labor force, New E = newly employed, New U = newly unemployed).
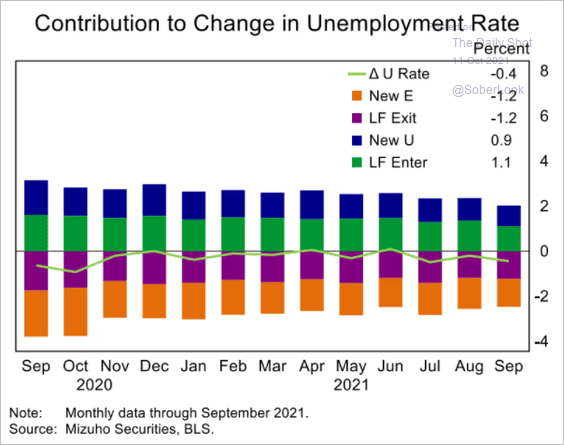 Source: Mizuho Securities USA
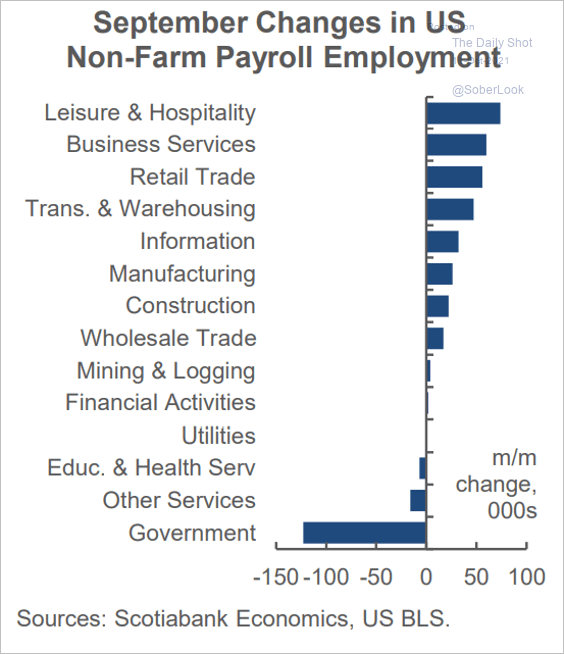
• Finally, we have the September employment leaders and laggards.
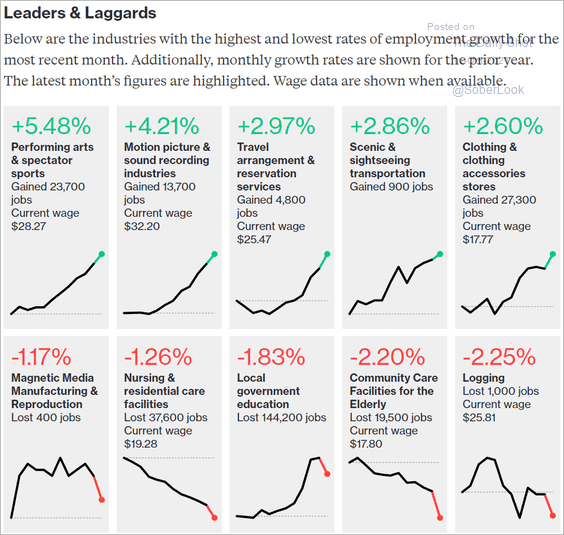 Source: Bloomberg Read full article
——————–
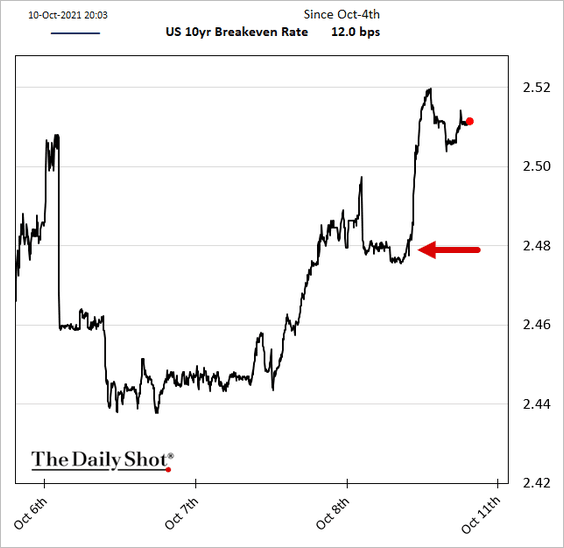
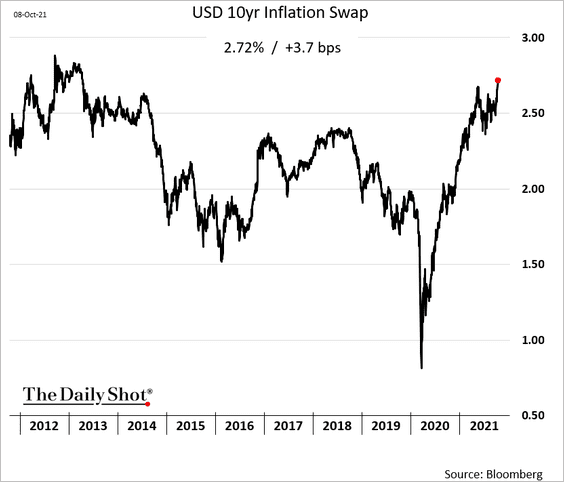
2. Once the market recognized the labor market tightening trend in the jobs report, it sent Treasury yields and inflation expectations higher.
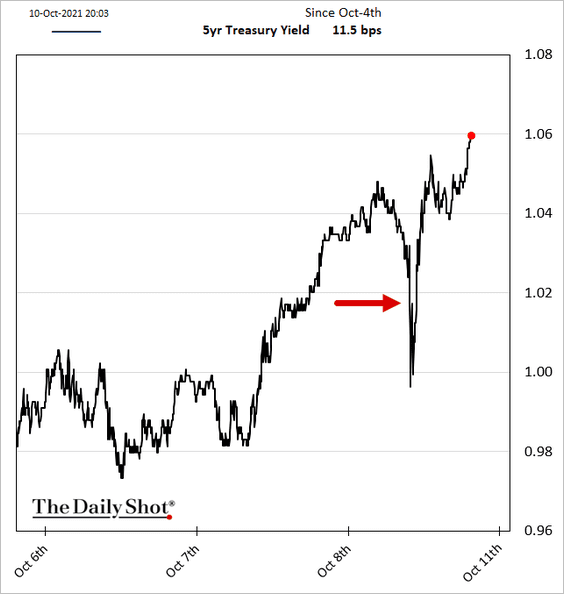
 Source: Bloomberg
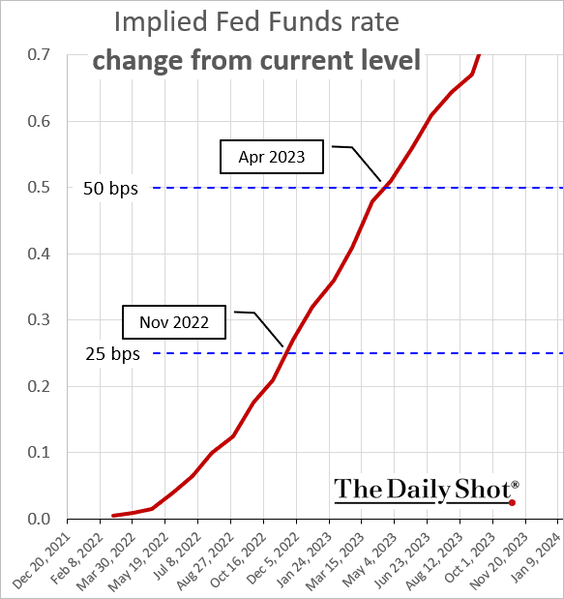
• The first full rate hike is now priced in for November of next year.
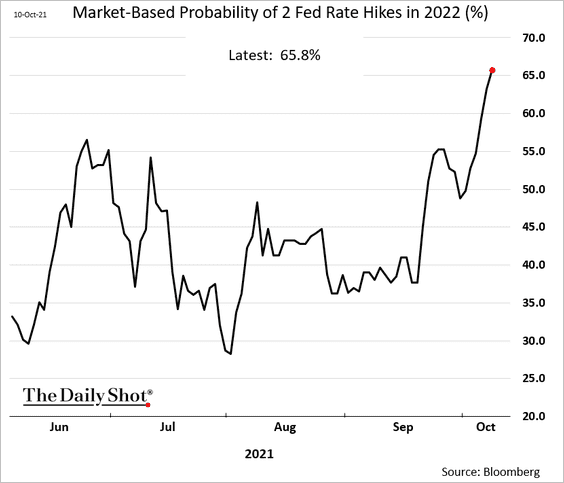
• The probability of two rate hikes next year is now above 65%.
• The 10yr inflation swap rate (inflation expectations) hit the highest level since 2013.
——————–
3. While the debt limit crisis has been averted in the short term, the US Treasury is massively underfunded.
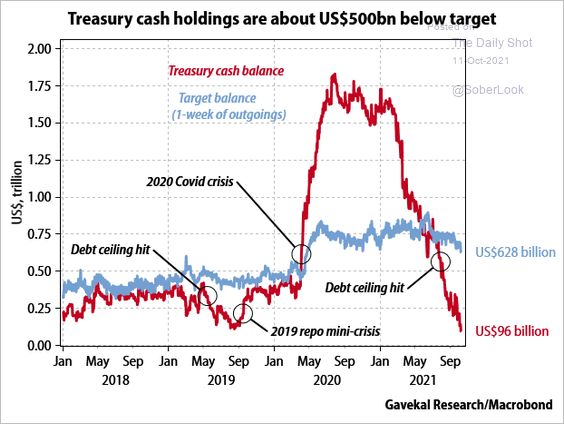 Source: Gavekal Research
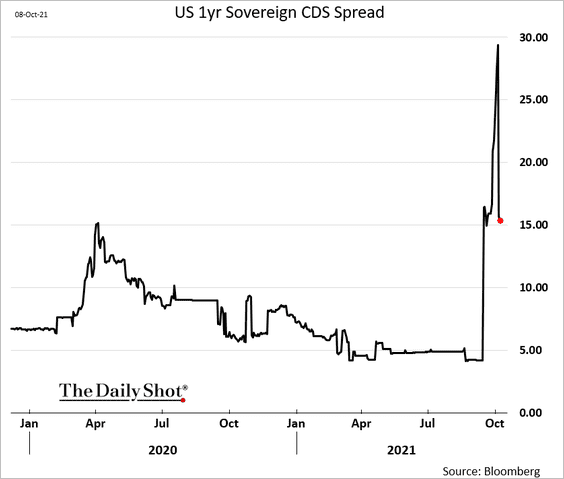
The US sovereign credit default swap spreads remain elevated.
——————–
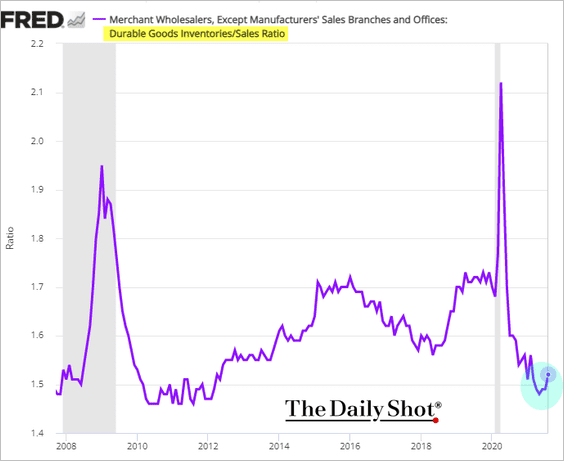
4. Next, we have some updates on the supply chain challenges.
• Cargo vessels waiting to be unloaded in LA (still extremely jammed up):
 Source: MarineTraffic
• Large companies chartering expensive smaller private ships (to build inventories before the holidays):
 Source: @WSJ Read full article
• Container shipping costs:
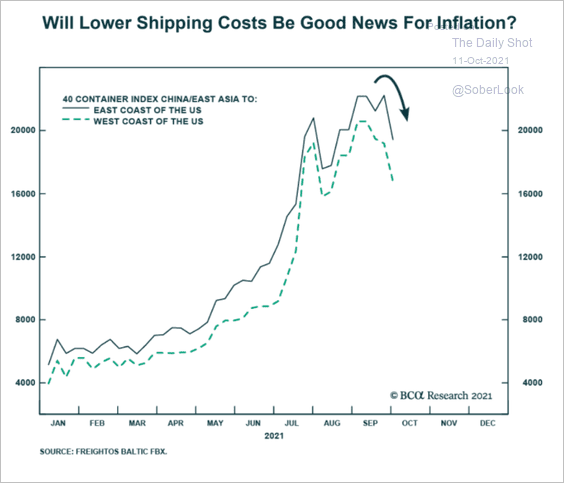 Source: BCA Research
• Durables inventories-to-sales ratio (starting to recover):
Inventory-to-sales ratios by sector:
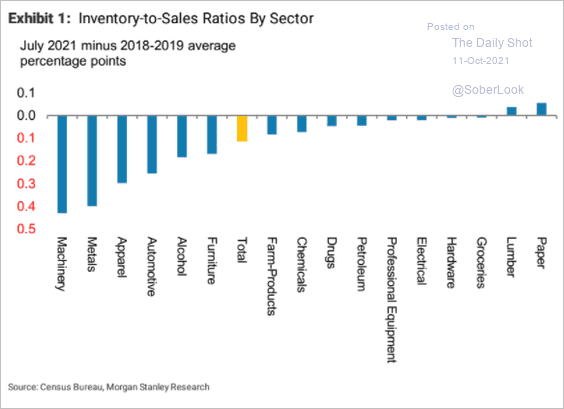 Source: Morgan Stanley Research
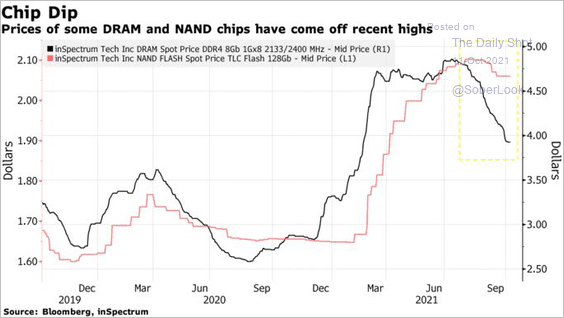
• Chip prices:
 Source: Bloomberg Read full article
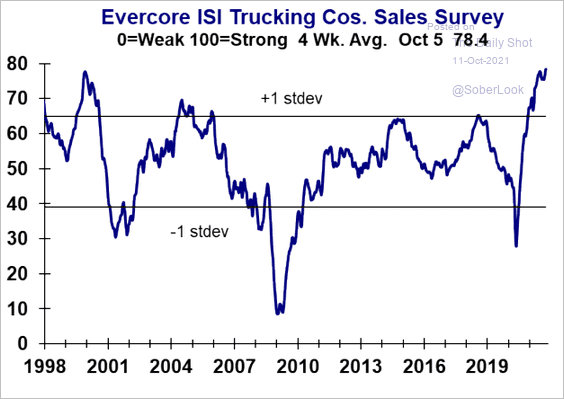
• Evercore ISI’s trucking companies index:
 Source: Evercore ISI
Back to Index
Canada
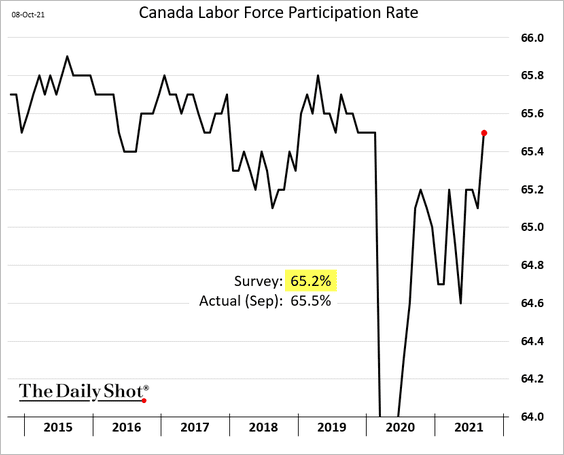
1. Unlike the US, Canada’s jobs report was much stronger than the markets were expecting, with gains driven by full-time jobs.
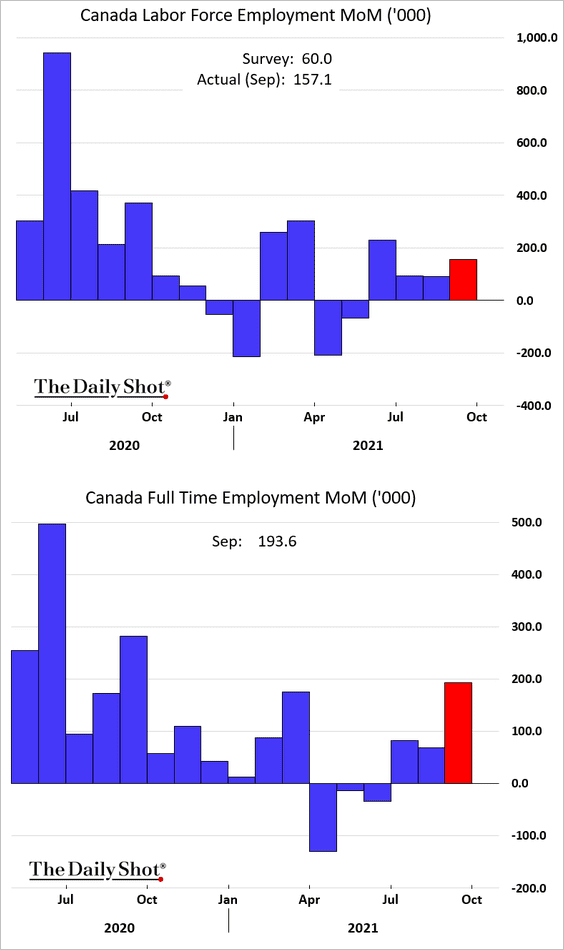
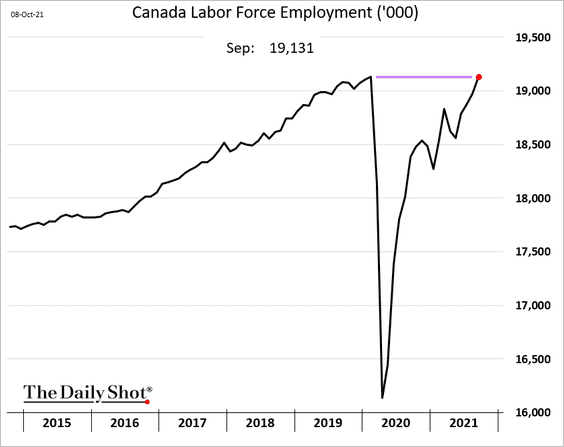
• Canada’s total employment has fully recovered.
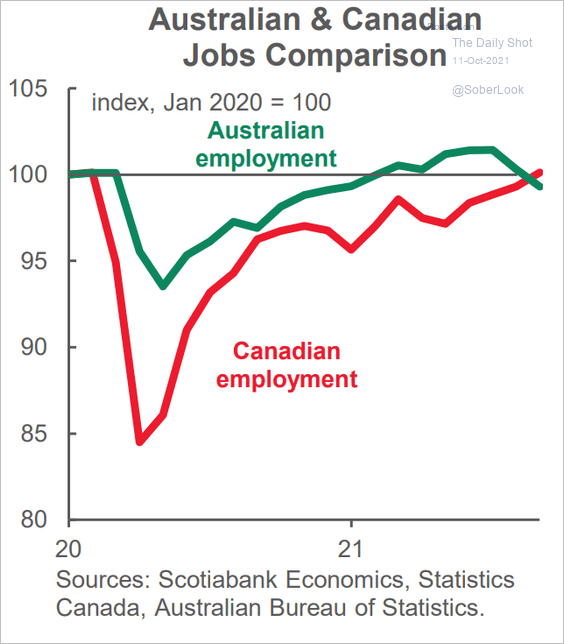
By the way, here is a comparison to Australia.
 Source: Scotiabank Economics
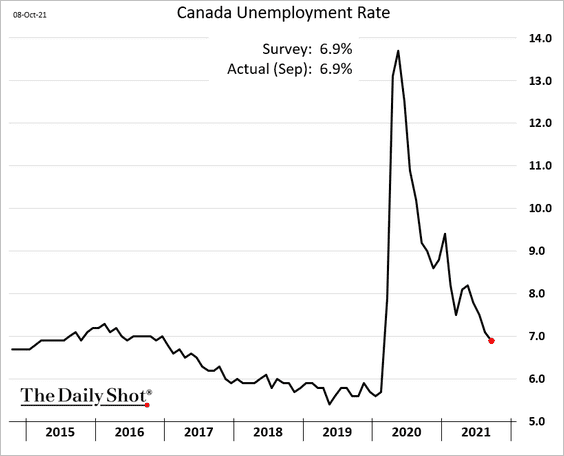
• The unemployment rate continues to decline.
• The participation rate has also fully recovered.
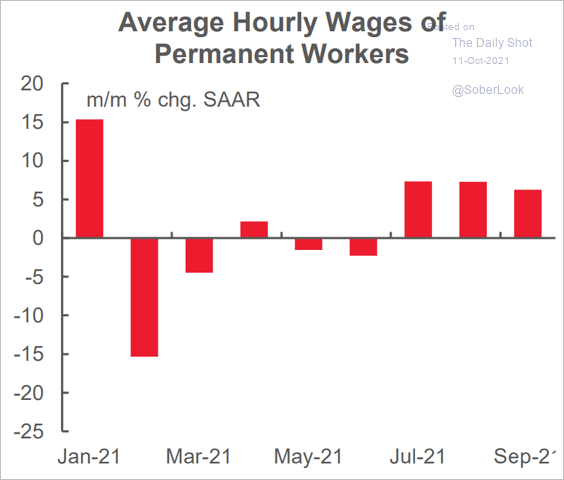
• Wage growth has been robust.
 Source: Scotiabank Economics
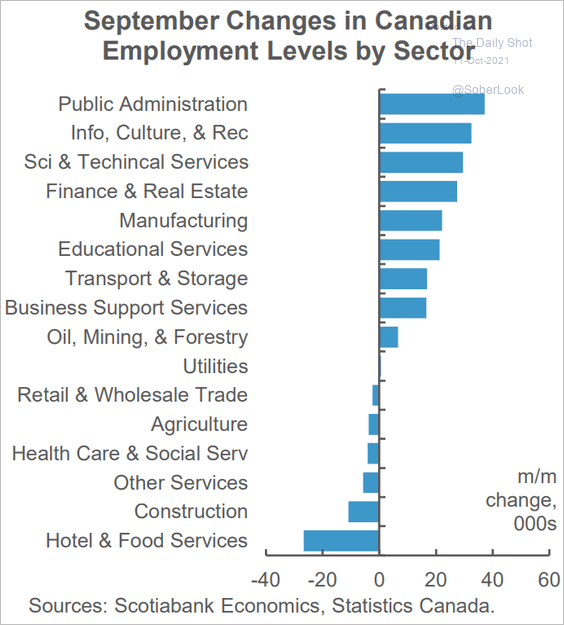
• This chart shows employment changes by sector.
 Source: Scotiabank Economics
——————–
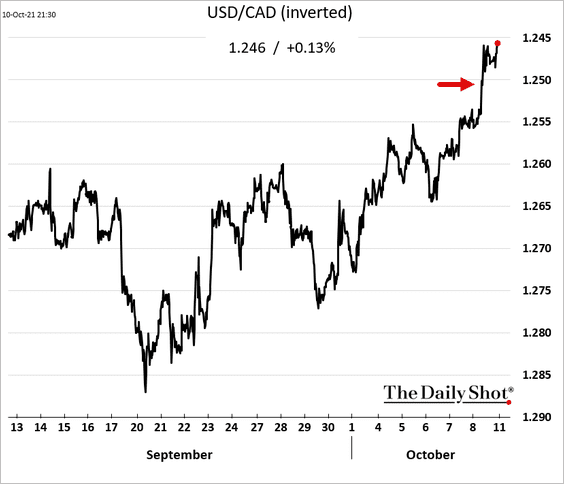
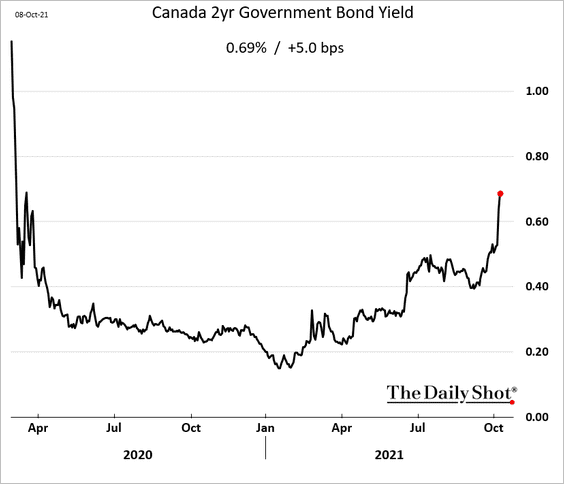
2. The loonie and bond yields jumped in response to the jobs report (and the contrast with the US). Rate hikes are coming sooner than the market was expecting.
Back to Index
The United Kingdom
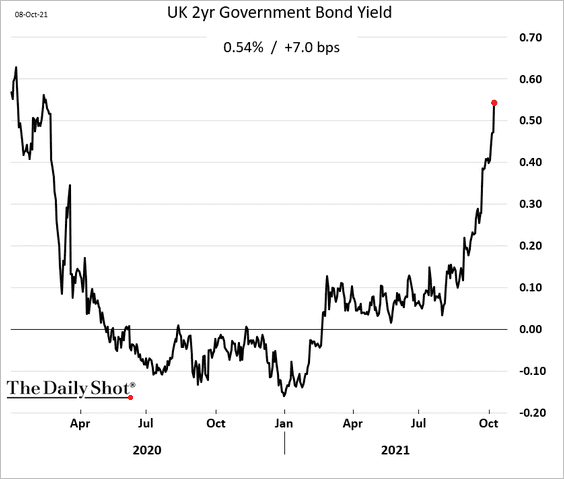
1. Gilt yields are surging (2 charts).
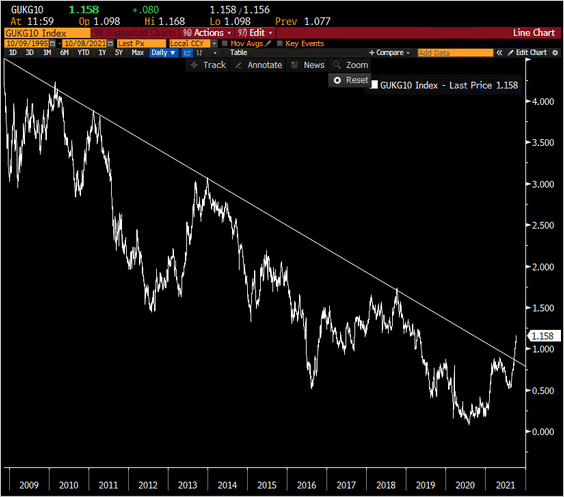 Source: @TeddyVallee
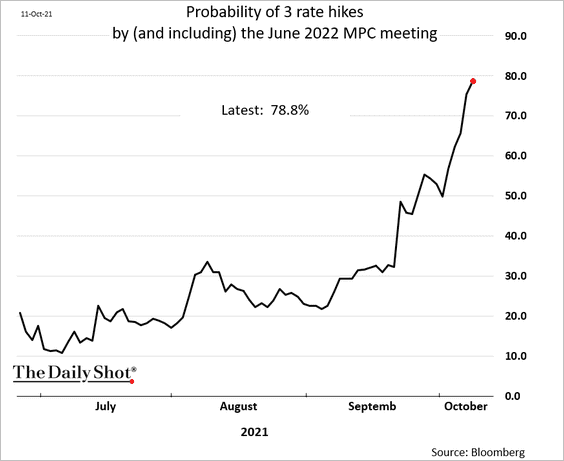
The probability of three BoE rate hikes by next June is approaching 80%.
——————–
2. Natural gas prices are coming off the highs but are still exorbitant.
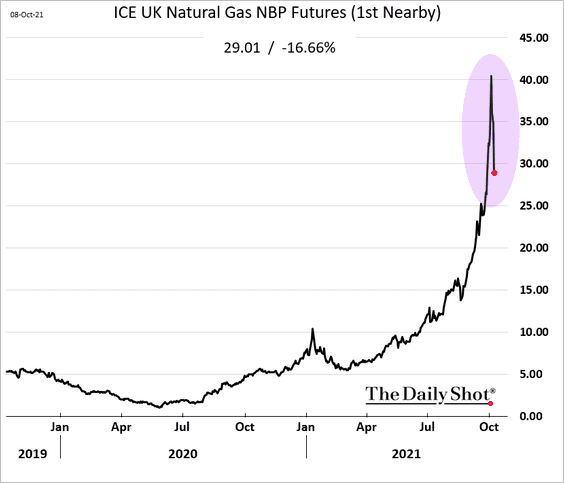
The government is talking about supporting energy-intensive industries.
 Source: Reuters Read full article
Back to Index
The Eurozone
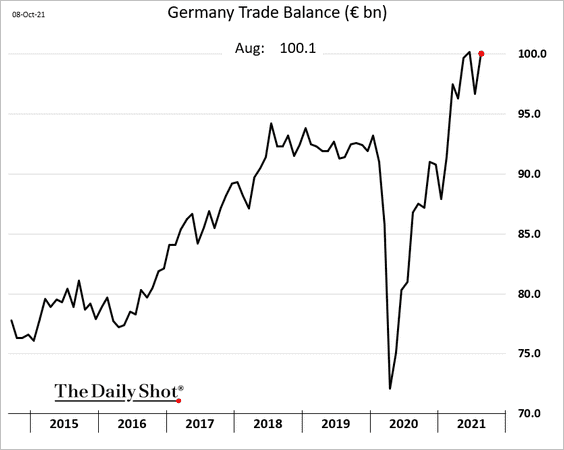
1. Germany’s trade surplus surprised to the downside, with the declining trend continuing.
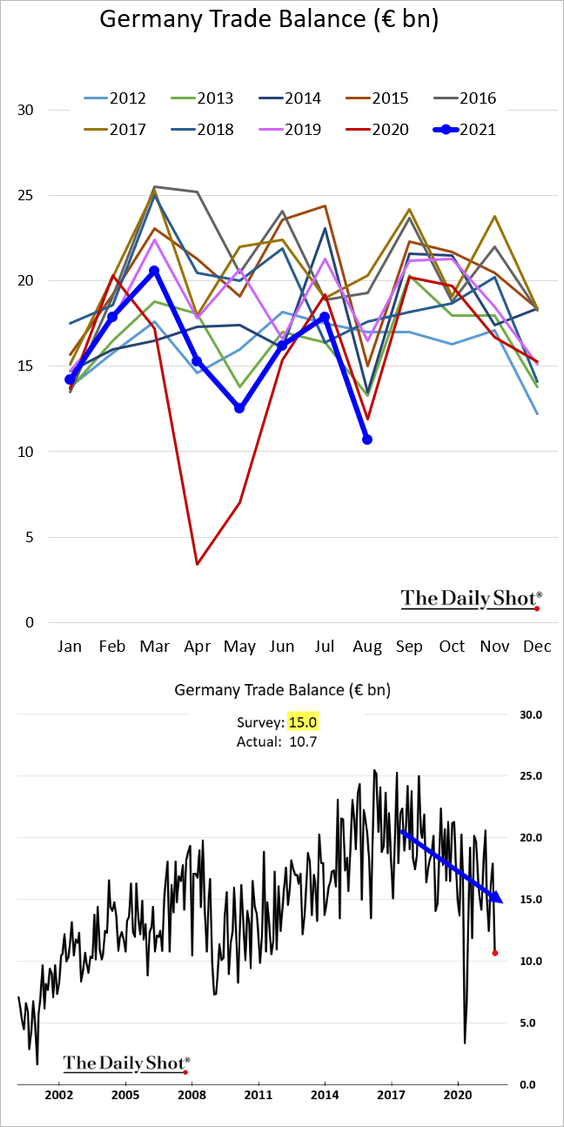
Exports were softer than expected while imports surged (the title should say “imports”).
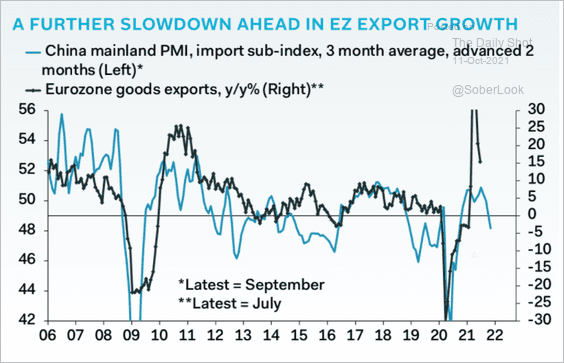
Economic weakness in China is a drag on the Eurozone’s exports.
 Source: Pantheon Macroeconomics
——————–
2. This chart shows Germany’s energy consumption mix.
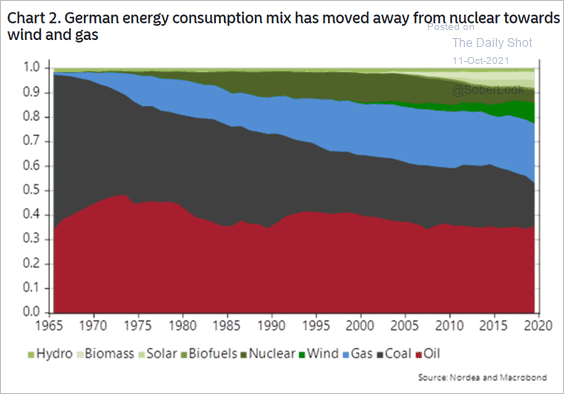 Source: Nordea Markets
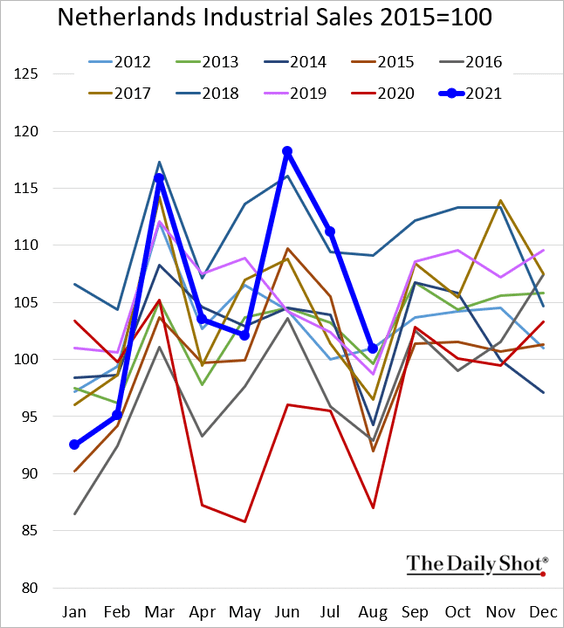
3. Dutch industrial activity is returning to more typical levels.
Back to Index
Europe
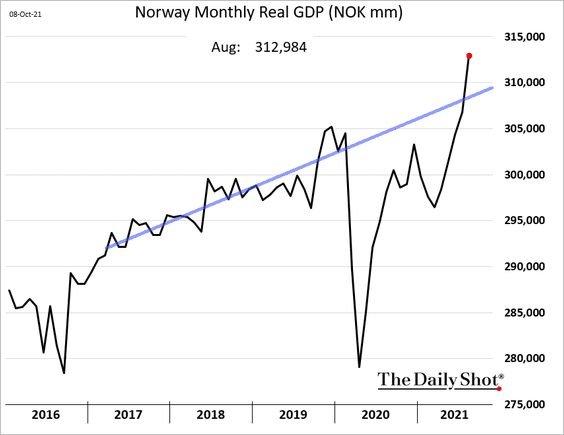
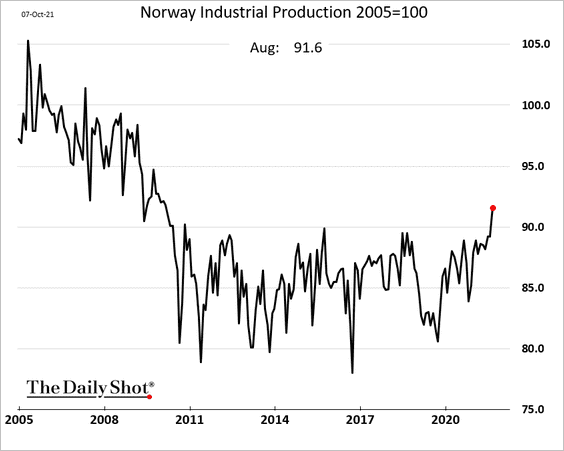
1. Norway’s economic activity is surging, boosted by the energy sector.
——————–
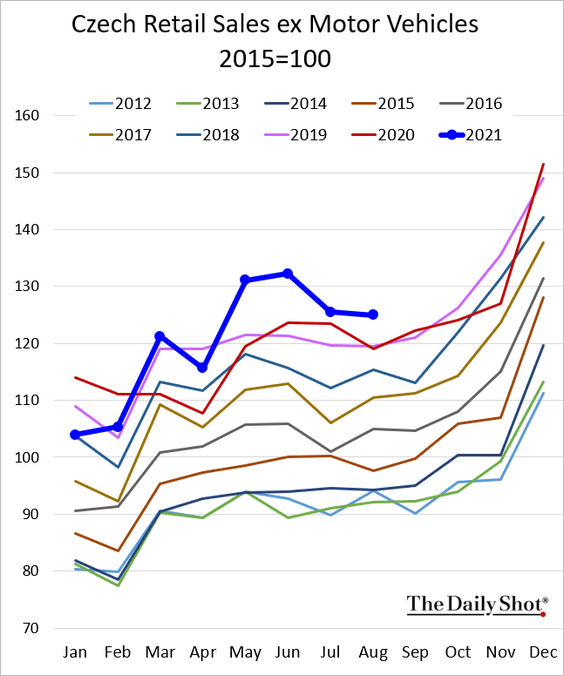
2. Czech retail sales remain robust.
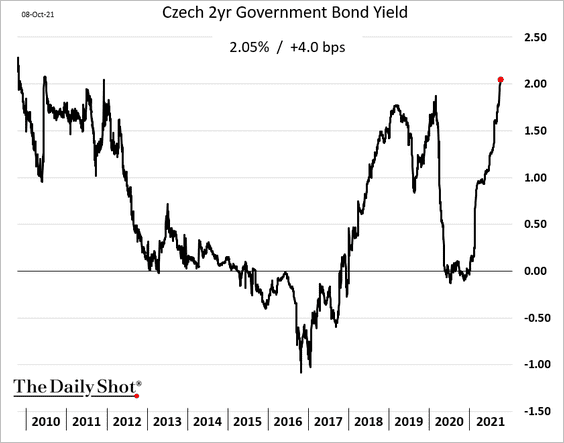
The 2yr bond yield hit the highest level in over a decade as the market prepares for rate hikes.
——————–
3. Next, we have some updates on Europe’s energy crunch (from Deutsche Bank).
• Natural gas inventories:
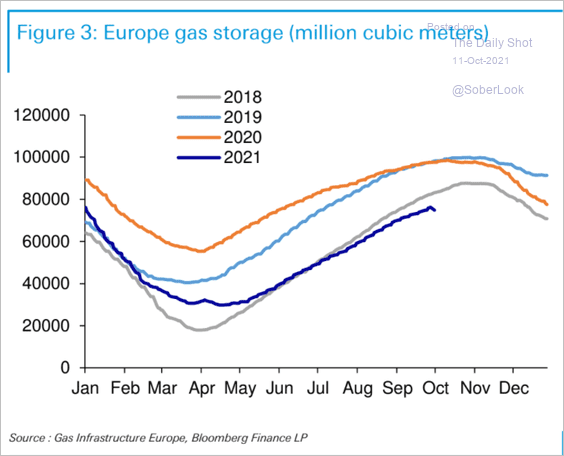 Source: Deutsche Bank Research
• Wind generation:
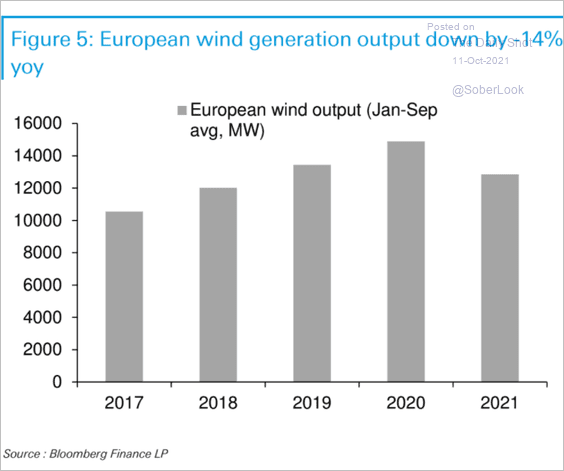 Source: Deutsche Bank Research
• Energy-intensive sectors:
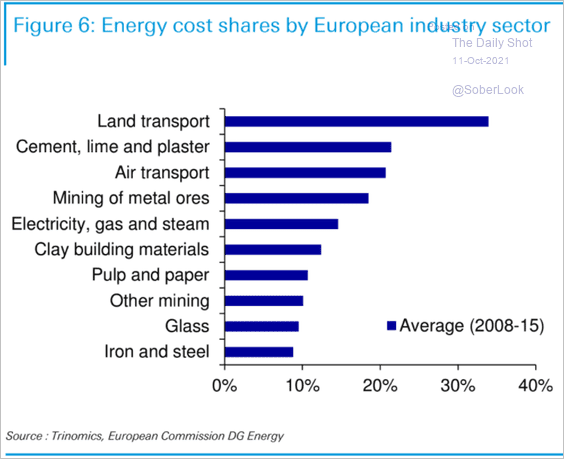 Source: Deutsche Bank Research
Back to Index
Japan
1. The recent decline in export volume to China could weigh on Japanese equities (2 charts).
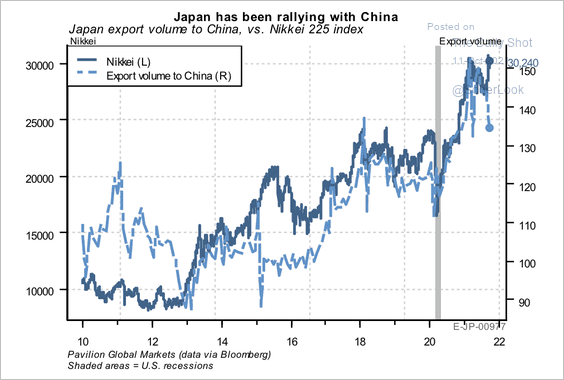 Source: Pavilion Global Markets
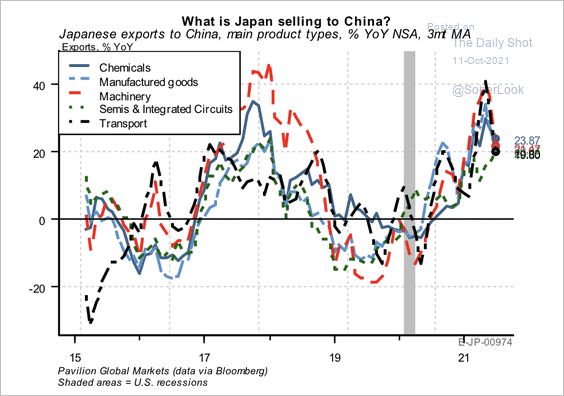 Source: Pavilion Global Markets
——————–
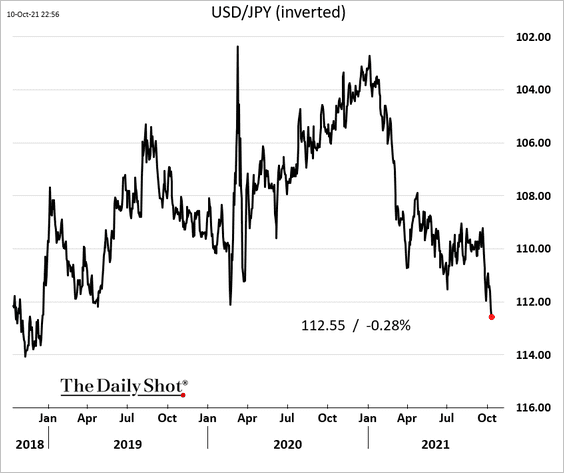
2. The yen has been under pressure as US yields and inflation expectations climb.
3. Mobility in Japan is starting to pick up again after emergency restrictions are lifted.
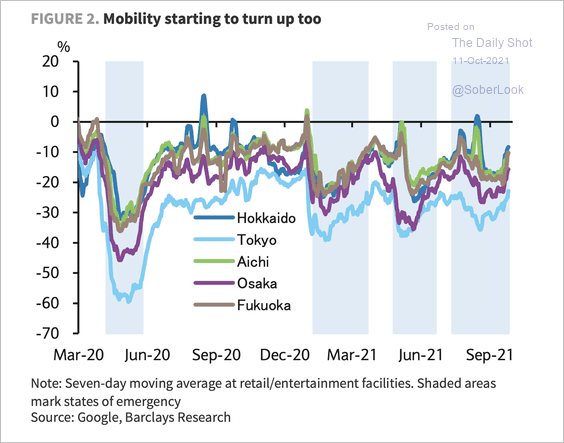 Source: Barclays Research
4. This chart shows Japan’s working-age population vs. the number of employees.
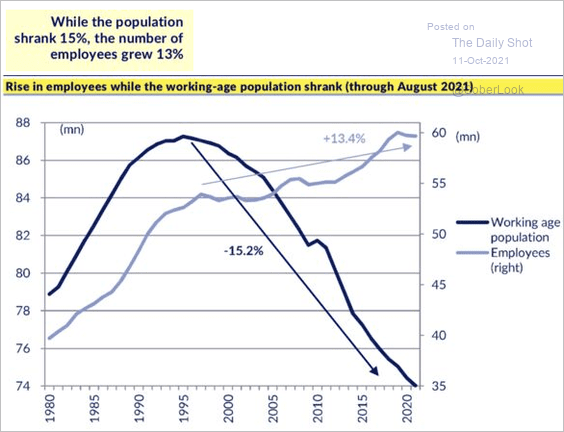 Source: Nicholas Smith
Back to Index
China
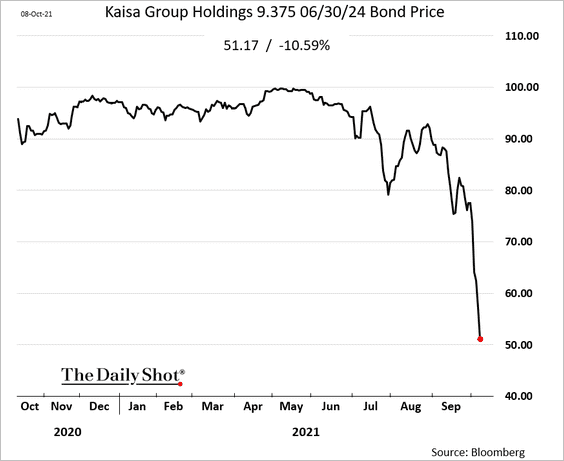
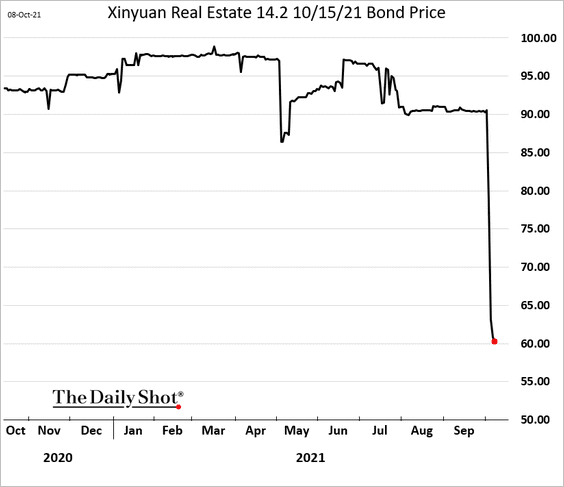
1. Let’s begin with the real estate sector credit crunch.
 Source: @WSJ Read full article
• Investors continue to dump developers’ bonds. Below is Kaisa.
• We have a distressed debt exchange.
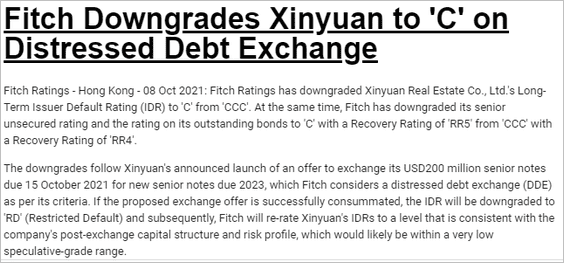 Source: Fitch Ratings
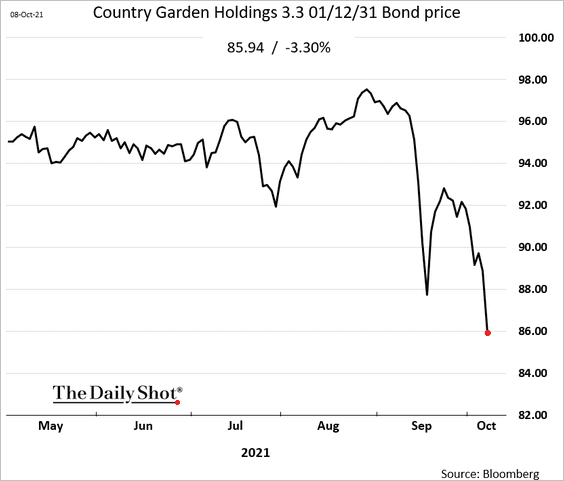
• Even some of the less vulnerable names are under pressure.
• Some of the companies may be more leveraged than the reported figures suggest.
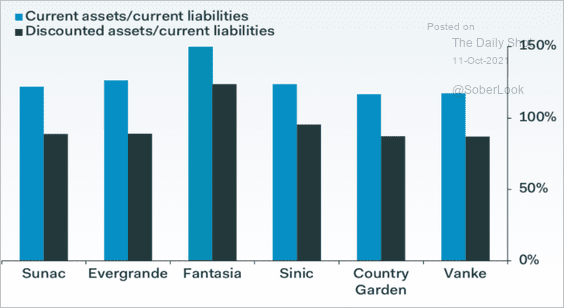 Source: Pantheon Macroeconomics
• The USD-denominated HY index yield/spread is surging, …
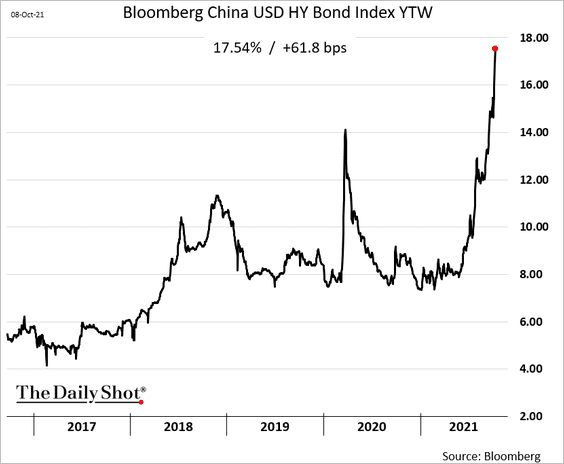
… and could boost equity volatility.
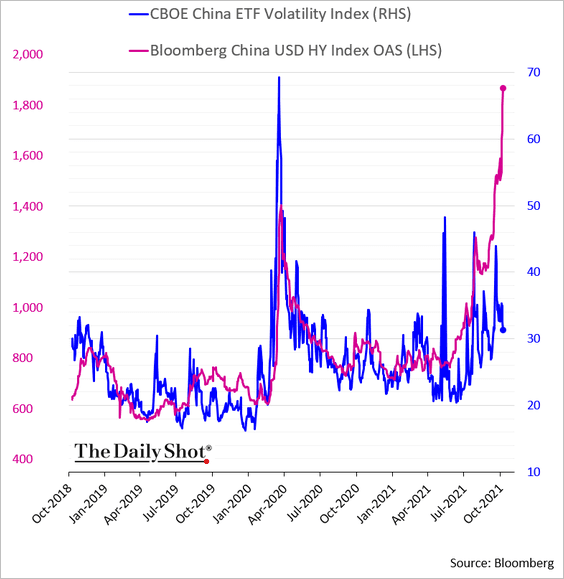 h/t @SofiaHCBBG
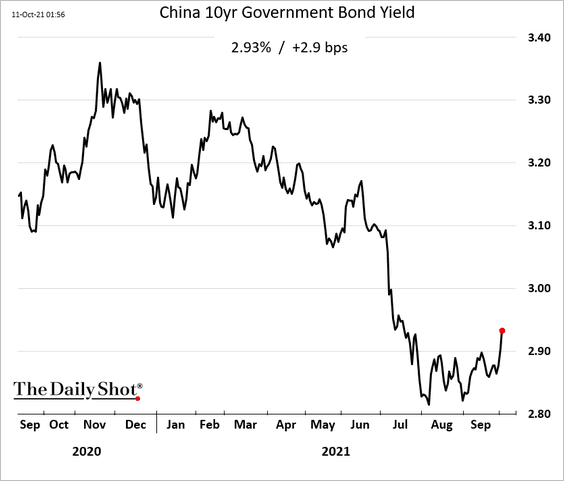
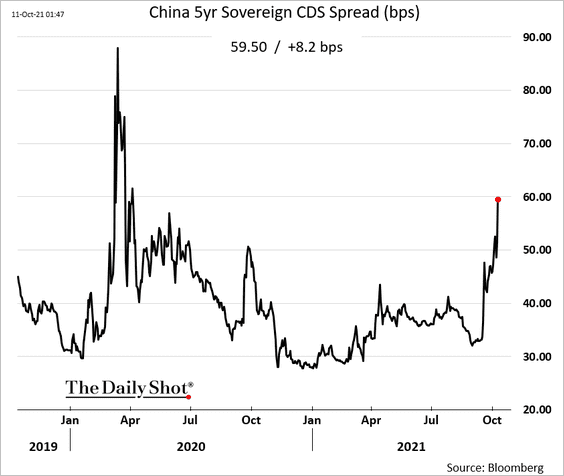
• There is some spillover into sovereign risk (the market is concerned that the government may need to borrow quite a bit to bail out the sector).
– The 10yr yield:
– The sovereign CDS spread:
——————–
2. Are tech-sector stocks an opportunity?
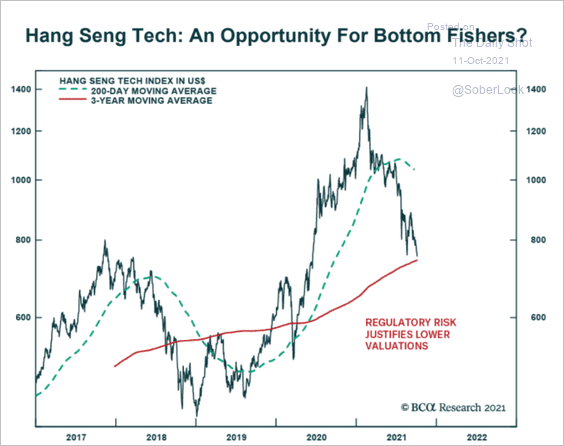 Source: BCA Research
3. More of China’s output is impacted by energy shortages.
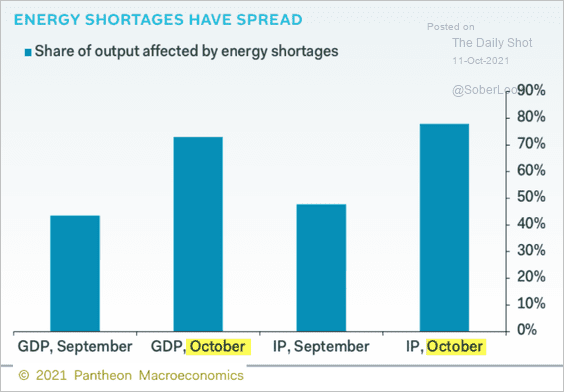 Source: Pantheon Macroeconomics
Electricity demand has been surging, …
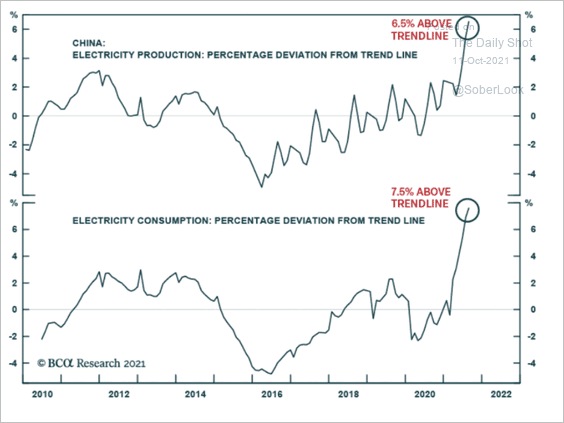 Source: BCA Research
… driven by power-intensive exports.
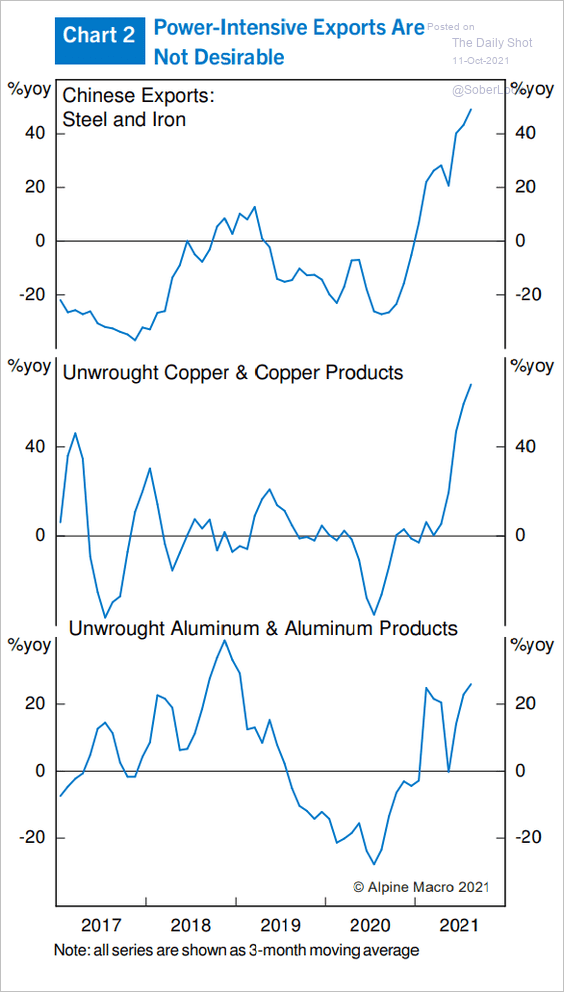 Source: Alpine Macro
——————–
4. E-commerce penetration in China appears to be flatlining.
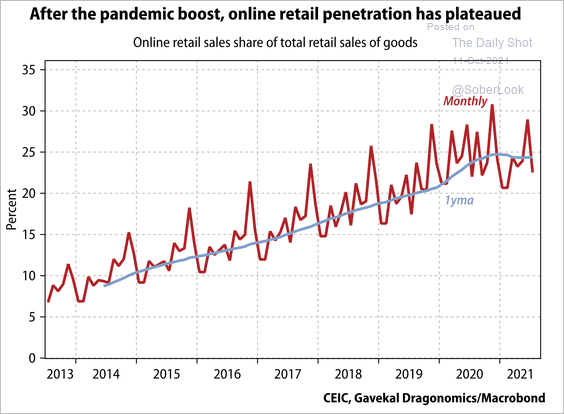 Source: Gavekal Research
Back to Index
Emerging Markets
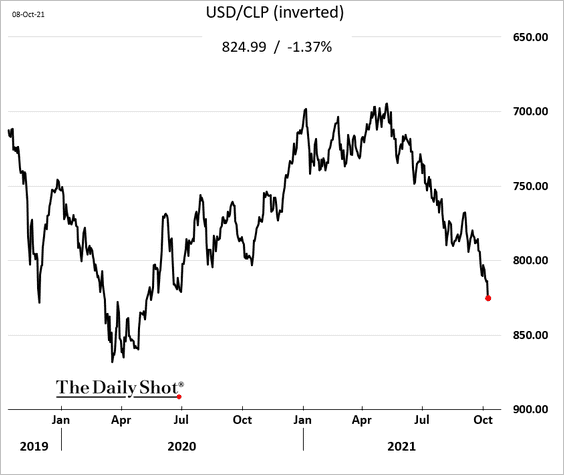
1. Chile’s inflation is surging.
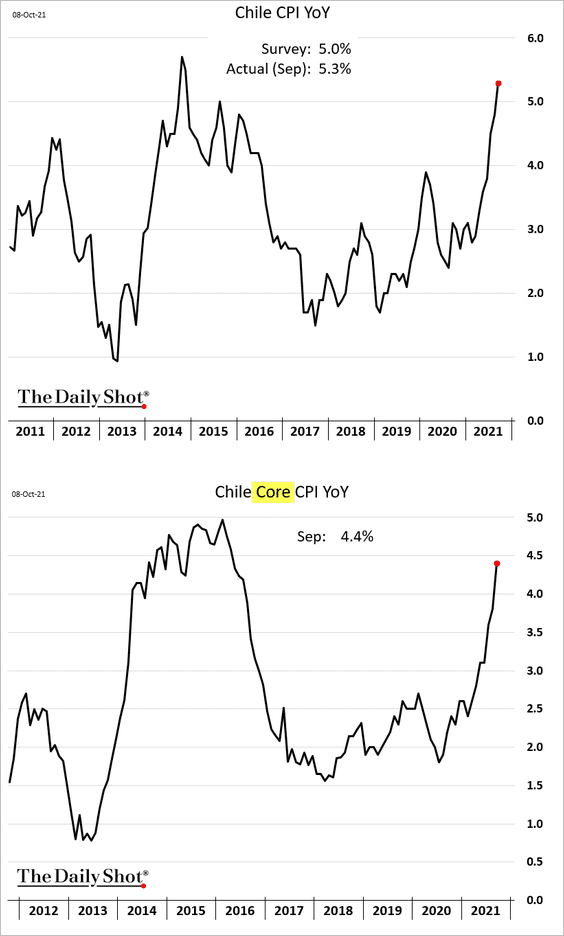
The peso has been under pressure.
——————–
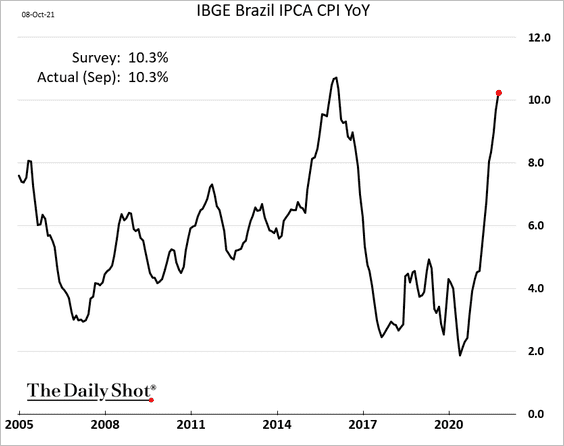
2. Brazil’s inflation is back in double-digits.
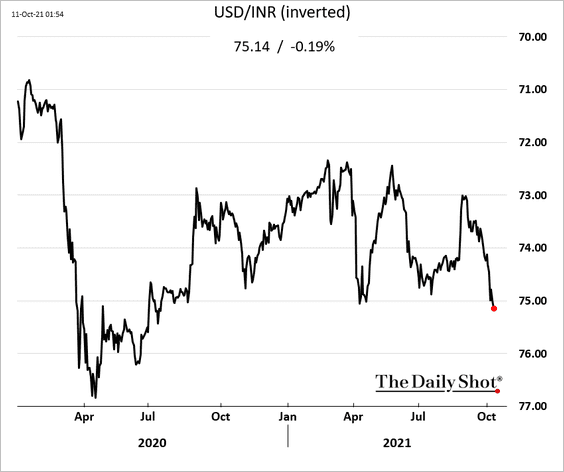
3. India’s equity market cap is about to overtake the UK.
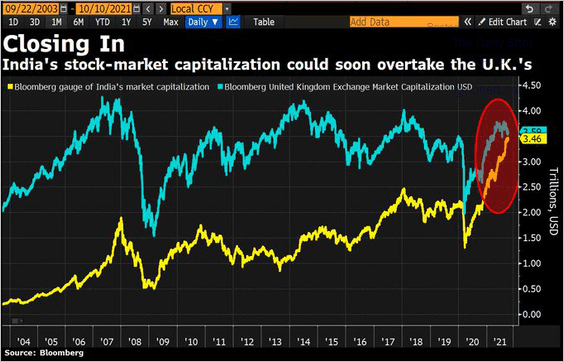 Source: @DavidInglesTV
The rupee continues to weaken, driven by surging oil prices.
——————–
4. EM fixed-income markets have been experiencing outflows.
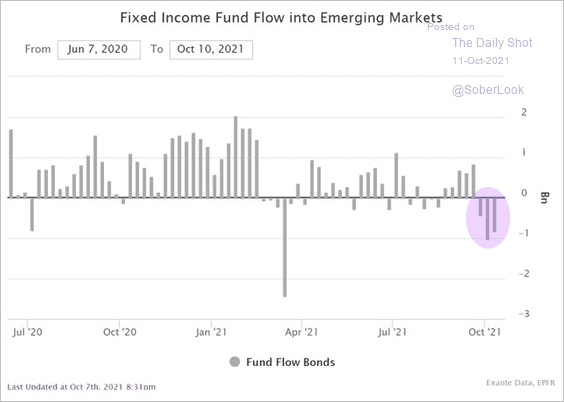 Source: @jnordvig, @EPFR, @ExanteData
5. Here is a look at EM equity valuations relative to their 10-year average.
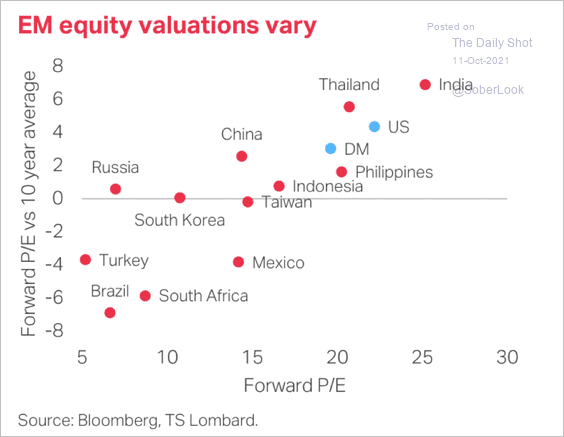 Source: TS Lombard
Back to Index
Cryptocurrency
1. Bitcoin’s spot volume increased over the past few days, reflecting a resurgence of buying activity.
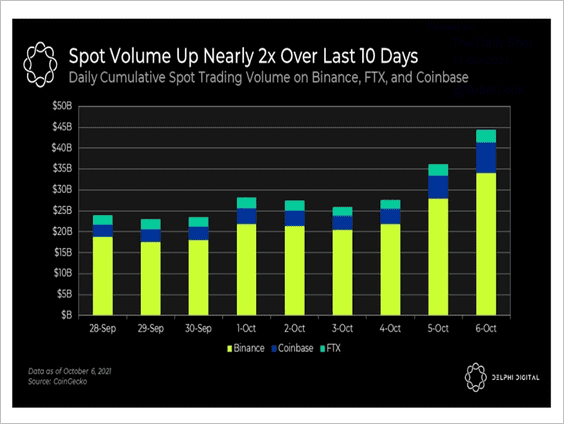 Source: Delphi Digital Read full article
2. The basis premium for futures on the OKEx exchange vs. CME flipped to a discount as anticipation builds for a bitcoin ETF.
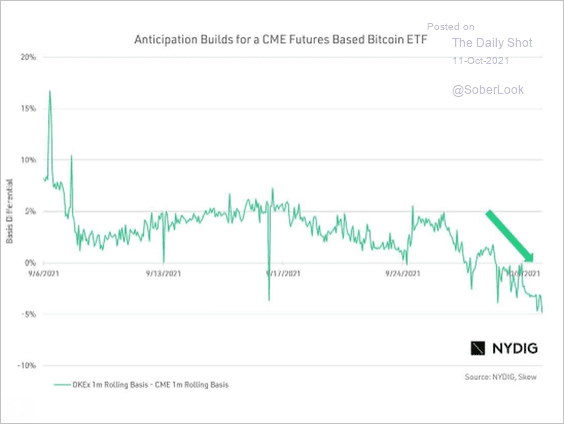 Source: NYDIG Read full article
3. Buying activity tends to rise ahead of major crypto events. Will a bitcoin ETF approval become a classic buy the rumor, sell the fact?
 Source: Pantera Capital
4. Bitcoin’s trading volume in the perpetual futures market, a type of derivative in crypto markets, also surged last week.
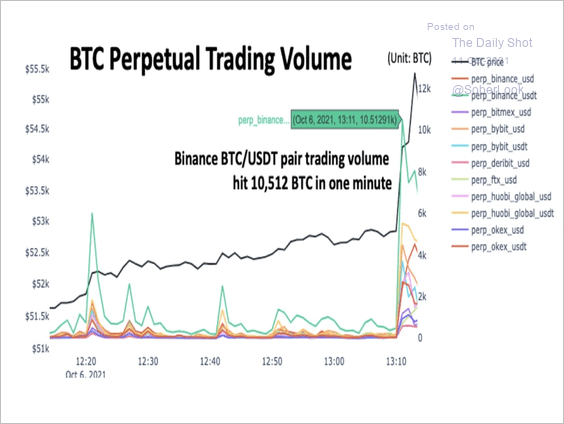 Source: CryptoQuant Read full article
5. Andreessen Horowitz (a16z) participated in some large crypto startup deals this year.
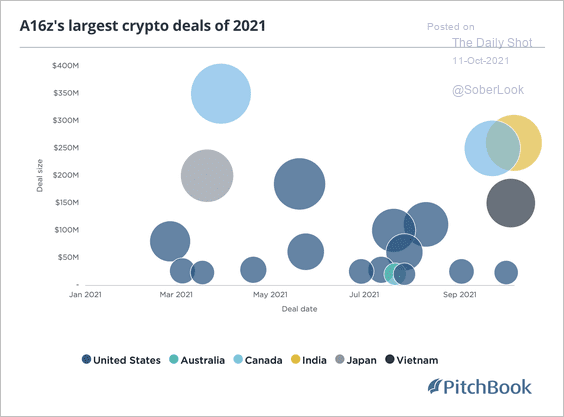 Source: PitchBook Read full article
Back to Index
Commodities
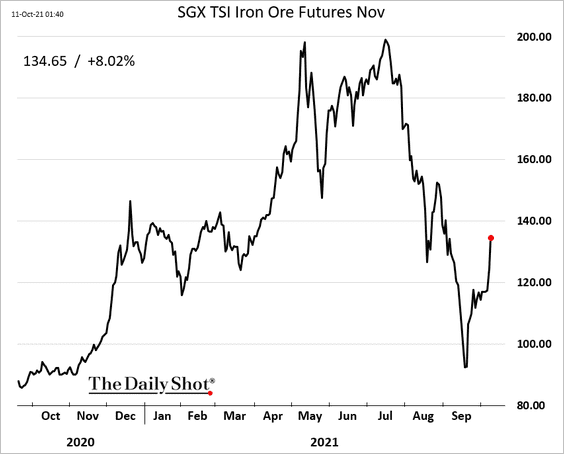
1. Iron ore is rebounding.
2. Fertilizer prices hit a new high.
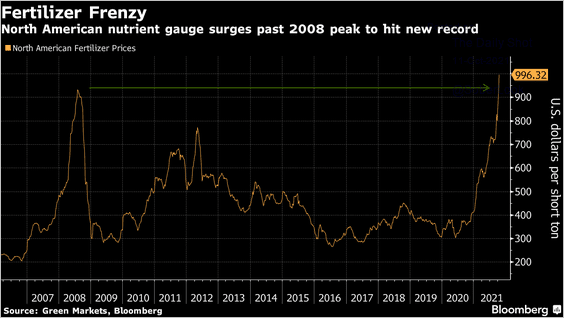 Source: @C_Barraud, @markets Read full article
Back to Index
Energy
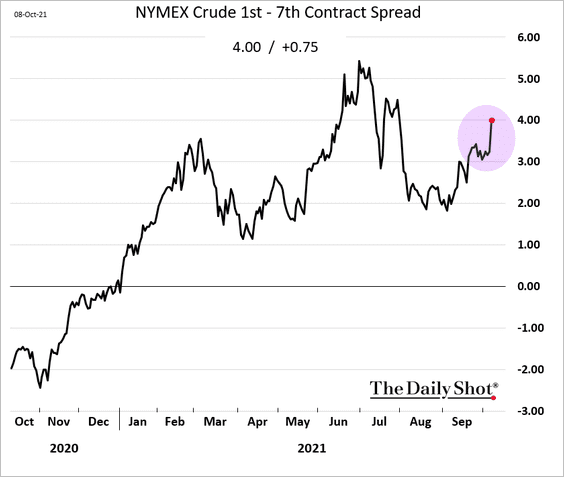
1. US crude oil is trading above $80/bbl for the first time since 2014.
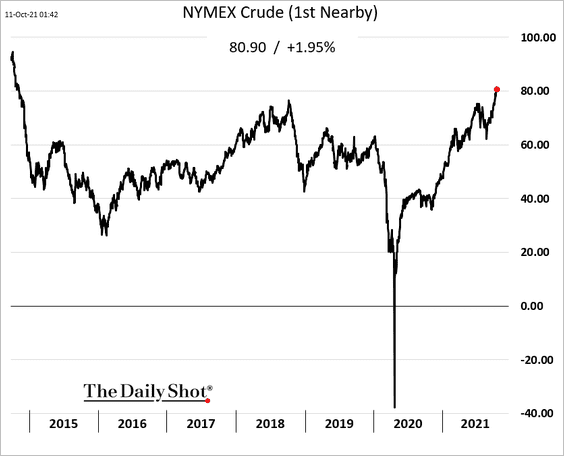
The curve is moving deeper into backwardation as the market anticipates tight supplies.
——————–
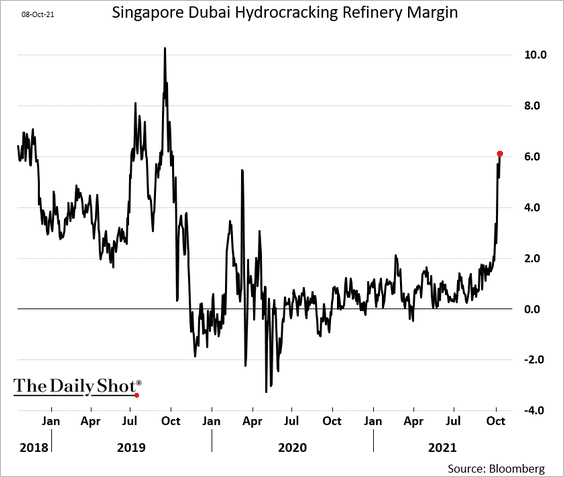
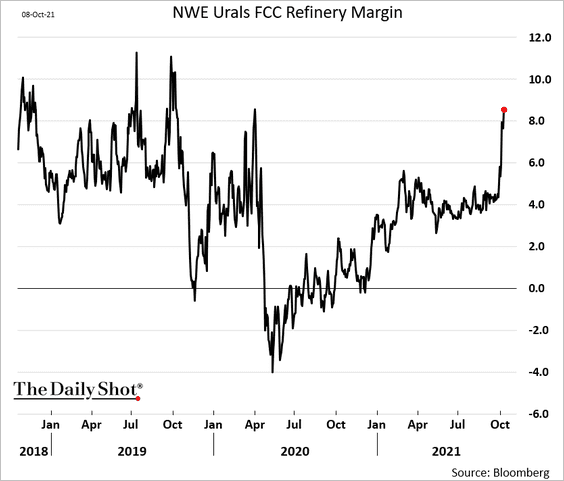
2. Global refinery margins continue to surge.
• Asia:
• Europe:
——————–
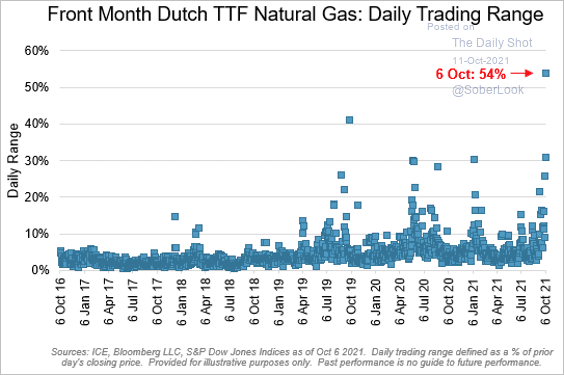
3. European natural gas volatility has exploded.
 Source: S&P Global Market Intelligence
4. This chart shows India’s and China’s combined coal inventory.
 Source: Deutsche Bank Research
Back to Index
Equities
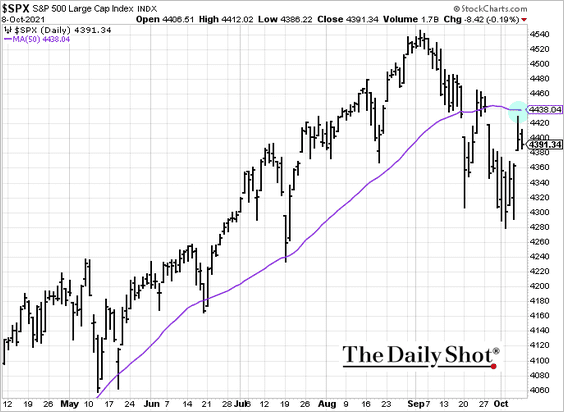
1. The 50-day moving average now acts as resistance for the S&P 500.
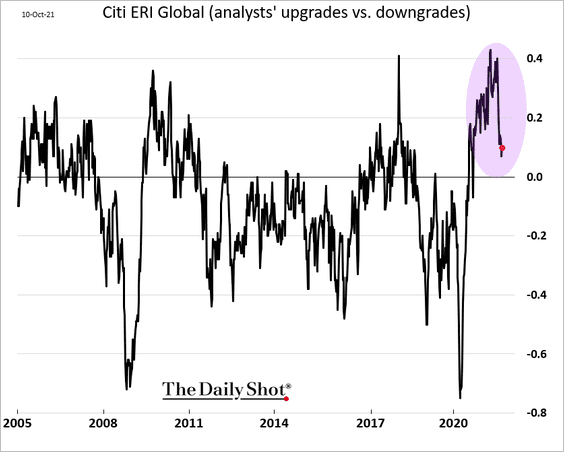
2. Fewer analysts are upgrading corporate earnings globally.
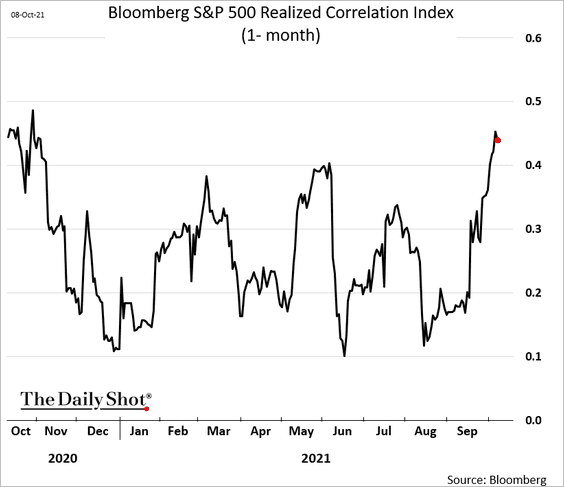
3. Correlations among stocks have increased recently.
Stocks remain inversely correlated with the US dollar.
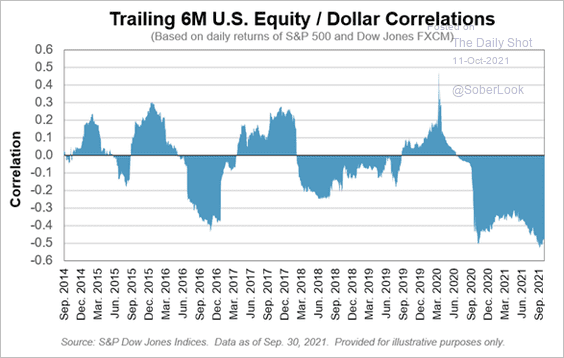 Source: S&P Global Market Intelligence
——————–
4. Investors are prepared to buy the dip.
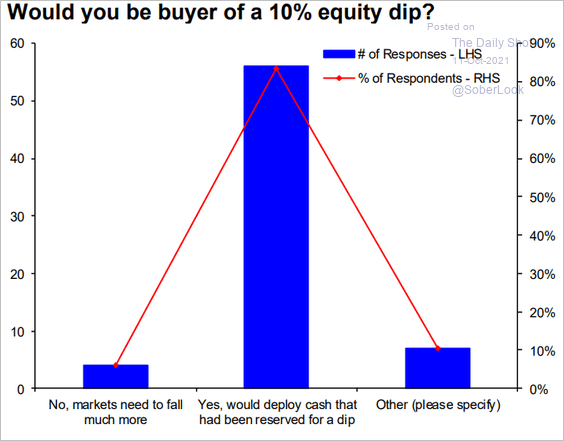 Source: Hugo Ste-Marie, Portfolio & Quantitative Strategy Global Equity Research, Scotia Capital
5. Inflation surprises are at a record high while economic surprises have turned negative. This is typically a bad mix for equities.
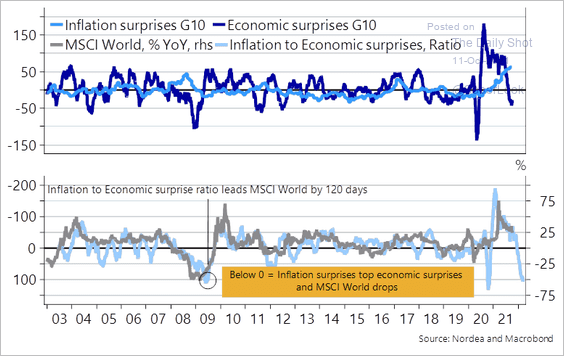 Source: Nordea Markets
6. Bank stocks look expensive.
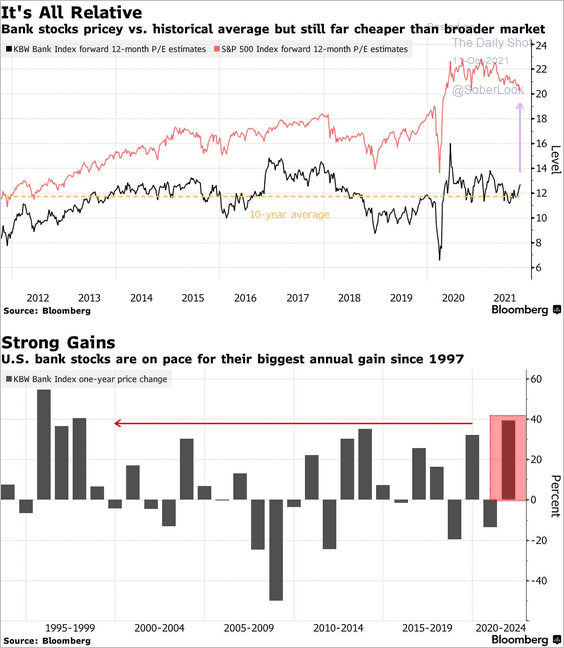 Source: @markets Read full article
7. Large-cap fund flows have massively outperformed small caps.
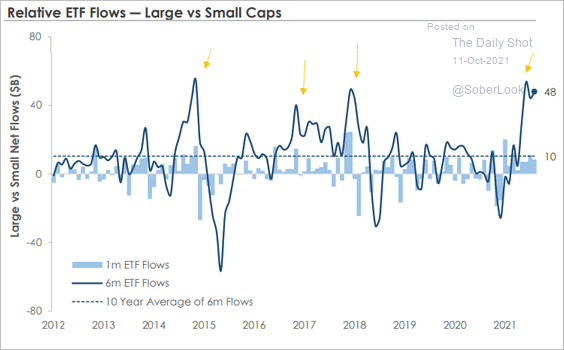 Source: MarketDesk Research
8. Based on forward P/E ratios, S&P 500 valuations continue to improve.
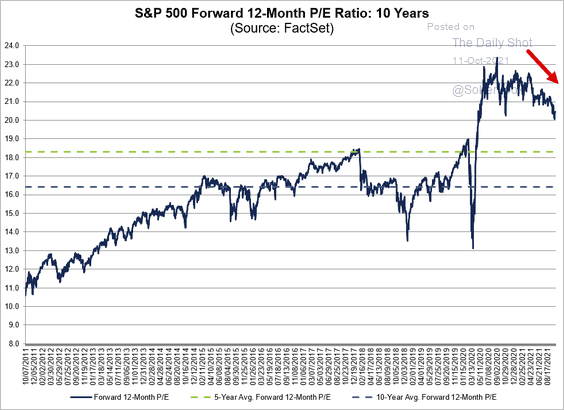 Source: @FactSet Read full article
This chart compares the S&P 500 forward P/E ratio to the 10yr real yield.
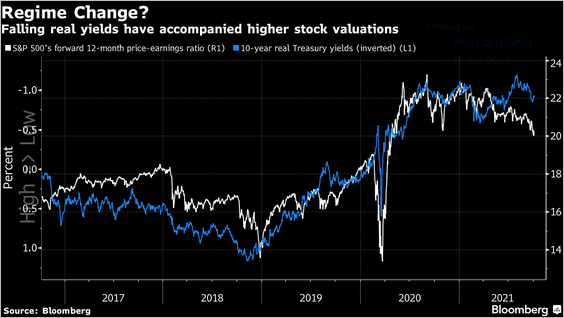 Source: @markets Read full article
Back to Index
Credit
1. High-yield implied vol is cheap relative to stocks.
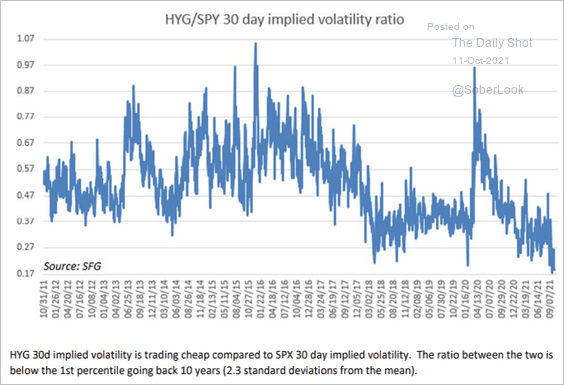 Source: Chris Murphy, Susquehanna International Group
2. More than half of US CLOs have been “updated.”
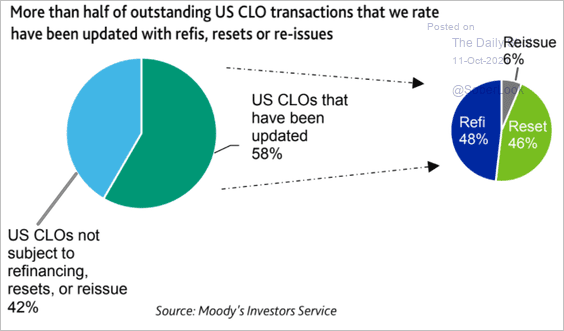 Source: Moody’s Investors Service
3. Cov-lite share of leveraged loan deals hit a new high this year.
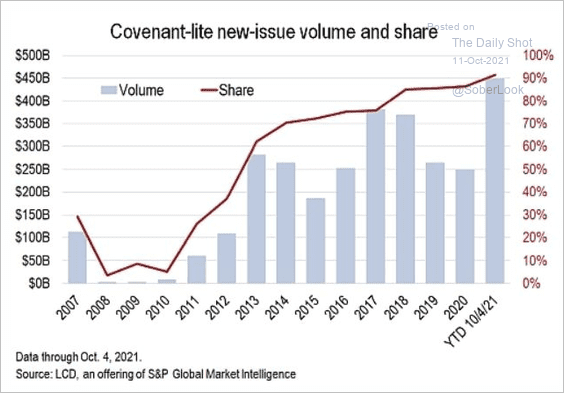 Source: @lcdnews, @Abbynyhk Read full article
4. Highly leveraged borrowers issued a great deal of leveraged loans in 2021.
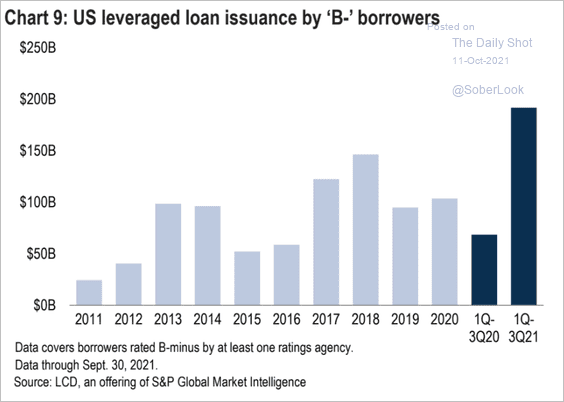 Source: S&P Global Market Intelligence
Back to Index
Rates
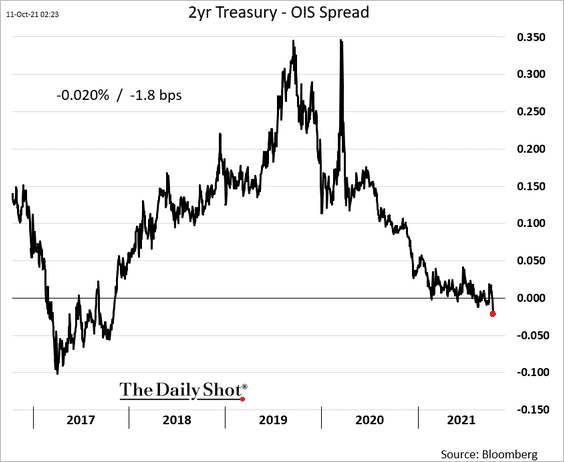
1. The lack of supply of Treasuries sent the 2yr spread to OIS to the lowest level since 2017.
2. Rising 10yr yields could trigger more hedging of mortgage debt (as prepayments decline).
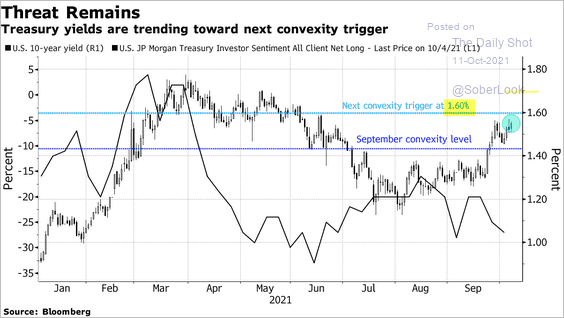 Source: Bloomberg Read full article
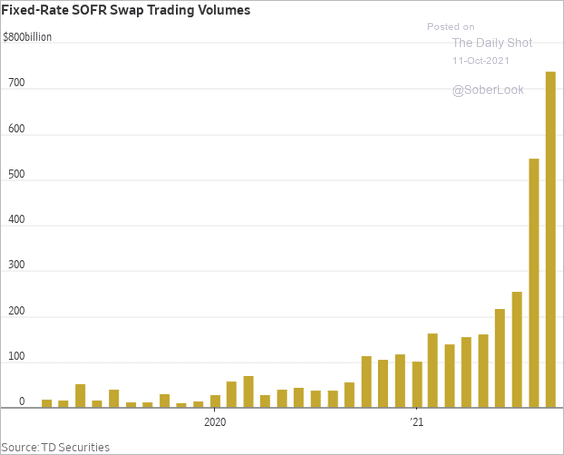
3. SOFR swap trading volumes continue to climb.
 Source: @WSJ Read full article
Back to Index
Global Developments
1. Let’s start with global rate hike/cut expectations (from Bloomberg).
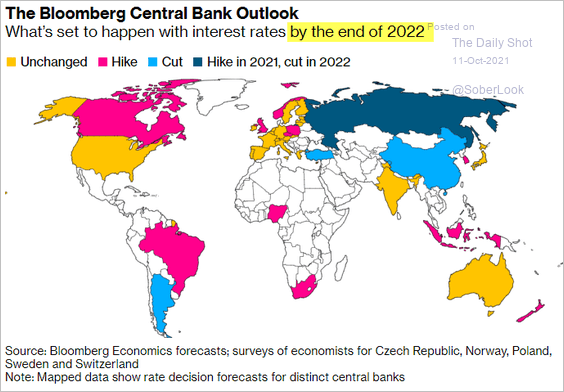 Source: Bloomberg Read full article
2. Next, let’s take a look at bond yields.
• Nominal:
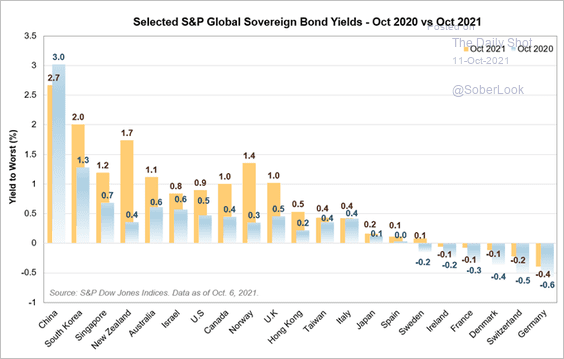 Source: S&P Global Market Intelligence
• Real:
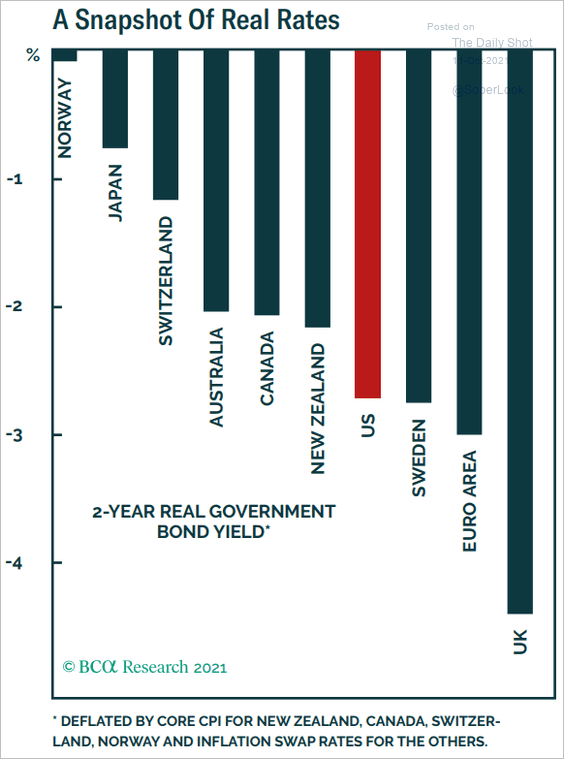 Source: BCA Research
——————–
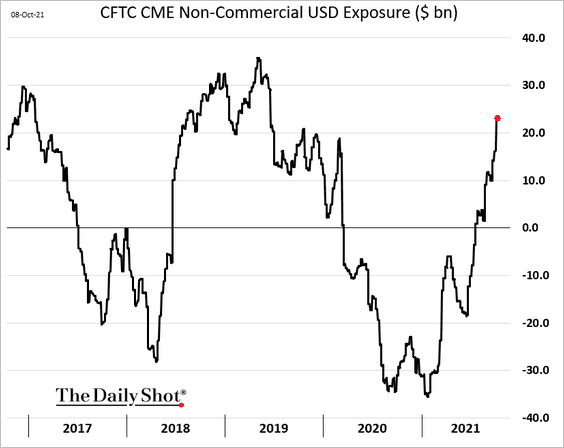
3. Speculative accounts continue to boost their bets on the US dollar.
4. The Citi Global Inflation Surprise Index hit a new high.
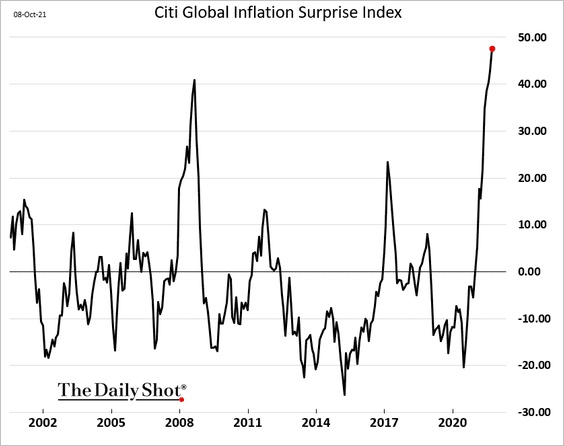 Source: Citi
——————–
Food for Thought
1. US household income growth by quartile:
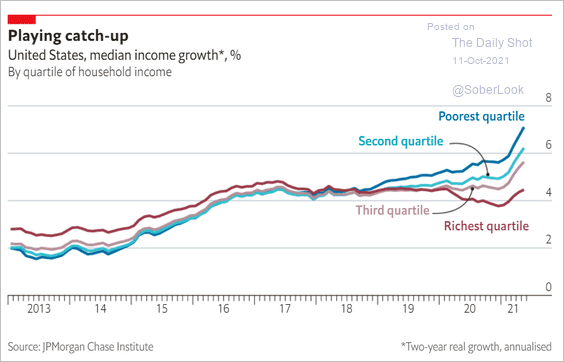 Source: The Economist Read full article
2. Year-over-year rent price changes by state:
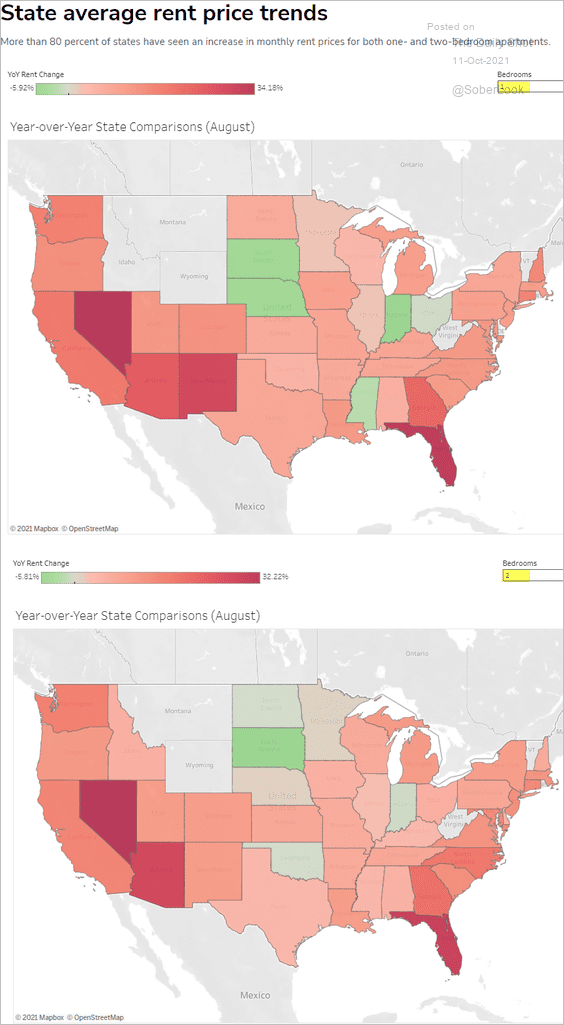 Source: Apartment Guide Read full article
3. US net national savings rate:
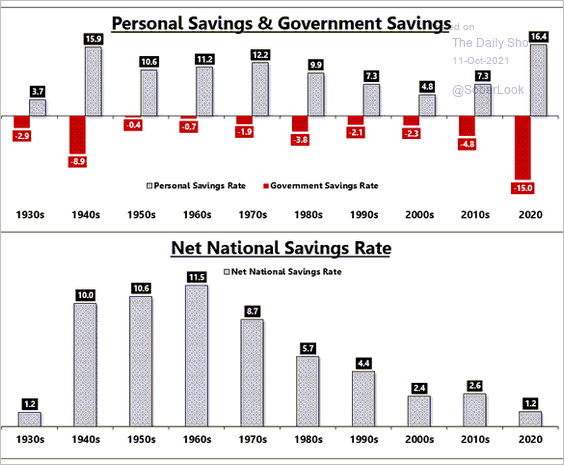 Source: @EPBResearch
4. US Latino population growth:
 Source: @mhugolopez, @pewhispanic, @pewresearch Read full article
5. Will the 15% minimum corporate tax rate be implemented globally?
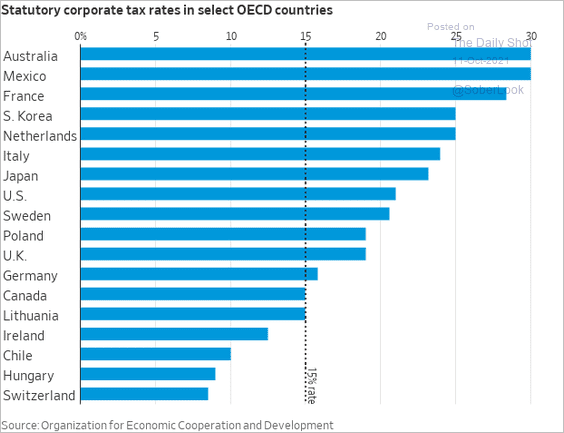 Source: @WSJ Read full article
6. Working remotely:
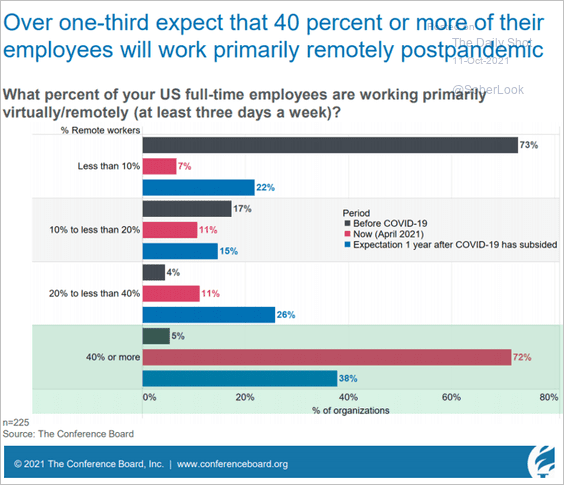 Source: @GregDaco, @Conferenceboard
Views on working from home, relative to expectations:
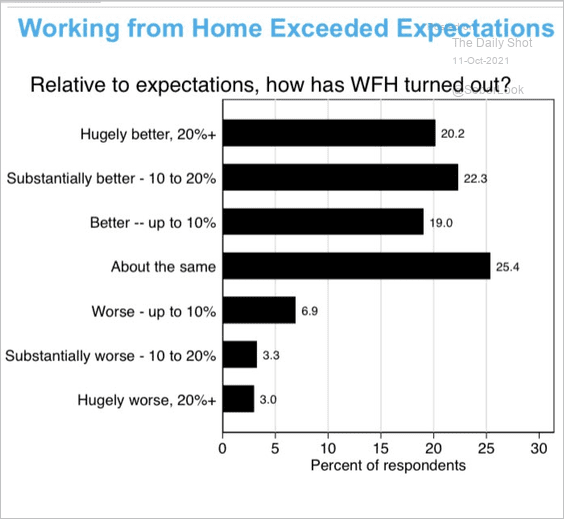 Source: @GregDaco, @ChicagoBooth
——————–
7. The winning score in NBA games:
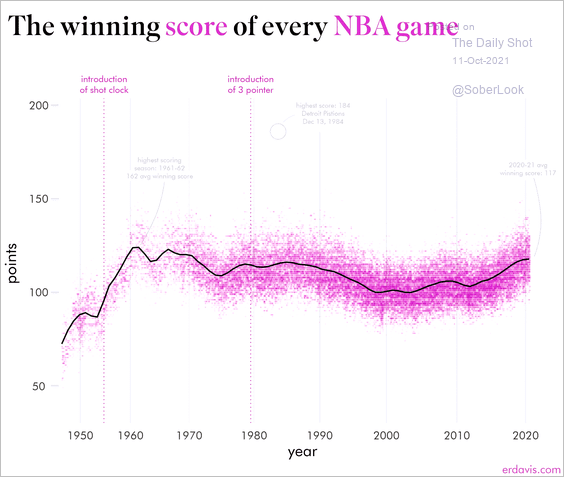 Source: @erindataviz
——————–
Back to Index