The Daily Shot: 14-Oct-21
• The United States
• Canada
• The United Kingdom
• The Eurozone
• Asia – Pacific
• China
• Emerging Markets
• Cryptocurrency
• Commodities
• Energy
• Equities
• Rates
• Global Developments
• Food for Thought
The United States
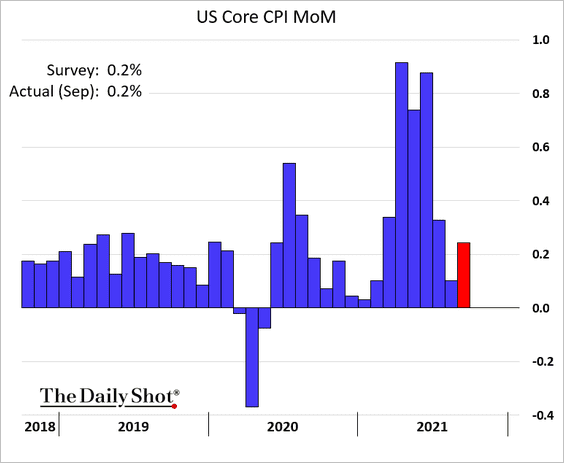
1. The September core CPI increased in line with expectations.
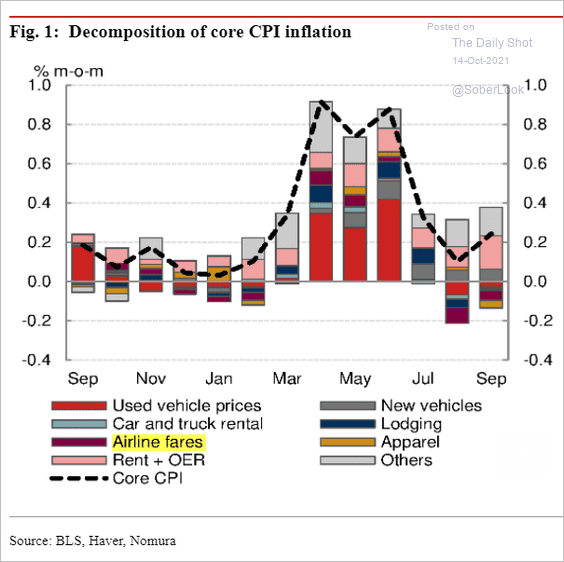
• Airline fares were a drag on inflation once again.
 Source: Nomura Securities
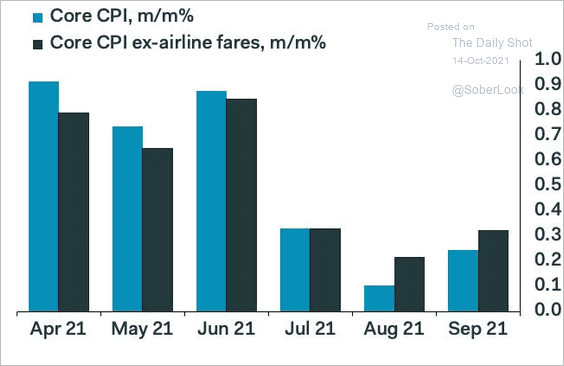
Excluding airfares, core inflation was stronger.
 Source: Pantheon Macroeconomics
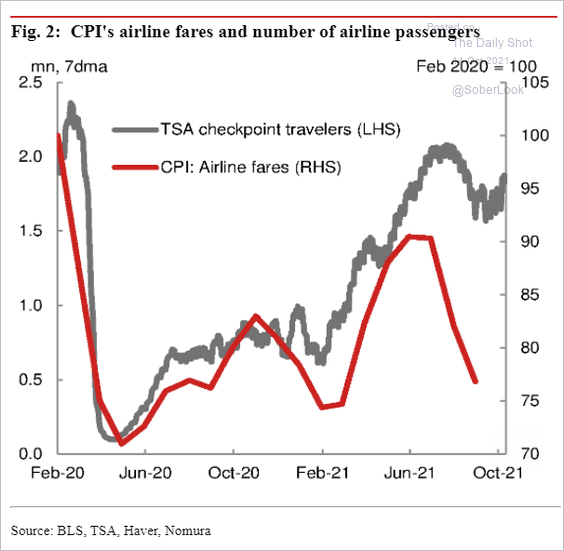
Moreover, airline ticket prices will begin climbing again …
 Source: Nomura Securities
… as the pandemic subsides.
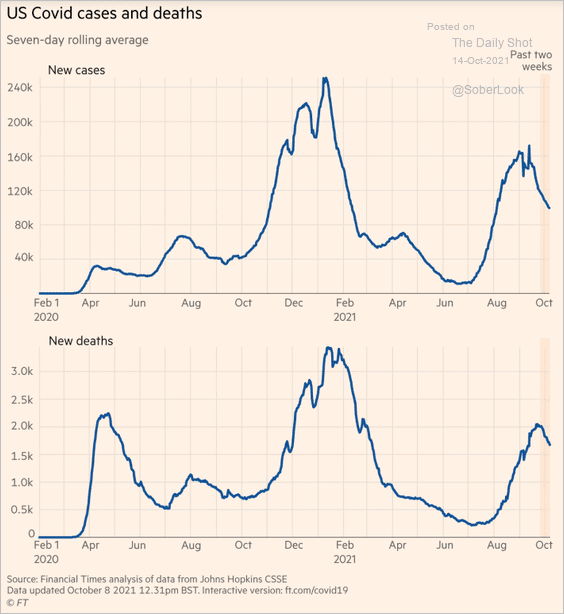 Source: @financialtimes Read full article
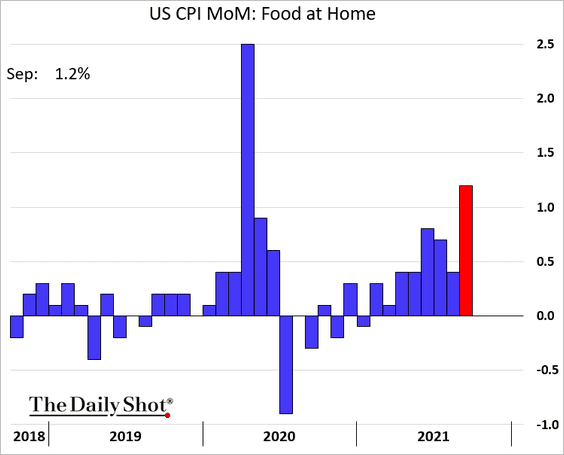
• “Food at home” CPI jumped, which will put pressure on consumer sentiment.
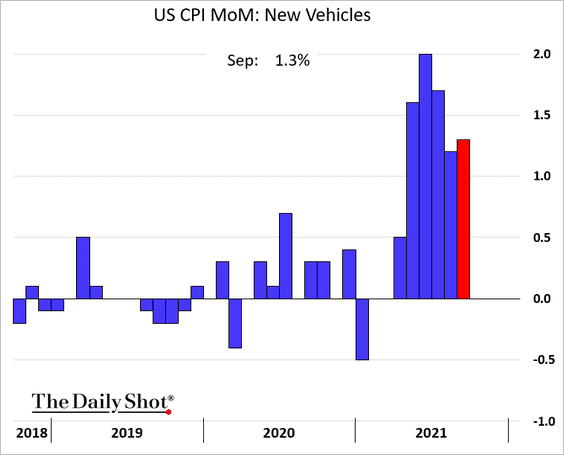
• New vehicle prices continue to surge.
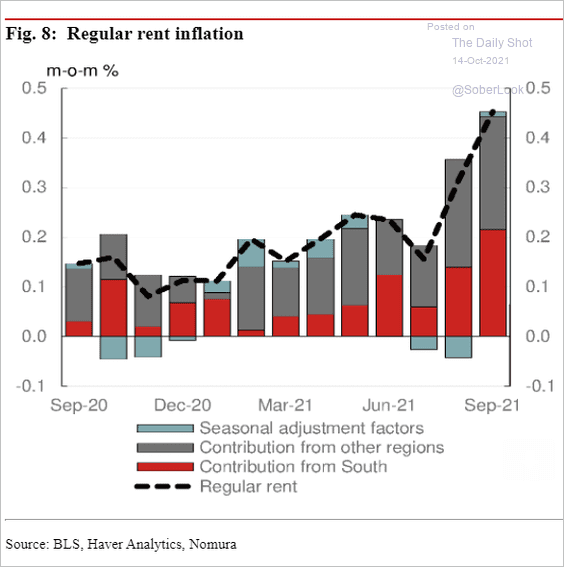
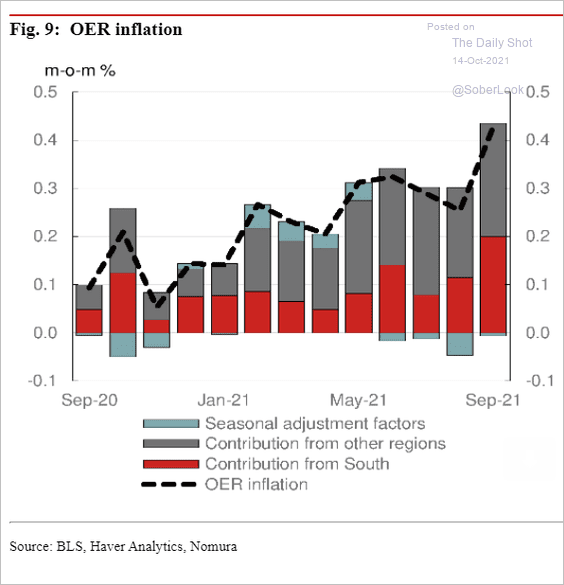
• Rent and owners’ equivalent rent (OER) CPI rose sharply.
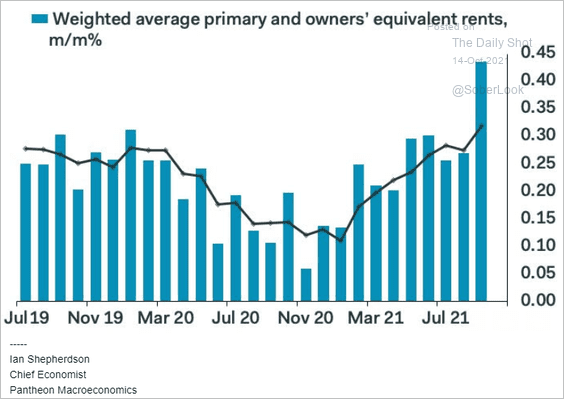 Source: Pantheon Macroeconomics
Here are the regional drivers of both inflation indicators.
 Source: Nomura Securities
 Source: Nomura Securities
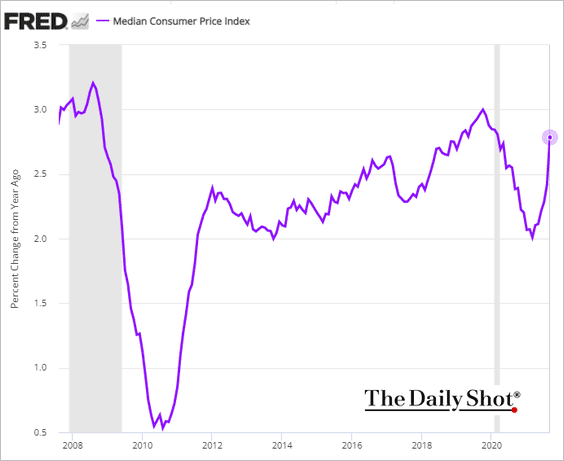
• The median CPI is still below pre-COVID levels on a year-over-year basis, but it continues to climb.
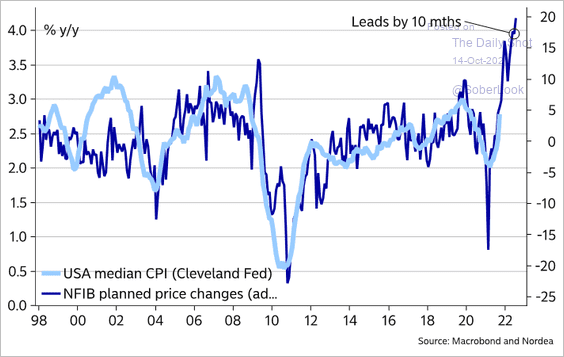
We should see further gains in the median CPI based on the NFIB small business price plans (chart from yesterday).
 Source: @MikaelSarwe
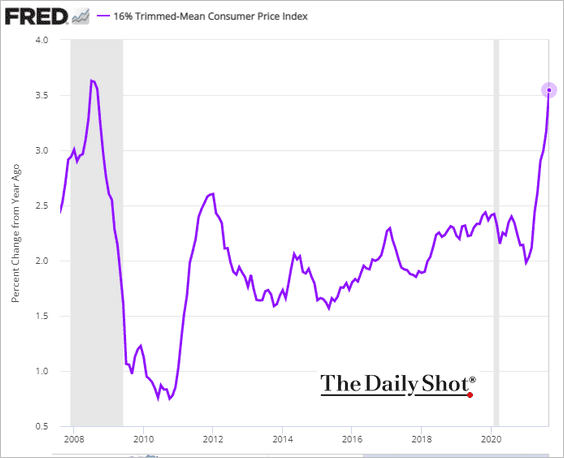
• The trimmed-mean CPI is approaching its 2008 high on a year-over-year basis.
• Here is the evolution of the CPI price index (which is what the Fed now officially targets).
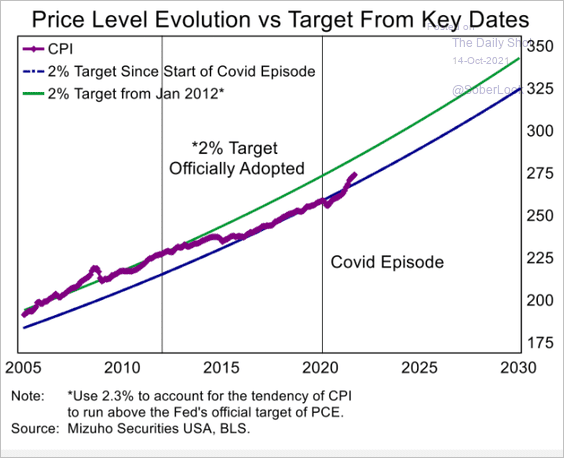 Source: Mizuho Securities USA
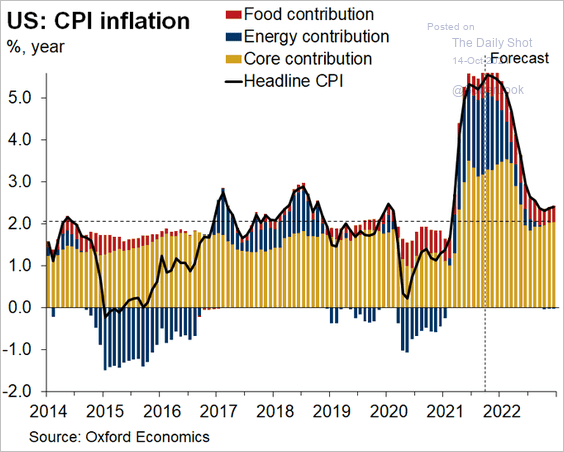
• Finally, we have a forecast for the CPI (year-over-year) from Oxford Economics.
 Source: @GregDaco
——————–
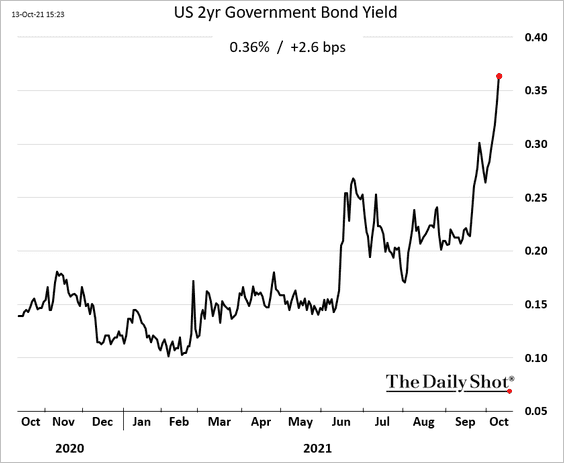
2. The Treasury curve flattened further, …
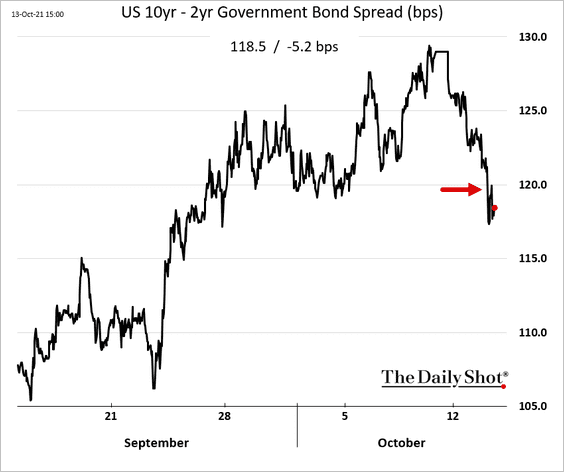
… as the 2-year yield keeps climbing.
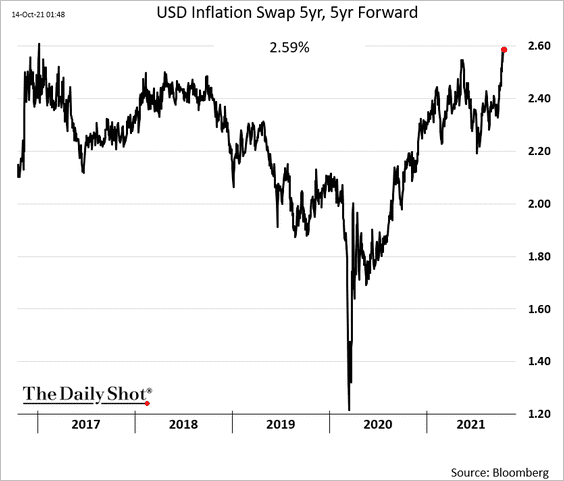
• Long-term market-based inflation expectations continue to rise.
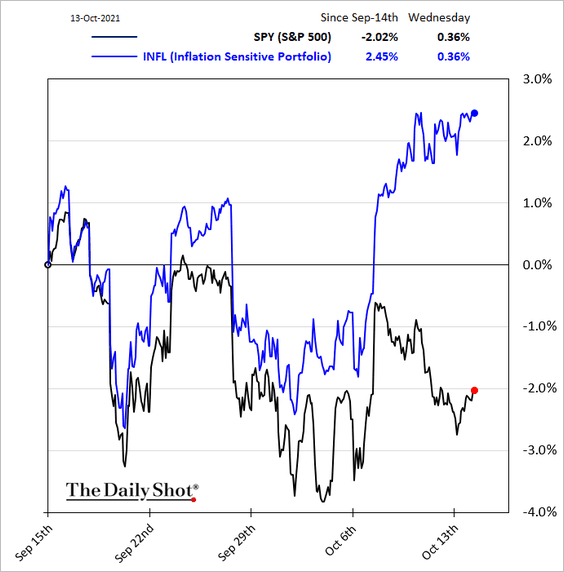
• Stocks that benefit from higher inflation outperformed sharply in recent days.
——————–
3. The Fed minutes confirmed the central bank’s intentions to begin tapering this year and be done by mid-2022.
 Source: @WSJ Read full article
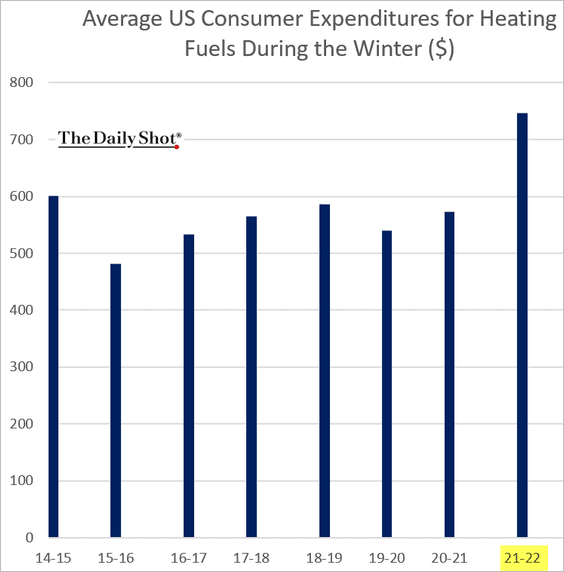
4. The Department of Energy estimates that heating costs for households will be 30% higher this winter.
 Source: EIA
 Source: Reuters Read full article
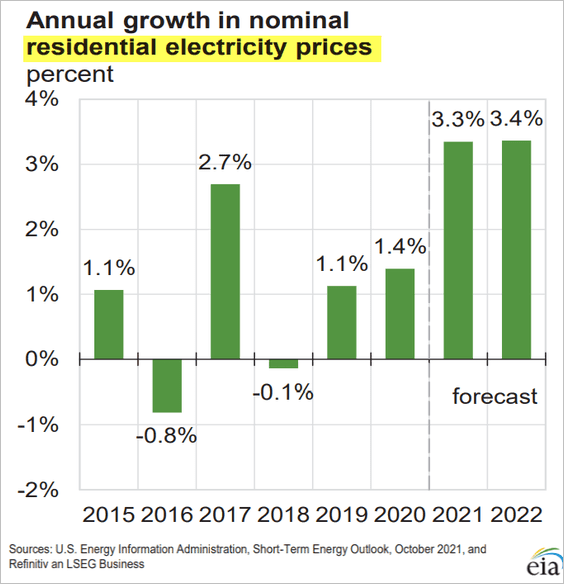
Electricity costs will increase at a faster rate.
——————–
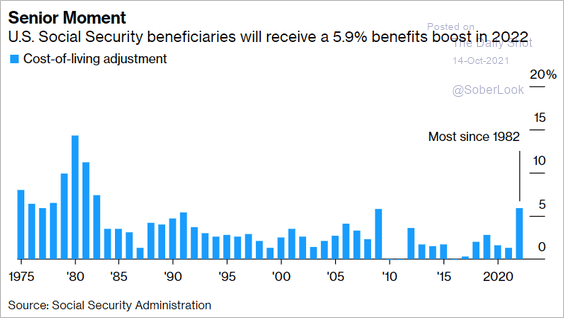
5. Social Security beneficiaries will get a 5.9% inflation adjustment boost next year.
 Source: Bloomberg Read full article
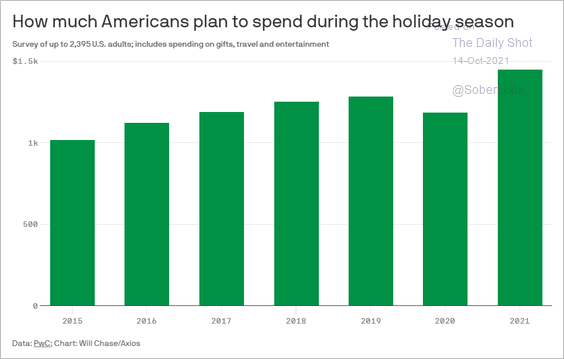
6. Americans will spend more during the holiday season this year, …
 Source: @axios Read full article
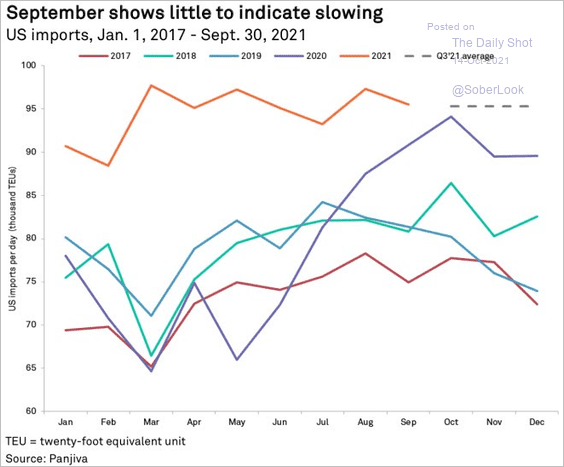
… which has been a tailwind for imports (companies are trying to build inventories).
 Source: S&P Global Market Intelligence
——————–
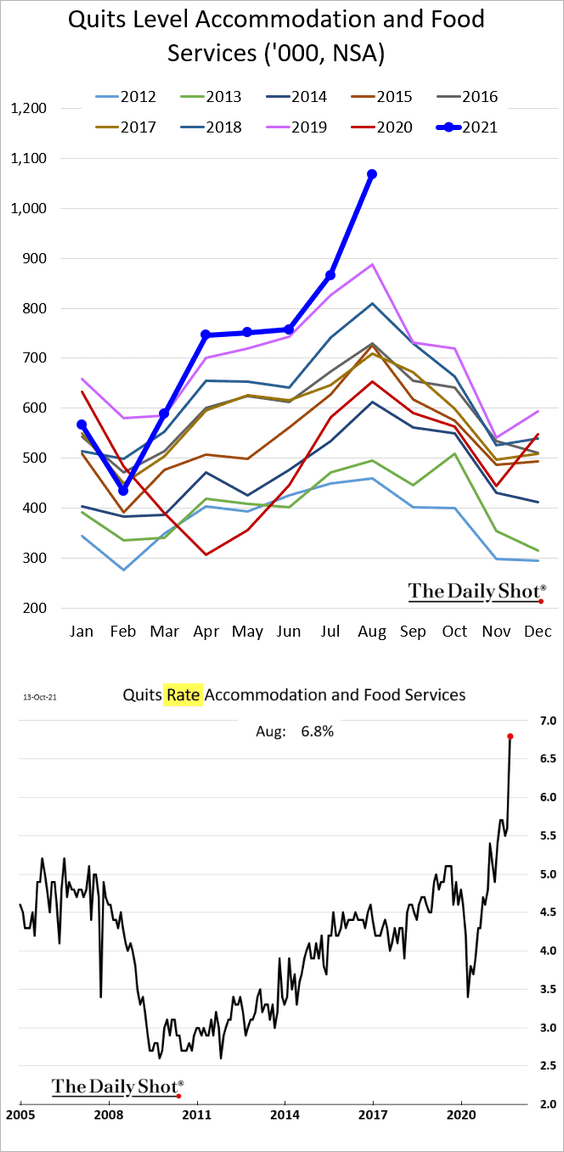
7. The quit rate has been especially high at hotels and restaurants.
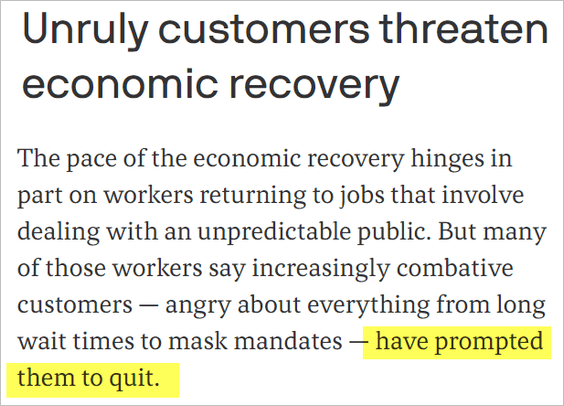
Here is one of the reasons for the above trend.
 Source: @axios Read full article
Back to Index
Canada
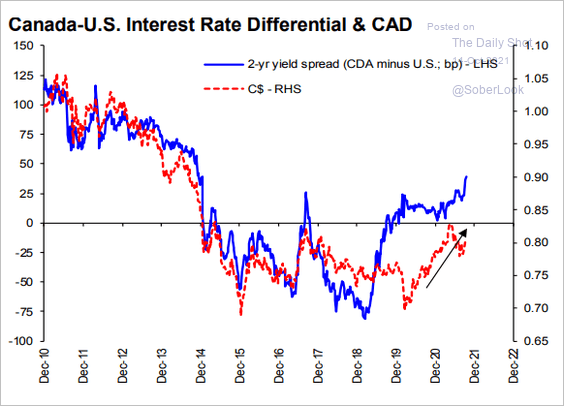
1. The rate differential with the US points to a stronger loonie.
 Source: Hugo Ste-Marie, Portfolio & Quantitative Strategy Global Equity Research, Scotia Capital
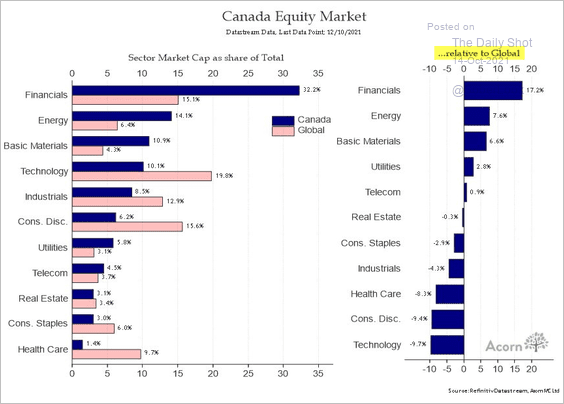
2. This chart shows how Canada’s stock market sector breakdown differs from the global index.
 Source: @RichardDias_CFA
Back to Index
The United Kingdom
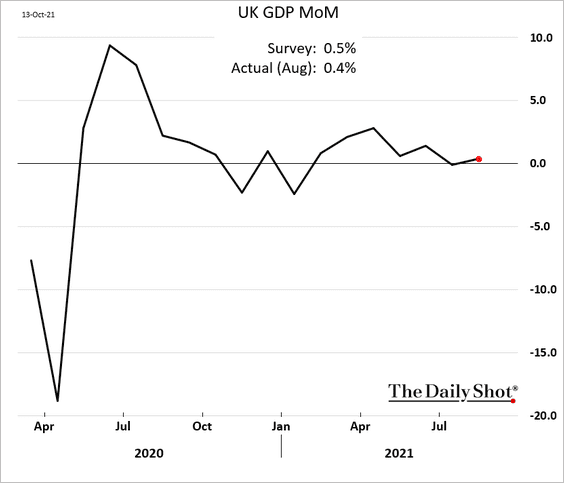
1. The August monthly GDP estimate was softer than expected.
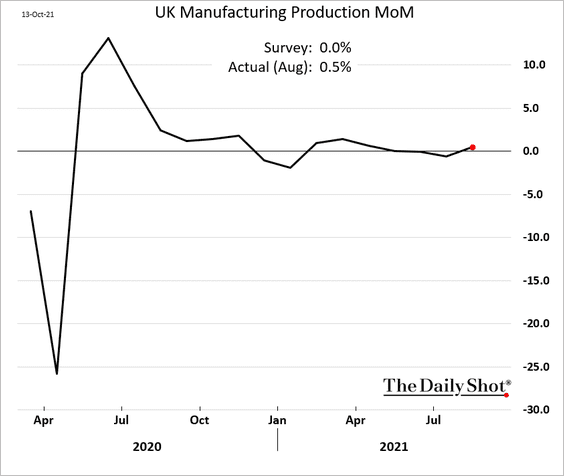
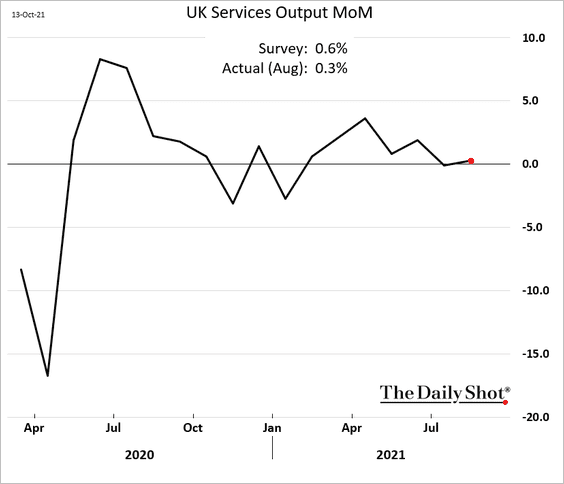
Manufacturing and service-sector output grew.
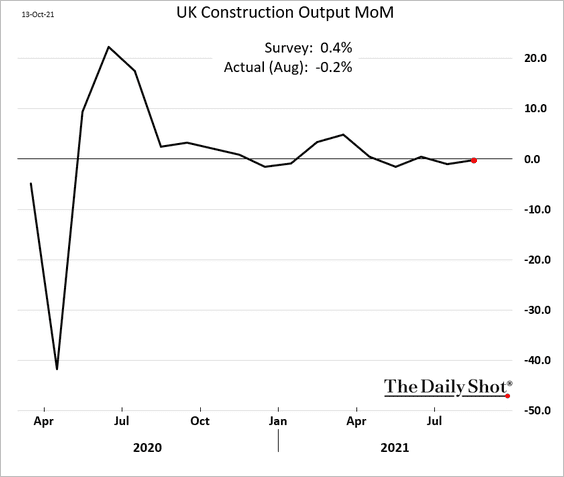
Construction declined.
Here are the index levels.
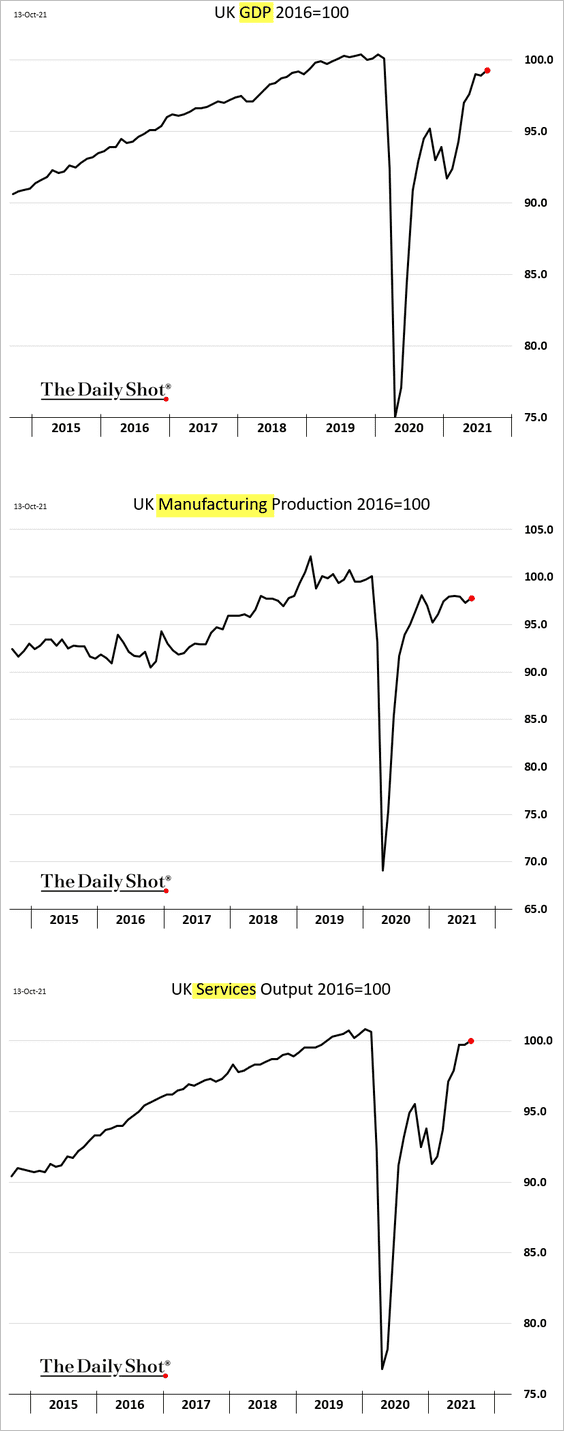
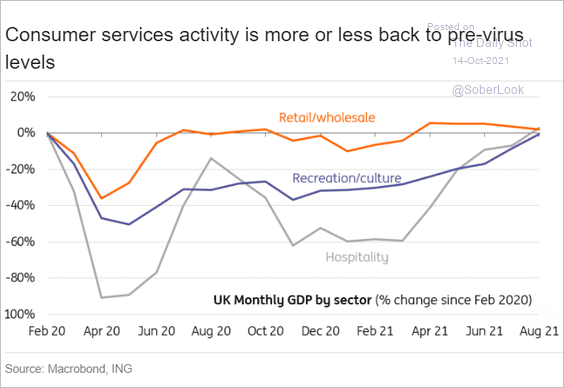
As the last chart above shows, services have pretty much recovered to pre-pandemic levels. The chart below shows some detail.
 Source: ING
——————–
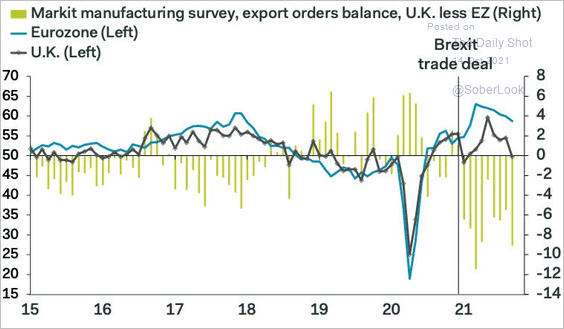
2. UK export orders have been lagging the Eurozone after Brexit.
 Source: Pantheon Macroeconomics
Back to Index
The Eurozone
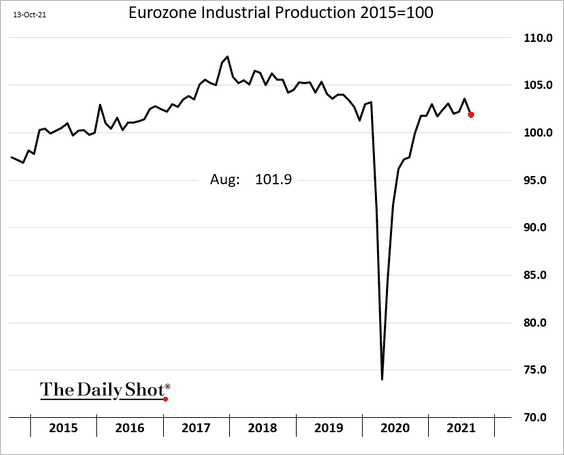
1. Industrial production dipped in August.
 Source: MarketWatch Read full article
——————–
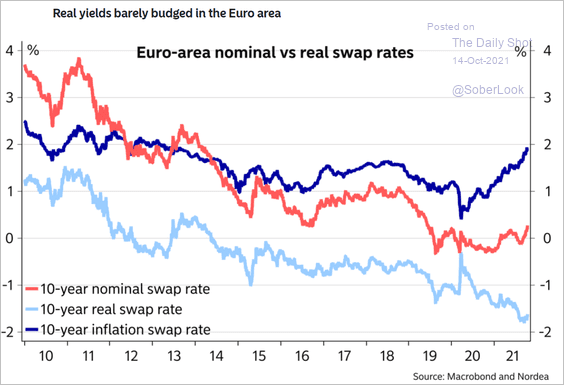
2. Market-implied real rates are near record lows, which shows extraordinary levels of central bank accommodation.
 Source: Nordea Markets
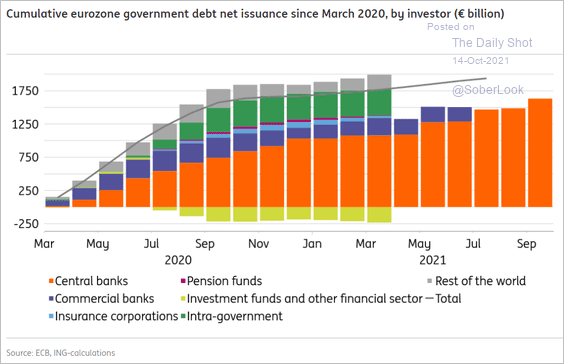
3. The ECB (Eurosystem) financed 95% of net government debt issued since February 2020.
 Source: ING
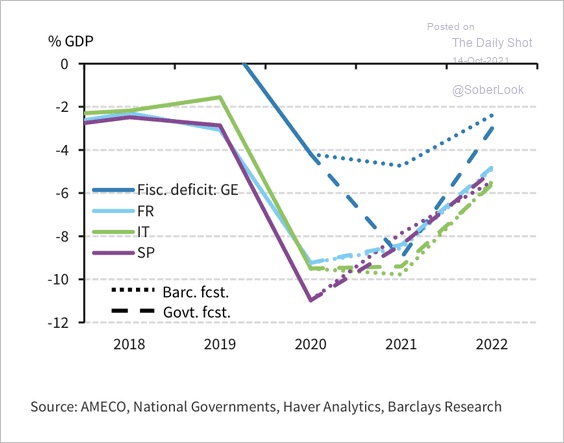
4. Barclays expects lower than projected government deficits next year, mainly because policies resulting from the new German coalition will likely be gradual.
 Source: Barclays Research
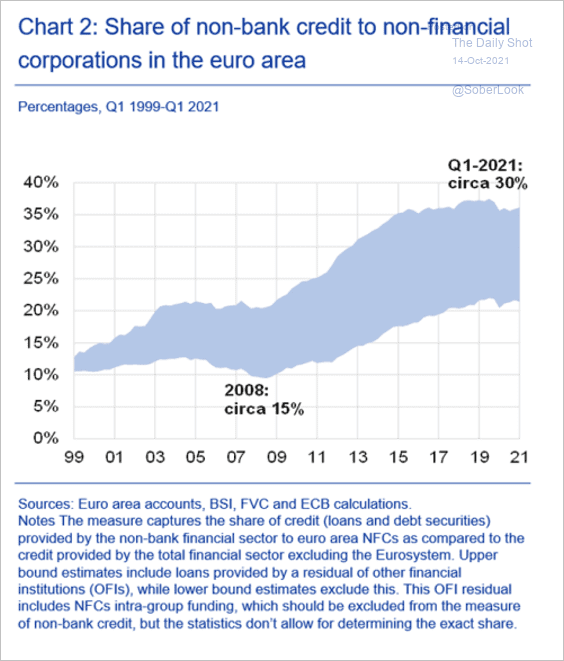
5. Non-bank credit activity has been gaining market share.
 Source: BIS Read full article
Back to Index
Asia – Pacific
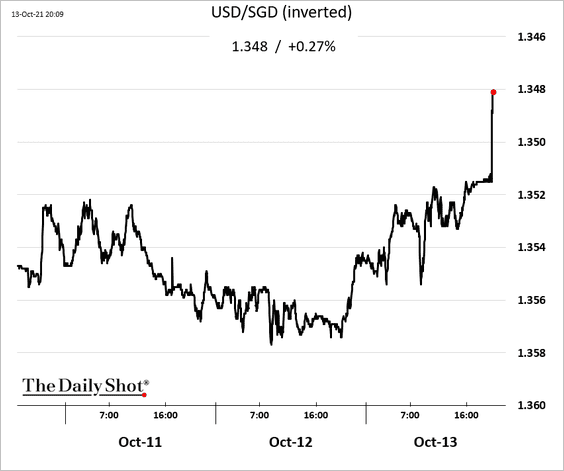
1. The Singapore dollar moved higher after a surprise tightening from the central bank.
 Source: Reuters Read full article
——————–
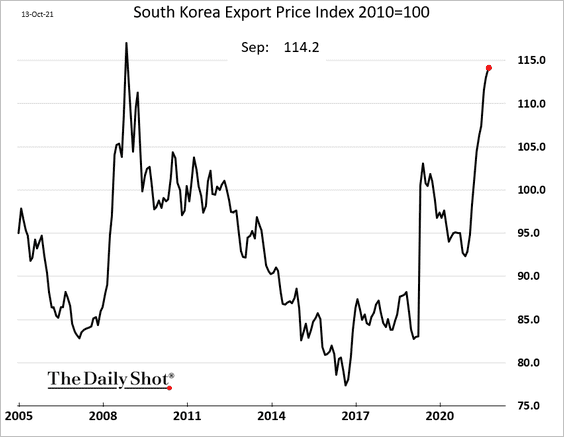
2. South Korea’s export prices continue to surge.
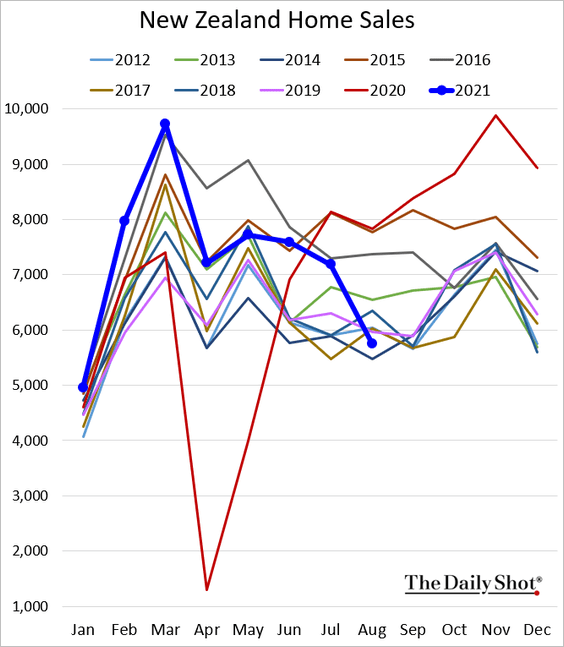
3. New Zealand’s home sales deteriorated after the coronavirus lockdowns.
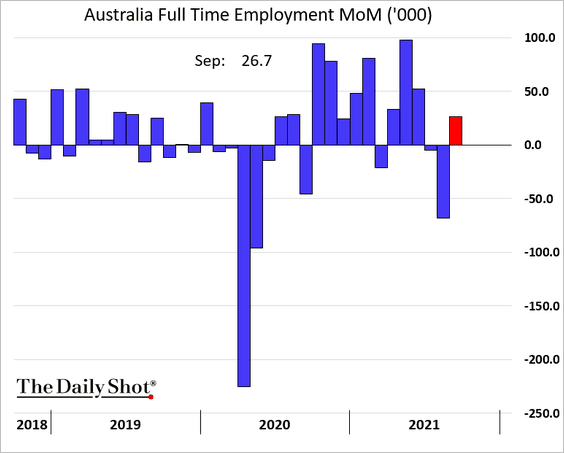
4. Australia’s employment report was mixed.
• Job losses were higher than expected.
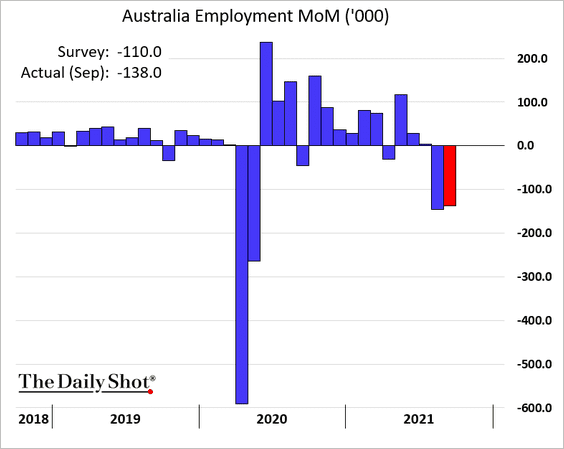
But they were all in part-time positions.
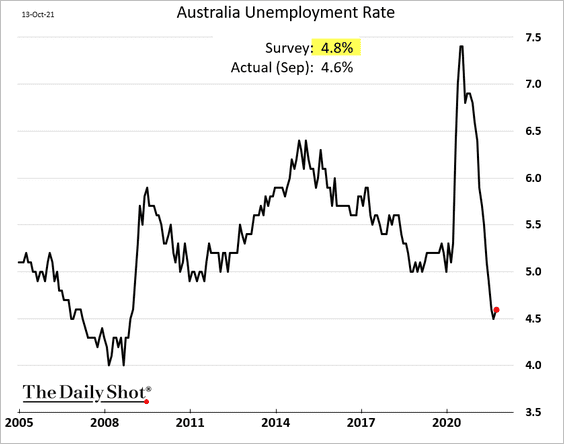
• The unemployment rate held up better than expected.
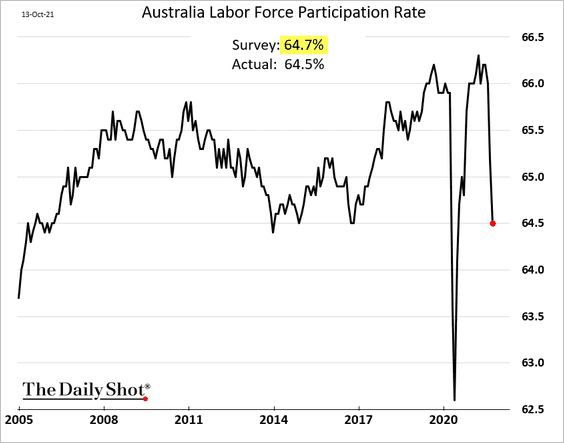
But the participation rate tumbled again. Many of the part-time workers who lost their jobs exited the labor force.
Back to Index
China
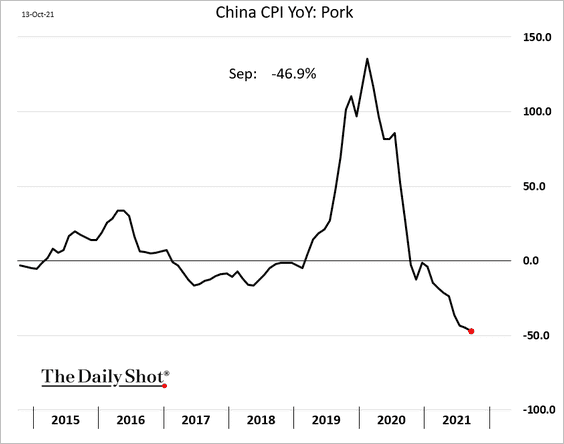
1. The headline inflation declined again, now firmly below 1%. The core CPI was roughly unchanged.
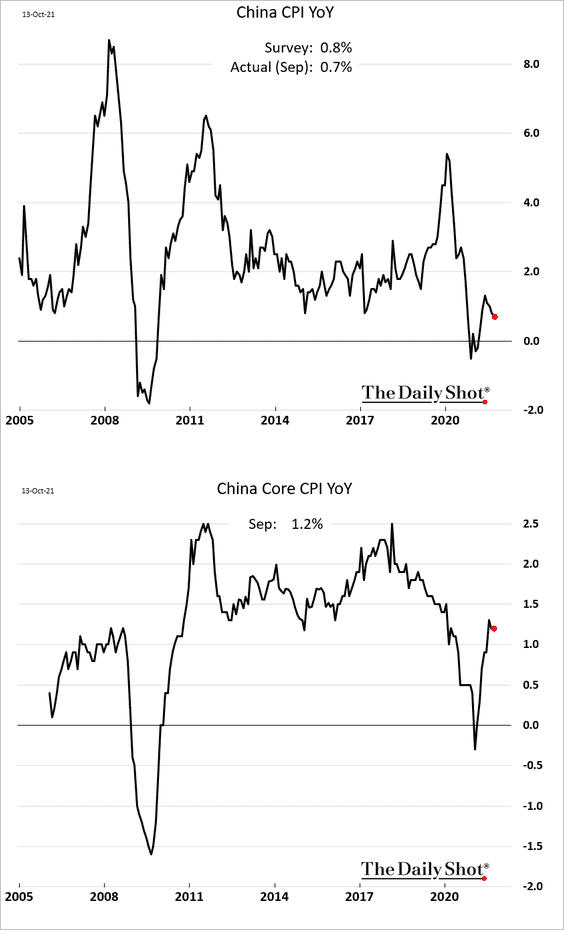
Falling pork prices keep pressuring the headline CPI.
——————–
2. Producer prices continue to surge.
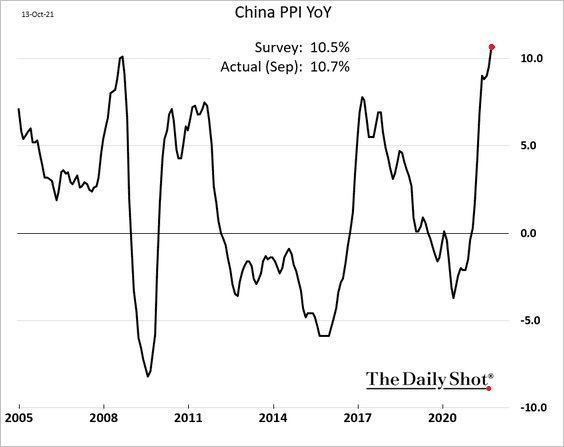
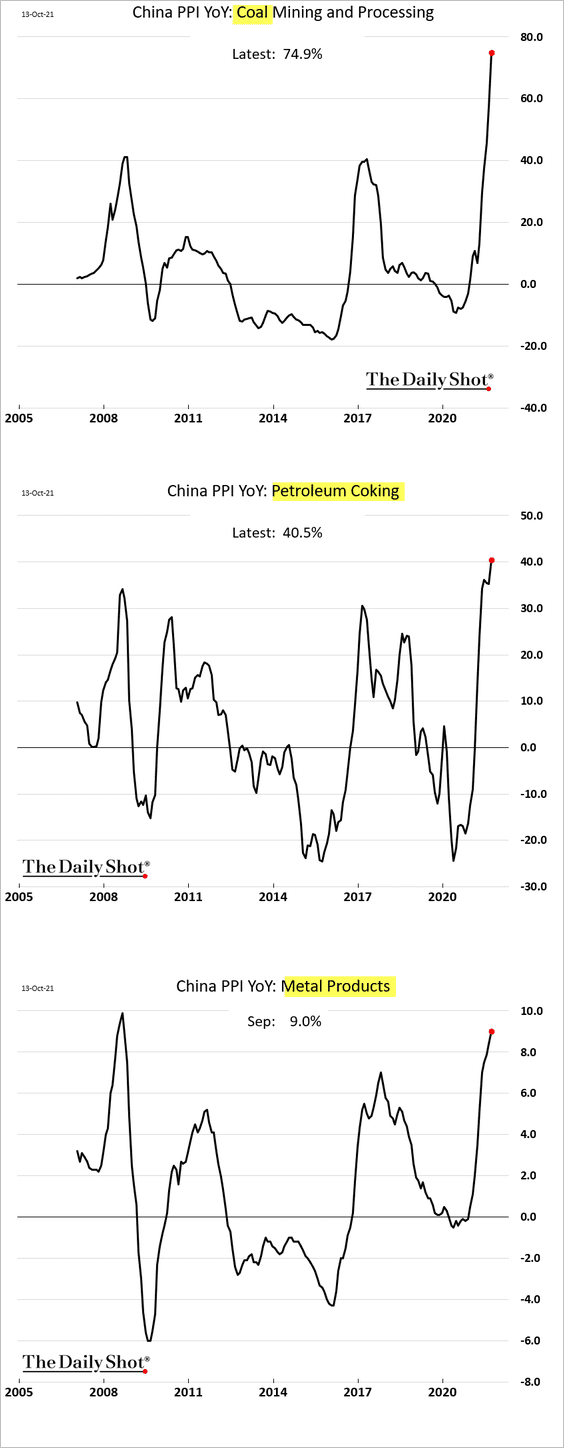
Coal and other energy/industrial commodities have been the main drivers of the PPI gains. The PPI – CPI divergence could pressure margins in some sectors.
——————–
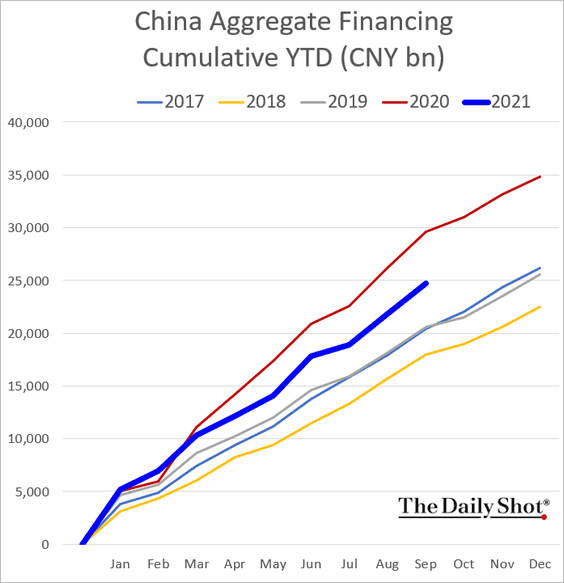
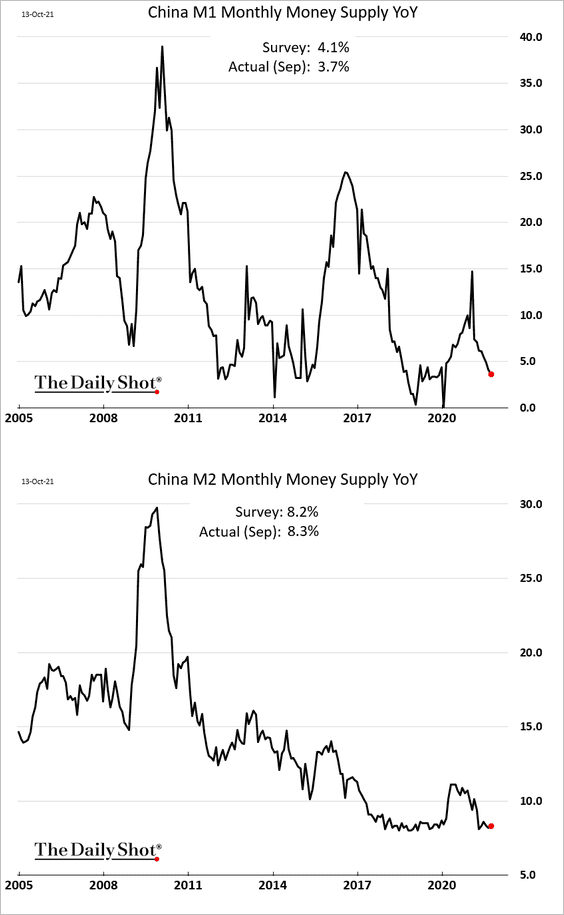
3. Loan growth was somewhat softer than expected last month.
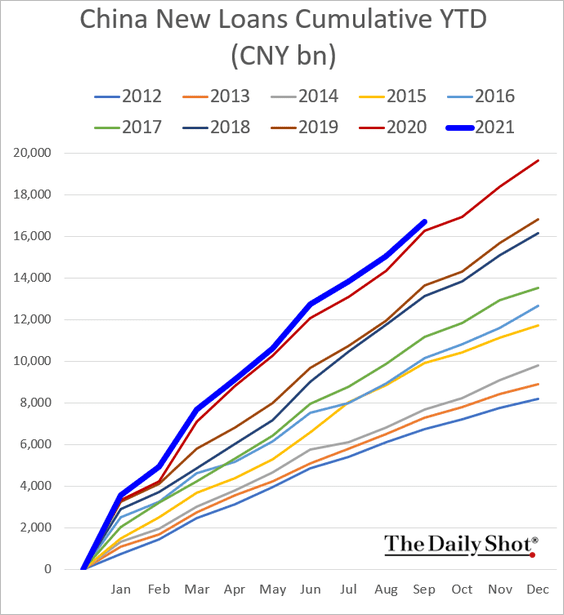
• Aggregate financing continues to run well below 2020 levels.
• Money supply expansion remains modest relative to recent years.
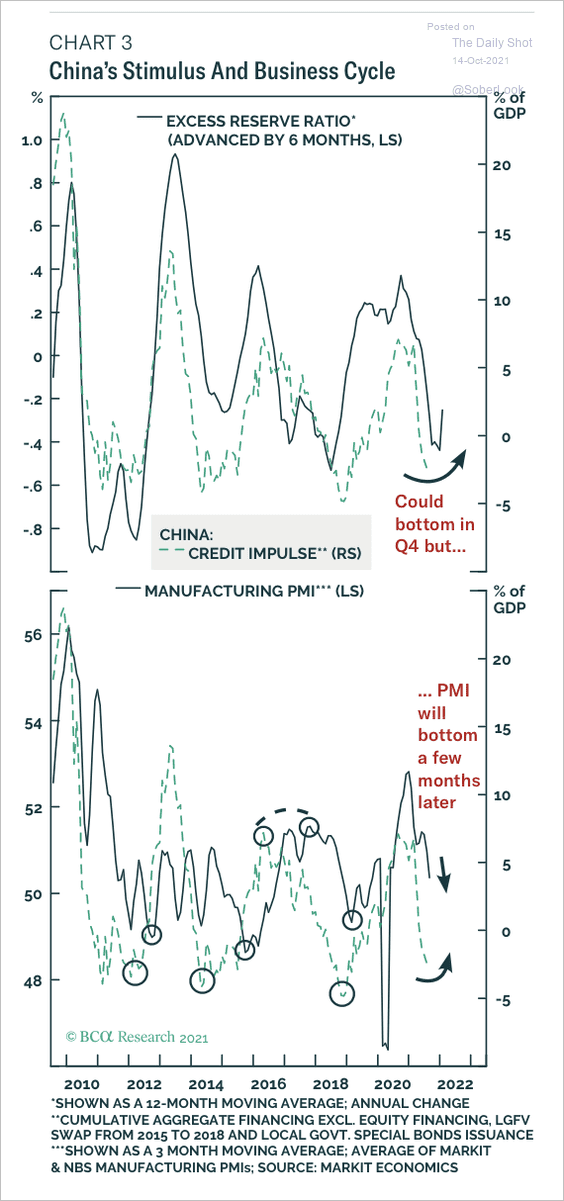
• BCA Research expects China’s credit impulse to bottom later this year, which could support a manufacturing recovery.
 Source: BCA Research
——————–
4. Next, we have some updates on the property sector.
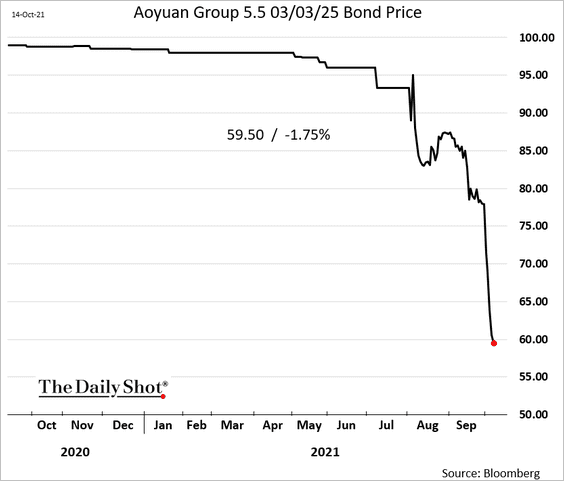
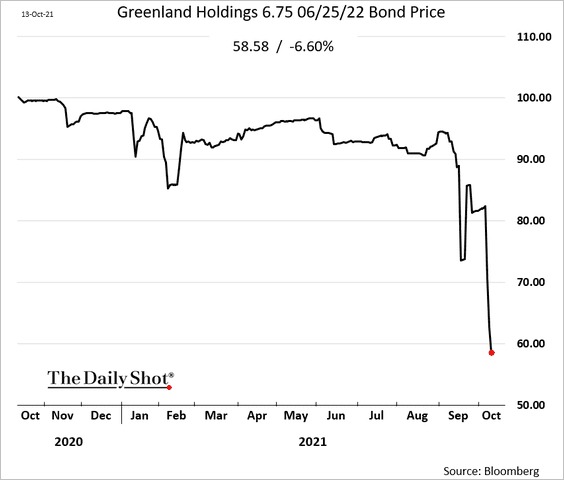
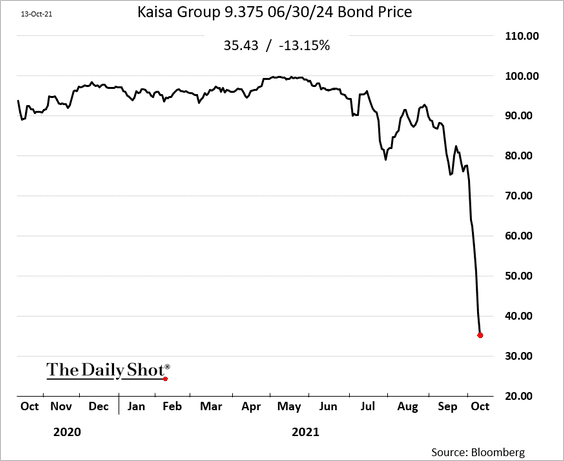
• Developers’ bonds remain under pressure amid downgrades.
 Source: Reuters Read full article
– Aoyuan:
– Greenland:
– Kaisa:
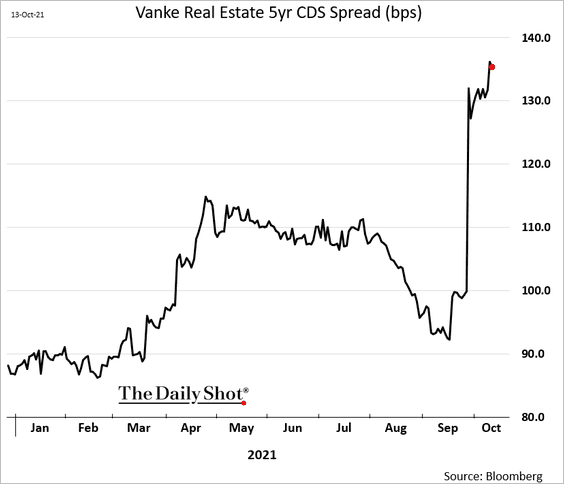
• Investors continue to use Vanke’s credit default swap as a hedge for the sector.
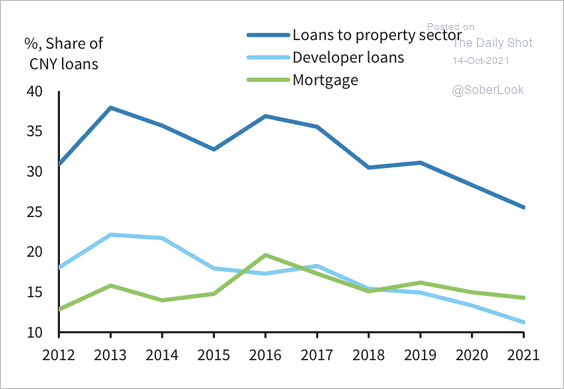
• The banking system’s exposure to the property sector has declined over the past few years.
 Source: Barclays Research
——————–
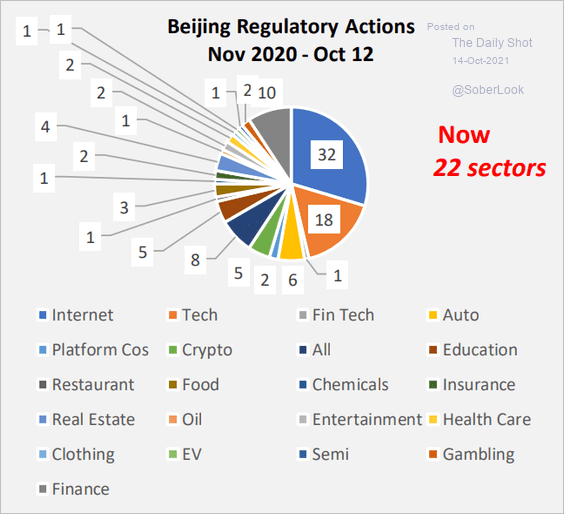
5. Beijing’s regulatory actions have expanded massively.
 Source: Cornerstone Macro
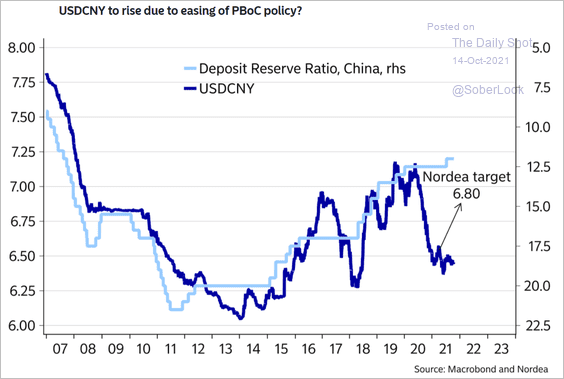
6. The renminbi could weaken from here, especially if the PBoC eases further in response to the property sector credit crunch.
 Source: Nordea Markets
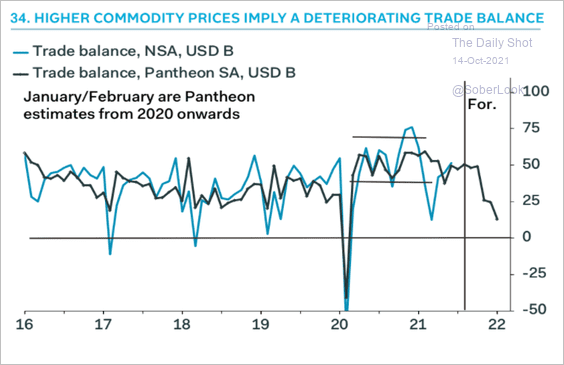
7. Higher commodity prices are becoming a headwind for China’s trade surplus.
 Source: Pantheon Macroeconomics
8. How is the Phase-1 trade deal with the US progressing?
![]() Source: PIIE Read full article
Source: PIIE Read full article
Back to Index
Emerging Markets
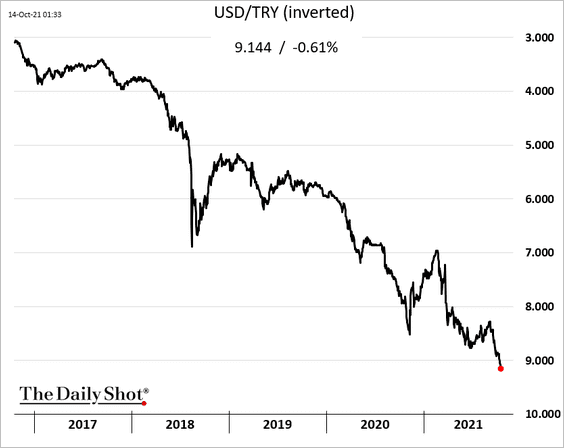
1. The Turkish lira continues to sink as Erdogan crushes the central bank.
 Source: @markets Read full article
——————–
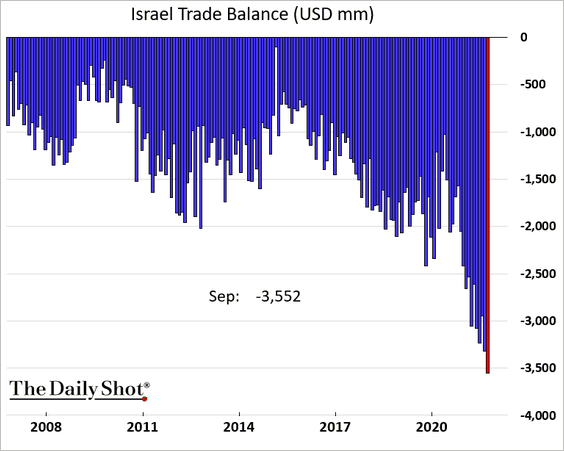
2. Israel’s trade deficit hits another record high.
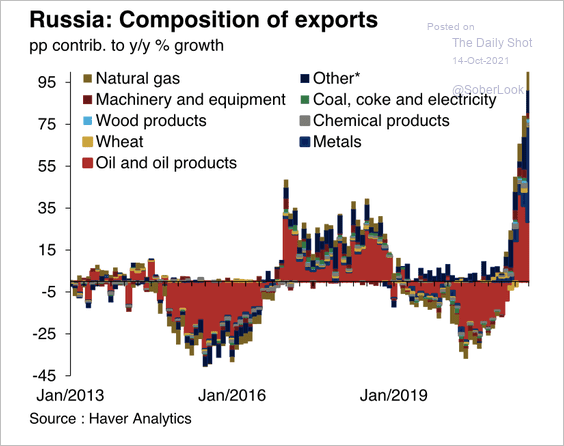
3. This chart shows the composition of Russia’s exports.
 Source: Oxford Economics
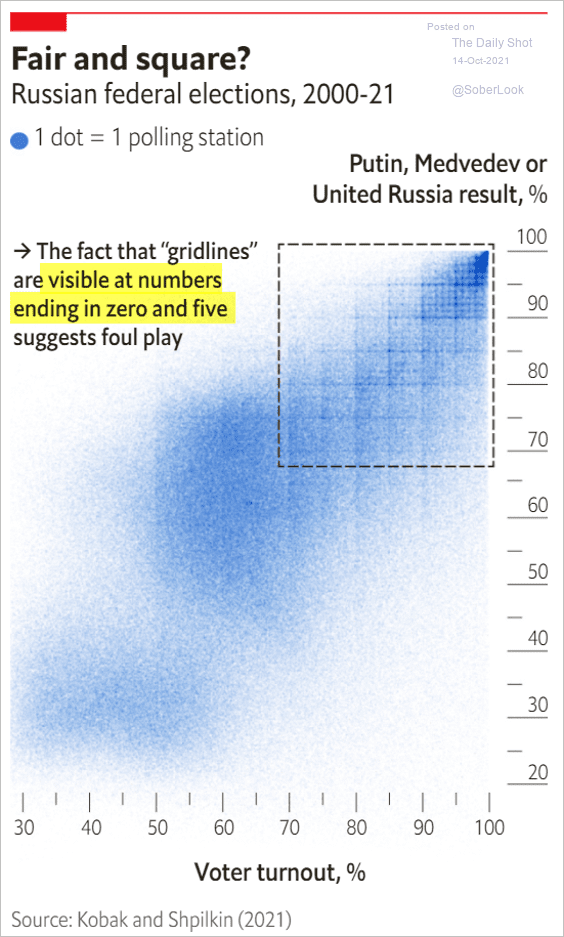
Separately, the federal election figures for turnout and votes point to foul play.
 Source: The Economist Read full article
——————–
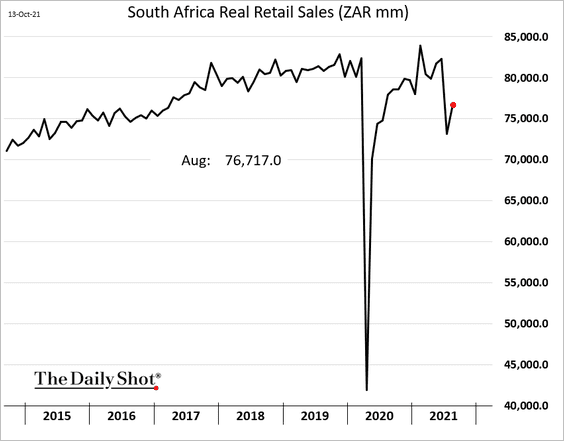
4. South Africa’s retail sales rebounded in August but remained well below pre-COVID levels.
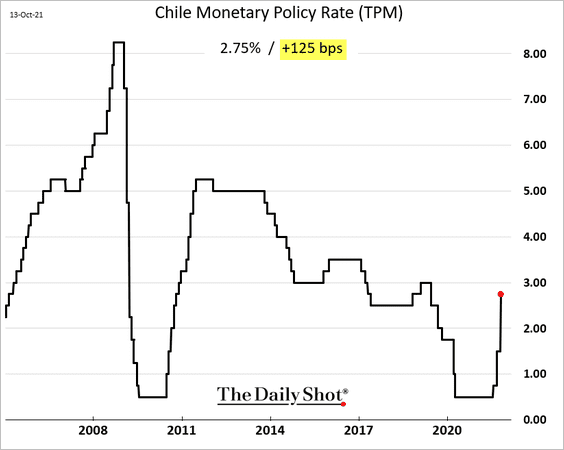
5. Chile’s central bank hiked aggressively as inflation surges (market expected 100 bps).
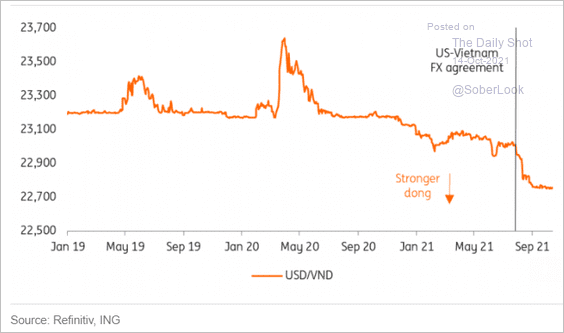
6. Vietnam’s currency strengthened after the agreement with the US (to avoid being labeled a “currency manipulator”).
 Source: ING
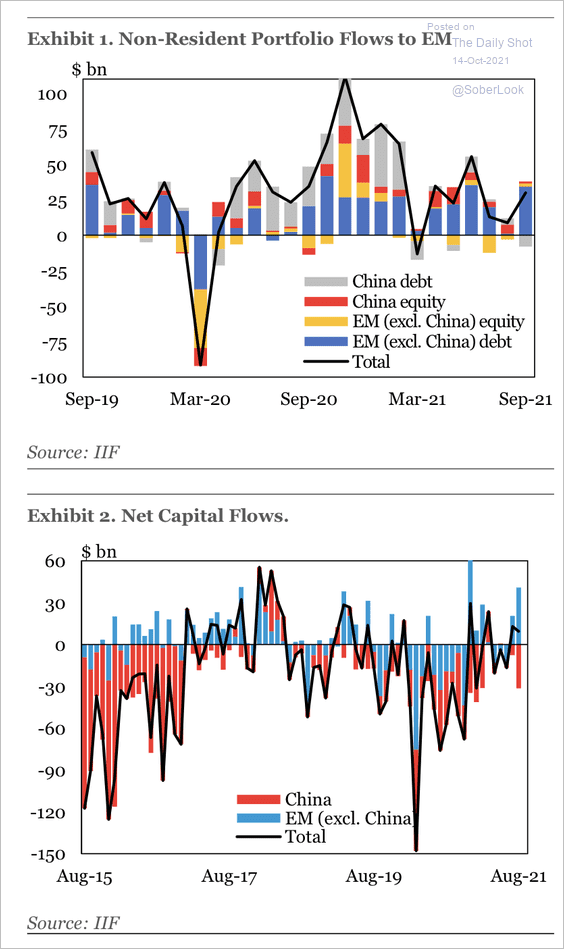
7. Market jitters surrounding the Evergrande crisis in China led to weaker equity flows in EM last month. Still, a high level of EM hard currency sovereign bond issuance in September helped lift overall flows, according to IIF.
 Source: IIF
Back to Index
Cryptocurrency
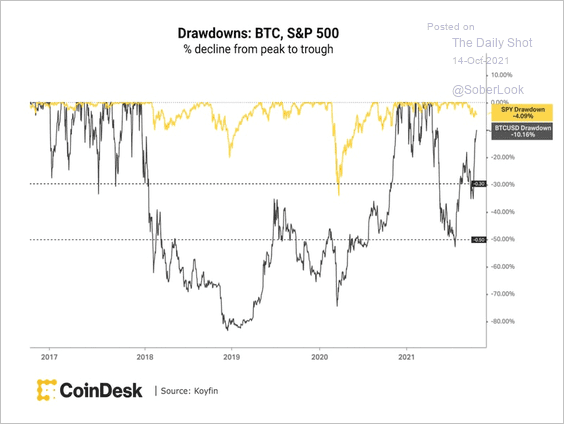
1. Bitcoin continues to outperform.
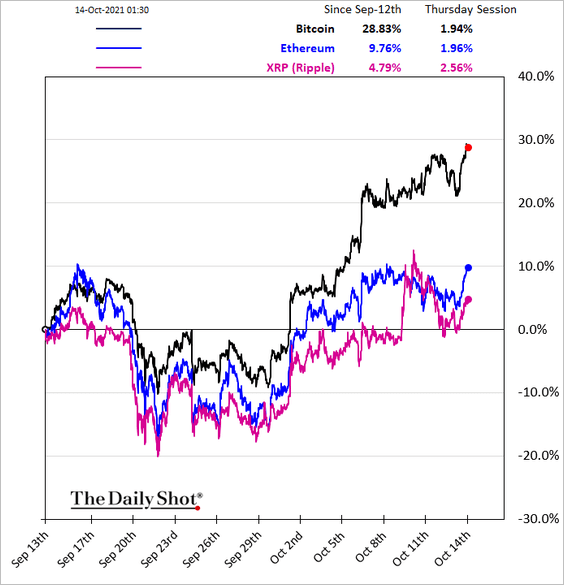
• Bitcoin is approaching its all-time high, recovering quickly from a near 50% drawdown two months ago.
 Source: CoinDesk Read full article
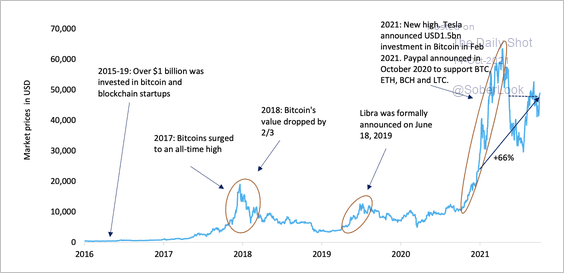
• Here is a look at the evolution of bitcoin’s market price.
 Source: Deutsche Bank Research
——————–
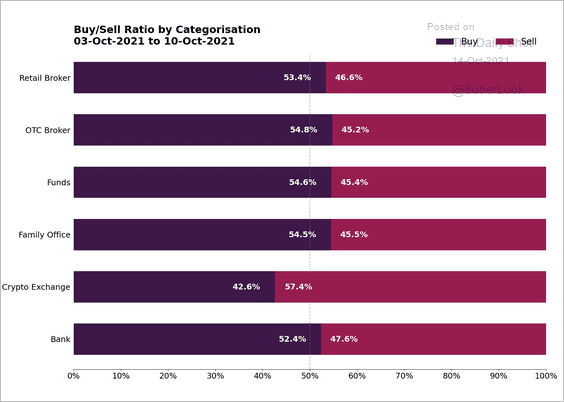
2. Crypto exchanges have been net sellers.
 Source: B2C2; @fintechfrank
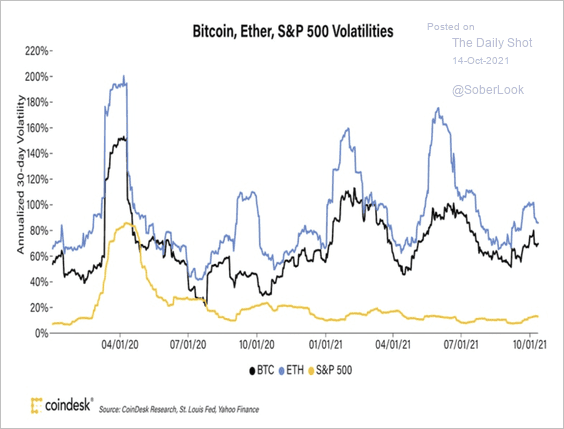
3. The 30-day volatility of bitcoin and ether declined over the past few months but remains elevated given recent price swings.
 Source: CoinDesk Read full article
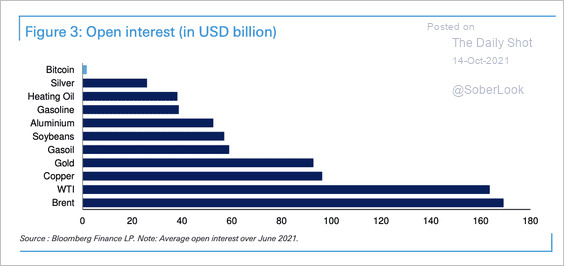
4. Bitcoin’s open interest is still very small compared to other assets.
 Source: Deutsche Bank Research
5. The US is now the largest bitcoin mining center – a new tailwind for America’s domestic energy prices.
 Source: Reuters Read full article
Back to Index
Commodities
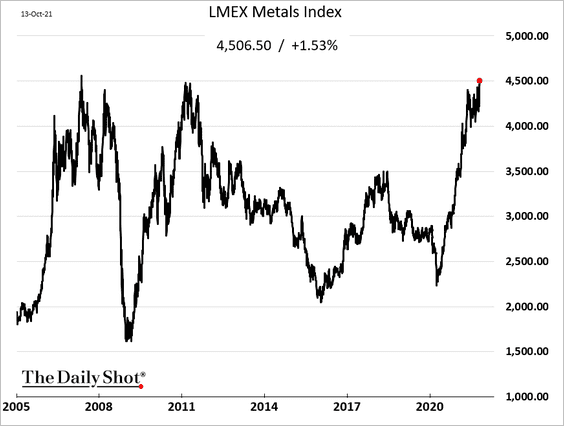
1. Industrial metal prices are nearing record highs.
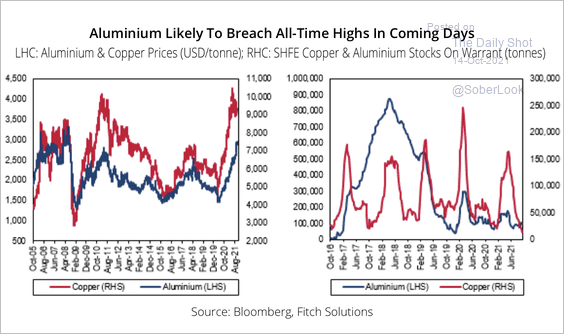
• The recent rise in copper prices could bode well for aluminum.
 Source: Fitch Solutions Macro Research
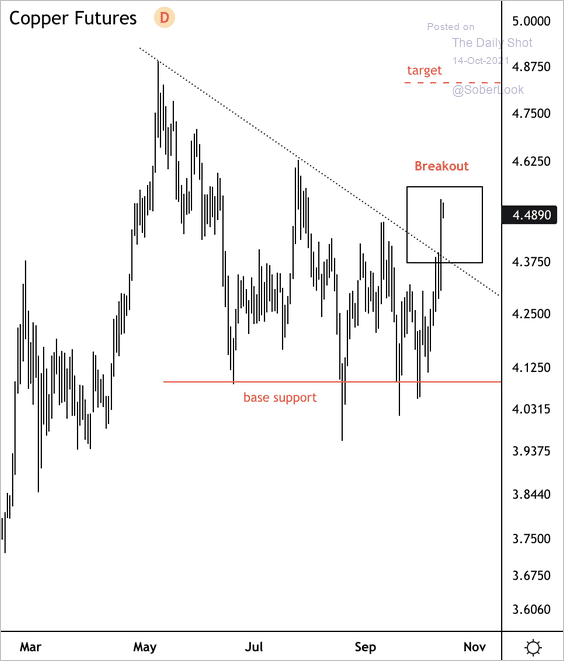
• Copper futures broke above a short-term downtrend.
 Source: Dantes Outlook
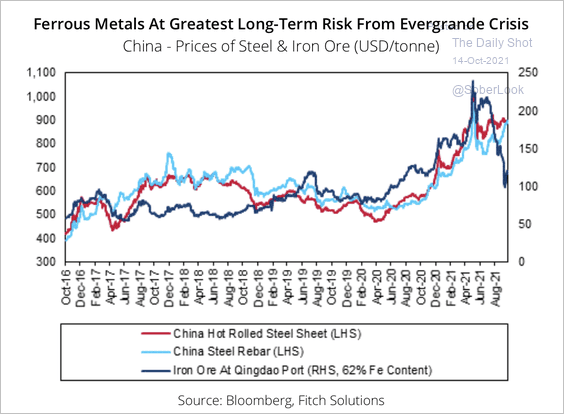
• Fitch Solutions expects further volatility in metal prices as China’s debt issues facing large property developers could weigh on construction demand.
 Source: Fitch Solutions Macro Research
On the other hand, the metals market could react to power shortage issues, which could dampen production.
 Source: Reuters Read full article
——————–
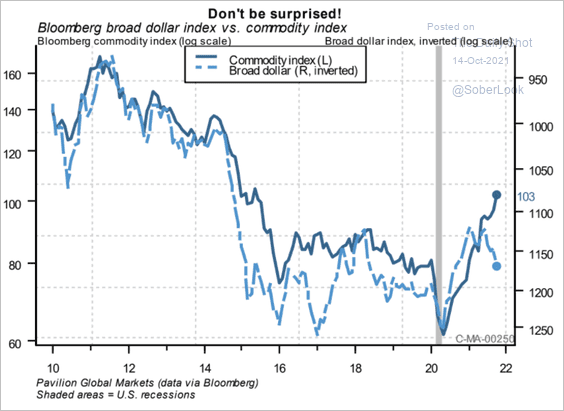
2. Further gains in the dollar could become a headwind for commodities.
 Source: Pavilion Global Markets
Back to Index
Energy
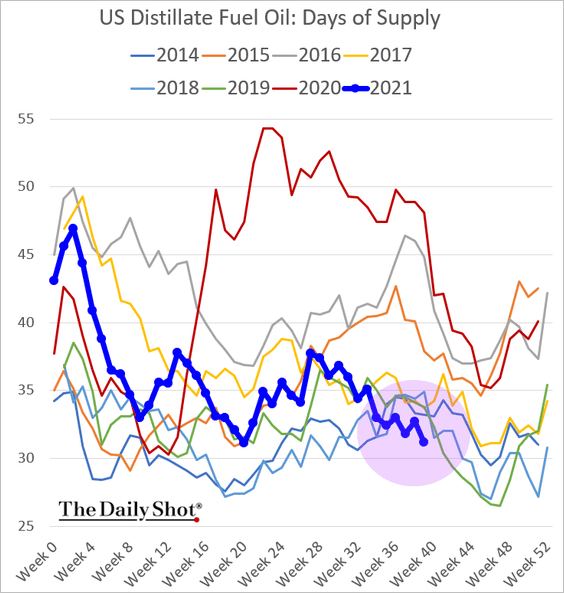
1. US distillates inventories are at multi-year lows.
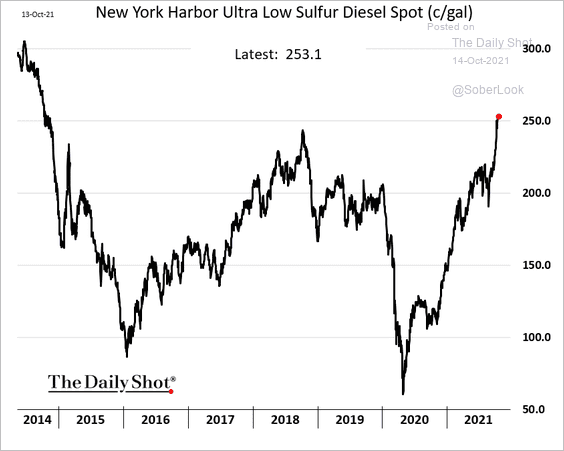
The New York Harbor diesel prices hit the highest level since 2015.
 h/t @Devikakrishnak
——————–
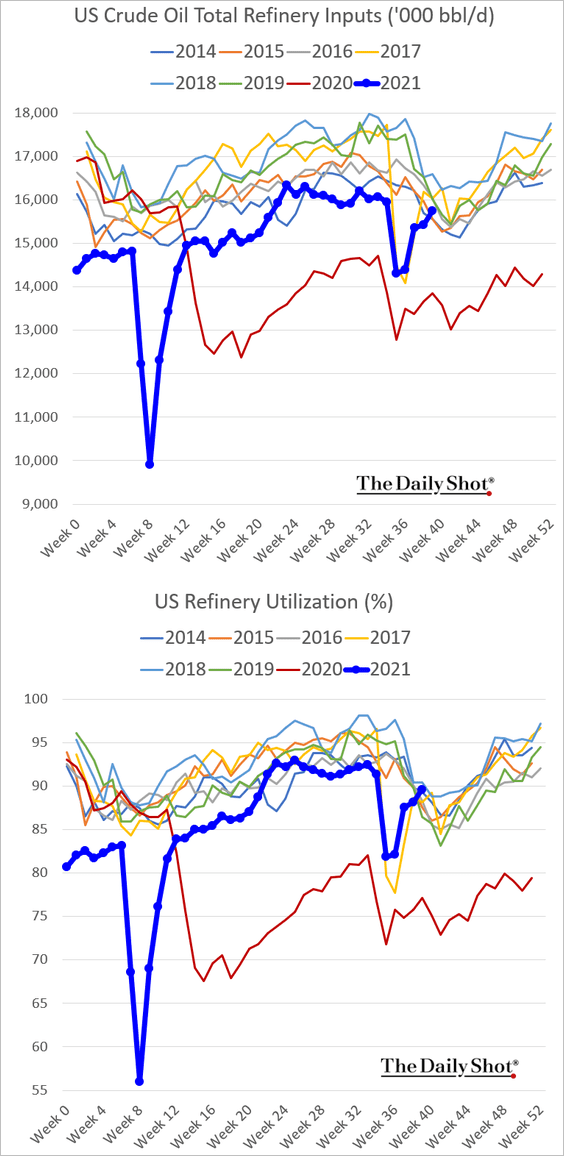
2. US refinery activity continues to grow.
3. Oil supply will outpace demand next year, which could weigh on prices.
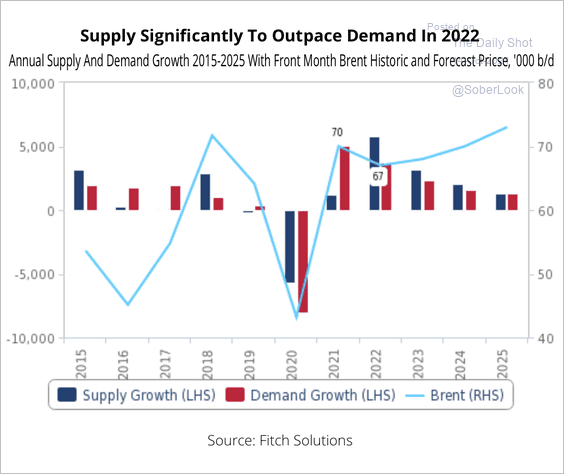 Source: Fitch Solutions Macro Research
4. US crude oil output decline in 2021 has been more extensive than initially estimated.
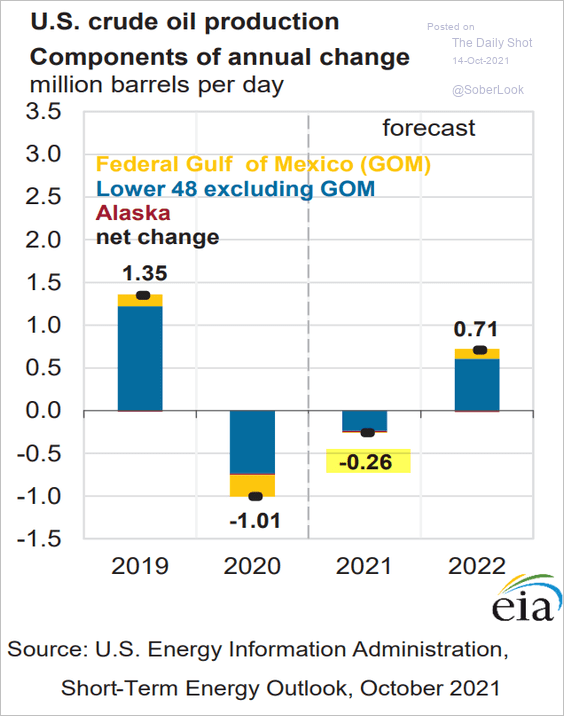
 Source: Reuters Read full article
——————–
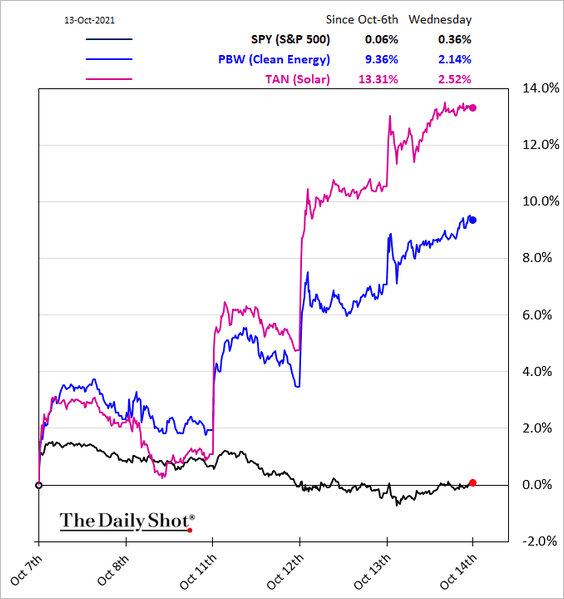
5. Clean energy stocks are surging.
Back to Index
Equities
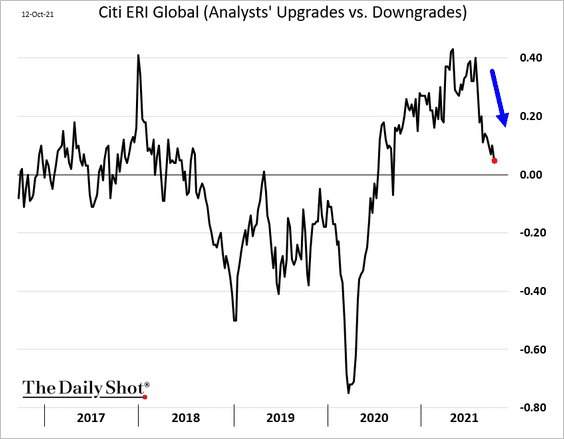
1. Global earnings downgrades are about to overtake upgrades.
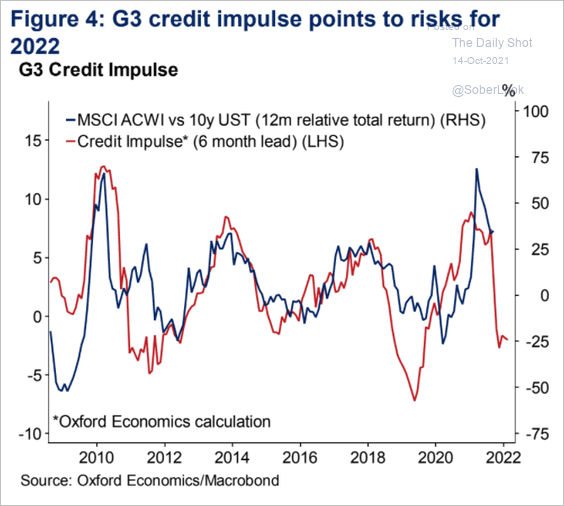
2. The G3 credit impulse suggests that stocks will underperform bonds next year.
 Source: Oxford Economics
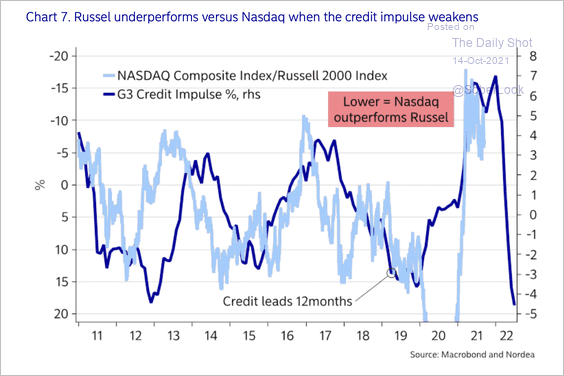
A weakening credit impulse is a precursor for Nasdaq to start outperforming the Russell 2000 again sometime in 2022.
 Source: Nordea Markets
——————–
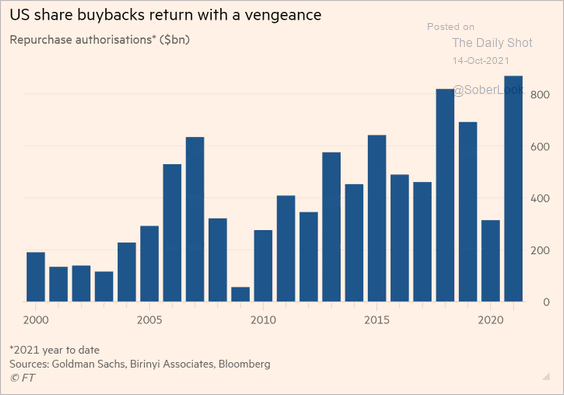
3. Share buybacks continue to surge.
 Source: @financialtimes Read full article
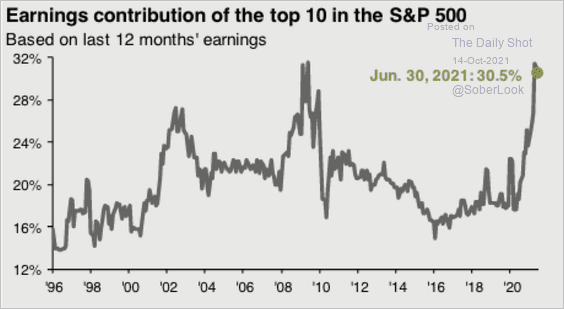
4. The top 10 stocks in the S&P 500 contribute about 30% of total earnings.
 Source: J.P. Morgan Asset Management
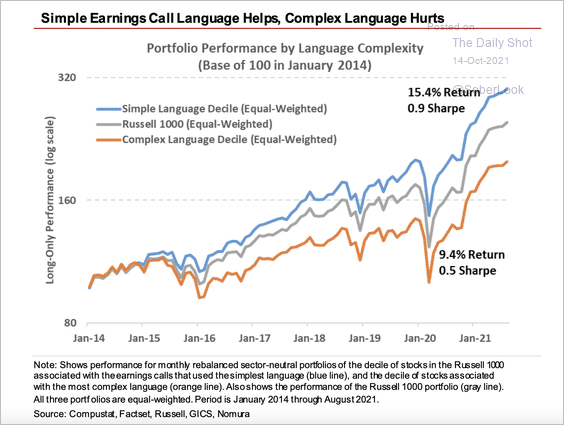
5. Companies that use simple language on earnings calls outperform those that use complex language.
 Source: Nomura Securities Further reading
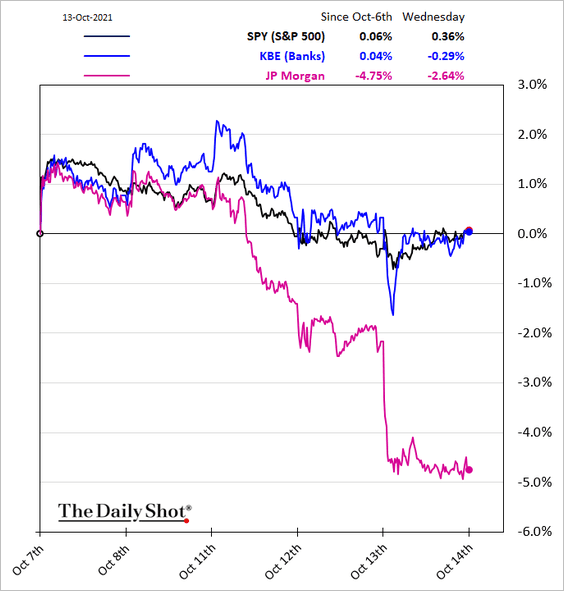
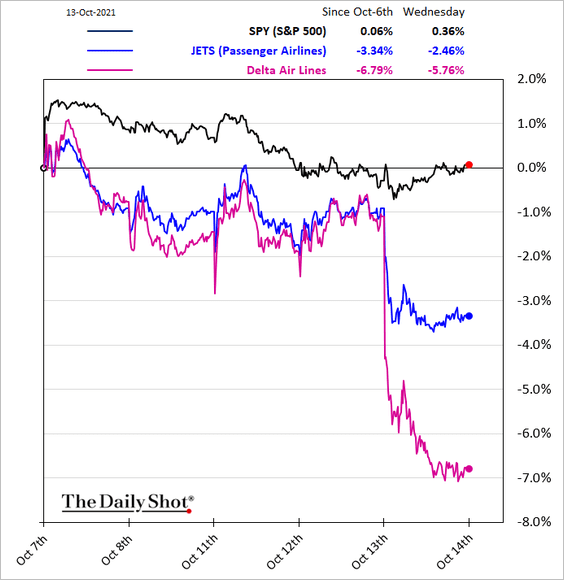
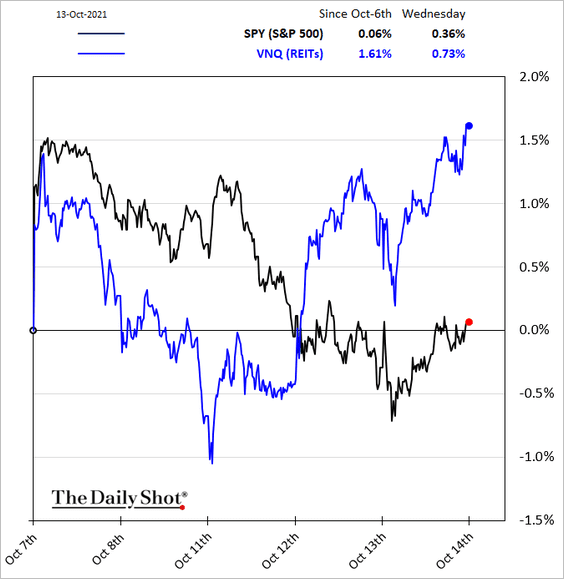
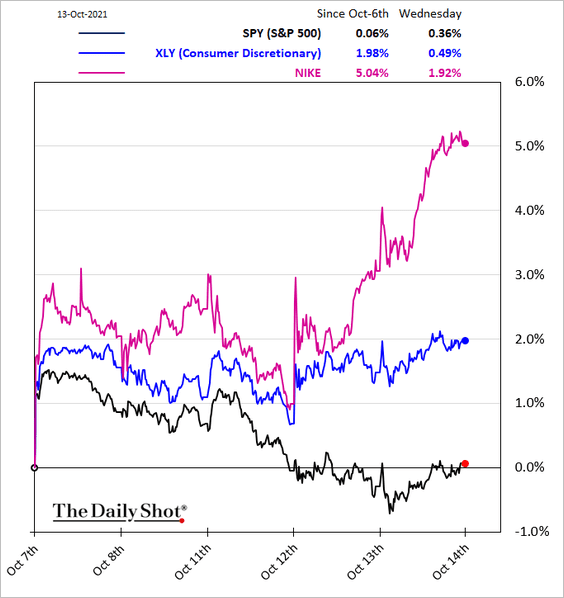
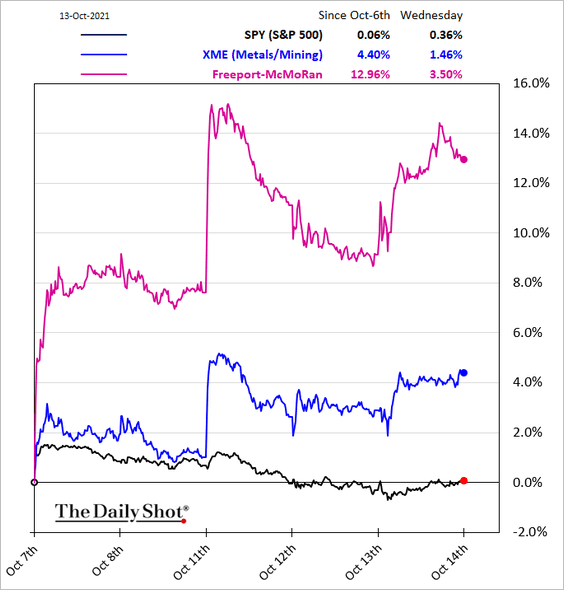
6. Next, we have some sector performance updates.
• Banks:
 Source: Bloomberg Read full article
• Airlines (hit by rising fuel costs):
 Source: IBD Read full article
• REITs:
• Consumer Discretionary:
• Metals & Mining:
• Marine industry:
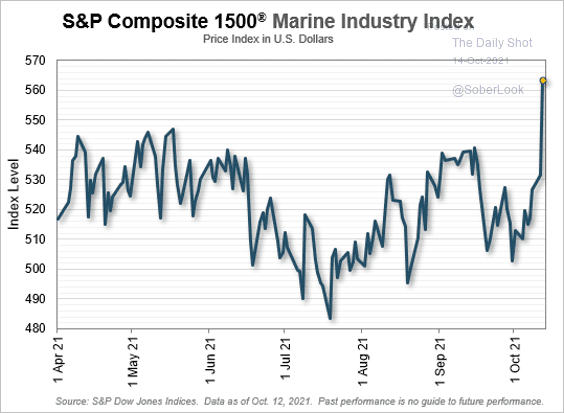 Source: S&P Global Market Intelligence
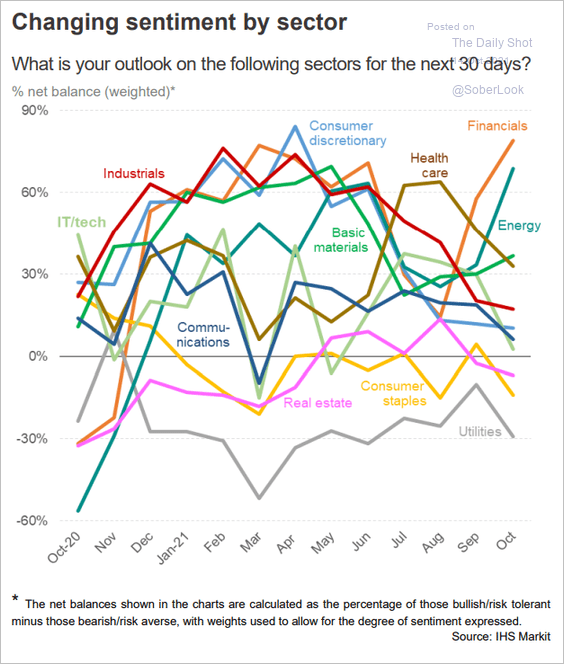
• The evolution of sentiment by sector:
 Source: IHS Markit
——————–
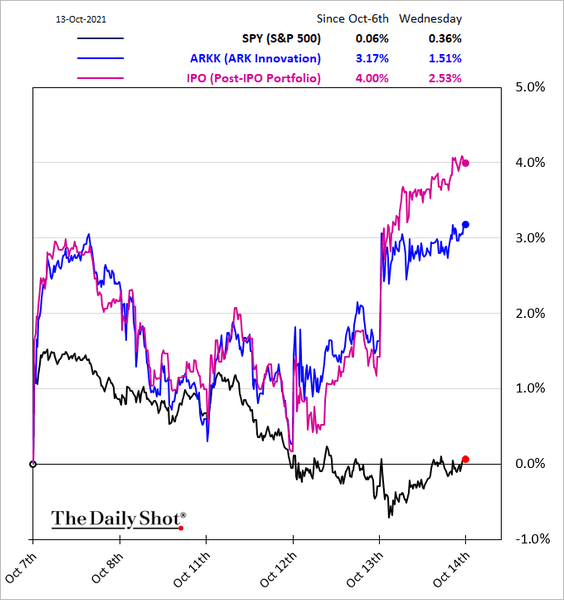
7. Speculative stocks have been surging this week.
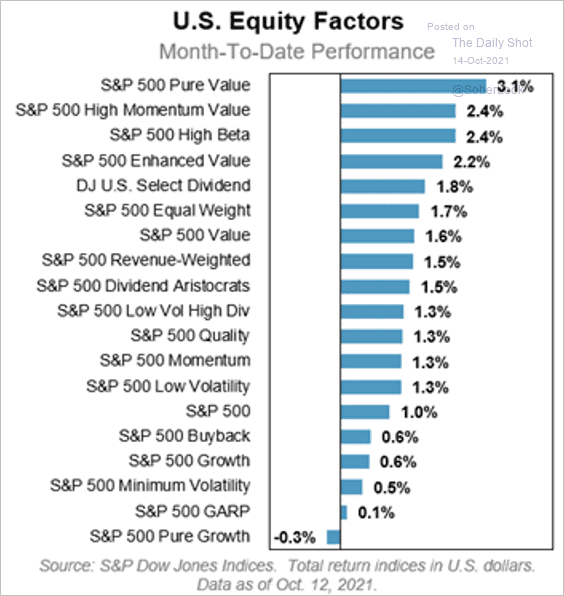
8. Now, let’s take a look at some factor trends.
• Month-to-date performance:
 Source: S&P Global Market Intelligence
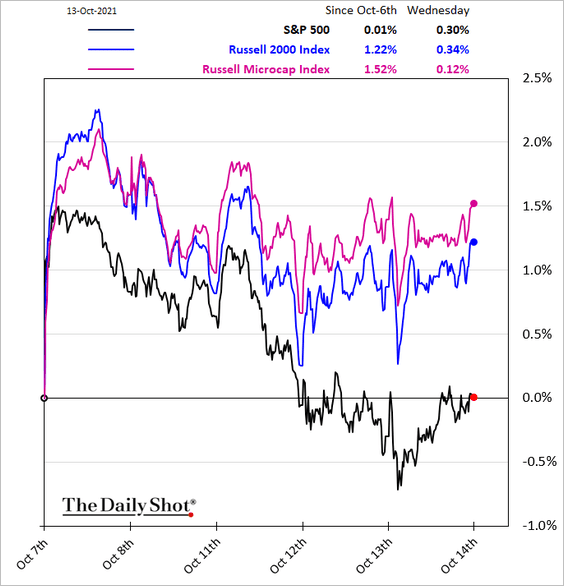
• Small caps and microcaps:
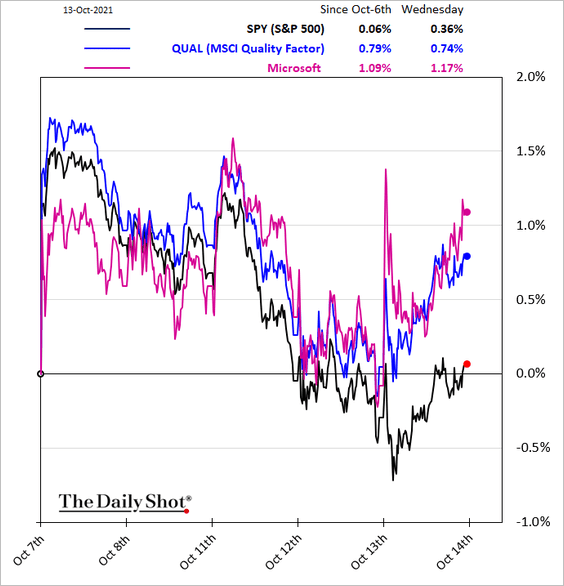
• Quality:
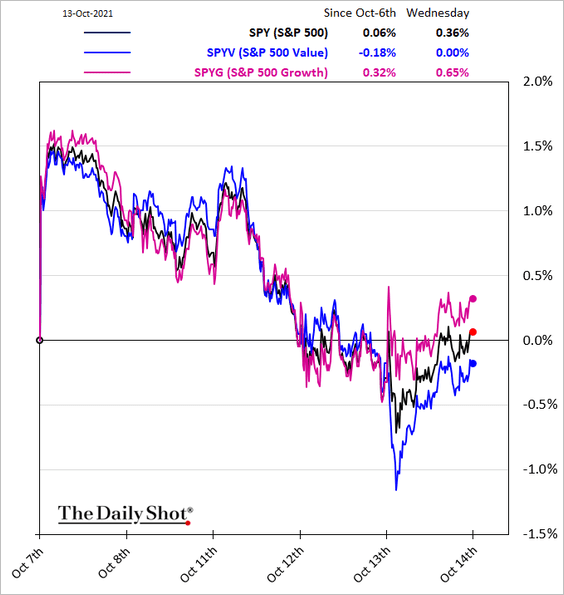
• Growth vs. value:
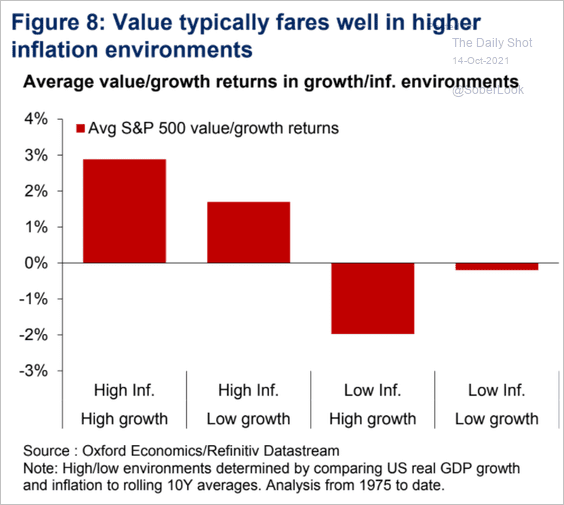
By the way, value stocks typically outperform during periods of higher inflation.
 Source: Oxford Economics
Back to Index
Rates
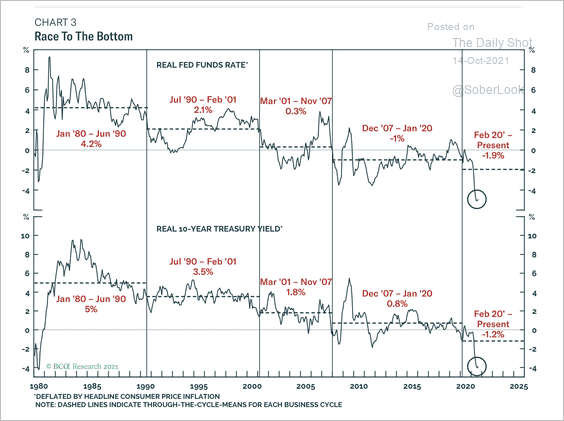
1. Flows into inflation-linked funds continue to dominate, …
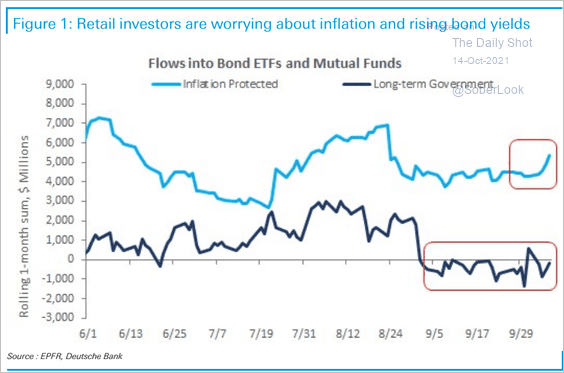 Source: Deutsche Bank Research
.. driving real rates lower.
 Source: BCA Research
——————–
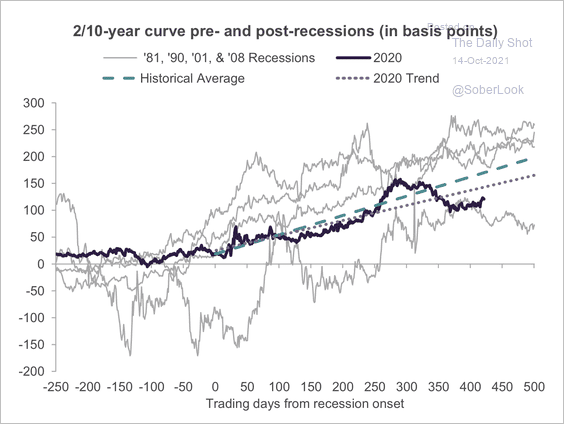
2. Additional curve steepening would be consistent with previous post-recession environments.
 Source: Truist Advisory Services
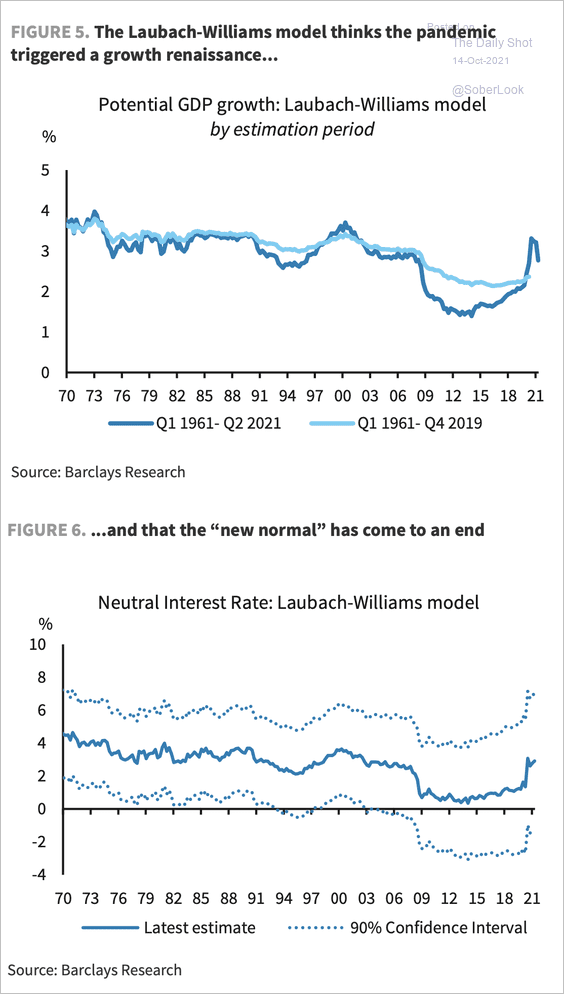
3. The Laubach-Williams model suggests that potential GDP growth will be higher going forward, although the model could overfit the recent extreme GDP moves.
 Source: Barclays Research
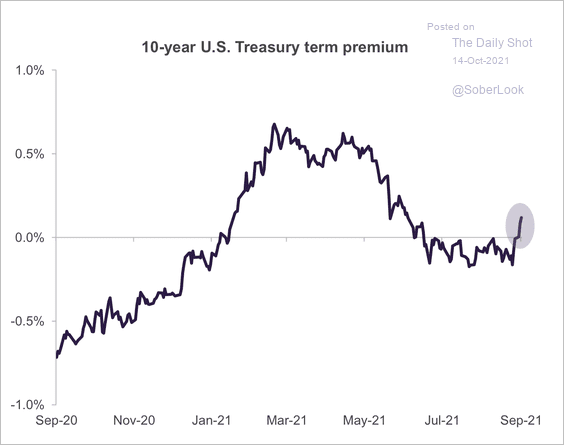
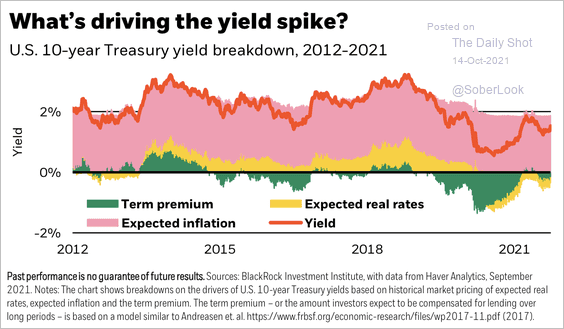
4. The 10-year Treasury term premium has increased since the September Fed meeting …
 Source: Truist Advisory Services
…accounting for most of the recent rise in yields.
 Source: BlackRock
Back to Index
Global Developments
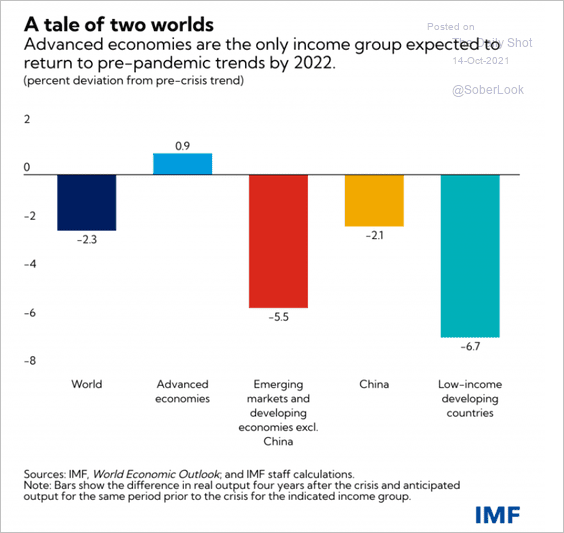
1. Advanced economies are expected to return to pre-COVID growth trends next year.
 Source: IMF
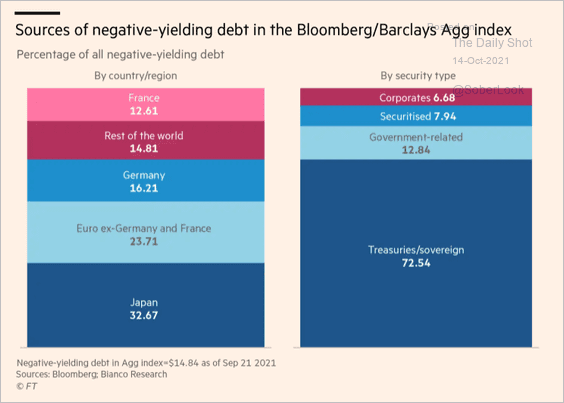
2. Here is the distribution of negative-yielding debt.
 Source: @financialtimes Read full article
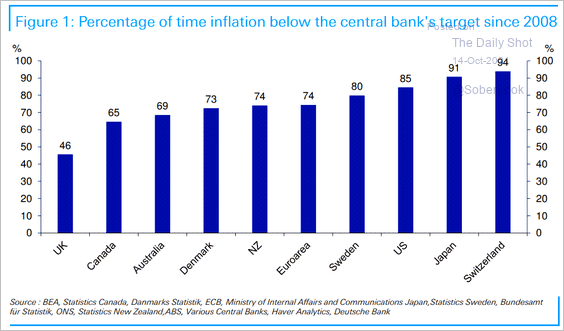
3. Next, we have the percentage of time the CPI has been below central bank targets.
 Source: Deutsche Bank Research
4. Global automobile sales have been tanking.
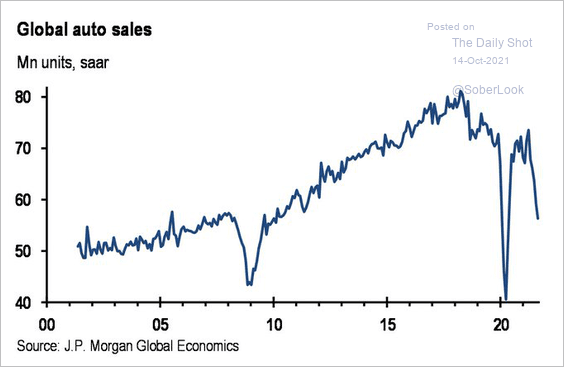 Source: JP Morgan; @carlquintanilla
5. Shipping costs from China/East Asia to the US west coast have risen far more than any other route over the past year.
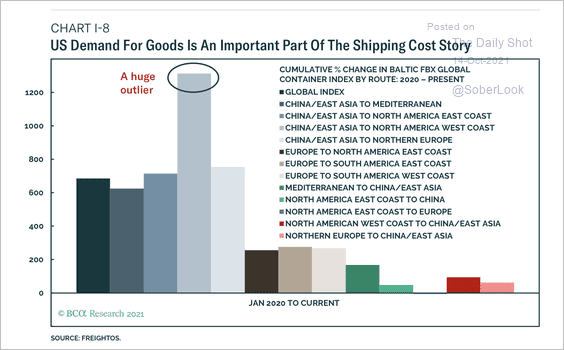 Source: BCA Research
——————–
Food for Thought
1. The largest consumer markets of this decade:
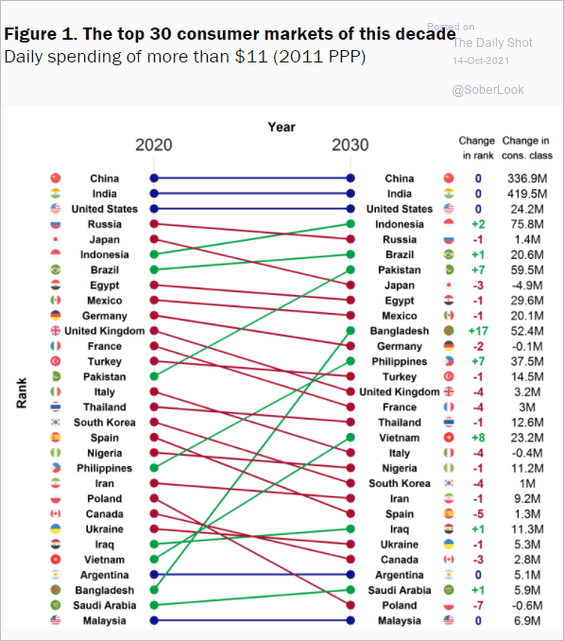 Source: Brookings Read full article
2. The number vs. floorspace of US commercial buildings:
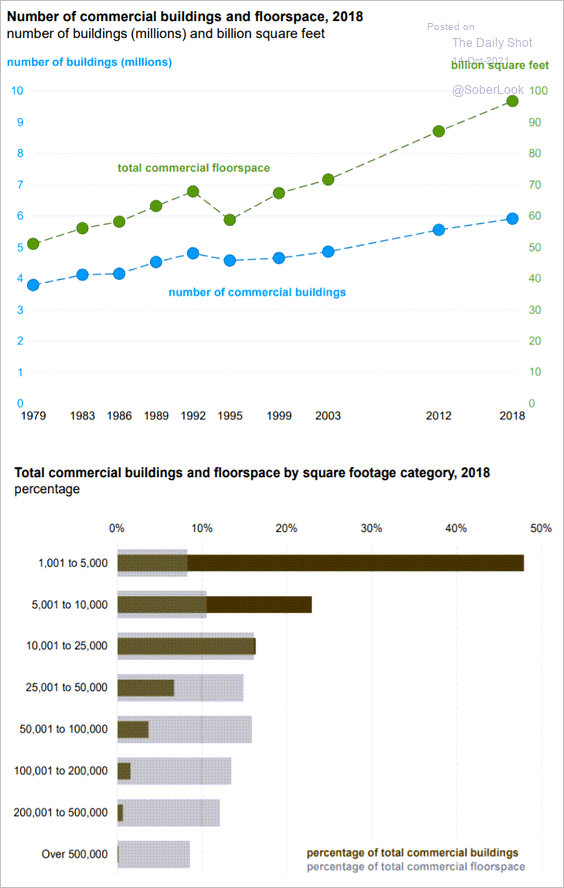 Source: EIA Read full article
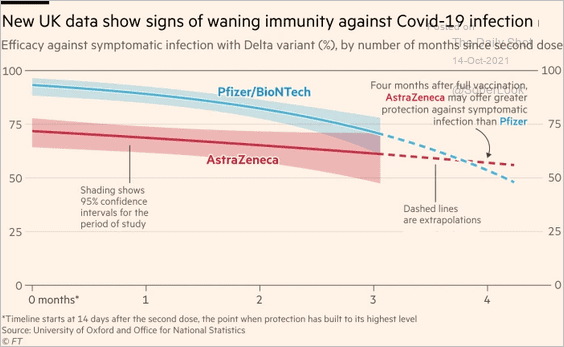
3. COVID vaccine efficacy over time:
 Source: @financialtimes Read full article
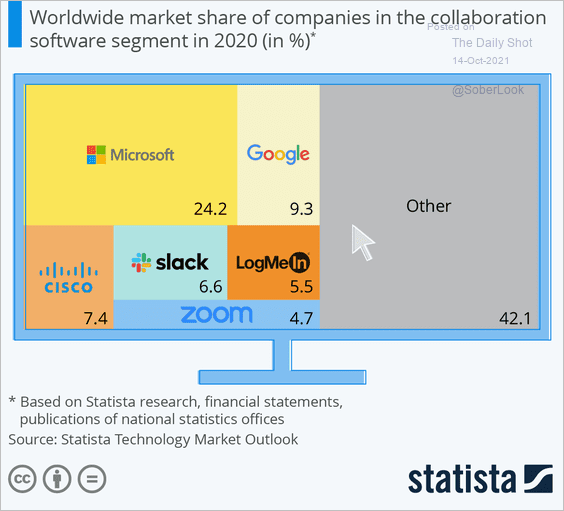
4. Collaboration software market:
 Source: Statista
5. Market share of e-commerce firms:
 Source: IMF Read full article
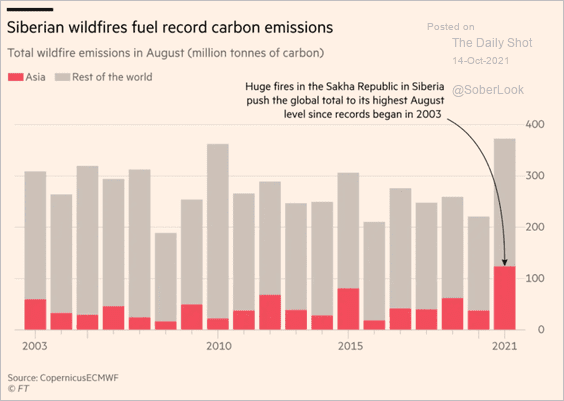
6. Record carbon emissions from Siberian wildfires:
 Source: @financialtimes Read full article
7. US views on marriage between Black people and White people:
 Source: Gallup Read full article
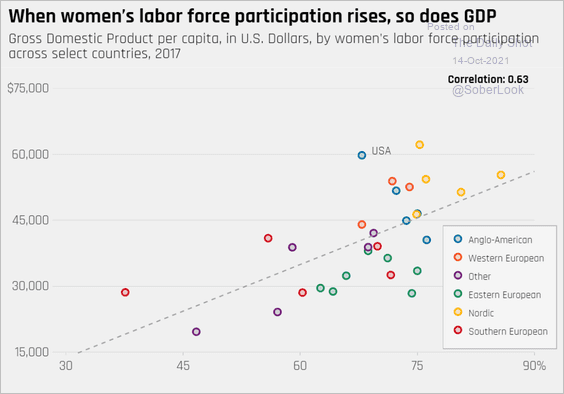
8. GDP per capita vs. women’s labor force participation:
 Source: Equitable Growth Read full article
9. The world’s 25 largest lakes:
 Source: Visual Capitalist Read full article
——————–
Back to Index
