
The Daily Shot: 15-Oct-21
• The United States
• The Eurozone
• Europe
• Asia – Pacific
• China
• Emerging Markets
• Cryptocurrency
• Commodities
• Energy
• Equities
• Alternatives
• Credit
• Global Developments
• Food for Thought
The United States
1. Producer prices surprised to the downside. The core PPI excluding trade services (business markups) increased only 0.1% last month.
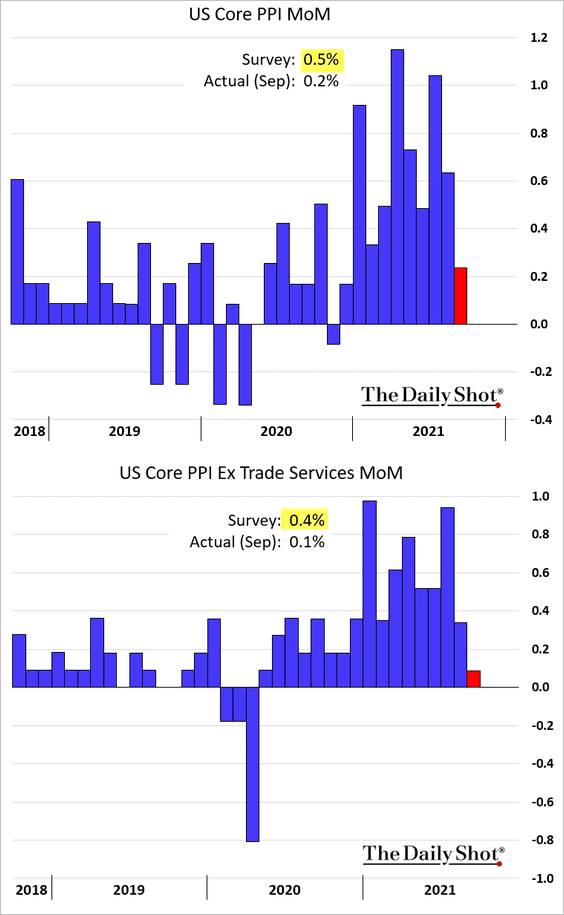
As with the CPI report, airline fares were a drag on the PPI.
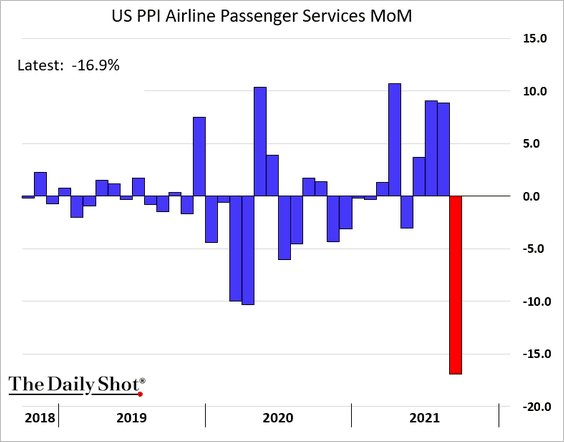
However, the decline in airfare prices is probably over, and the PPI is likely to reaccelerate.
 7-day moving average
——————–
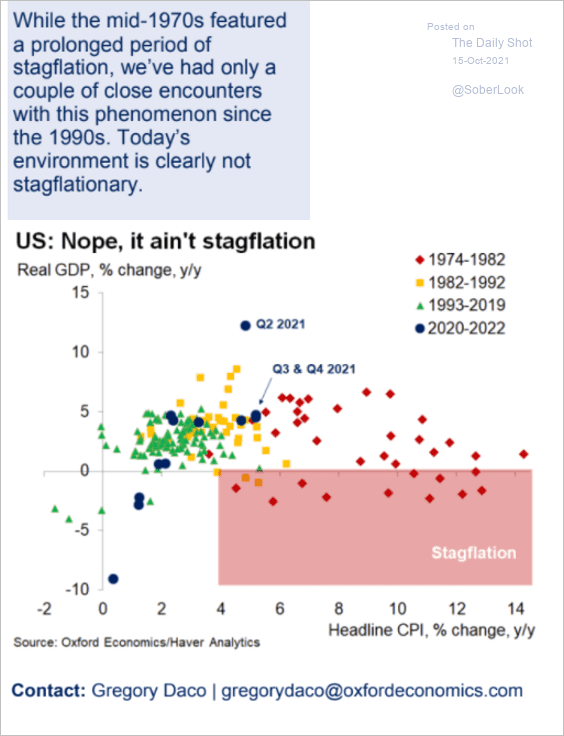
2. Is the US facing stagflation? Not quite.
 Source: Oxford Economics
But “slowflation” is a possibility.
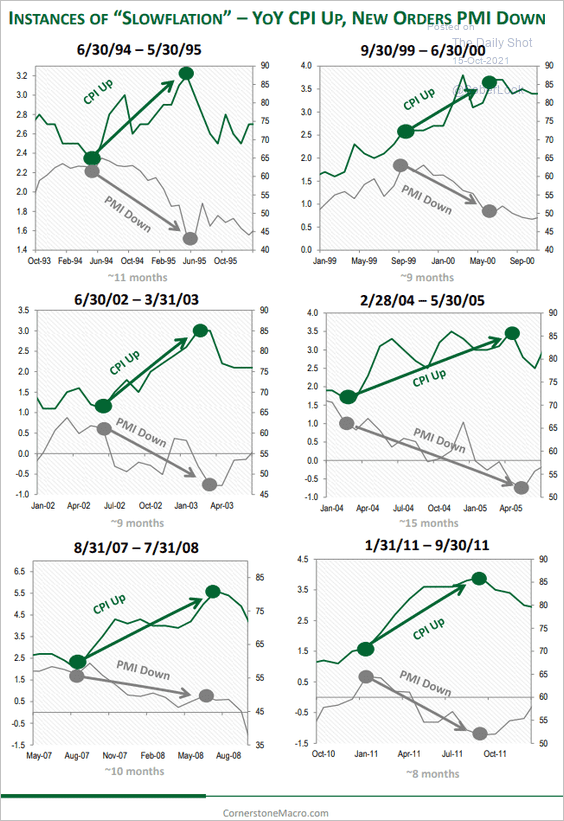 Source: Cornerstone Macro
——————–
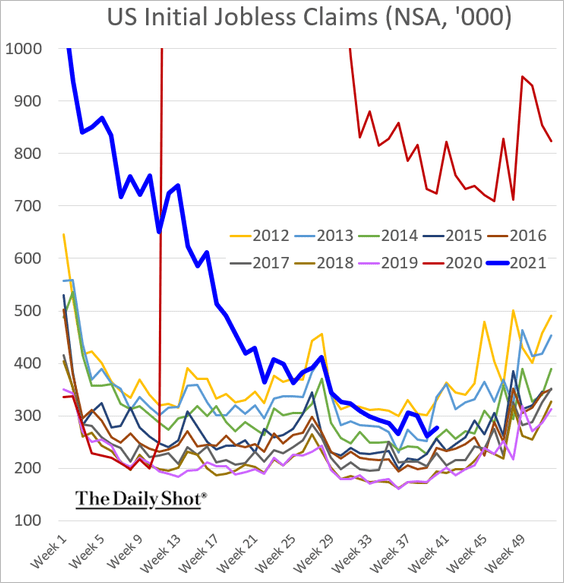
3. Jobless claims keep trending lower.
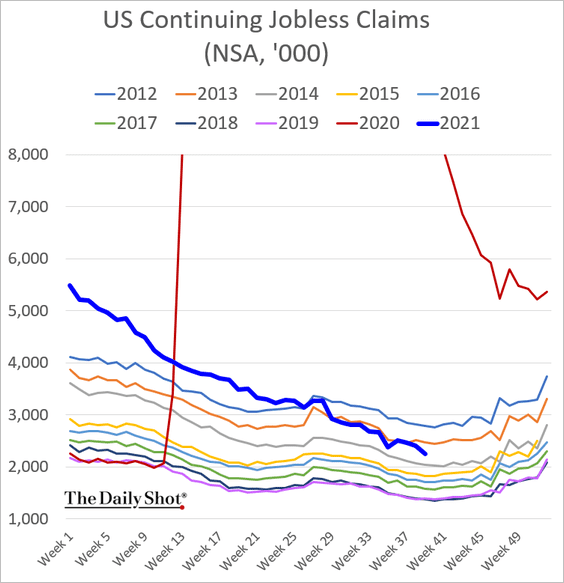
• Here are the continuing claims.
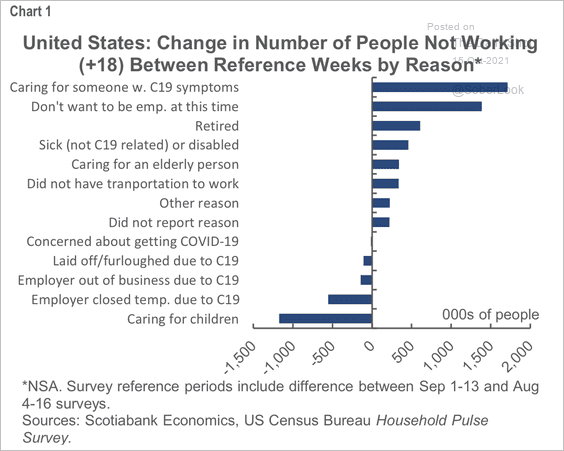
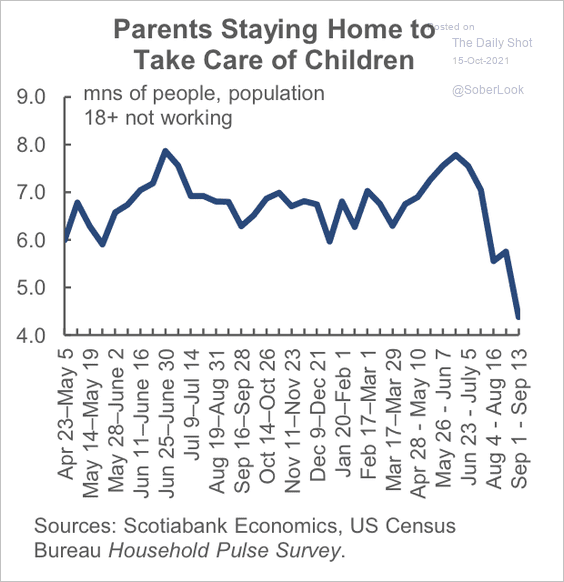
• Recently, more people haven’t been working because they were caring for others with COVID-19 symptoms.
 Source: Scotiabank Economics
• Childcare has become less of an issue for some working parents as in-person schooling returns.
 Source: Scotiabank Economics
——————–
4. Next, we have some updates on the housing market.
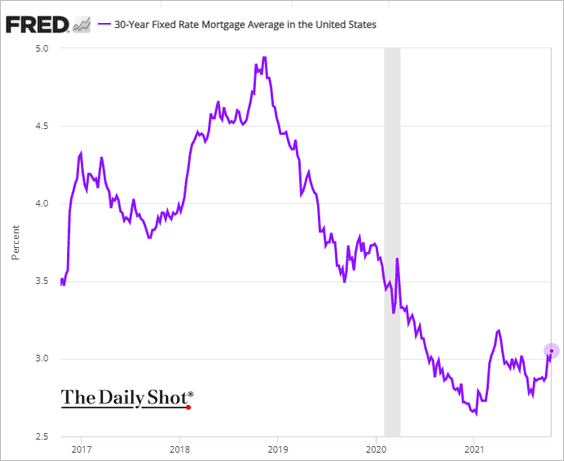
• Mortgage rates are back above 3%.
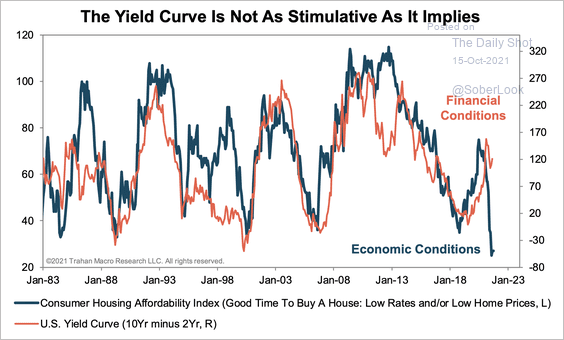
• The yield curve at its current level is a sign of very stimulative financial conditions, but the actual conditions in the housing market have been tightening.
 Source: Trahan Macro Research
• Loan applications to purchase a house strengthened further last week.
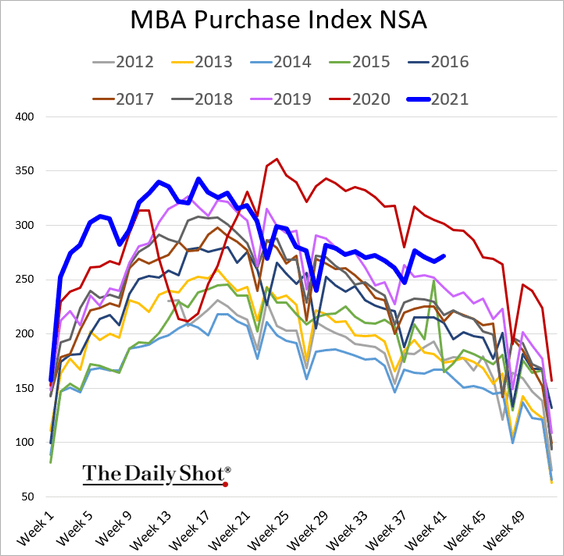
Rate locks are also well above 2019 levels.
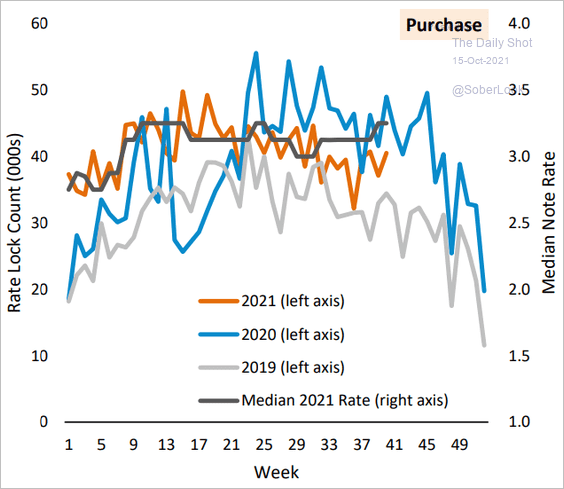 Source: AEI Center on Housing Markets and Finance
• Demand for housing should remain robust.
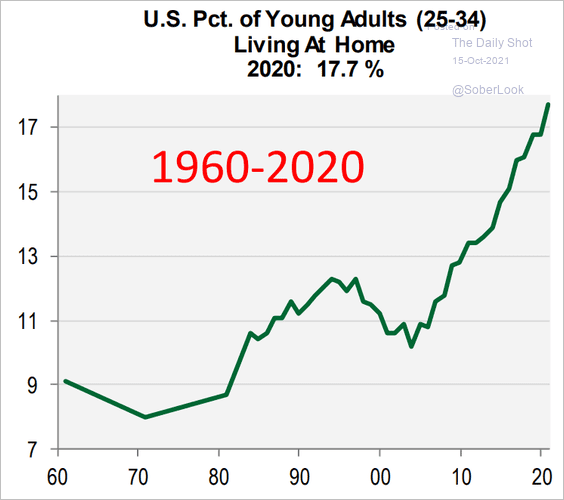 Source: Cornerstone Macro
• Asking prices continue to climb.
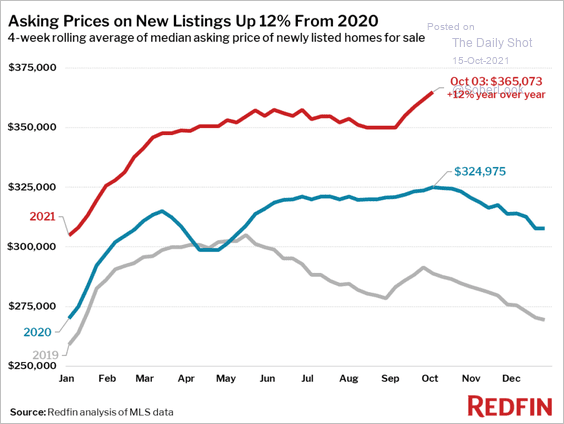 Source: Redfin
• Recent movers are facing higher rent prices, …
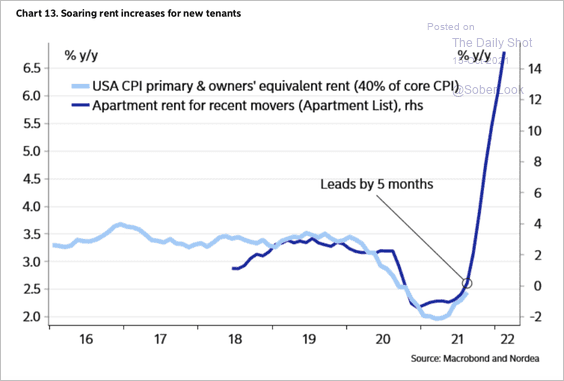 Source: Nordea Markets
… as the apartment rental market tightens.
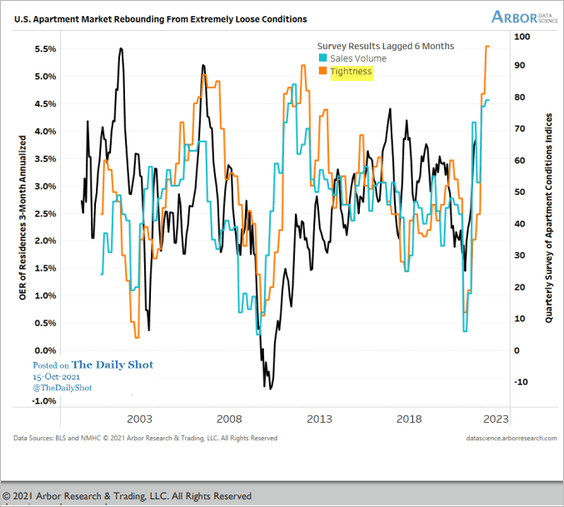 Source: Arbor Research & Trading
——————–
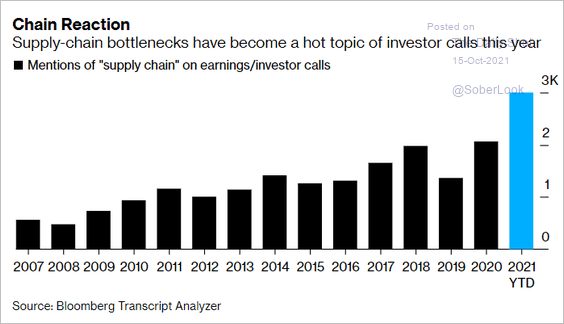
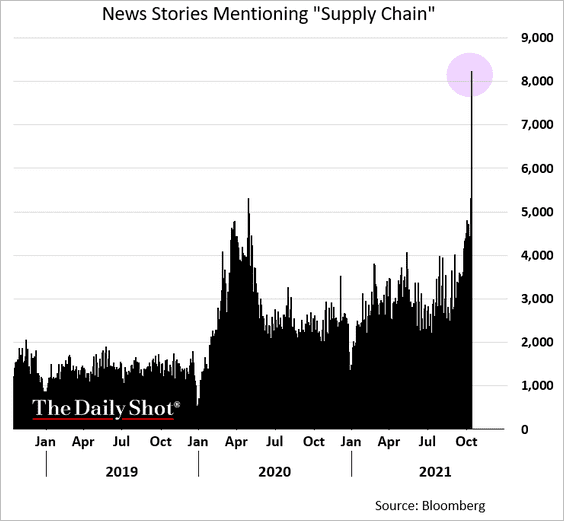
5. Concerns about supply chain bottlenecks are spreading.
• On earnings calls:
 Source: Bloomberg Read full article
• In the news:
——————–
7. The US economy is still at the early stages of the liquidity cycle. It typically takes a few years for monetary policy to tighten sufficiently enough to raise recession risks.
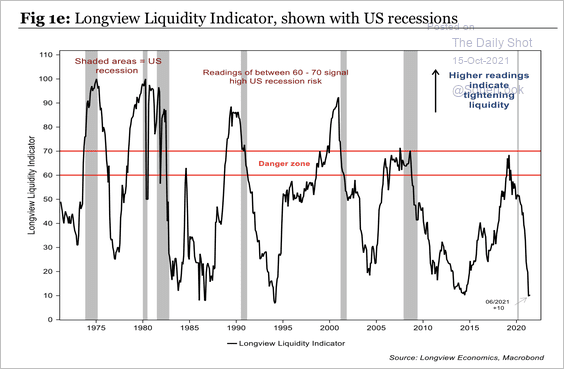 Source: Longview Economics
8. On average, the bottom 90% of American earners save 1% of their yearly income.
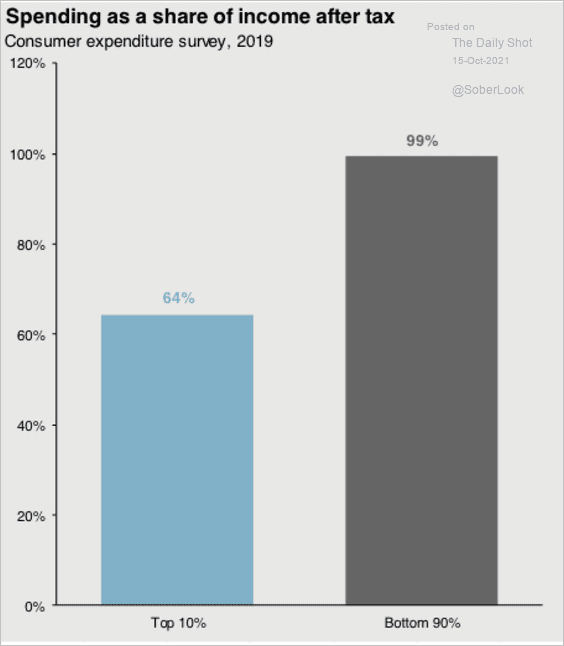 Source: J.P. Morgan Asset Management
Back to Index
The Eurozone
1. The recent rise in Eurozone inflation was largely due to the rebound in energy prices.
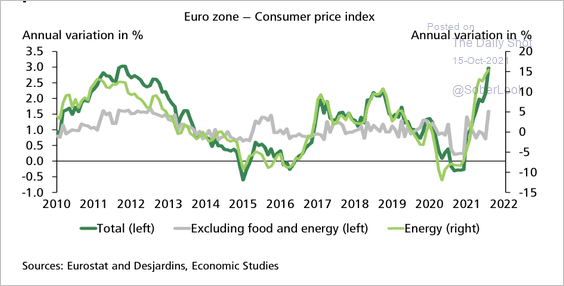 Source: Desjardins
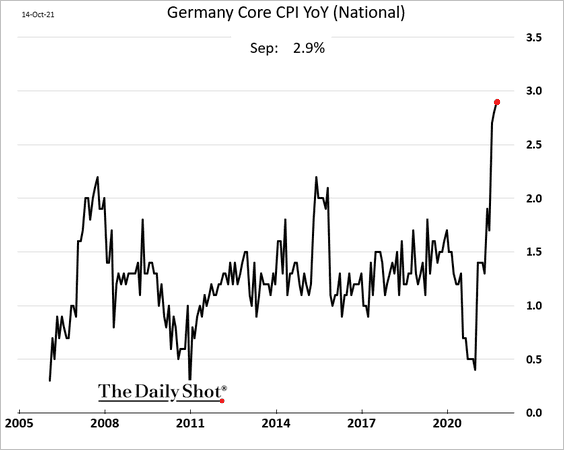
• Nonetheless, Germany’s core CPI (the national measure) is approaching 3%.
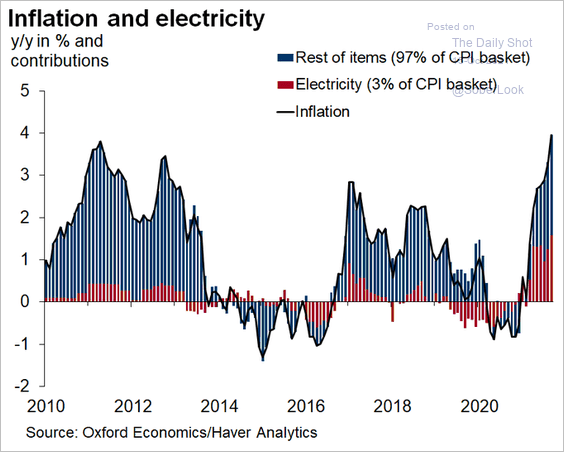
• Electricity prices boosted Spain’s CPI.
 Source: @atalaveraEcon
• The surge in natural gas prices will be feeding into the Eurozone’s inflation in the months ahead.
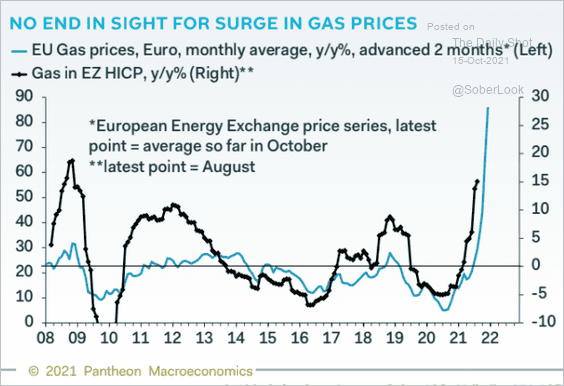 Source: Pantheon Macroeconomics
——————–
2. The Eurozone credit and fiscal impulse remains negative.
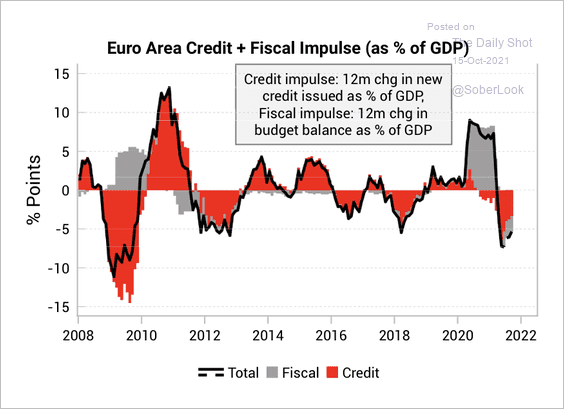 Source: Variant Perception
Back to Index
Europe
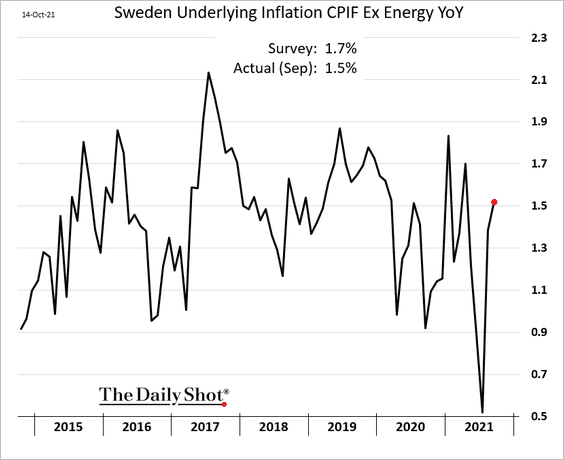
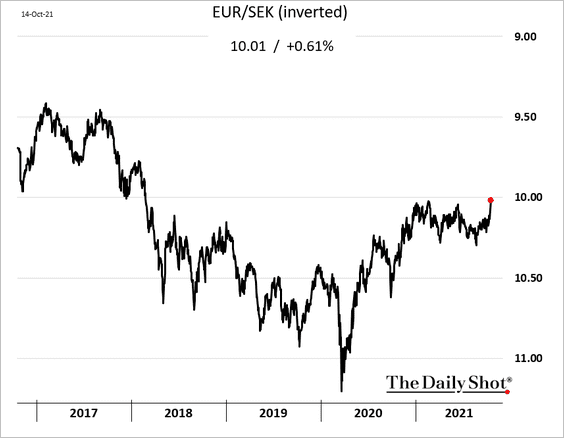
1. Sweden’s inflation rebounded from the lows, but the latest report was softer than expected.
The Swedish krona hit the highest level vs. the euro since early 2018.
——————–
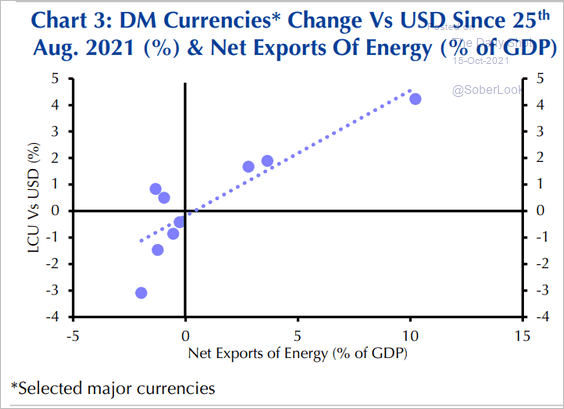
2. The Norwegian krone is climbing with energy prices.
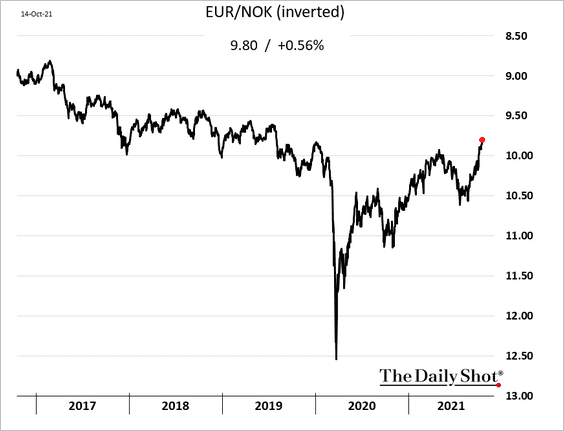
Currencies of energy exporters have outperformed recently.
 Source: Capital Economics
——————–
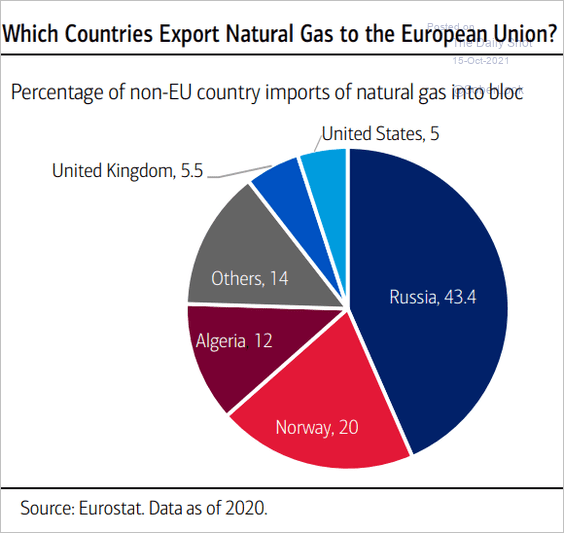
3. Who exports natural gas to the EU?
 Source: Merrill Lynch, BofA Global Research
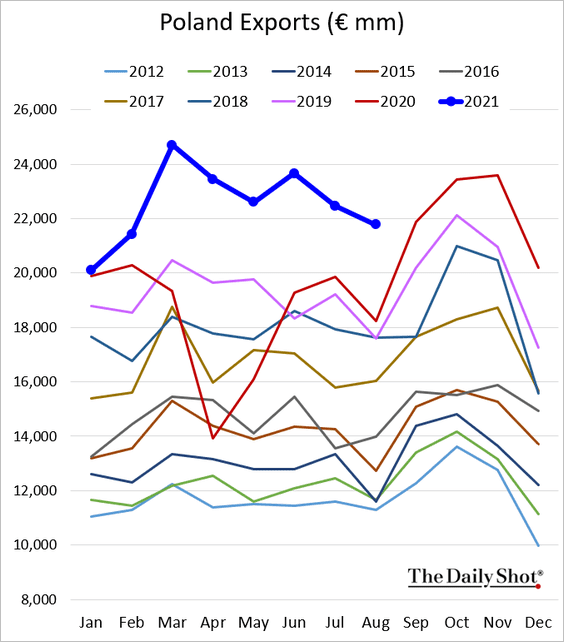
4. Poland’s exports remain robust for this time of the year.
5. Transition to electric buses in Europe is set to accelerate this decade, with the fleet going up eightfold, making up 67% of all new bus orders.
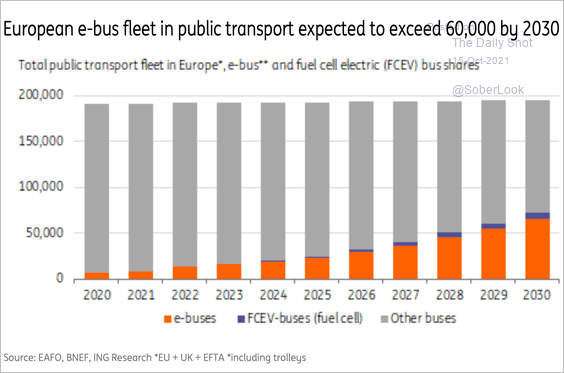 Source: ING
Back to Index
Asia – Pacific
1. Dollar-yen is testing resistance at 114.
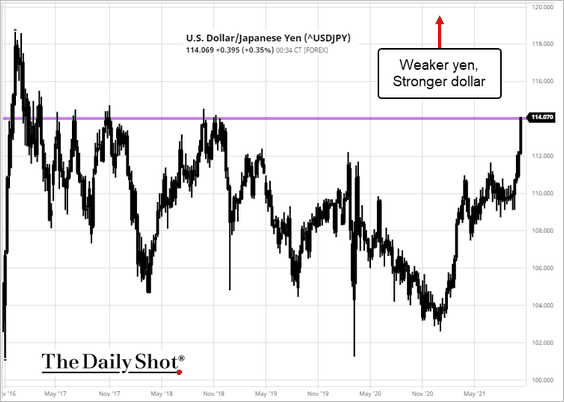 Source: barchart.com
2. Electricity prices surged in Singapore.
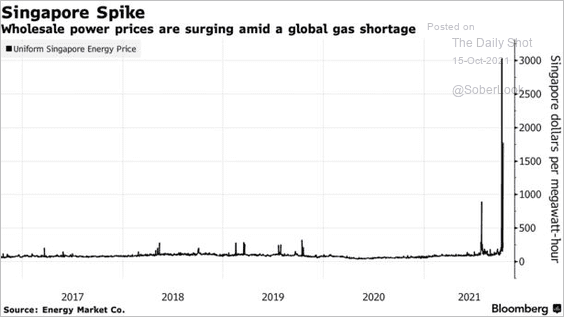 Source: Bloomberg Read full article
3. More rate hikes from South Korea’s central bank?
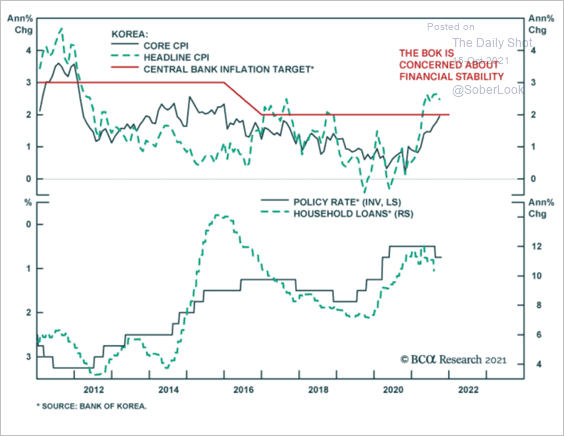 Source: BCA Research
4. Covid cases in Australia are surging.
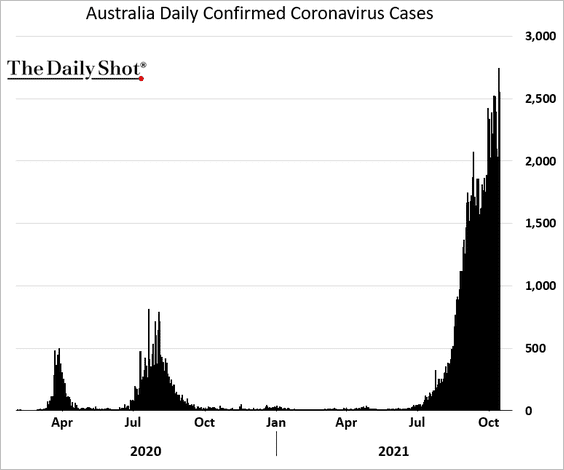
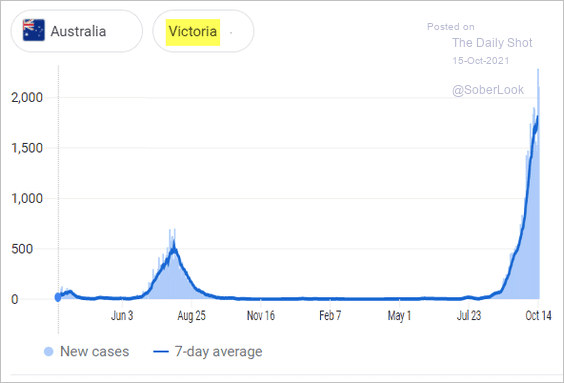 Source: Google
Back to Index
China
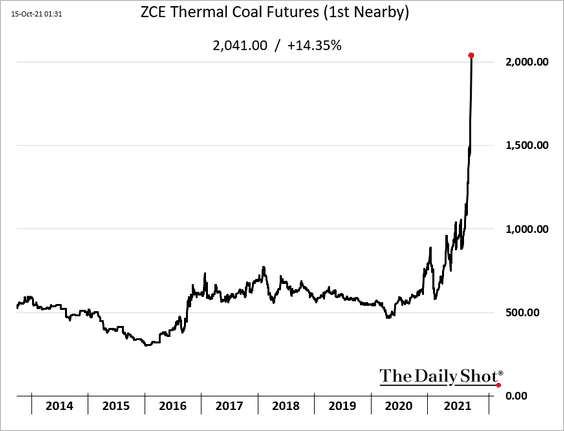
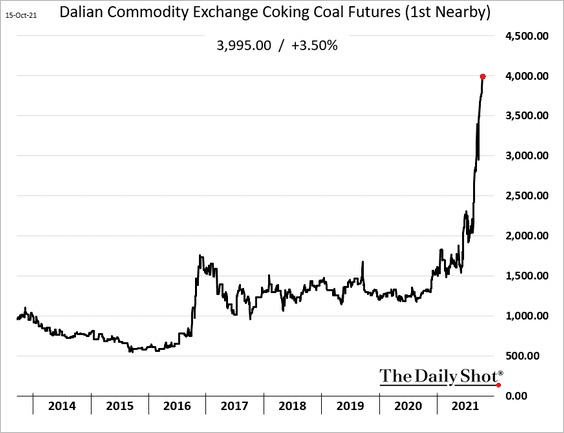
1. Thermal coal futures jumped sharply again today. The energy crisis continues to worsen.
• Metallurgical coal is surging as well.
• China’s energy imports are climbing.
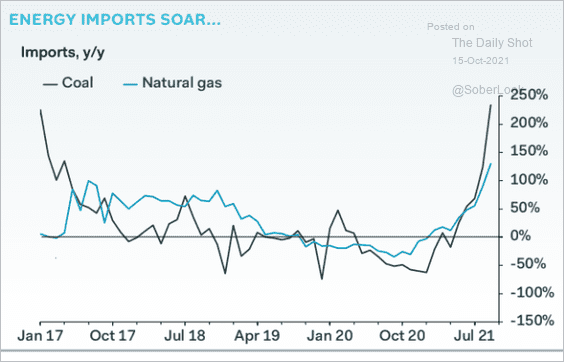 Source: Pantheon Macroeconomics
• China has substantially increased its use of hydroelectricity, wind, and solar energy, but more will be needed.
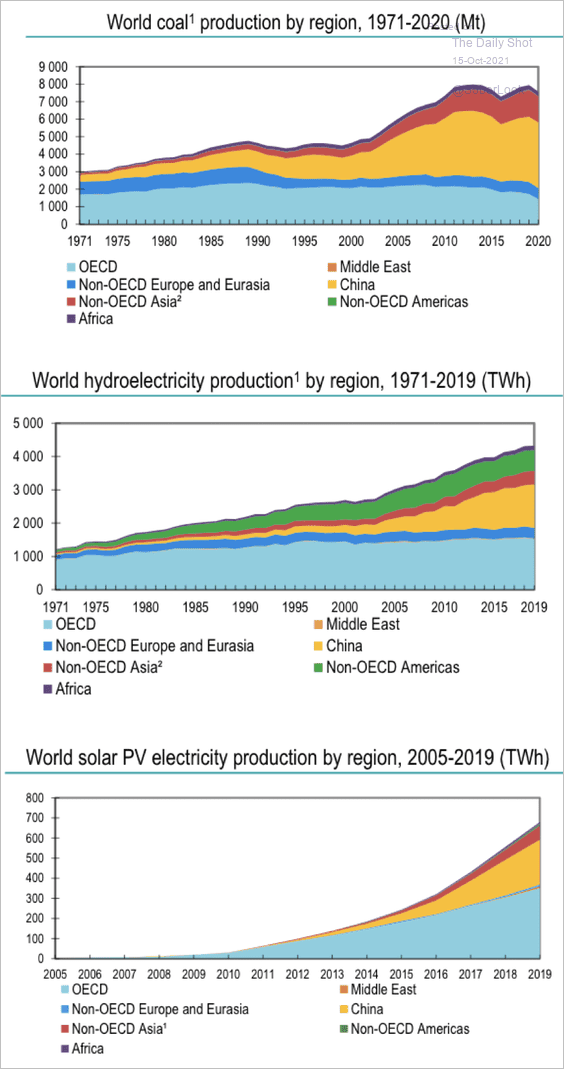 Source: IEA
——————–
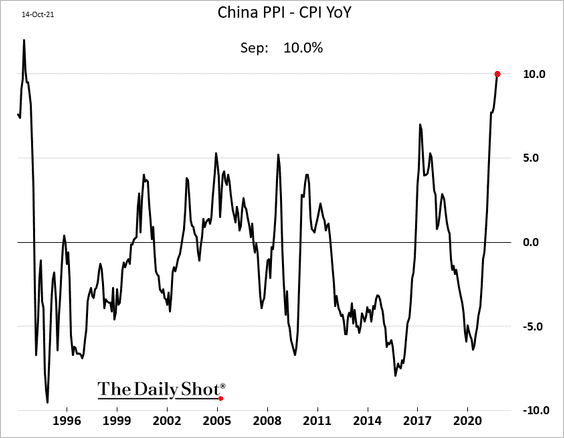
2. The spread between the PPI and the CPI hit the highest level since the 1990s.
4. Government bond yields have been higher than in other economies.
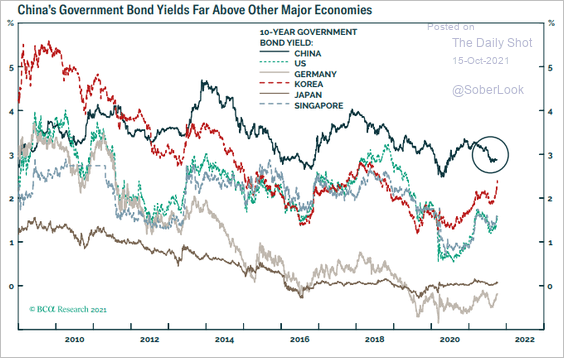 Source: BCA Research
5. Domestic travel has slowed.
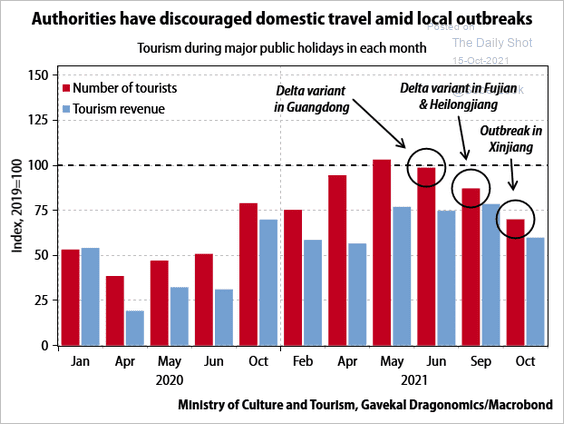 Source: Gavekal Research
6. Retail sales have been soft across most sectors.
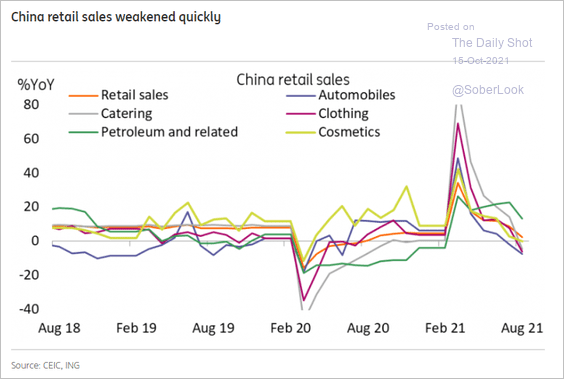 Source: ING
7. This map shows China’s progress in cutting emissions.
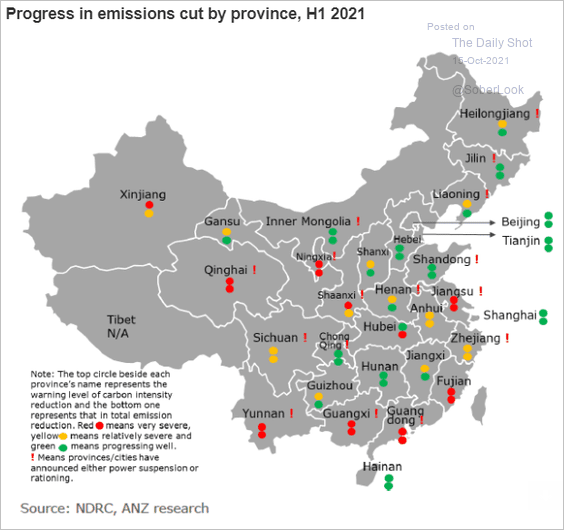 Source: ANZ Research
Back to Index
Emerging Markets
1. India’s exports remain robust.
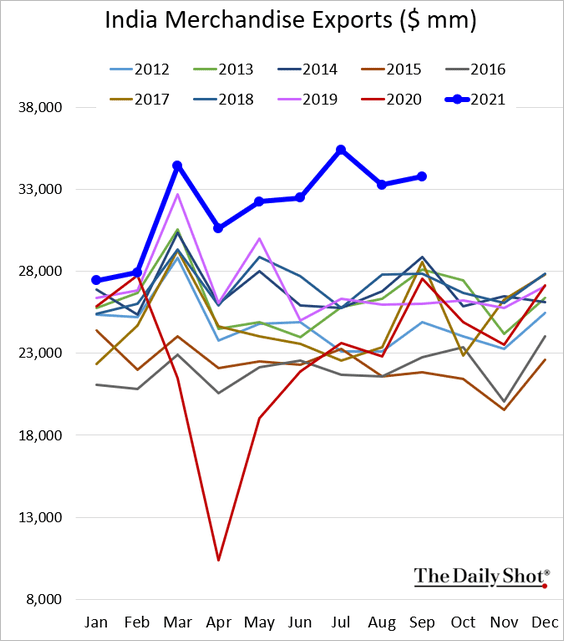
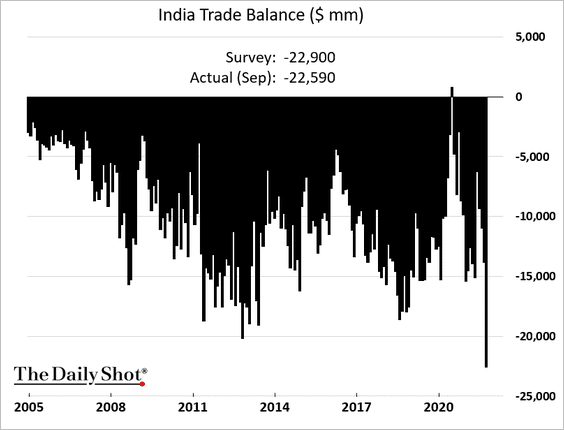
But imports surged last month, …
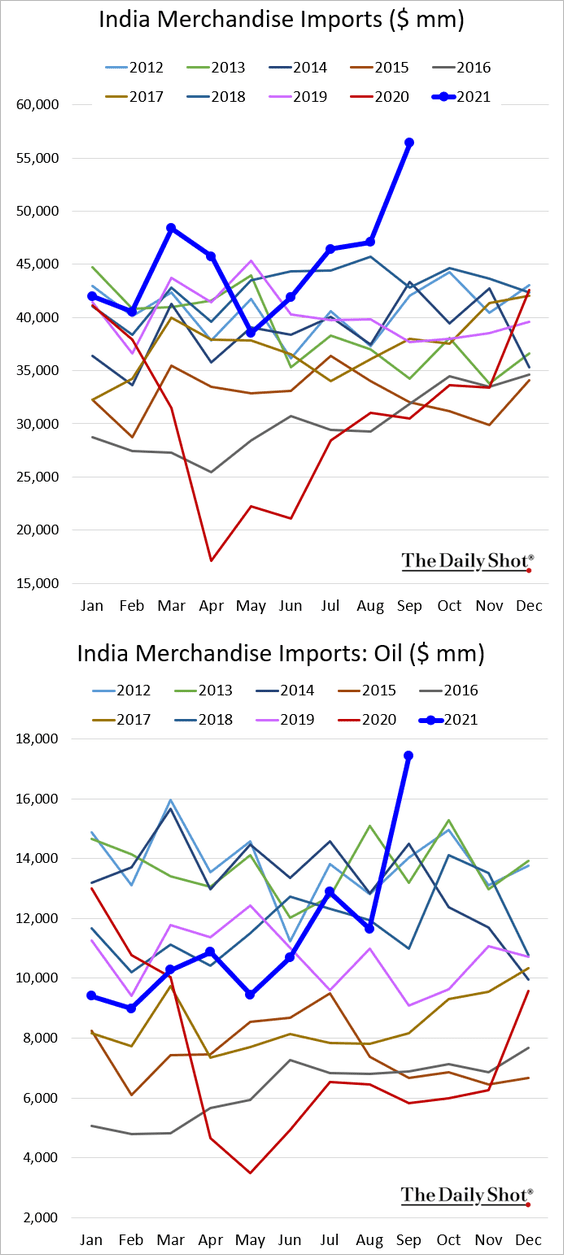
 Source: S&P Global Market Intelligence Read full article
… resulting in a record trade deficit.
——————–
2. Brazil’s service-sector activity continues to improve.

3. EM hard currency bonds have more room to reprice lower in a strong dollar environment, according to Pavilion Global Markets.
 Source: Pavilion Global Markets
The yield on USD debt is the highest since mid-2020.
 Source: @lisaabramowicz1, @elerianm, @bsurveillance
——————–
4. EM F/X reserves remain elevated.
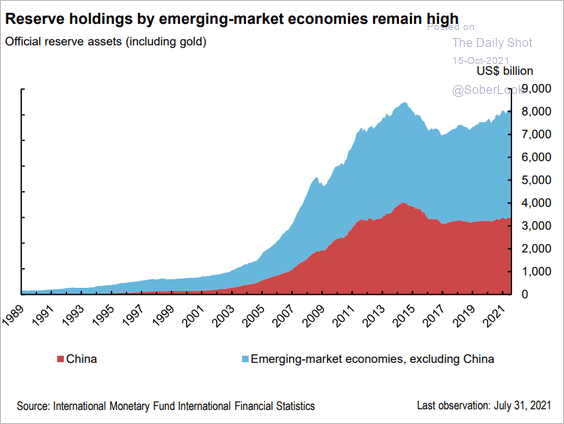 Source: BIS Read full article
Back to Index
Cryptocurrency
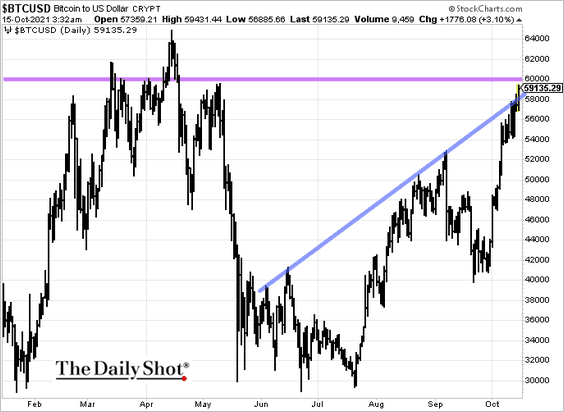
1. Bitcoin is about to hit $60k again.
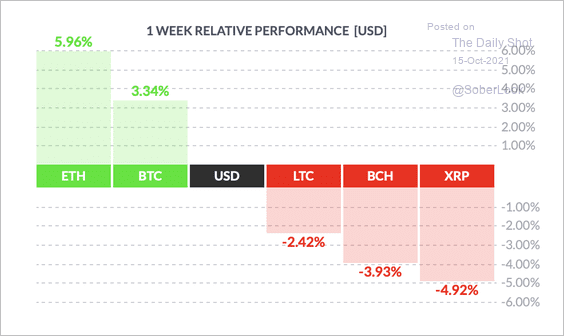
2. Ether outperformed other large cryptocurrencies over the past week.
 Source: FinViz Read full article
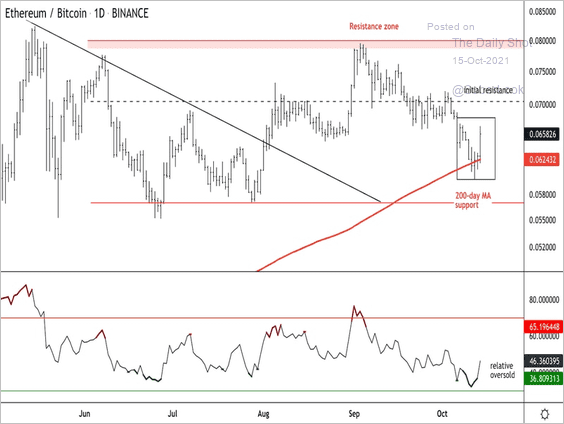
3. ETH/BTC held support at the 200-day moving average.
 Source: Dantes Outlook
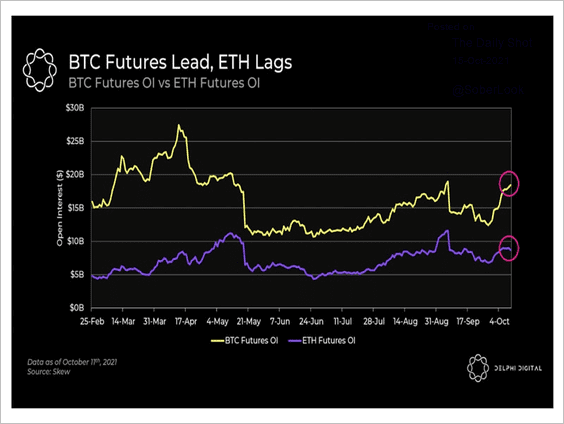
4. Ether futures open interest has lagged the rise in bitcoin’s open interest over the past few weeks.
 Source: Delphi Digital Read full article
5. Bitcoin futures-spot differential remains elevated as traders bet on the SEC approving the first futures-based bitcoin ETF.
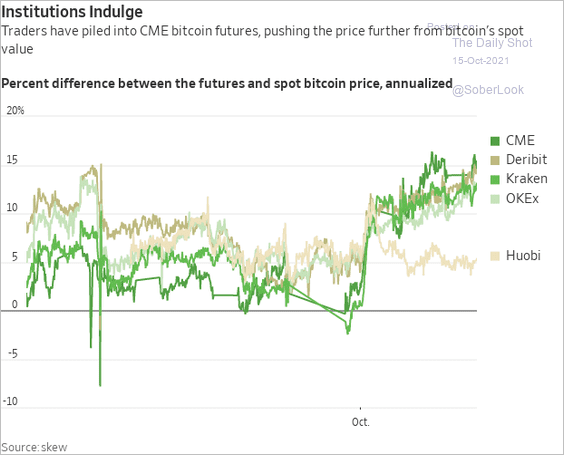 Source: @WSJ Read full article
6. Bitcoin’s exchange outflows moderated over the past month, suggesting that traders are gradually moving BTC back on exchanges to trade rather than hold in wallets.
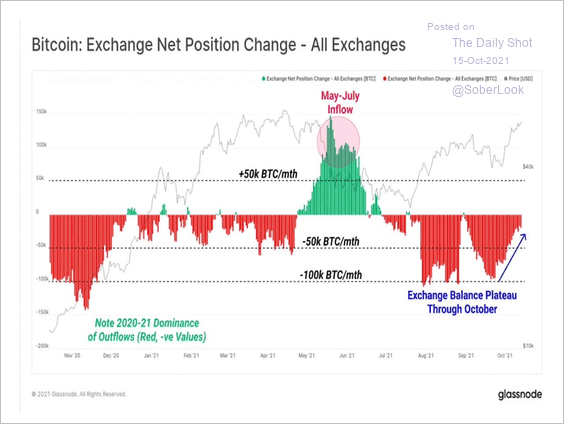 Source: @glassnode
7. Next, we have some updates on stablecoins.
• “Stable” coins had material price volatility in early 2020, albeit less volatile than most cryptocurrencies. Stablecoins are used by crypto investors to hold realized profits, for conversion between cryptos, or as a means of payment.
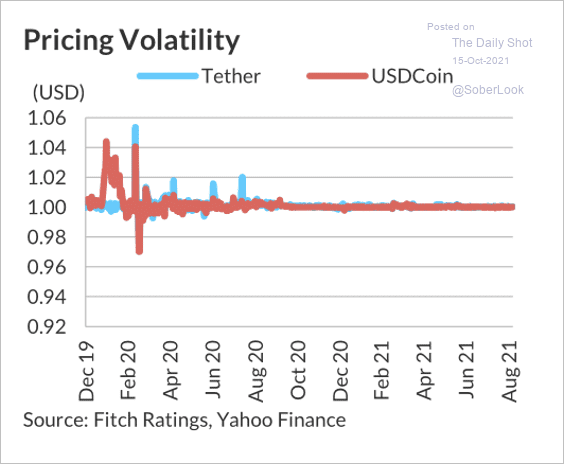 Source: Fitch Ratings
• USDCoin increased its cash/cash equivalent assets in August.
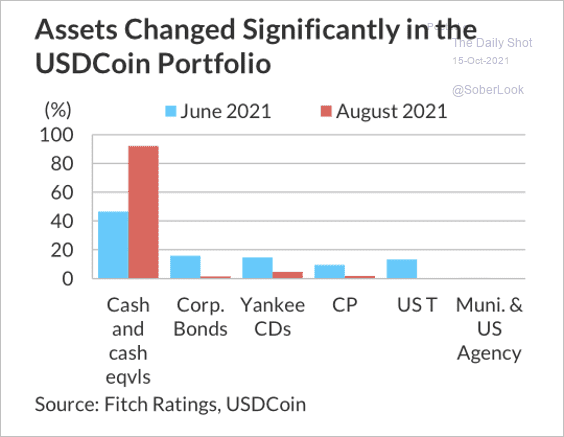 Source: Fitch Ratings
• Here is a breakdown of the assets backing Tether’s stablecoin (supposedly).
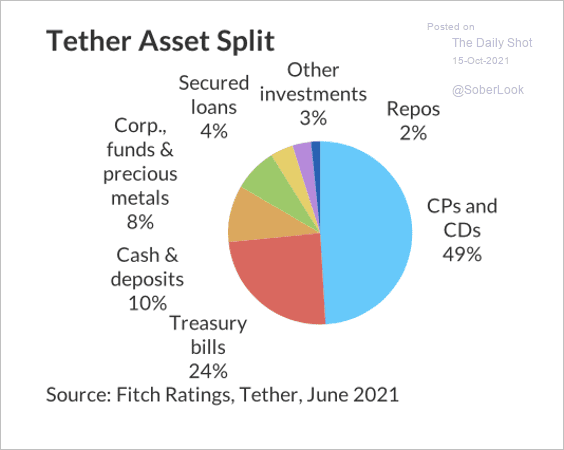 Source: Fitch Ratings
• The chart below shows market capitalization data.
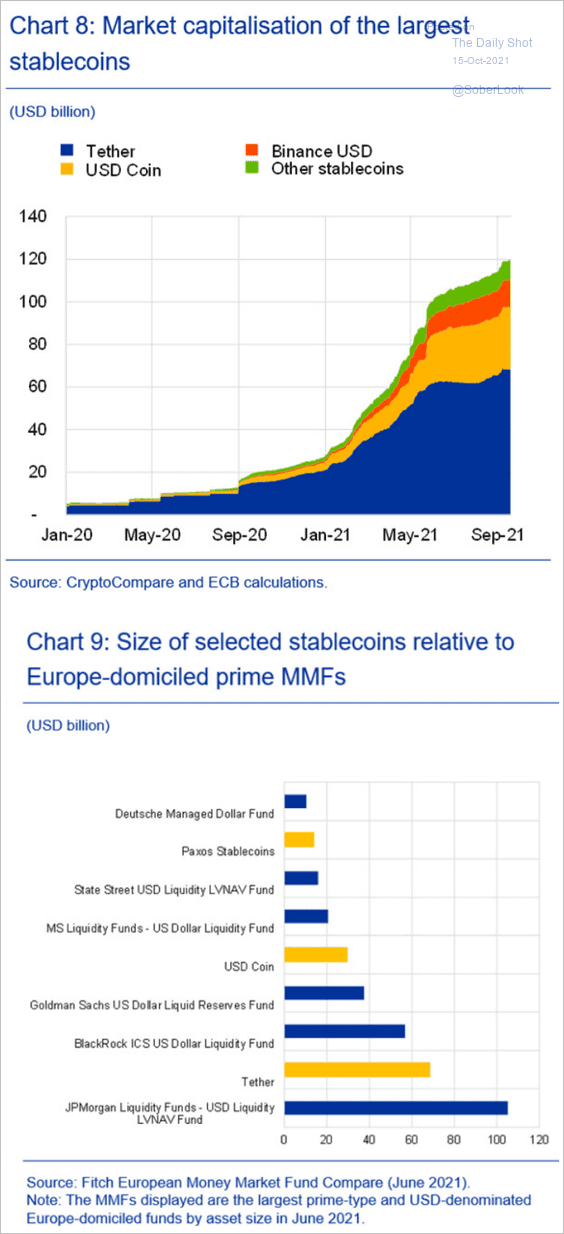 Source: BIS Read full article
Back to Index
Commodities
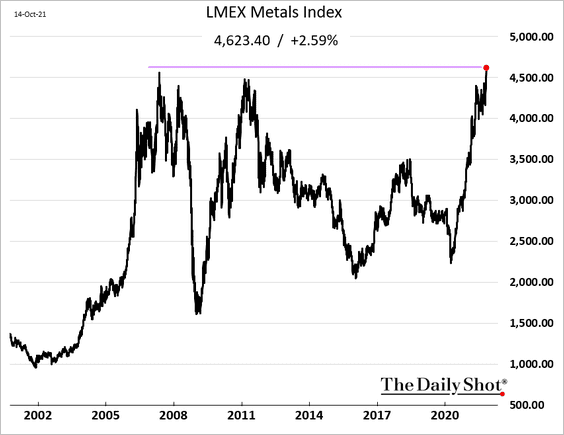
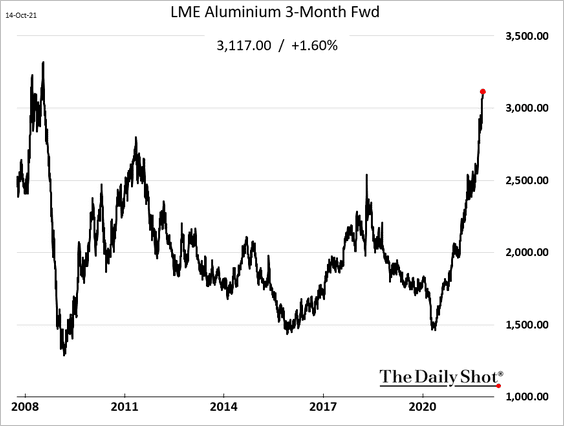
1. Industrial metals are surging.
• LMEX hit a record high.
• Here is aluminum …
• … and zinc.
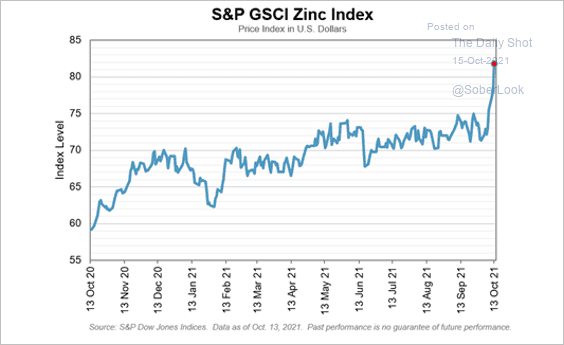 Source: S&P Global Market Intelligence
 Source: Mining.com Read full article
• Copper is in steep backwardation as inventories dwindle.
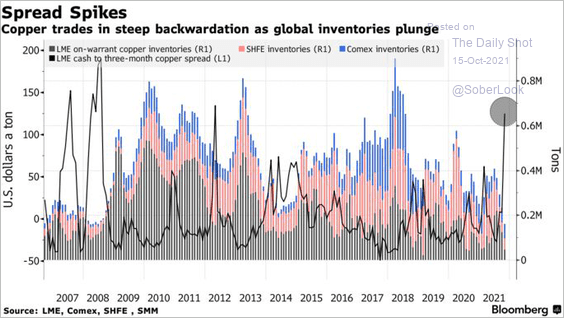 Source: @markets Read full article
——————–
2. Bloomberg’s broad commodity index hit a record high.
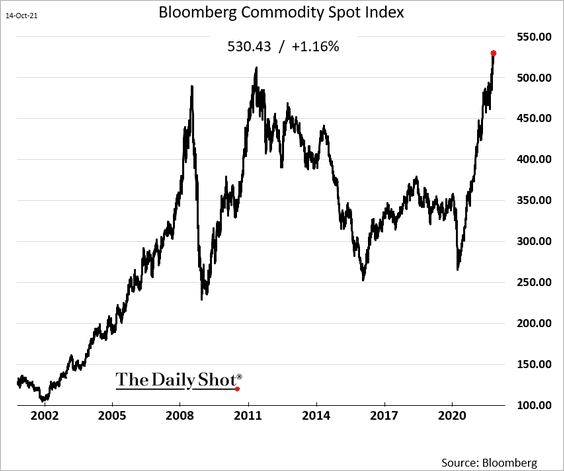
The current rebound has been the strongest on record.
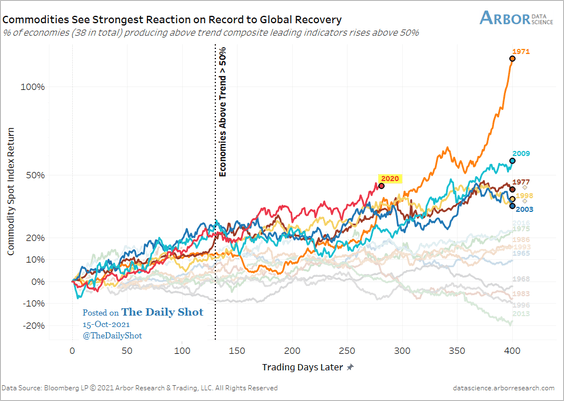 Source: Arbor Research & Trading
——————–
3. More than 70% of gold mining stocks are now trading above their 50-day moving averages – the most since June.
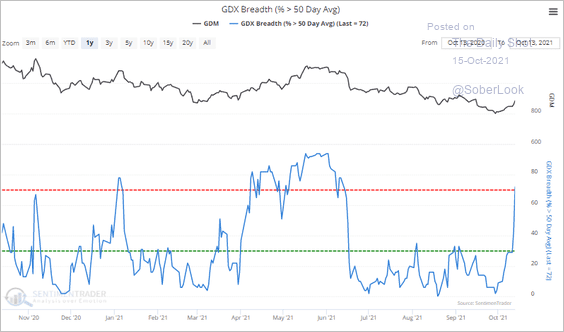 Source: SentimenTrader
Back to Index
Energy
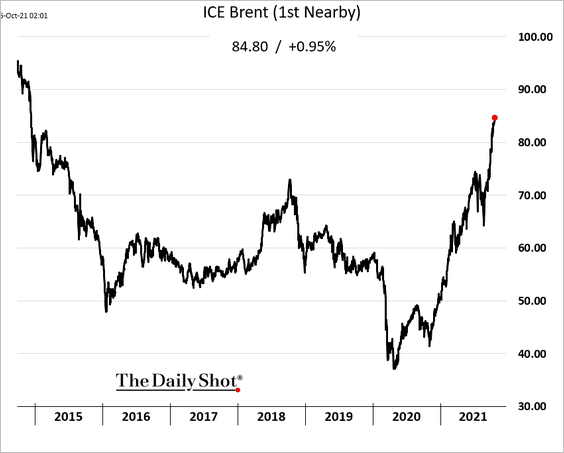
1. Brent crude is trading near $85/bbl.
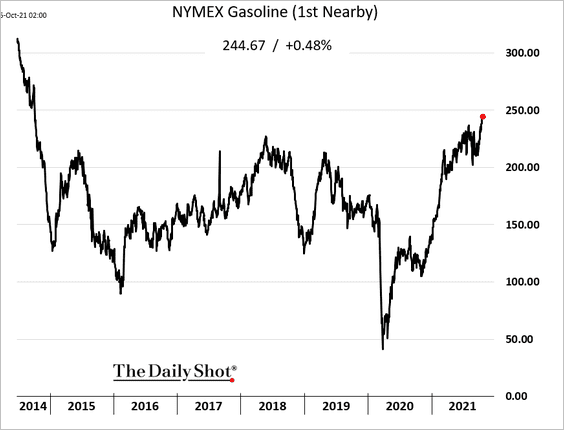
• US gasoline futures are approaching $2.50/gal for the first time since 2014.
• The 3-2-1 crack spread remains elevated.
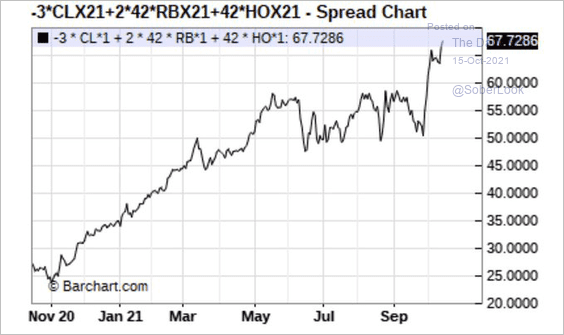 Source: @HFI_Research
——————–
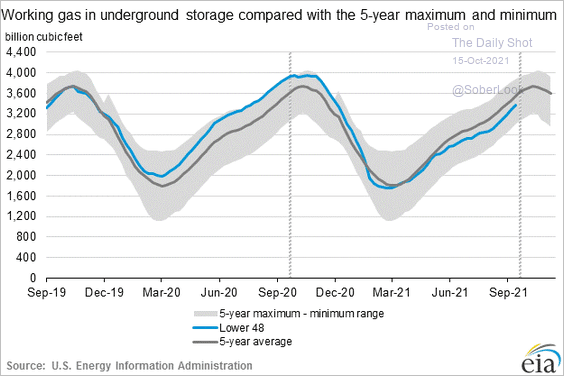
2. US natural gas in storage is below the 5-year average, but there is no indication of shortages (unlike in Europe or Asia).
3. Countries vary in their exposure to natural gas mix in electricity generation. Turkey is most exposed.
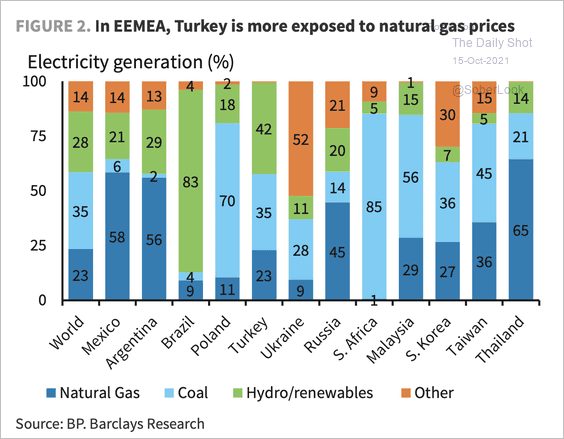 Source: Barclays Research
4. China’s firms are bypassing US solar panel tariffs via Malaysia, Thailand, and Vietnam.
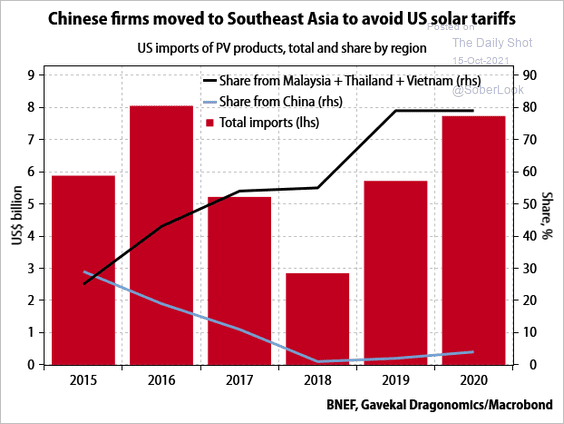 Source: Gavekal Research
Back to Index
Equities
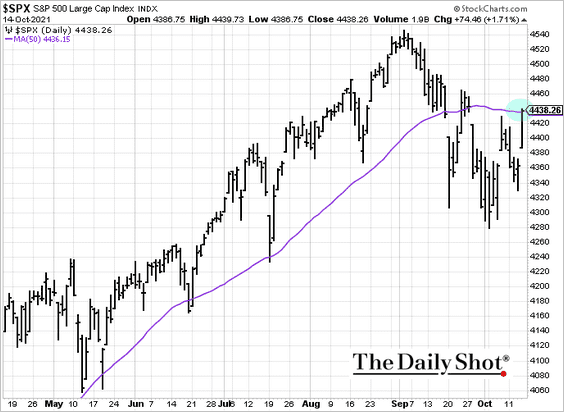
1. US stocks climbed sharply on Thursday, …

… with the S&P 500 hitting resistance at the 50-day moving average.
——————–
2. The S&P 500 has performed well during recent reporting periods.
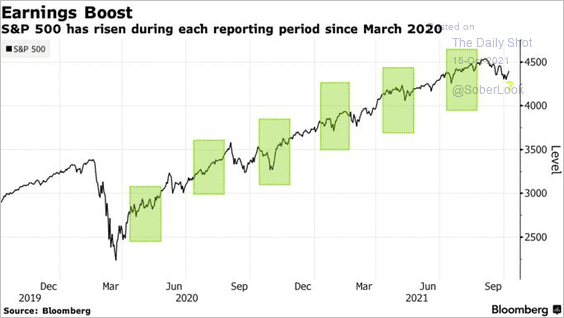 Source: @markets Read full article
3. The valuation spread between US and European stocks continues to widen.
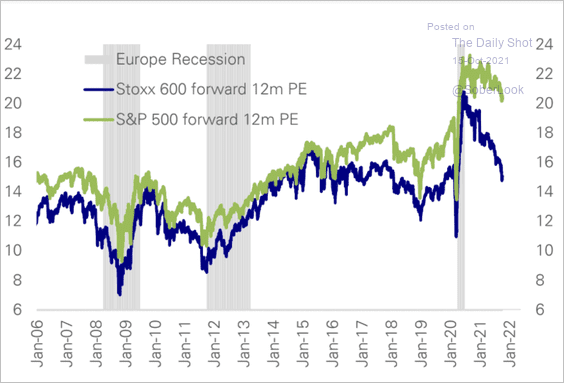 Source: Deutsche Bank Research
4. While the average volatility in Q4 is not substantially higher than other periods, it is vulnerable to more significant shocks (outliers).
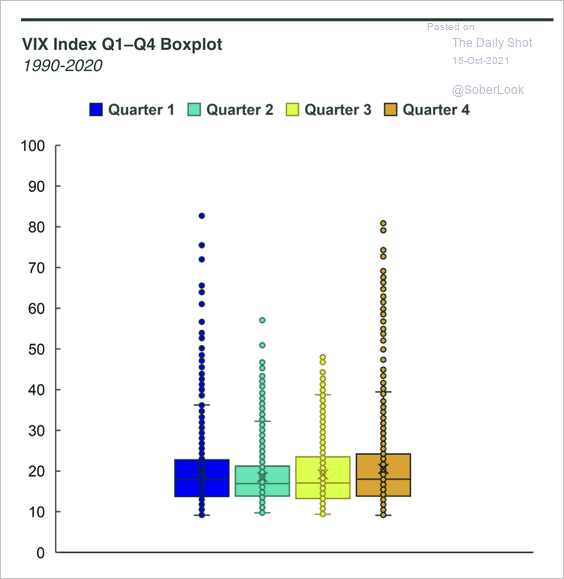 Source: SPDR Americas Research, @mattbartolini
5. What will drive market returns over the next 30 days? (based on Markit’s investment manager survey)
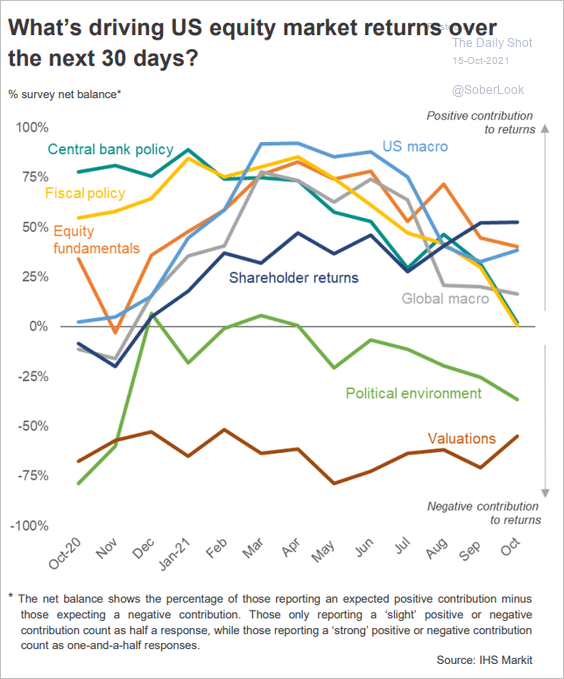 Source: IHS Markit
6. Boeing continues to struggle.
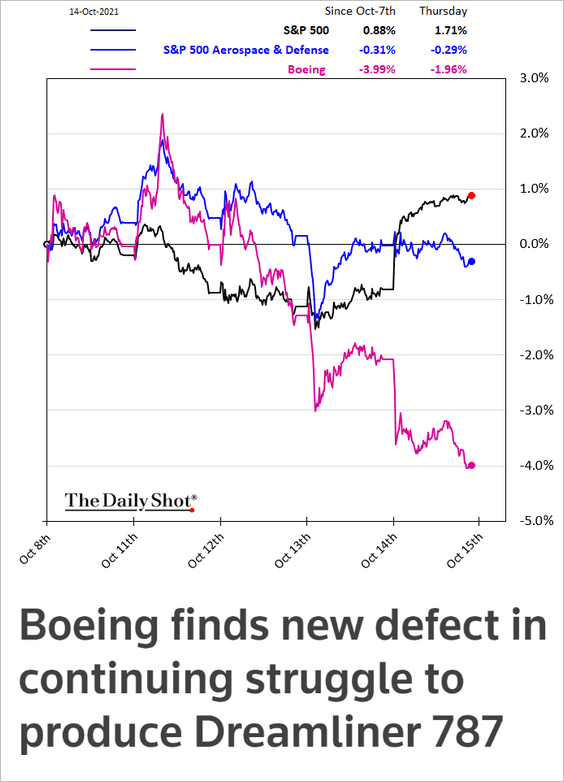 Source: Reuters Read full article
Back to Index
Alternatives
1. Digital payment firms have been raising a great deal of VC capital.
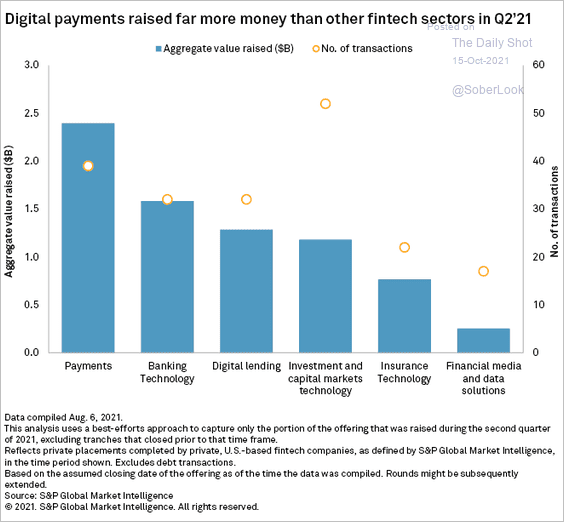 Source: S&P Global Market Intelligence
2. VC valuations are surging.
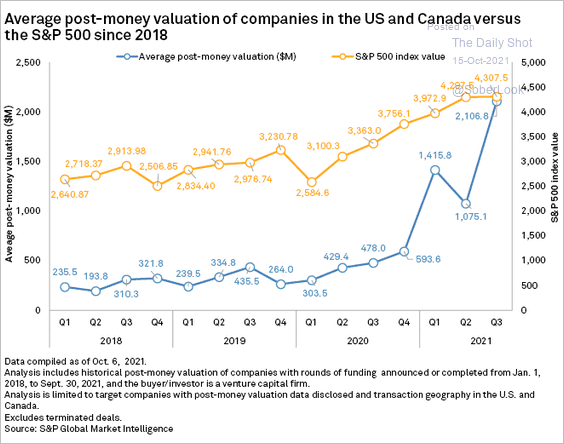 Source: S&P Global Market Intelligence
3. This chart shows M&A deals with PE firms as sellers.
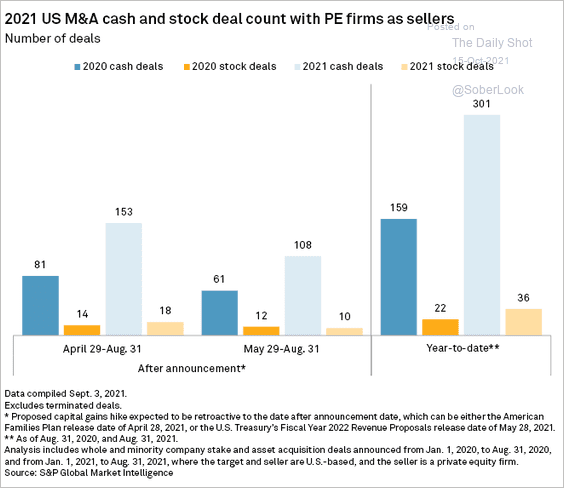 Source: S&P Global Market Intelligence
4. US leveraged buyout (LBO) deal volume has increased over the years, …
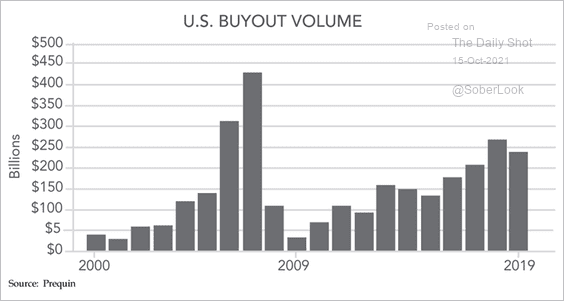 Source: Jeffrey Hooke
… although LBO investors have received less cash than money invested (TVPI).
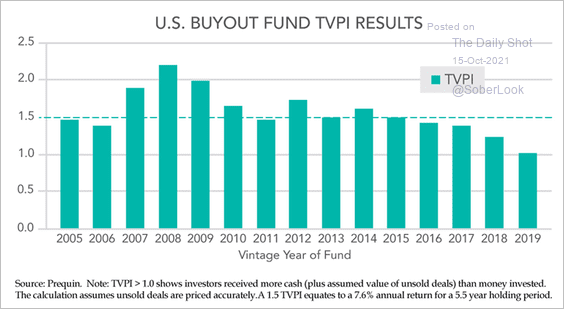 Source: Jeffrey Hooke
5. Here is a look at the annualized rate of return between LBO funds and the S&P 500.
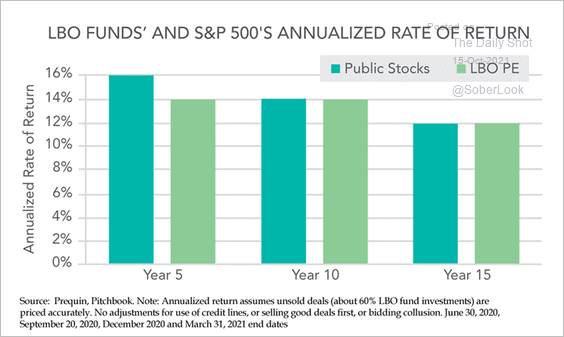 Source: Jeffrey Hooke
High leverage causes LBO equity to underperform sharply in the event of a market crash.
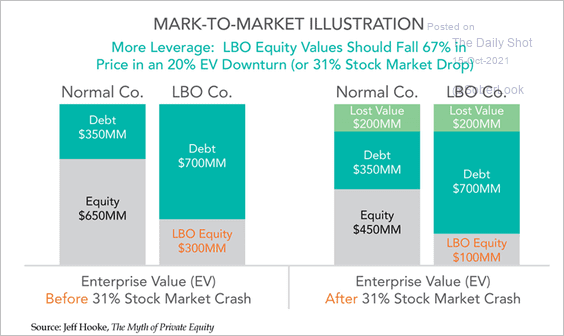 Source: Jeffrey Hooke
——————–
6. KKR’s public assets under management have surged.
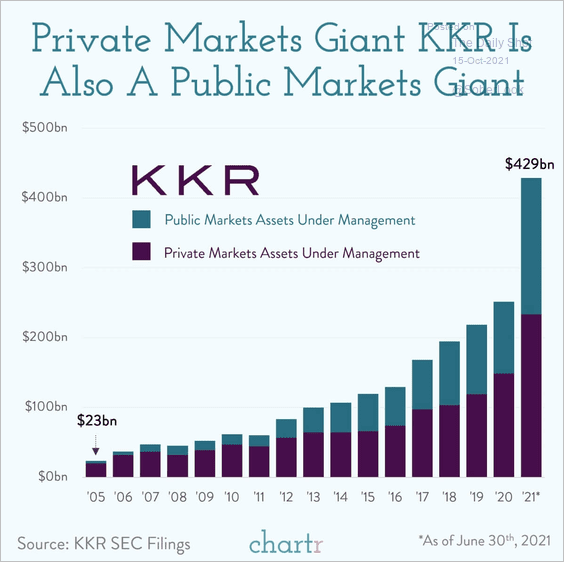 Source: @chartrdaily
7. Hedge funds have been making more investments in private companies.
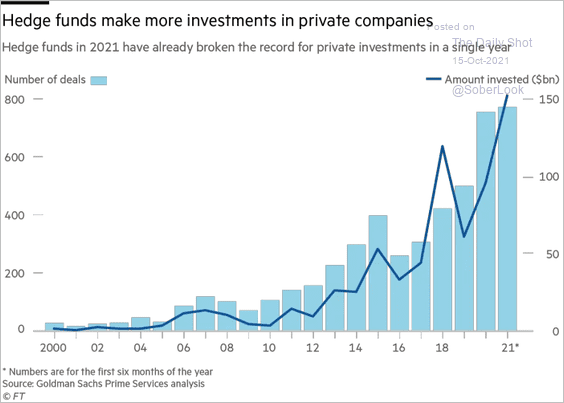 Source: @financialtimes Read full article
Back to Index
Credit
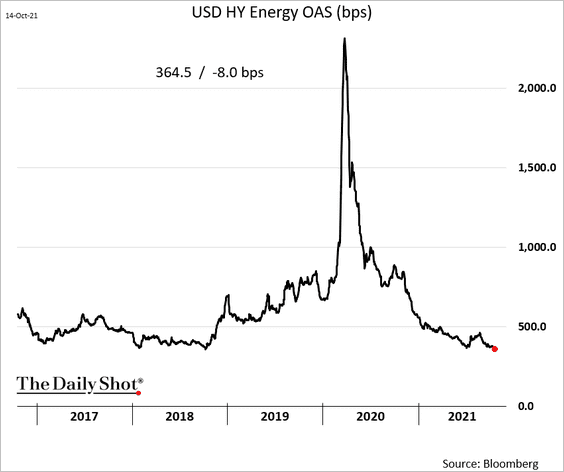
1. Energy-sector high-yield bond spreads have tightened to the lowest level since 2018.
2. There are fewer AAA and AA-rated companies.
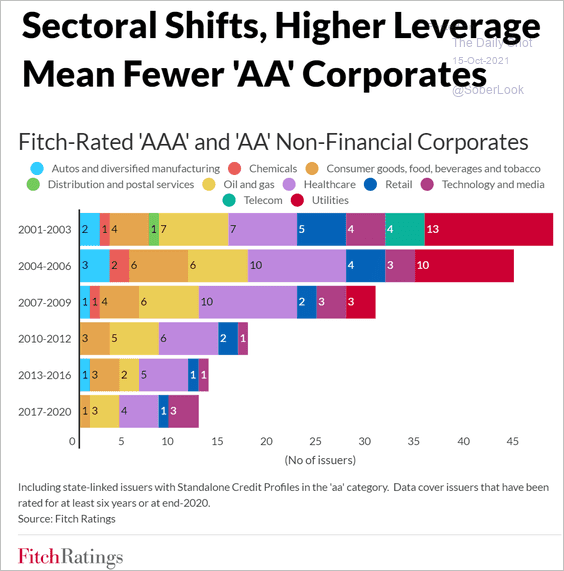 Source: Fitch Ratings
3. Investor demand for leveraged loans has been robust this year.
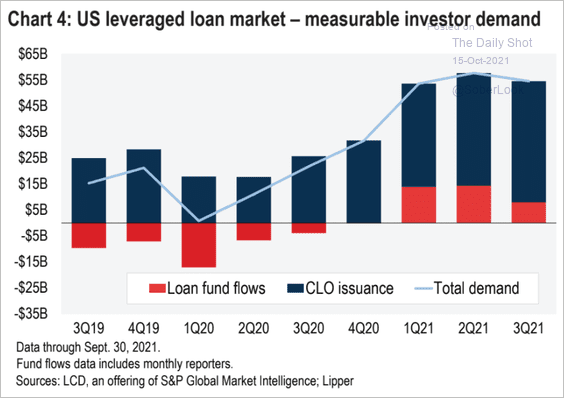 Source: S&P Global Market Intelligence
4. Leveraged loans backing M&A transactions surged in 2021.
 Source: S&P Global Market Intelligence
Back to Index
Global Developments
1. EM central banks have been more aggressive hiking rates than DM.
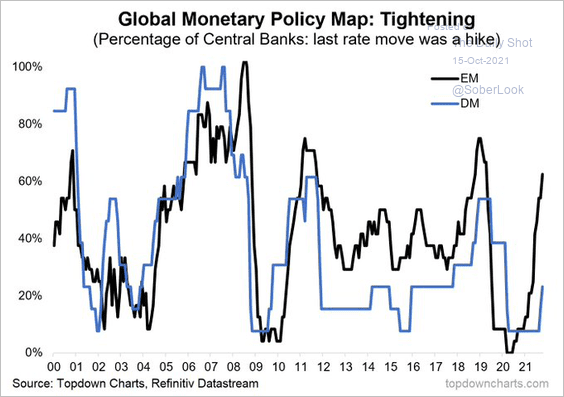 Source: @Callum_Thomas
2. Implied volatility rose for the S&P 500 and EM equities last month, while other asset classes experienced relatively lower volatility over the same period.
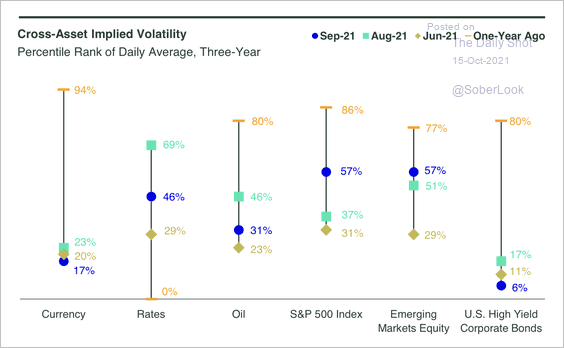 Source: SPDR Americas Research, @mattbartolini
3. Here are the largest external creditors and debtors.
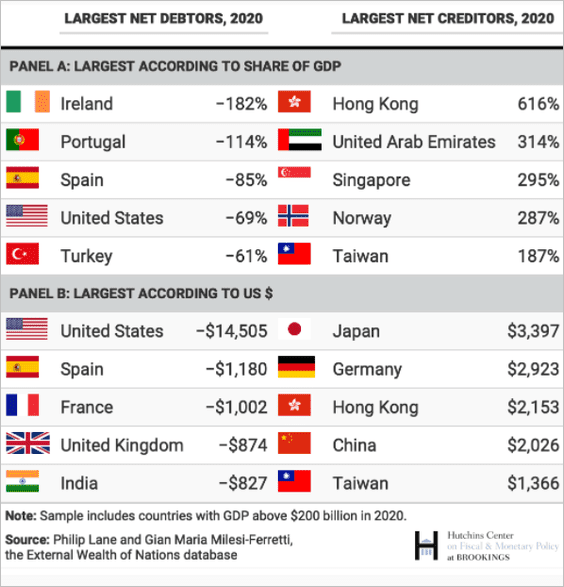 Source: Brookings Read full article
4. The next chart shows the time to recovery vs. the pandemic-related drop in output. The second panel shows the impact of fiscal support.
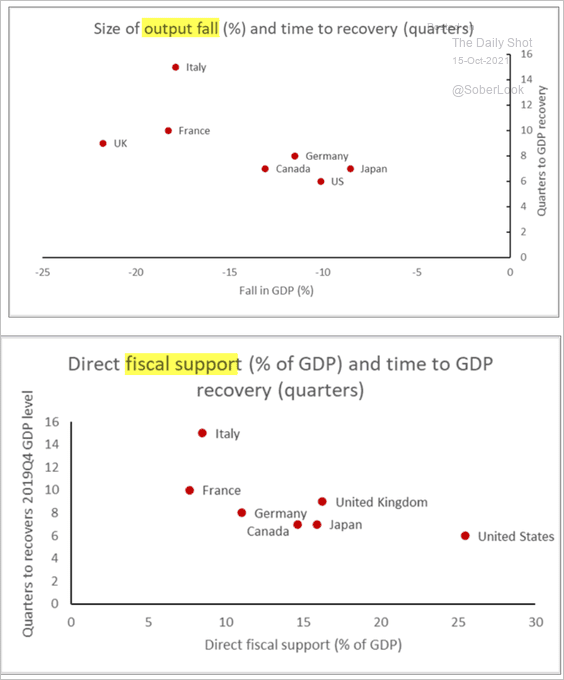 Source: National Institute of Economic and Social Research
5. Global trade remains below the trend established before the US-China trade war.
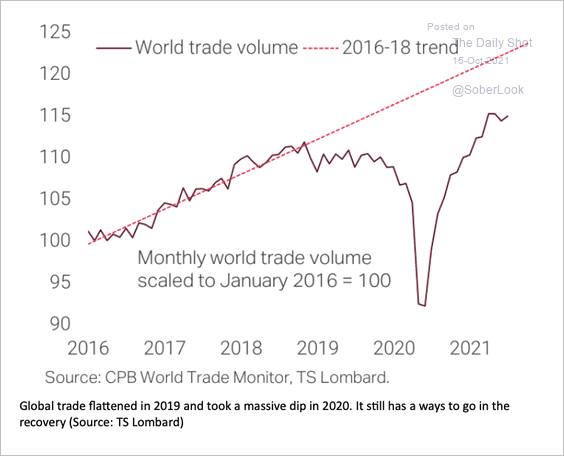 Source: TS Lombard
Trade peaked in March and has been moderating since, with container and air freight coincident indicators showing dramatically slower growth rates. This is down to restrictions and supply chain issues as well as artificially high Chinese exports during the pandemic rolling off.
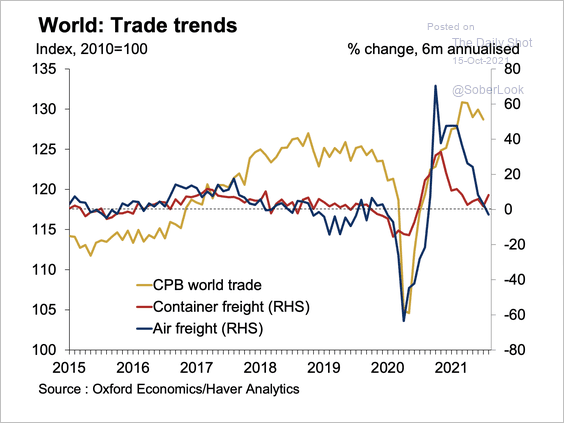 Source: Oxford Economics
——————–
Food for Thought
1. Job happiness by age:
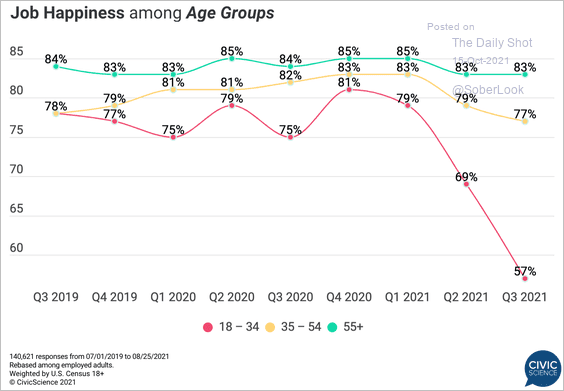 Source: @CivicScience
2. Access to paid sick days by wage group:
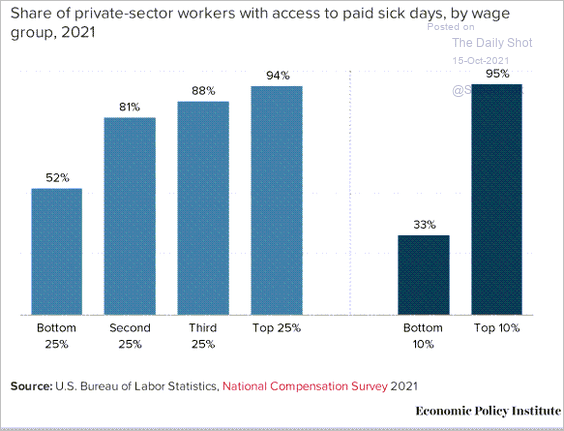 Source: EPI
3. US labor force participation recovery by age group:
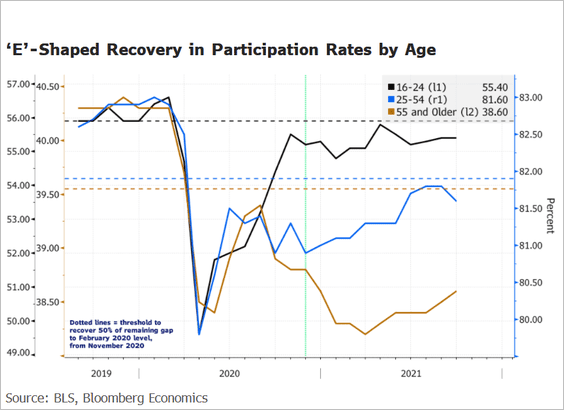 Source: @TheTerminal, Bloomberg Finance L.P. Read full article
4. Support for gunshot detection technology:
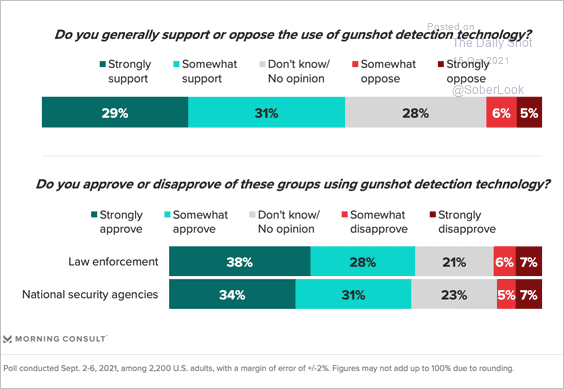 Source: Morning Consult Read full article
5. Facebook as a news source:
 Source: Statista
6. Share of AI patents:
 Source: OECD Read full article
7. US views on tax increases:
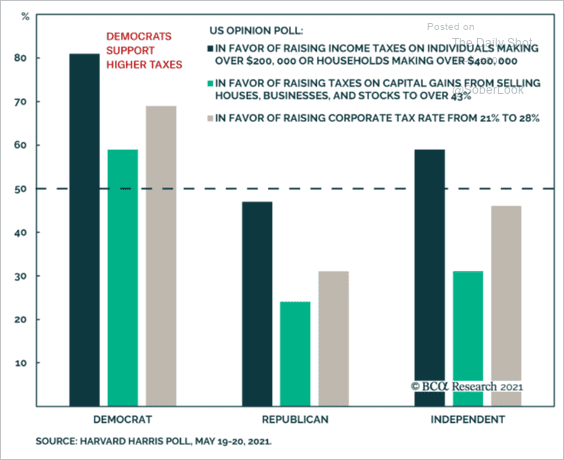 Source: BCA Research
8. Sources of methane emissions:
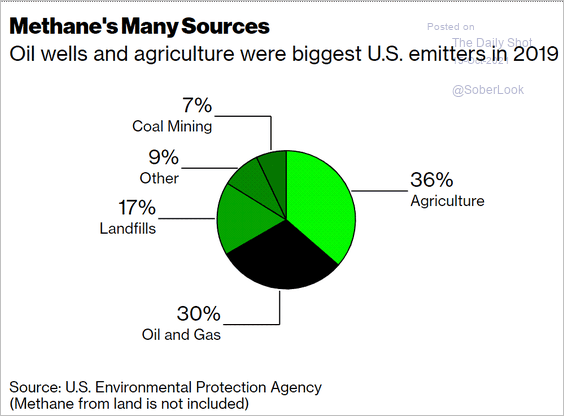 Source: Bloomberg Read full article
9. US population growth over the past decade (by race/ethnicity):
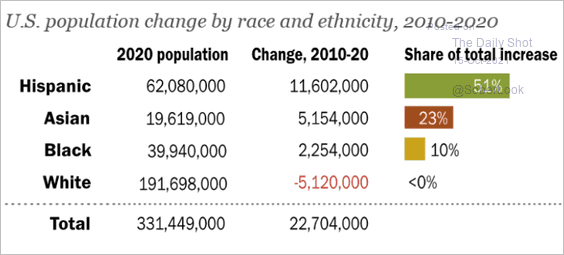 Source: Pew Research Center Read full article
10. Market value of edible insects:
 Source: Statista
——————–
Have a great weekend!
Back to Index