
The Daily Shot: 21-Oct-21
• The United States
• Canada
• The United Kingdom
• The Eurozone
• Europe
• Asia – Pacific
• China
• Emerging Markets
• Cryptocurrency
• Commodities
• Energy
• Equities
• Global Developments
• Food for Thought
The United States
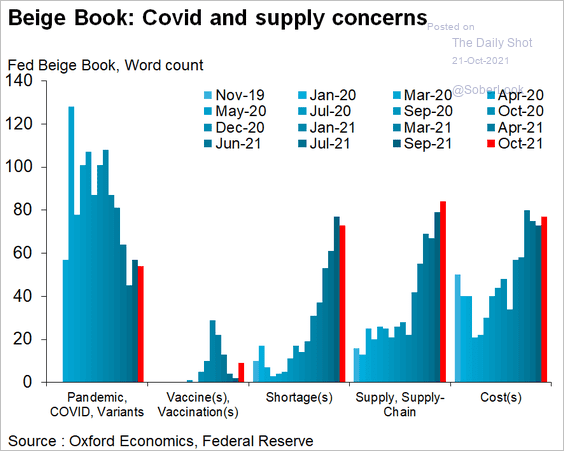
1. The Fed’s October Beige Book report showed an increased emphasis on supply-chain issues, high costs, and labor shortages. Pandemic-related concerns continue to recede.
• Inflation:
Most Districts reported significantly elevated prices, fueled by rising demand for goods and raw materials. Reports of input cost increases were widespread across industry sectors, driven by product scarcity resulting from supply chain bottlenecks. Price pressures also arose from increased transportation and labor constraints as well as commodity shortages. Prices of steel, electronic components, and freight costs rose markedly this period. Many firms raised selling prices indicating a greater ability to pass along cost increases to customers amid strong demand.
• Wage growth:
The majority of Districts reported robust wage growth. Firms reported increasing starting wages to attract talent and increasing wages for existing workers to retain them. Many also offered signing and retention bonuses, flexible work schedules, or increased vacation time to incentivize workers to remain in their positions.
Here is the Beige Book tracker from Oxford Economics.
 Source: @GregDaco, @OxfordEconomics
——————–
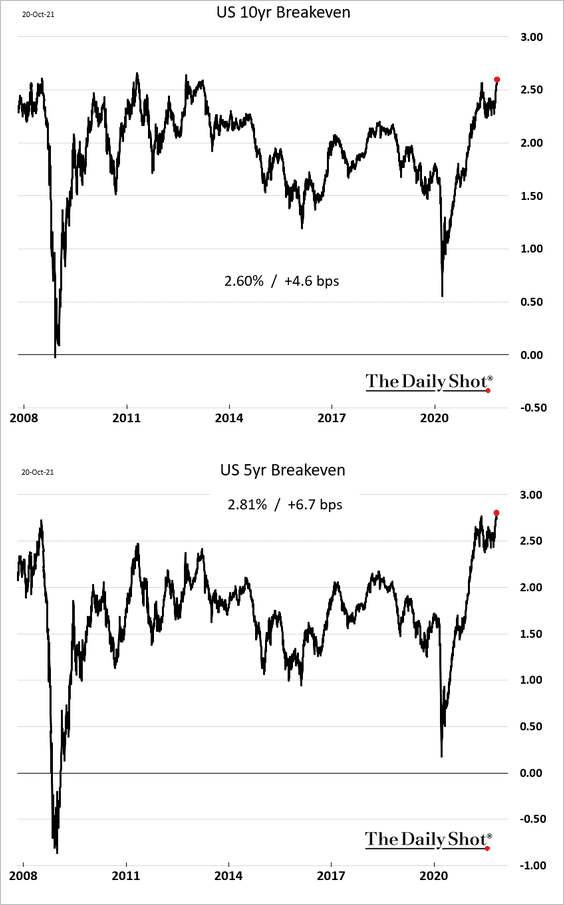
2. Next, we have some updates on inflation.
• TIPS breakevens (market-based inflation expectations) keep climbing, with the 5-year rate hitting a multi-year high.
• Economists continue to boost their inflation forecasts.
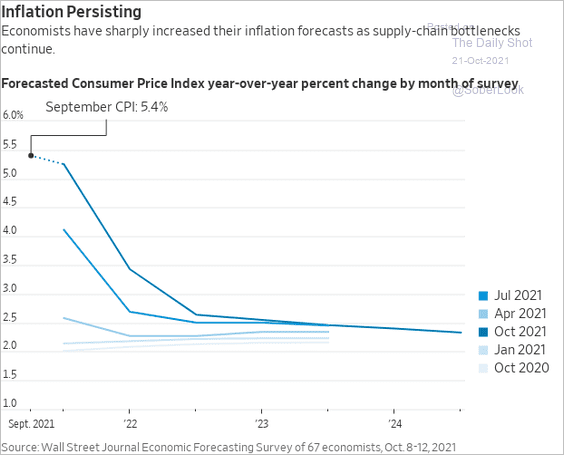 Source: @WSJ Read full article
• Fund managers are less sure about inflation being “transitory.”
![]() Source: BofA Global Research; @SamRo
Source: BofA Global Research; @SamRo
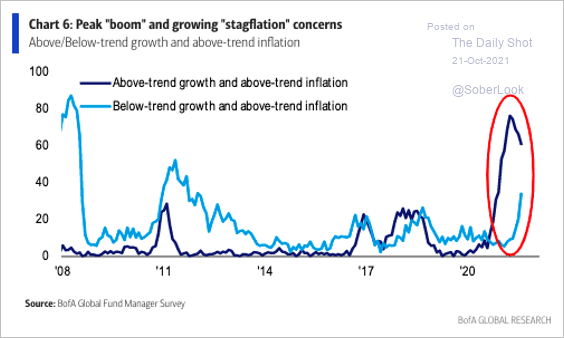
• Investors’ stagflationary concerns increased this month.
 Source: BofA Global Research; @SamRo
• The amount of “excess” liquidity in the economy is staggering, which will continue to be a tailwind for inflation. Here is the M2 money supply vs. the pre-COVID trend.
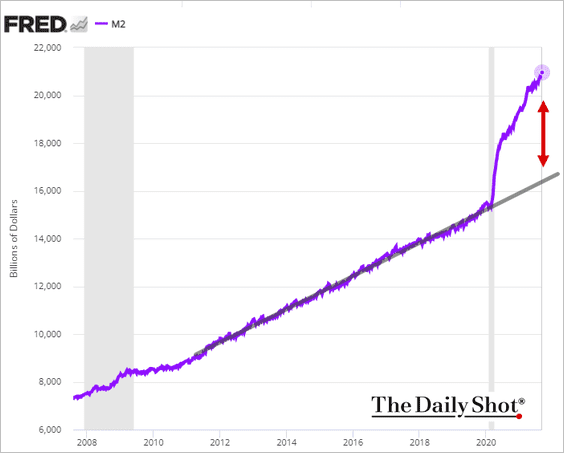 h/t Jim Reid, Deutsche Bank Research
——————–
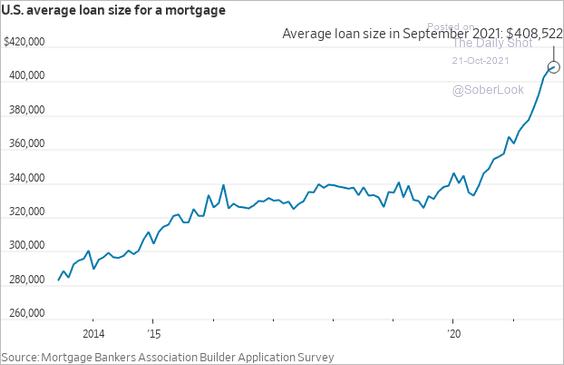
3. Mortgage applications are still relatively robust despite an uptick in rates.
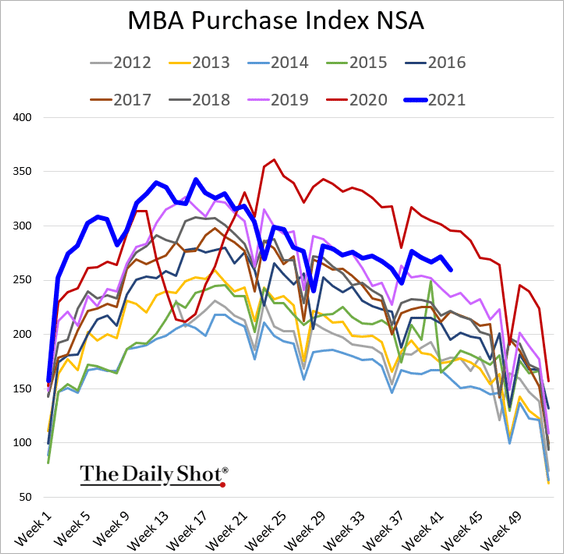
The average mortgage size is up 20% since the start of the pandemic. With much larger loans, affordability quickly becomes an issue when rates increase.
 Source: @jeffsparshott
——————–
4. Retail gasoline prices have been rising quickly, which will remain a drag on consumer sentiment.
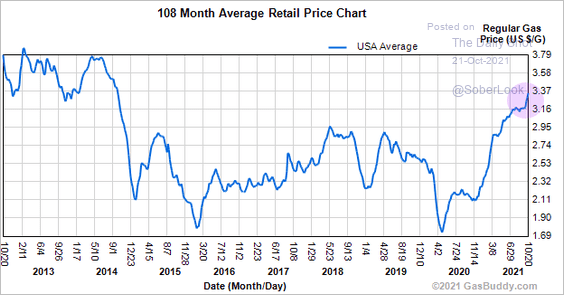 Source: GasBuddy
5. US consumers are increasingly interested in credit.
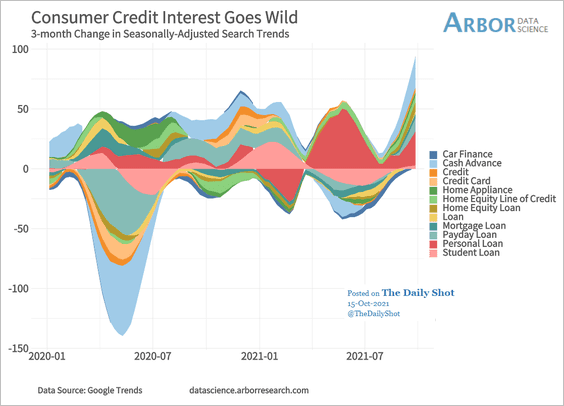 Source: Arbor Research & Trading
Will households start to consume more, given the recent rise in wealth?
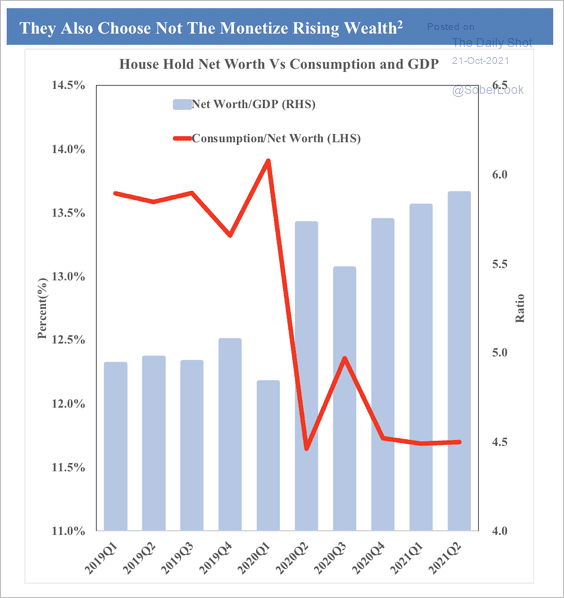 Source: SOM Macro Strategies
——————–
6. State tax receipts surged this year, according to Evercore ISI.
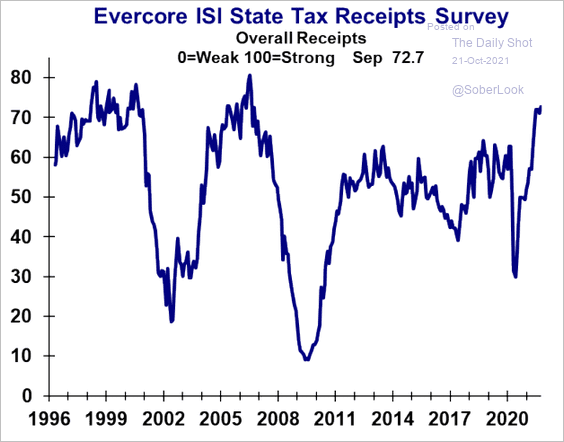 Source: Evercore ISI
Back to Index
Canada
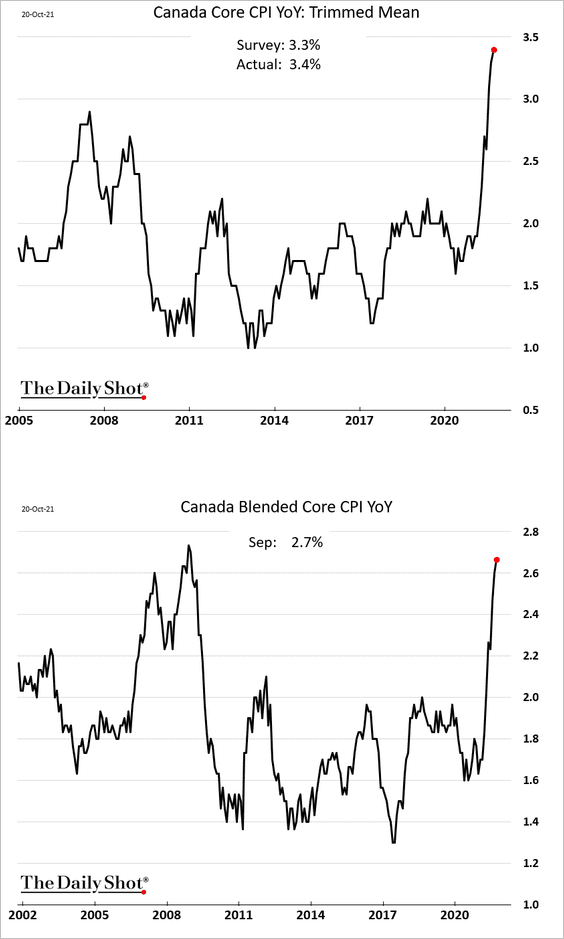
1. No matter how you look at it, Canada’s inflationary pressures are becoming acute.
• The CPI (year-over-year):
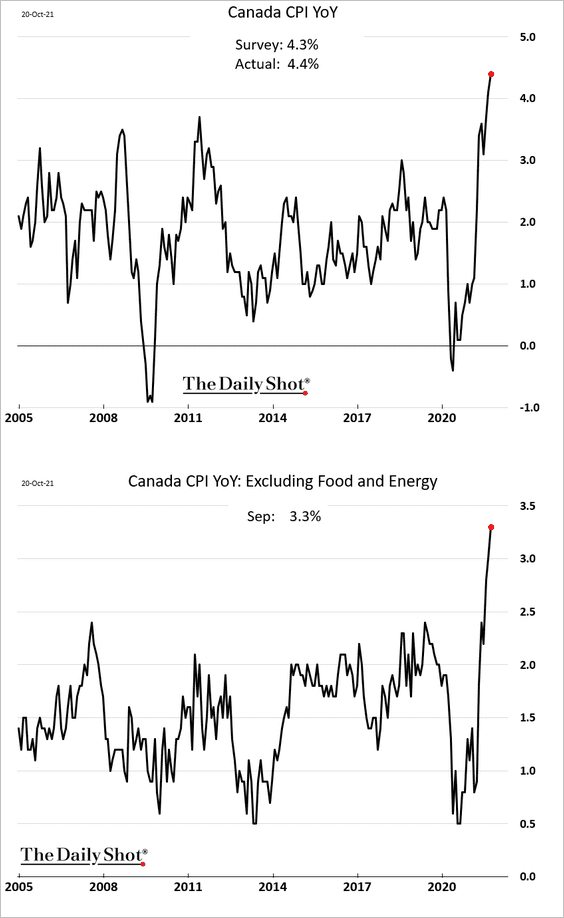
• The core CPI:
• Month-over-month CPI changes:
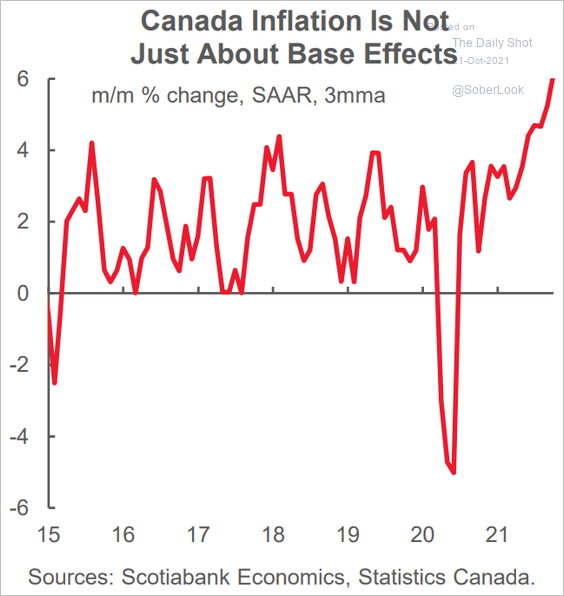 Source: Scotiabank Economics
• Goods and services:
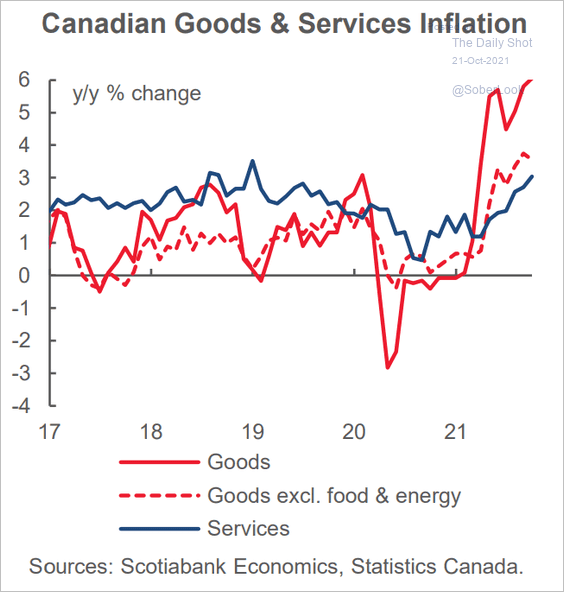 Source: Scotiabank Economics
• Price changes by sector:
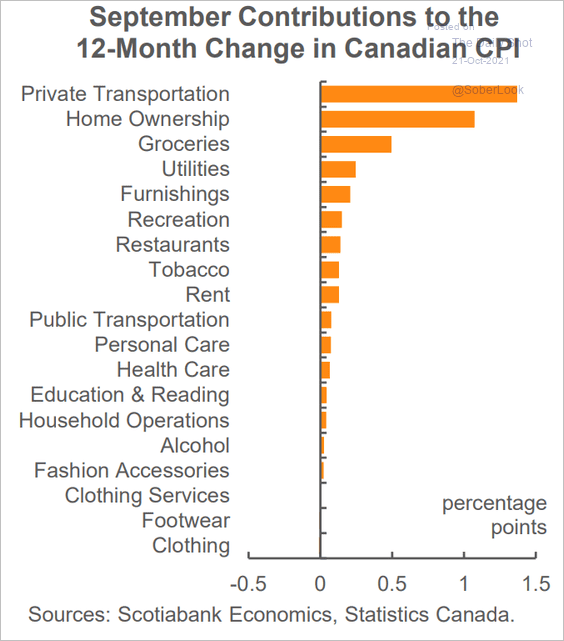 Source: Scotiabank Economics
——————–
2. A BoC rate hike is coming in April or sooner.
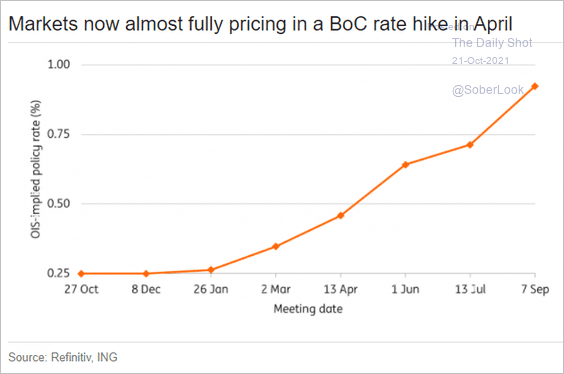 Source: ING
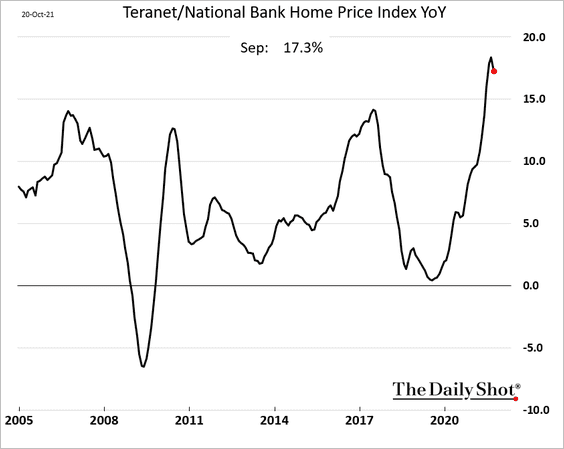
3. Home price appreciation appears to have peaked as affordability worsened significantly.
4. Small businesses increasingly face product distribution constraints and shortages of input products.
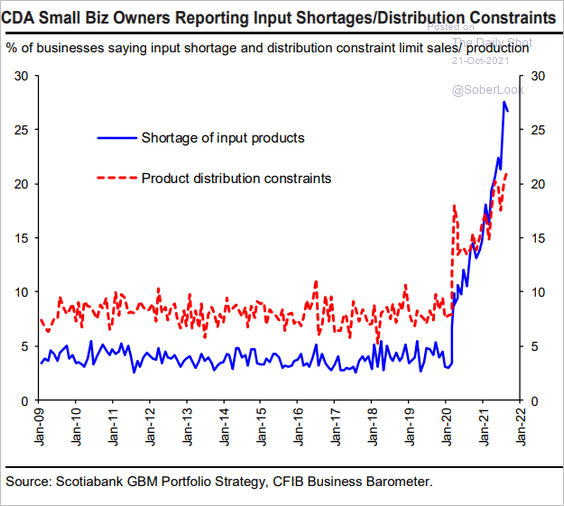 Source: Hugo Ste-Marie, Portfolio & Quantitative Strategy Global Equity Research, Scotia Capital
5. Small firms see plenty of demand.
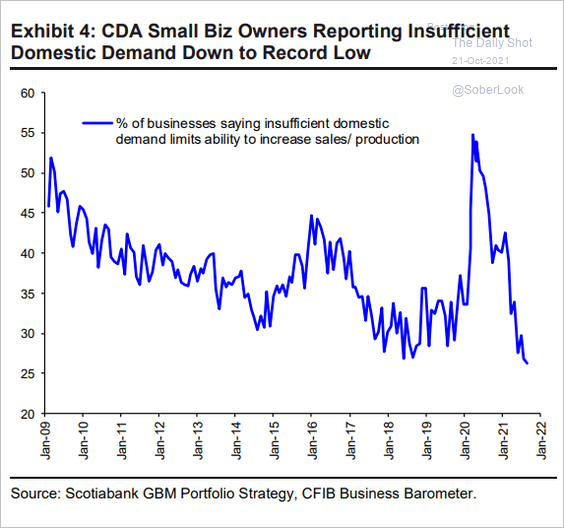 Source: Hugo Ste-Marie, Portfolio & Quantitative Strategy Global Equity Research, Scotia Capital
Back to Index
The United Kingdom
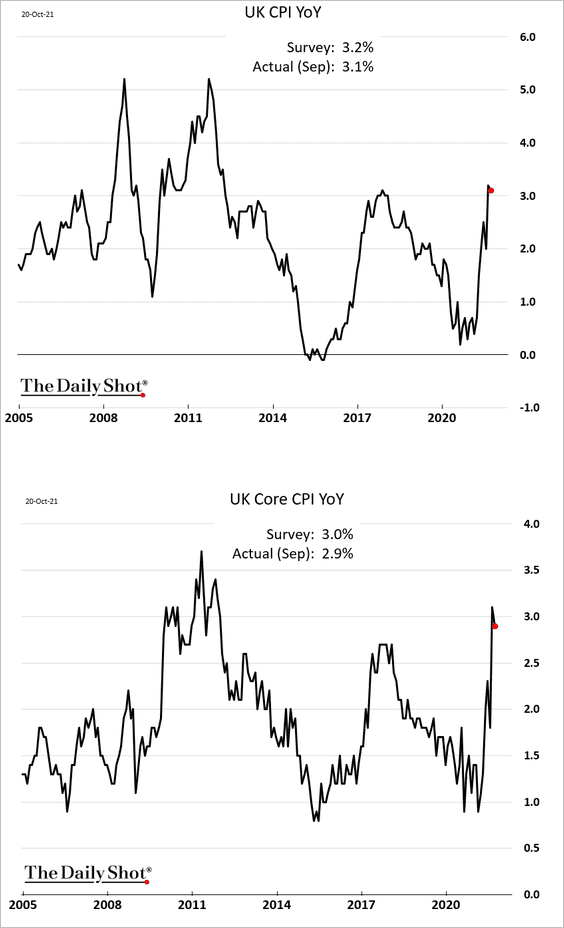
1. Inflation ticked lower last month.
• According to Pantheon Macroeconomics, “ships and chips” have been driving the core CPI higher.
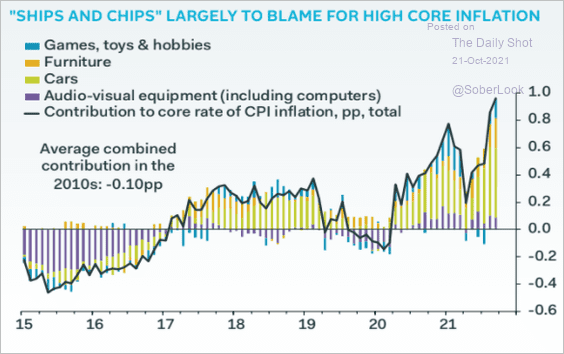 Source: Pantheon Macroeconomics
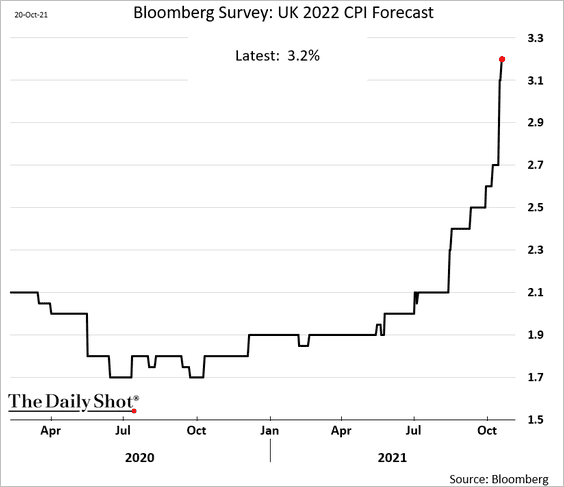
• Economists continue to boost their inflation forecasts for this quarter and next year.
——————–
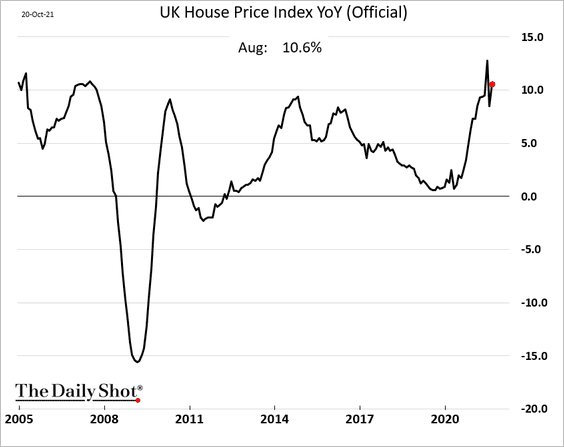
2. Home price appreciation climbed back above 10% in August.
3. This chart shows Great Britain’s electricity generation mix over time.
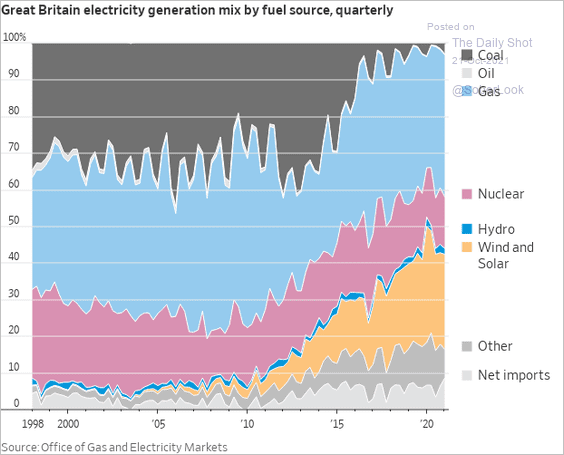 Source: @WSJ Read full article
Back to Index
The Eurozone
1. Surging energy prices continue to boost inflation, and there is much more to come as the natural gas price spike makes its way through the economy.
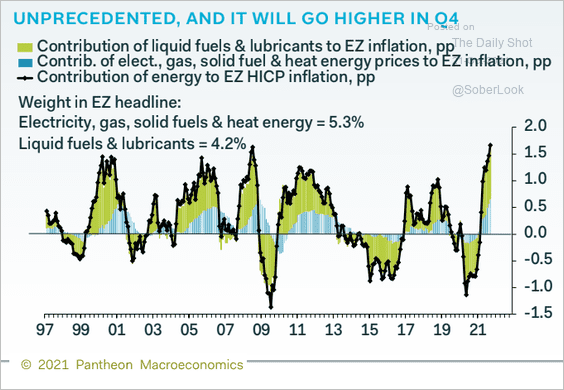 Source: Pantheon Macroeconomics
European inflation differs from the US in three vital areas – much lower education and healthcare inflation and, despite being linked before the financial crisis, a widely different recent trajectory in housing inflation.
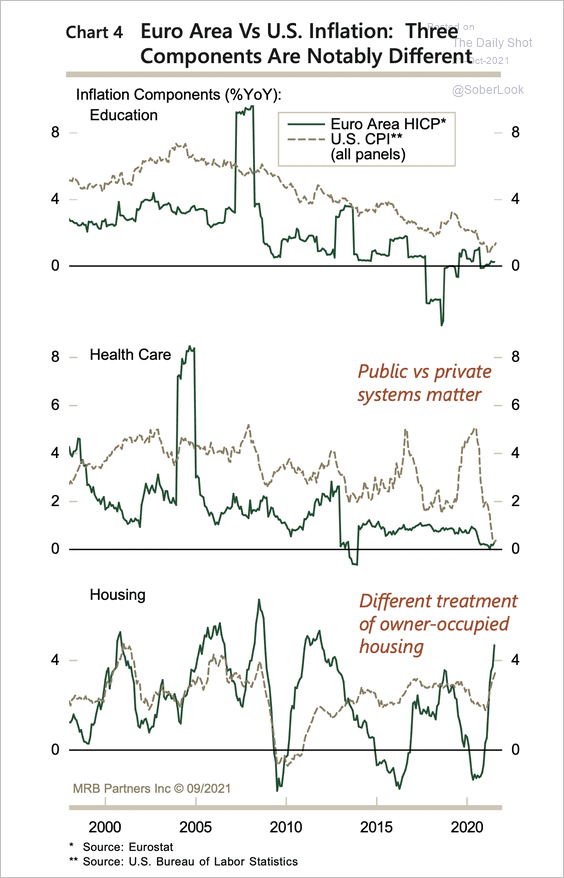 Source: MRB Partners
——————–
2. This chart shows Germany’s net government debt issuance.
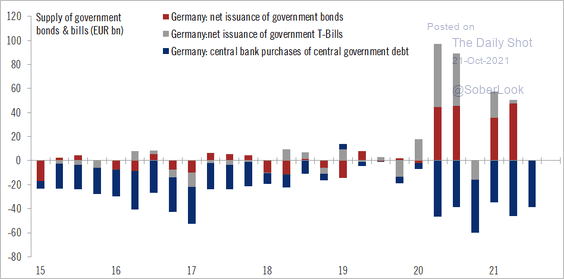 Source: @fwred
3. Will we see an even more dovish ECB as Jens Weidmann exits?
 Source: CNBC Read full article
4. Employment regulation has gotten a lot less strict in Southern European countries in response to the financial crisis.
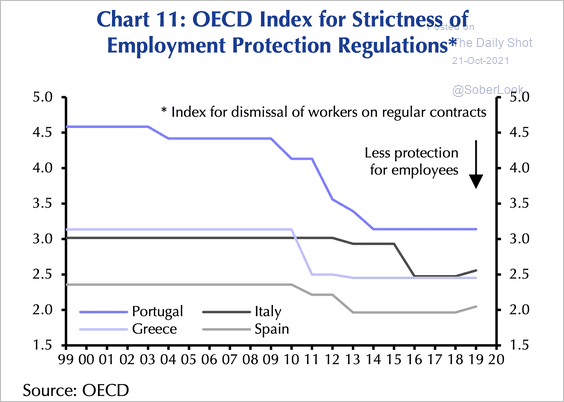 Source: Capital Economics
Back to Index
Europe
1. Poland’s industrial production has been on fire.
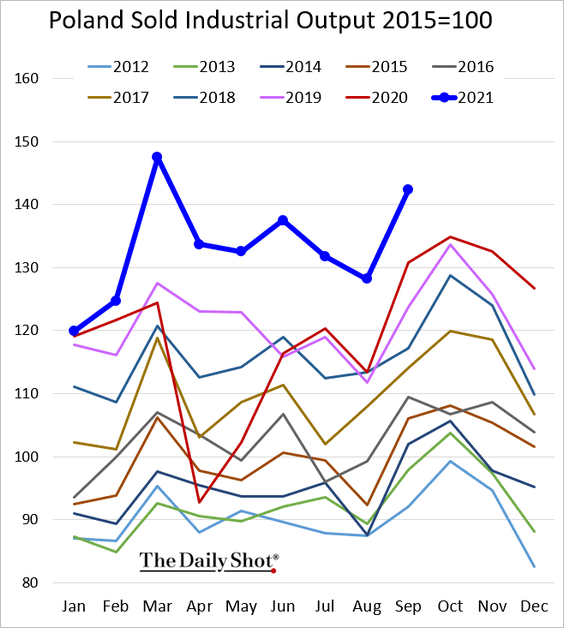
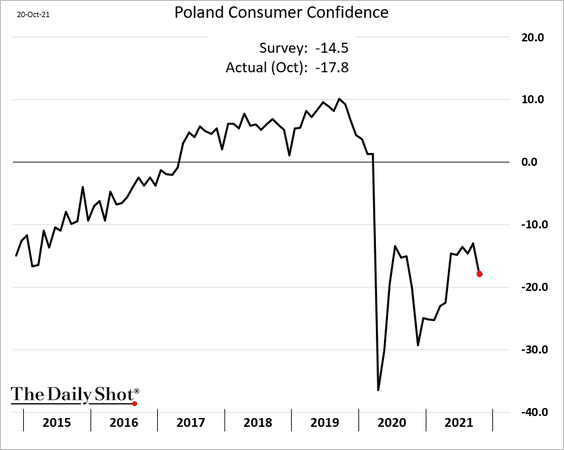
But consumer sentiment deteriorated again this month.
——————–
2. Similar to the US, Sweden’s labor market has tightened rapidly.
• Vacancies:
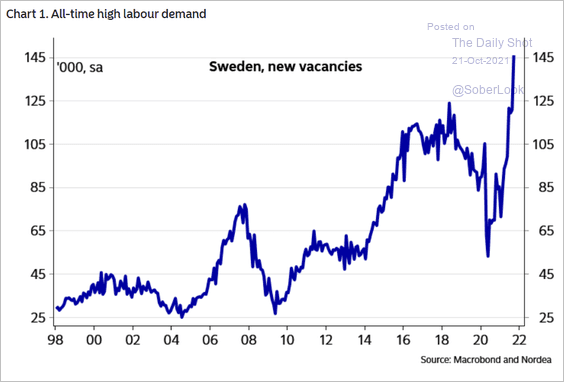 Source: Nordea Markets
• Short-term unemployment:
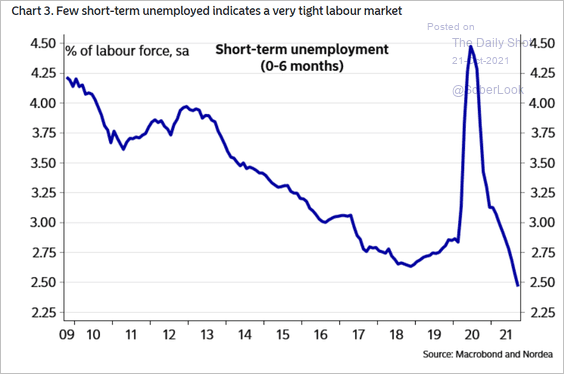 Source: Nordea Markets
Sweden’s leading index is outpacing the Eurozone.
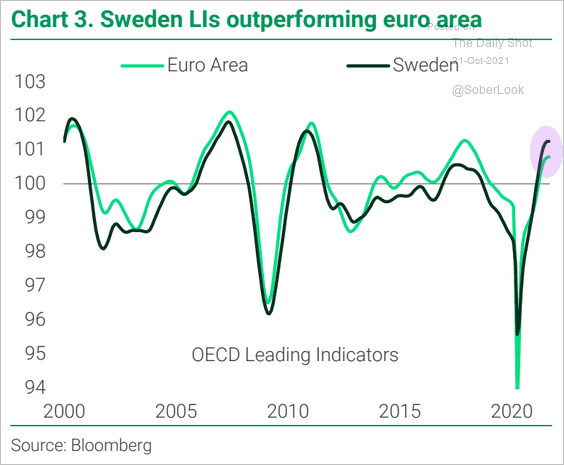 Source: TS Lombard
——————–
3. Equipment and material shortages have become acute in the EU.
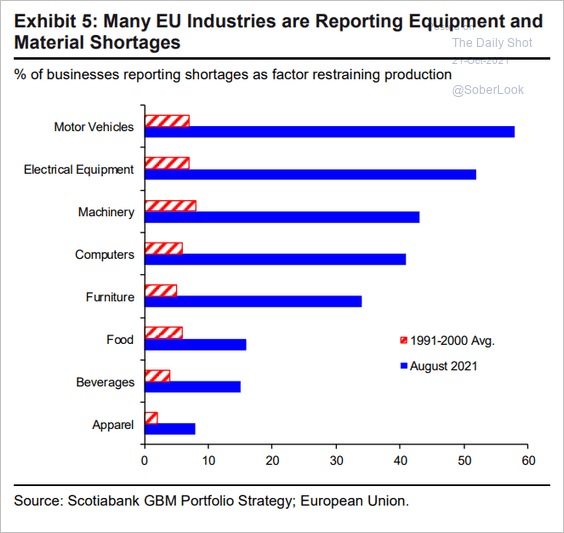 Source: Hugo Ste-Marie, Portfolio & Quantitative Strategy Global Equity Research, Scotia Capital
4. Here is a look at labor market slack in the EU.
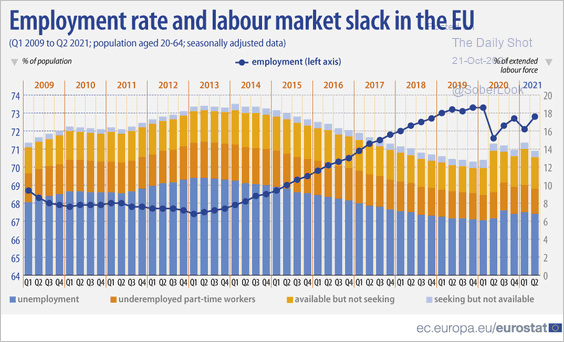 Source: Eurostat Read full article
Back to Index
Asia – Pacific
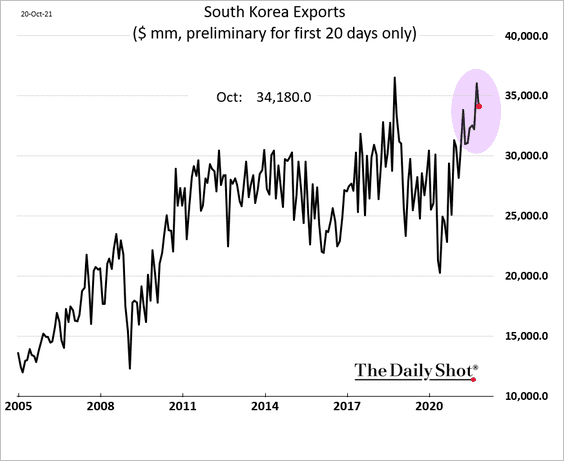
1. South Korea’s exports remain elevated.
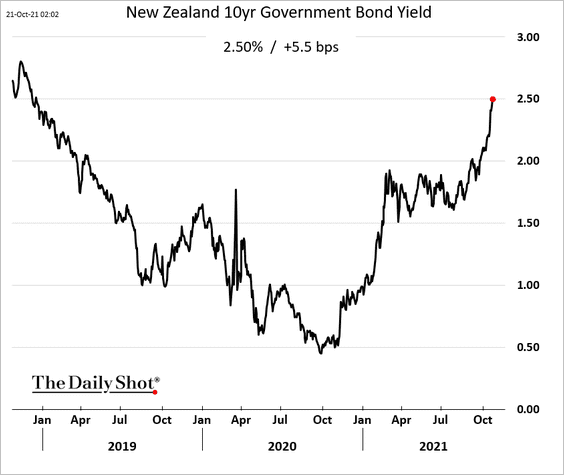
2. New Zealand’s total credit card spending tumbled further last month.
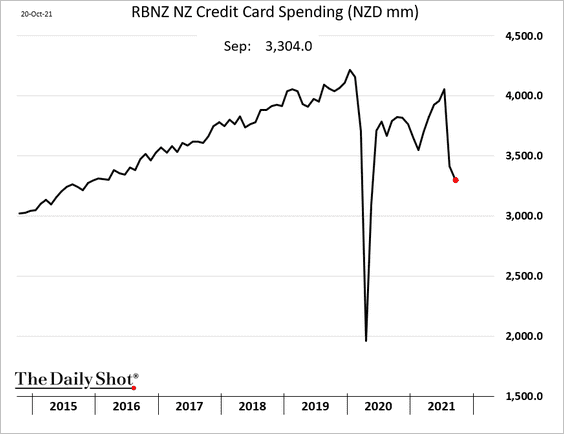
Nonetheless, bond yields continue to climb.
Back to Index
China
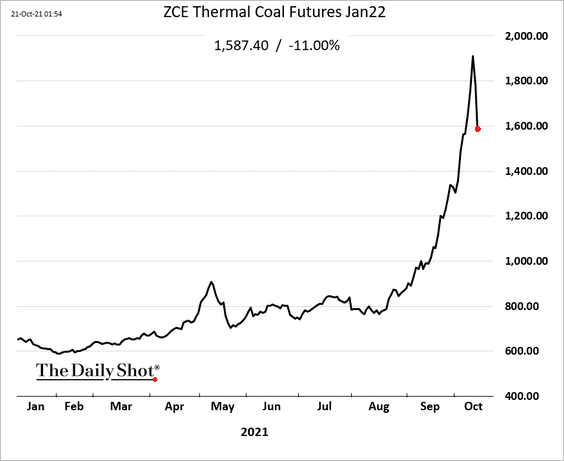
1. Coal futures tumbled as Beijing tries to address the energy crisis. Previous attempts provided only temporary relief.
 Source: Reuters Read full article
——————–
2. Domestic aluminum production is declining, mainly due to power shortages.
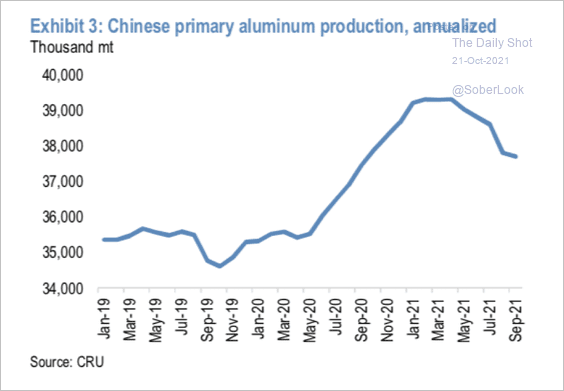 Source: JP Morgan
The nation’s copper demand and growth have stabilized near the historical average after a sharp recovery from pandemic lows.
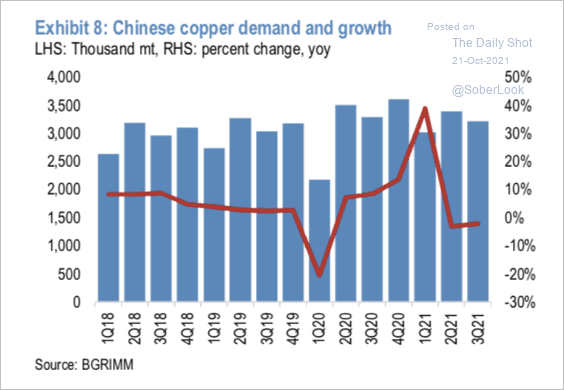 Source: JP Morgan
——————–
3. Balances of distressed bonds not in default expanded this year.
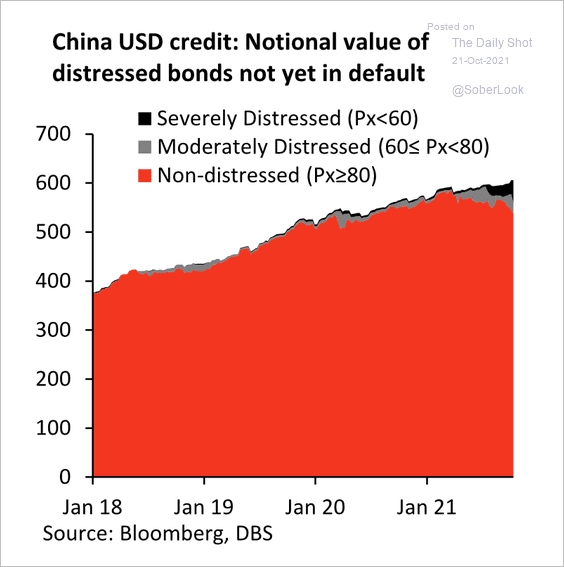 Source: DBS Group Research
4. Large companies are squeezing their smaller suppliers by delaying payments – in effect, getting free loans.
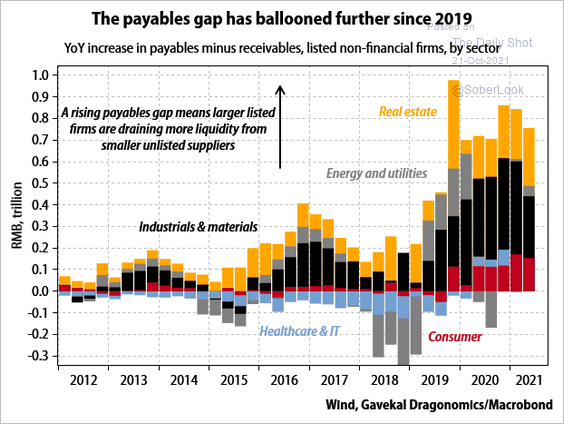 Source: Gavekal Research
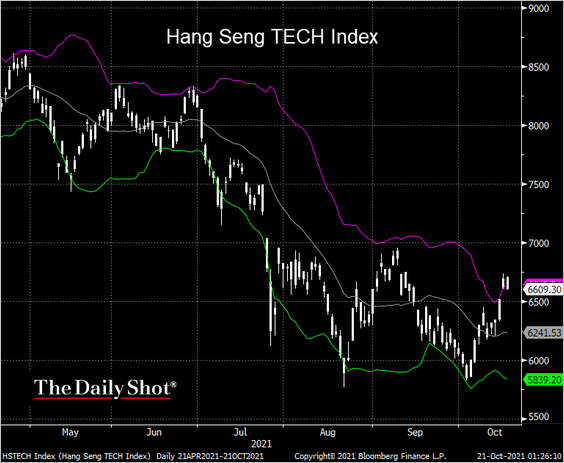
5. The Hang Seng TECH index held resistance at the upper Bollinger Band.
 h/t Jeanny Yu; @TheTerminal, Bloomberg Finance L.P.
Back to Index
Emerging Markets
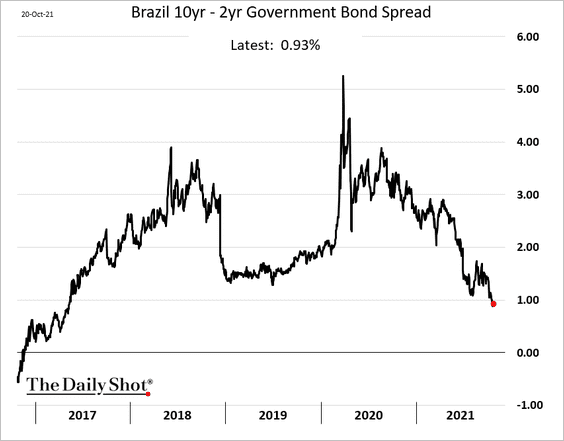
1. Brazil’s short-term yields are surging, …
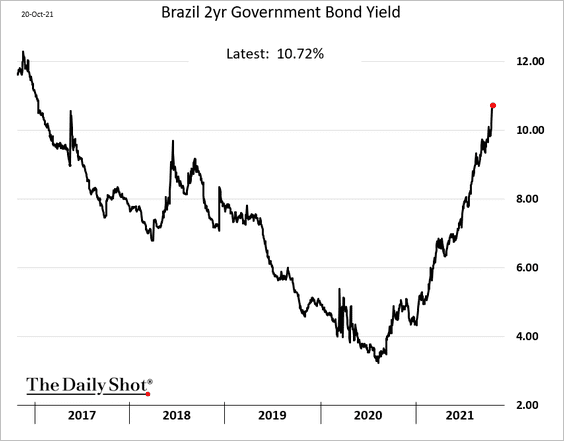
… as the curve flattens. The market sees a cloudy future for the economy.
——————–
2. This chart shows expected dividend yields this year by country.
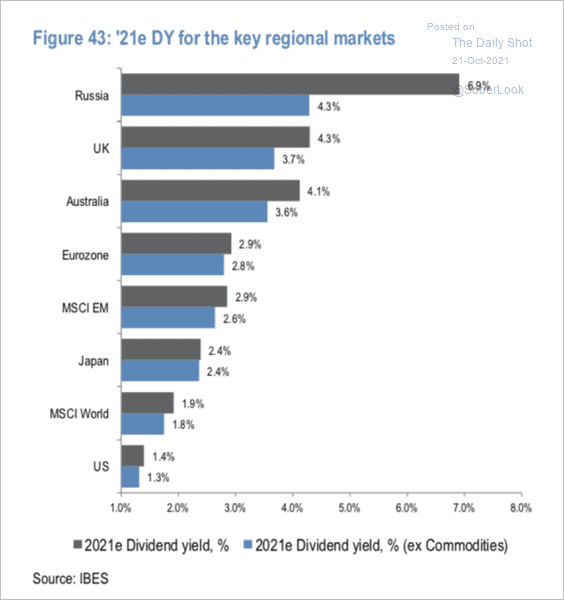 Source: JP Morgan
3. On average, EM equities return 6.2% during periods of rising Treasury yields.
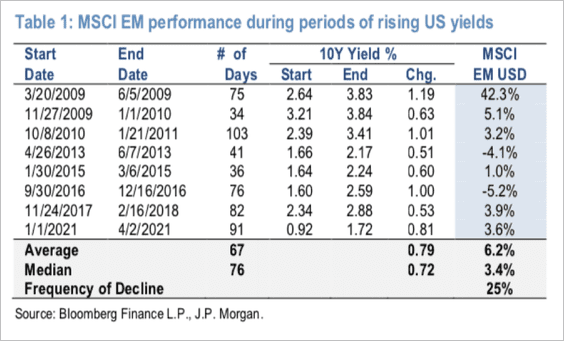 Source: JP Morgan
4. India stands out as the most expensive emerging market, while Turkey, Brazil, and South Africa appear cheap.
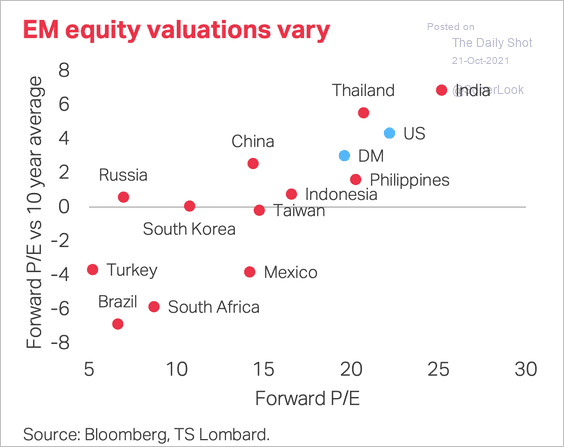 Source: TS Lombard
5. EM equity valuations relative to bonds are near average levels.
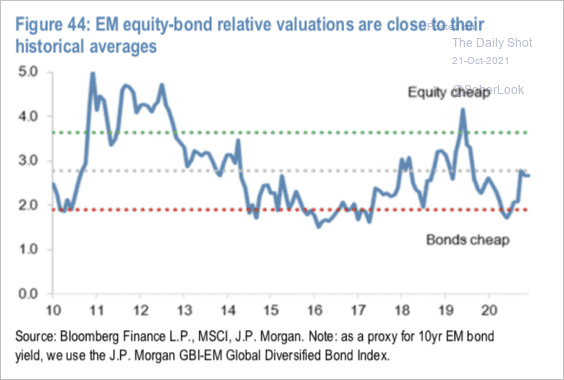 Source: JP Morgan
6. Here is the distribution of market capitalization of various emerging markets by cyclical vs. growth sectors.
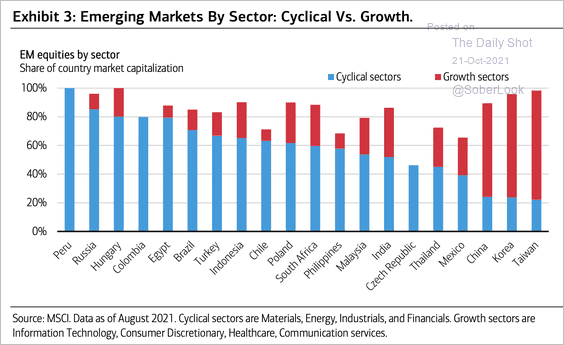 Source: BofA Global Research
7. Finally, we have vaccination rates across select economies.
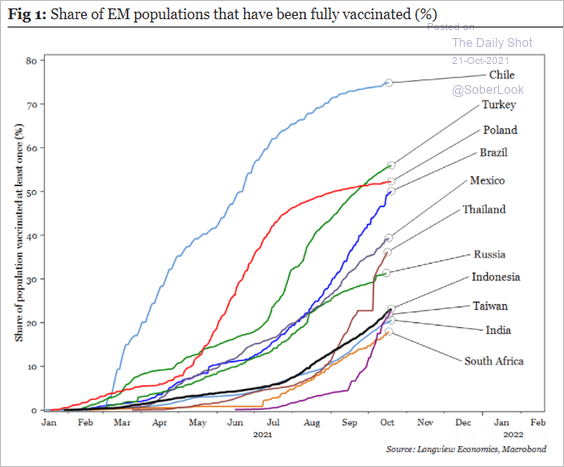 Source: Longview Economics
Back to Index
Cryptocurrency
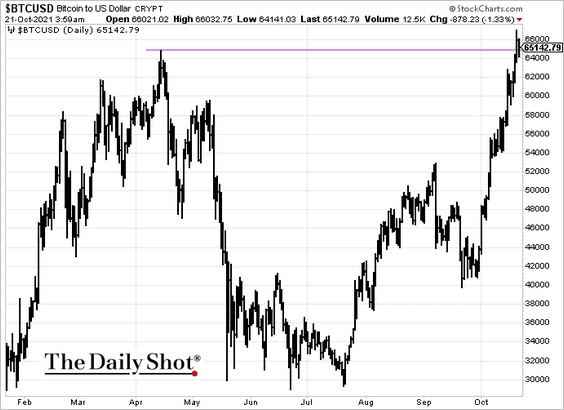
1. Bitcoin made an all-time high above $66K on Wednesday.
 Source: CoinDesk Read full article
——————–
2. Litecoin (LTC) and ether (ETH) have outperformed other large cryptocurrencies over the past week.
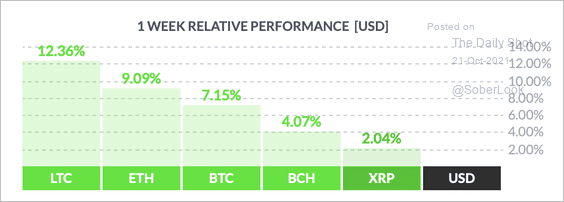 Source: FinViz
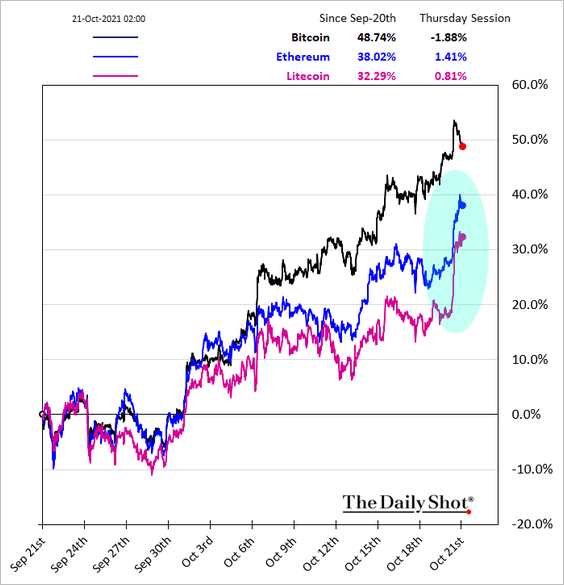
Here is the relative performance over the past month.
——————–
3. BITO had an impressive debut.
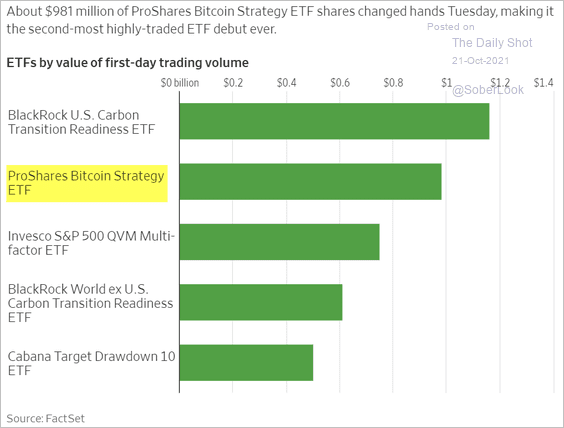 Source: @WSJ Read full article
ETFs present a new frontier for crypto.
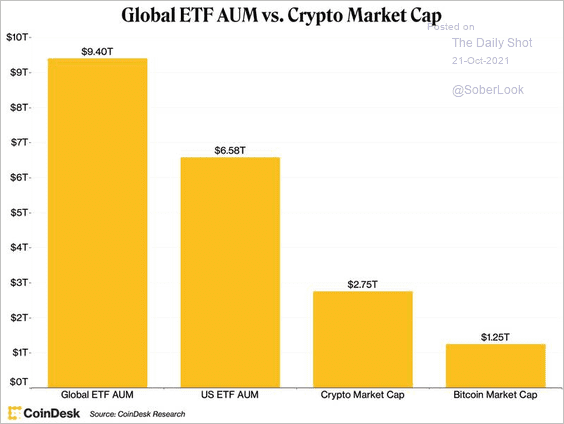 Source: CoinDesk Read full article
——————–
4. BTC’s market-value-to-realized-value (MVRV) ratio suggests that the cryptocurrency is not yet overvalued.
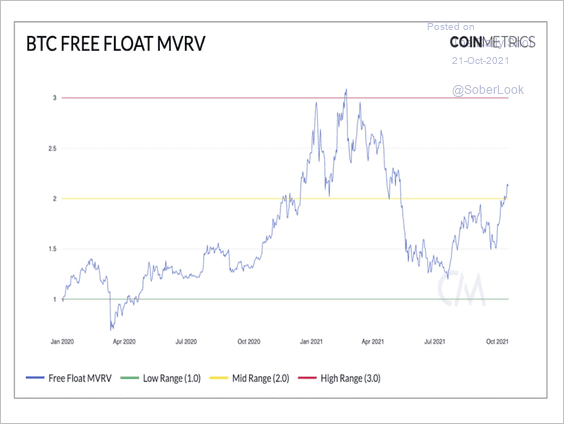 Source: Coin Metrics Read full article
5. Trading activity for $15K ETH call options expiring March 2022 has accelerated as traders bet big that ether’s turn for an ETF is coming soon.
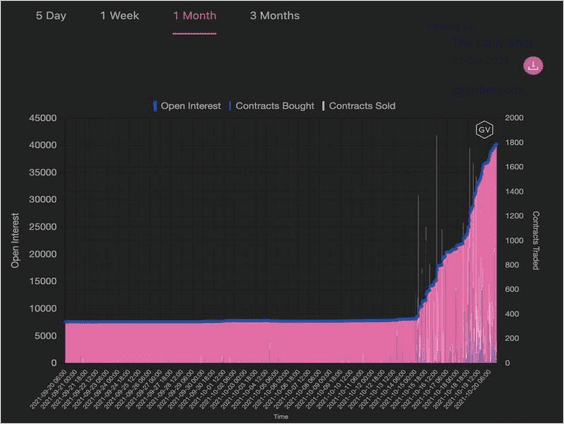 Source: Genesis Volatility Read full article
Back to Index
Commodities
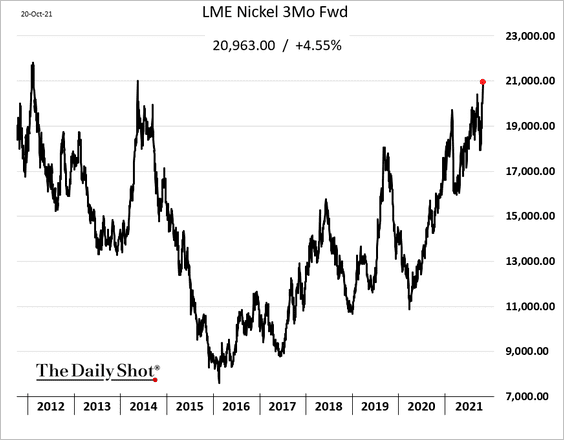
1. Nickel is surging.
This is what happens to metals demand in a net-zero scenario.
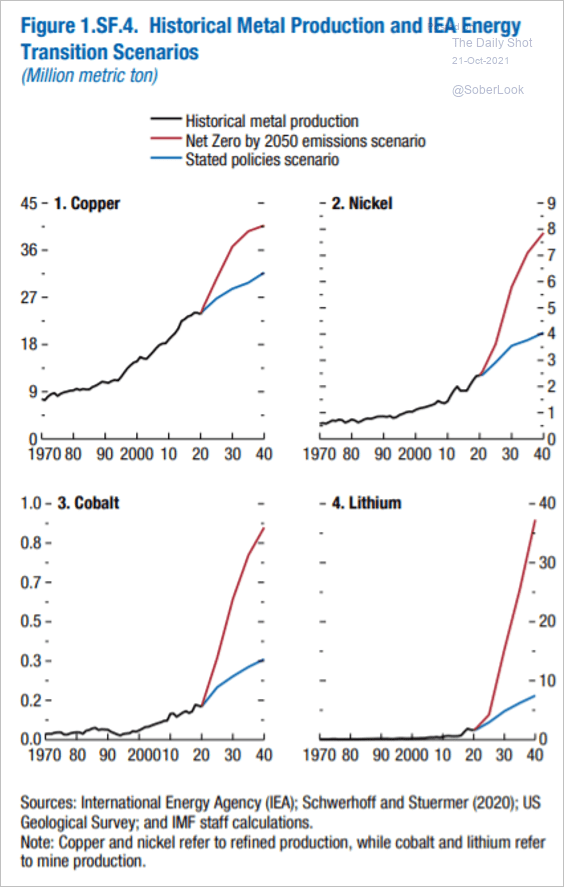 Source: IMF Read full article
Energy and battery materials have outperformed the broader commodity complex this year.
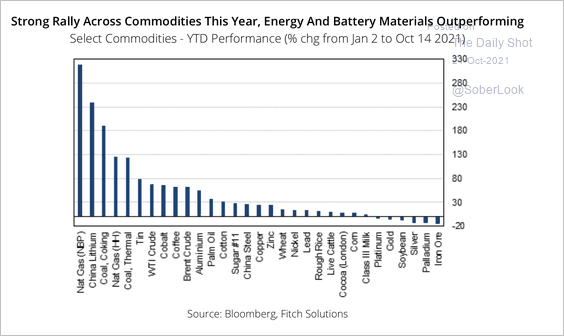 Source: Fitch Solutions Macro Research
——————–
2. Which industrial commodities are in short supply in the US?
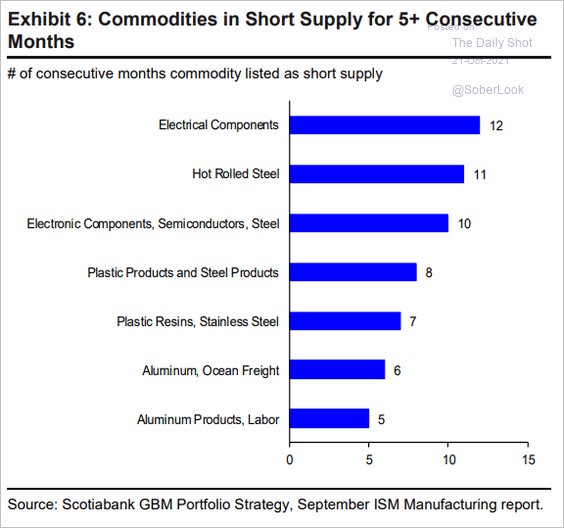 Source: Hugo Ste-Marie, Portfolio & Quantitative Strategy Global Equity Research, Scotia Capital
3. Copper and iron ore have diverged.
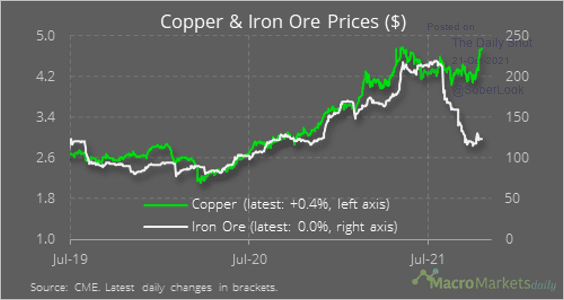 Source: @macro_daily
4. Will higher agricultural commodity prices prompt US farmers to plant more soybeans instead of corn?
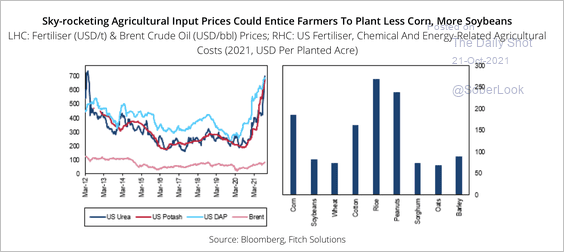 Source: Fitch Solutions Macro Research
Back to Index
Energy
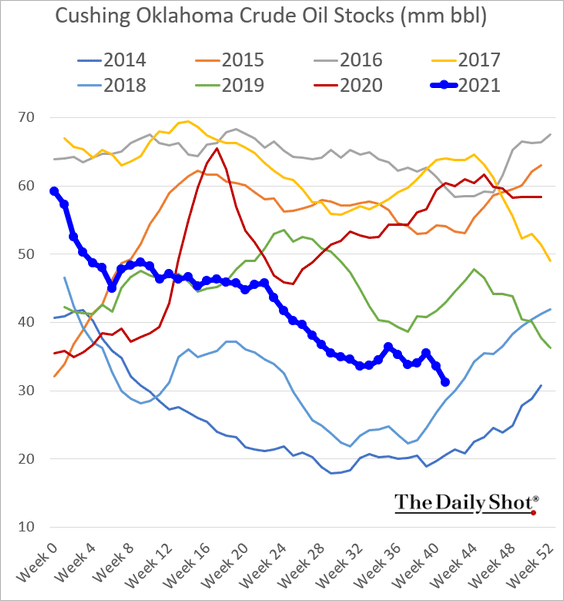
1. Oil inventories at Cushing, OK continue to dwindle.
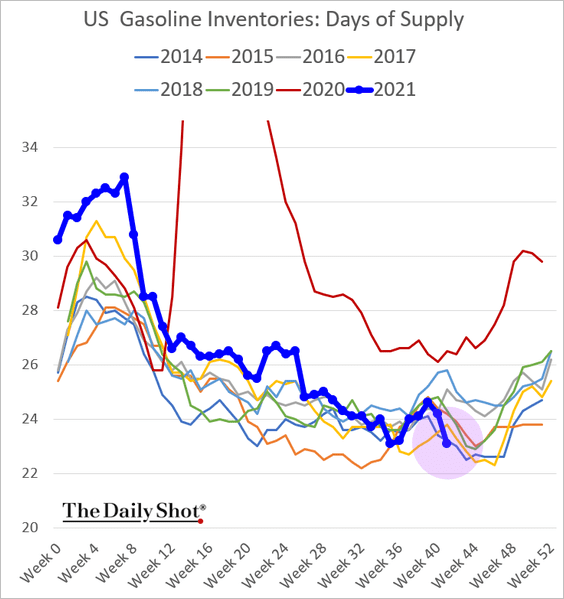
2. US gasoline demand is near the top of the seven-year range.

And gasoline inventories are at multi-year lows.
——————–
3. The global energy price index (3 months forward) has trended higher over the past month.
 Source: FHN Financial
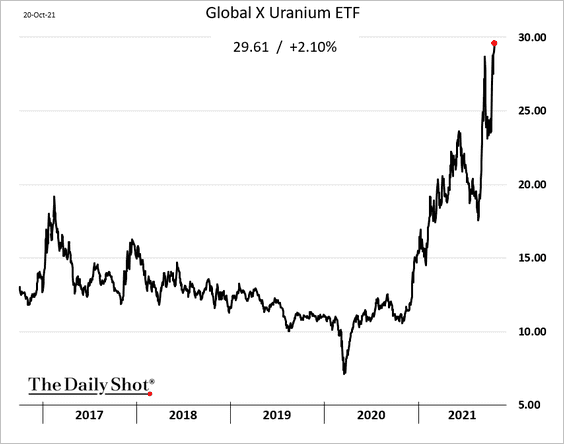
4. The international buzz on using more nuclear energy to cut emissions has boosted uranium and uranium mining stocks.
 Source: The Guardian Read full article
 Source: @WSJ Read full article
Here is a uranium mining ETF.
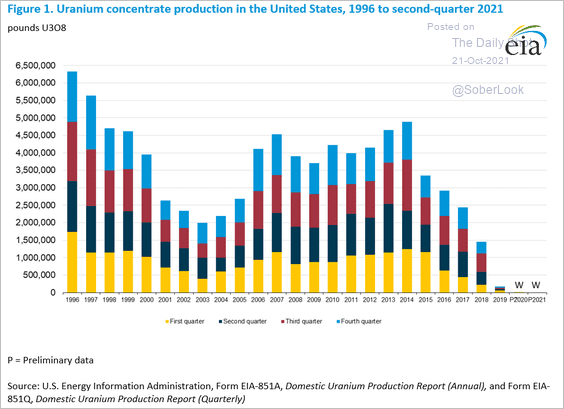
By the way, this chart shows uranium concentrate production in the US.
Back to Index
Equities
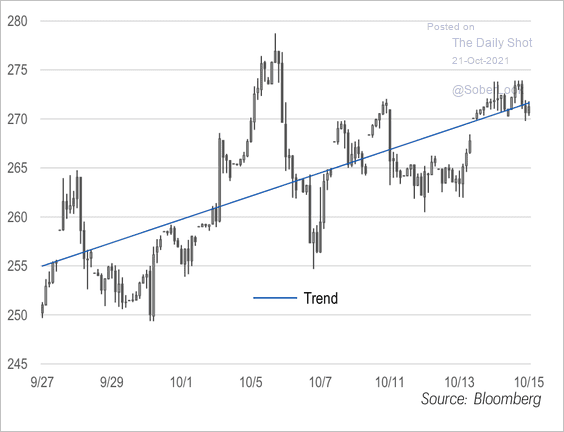
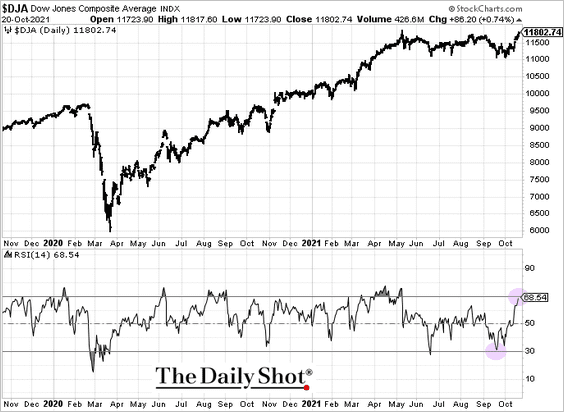
1. The S&P 500 has made an impressive comeback after a difficult September.
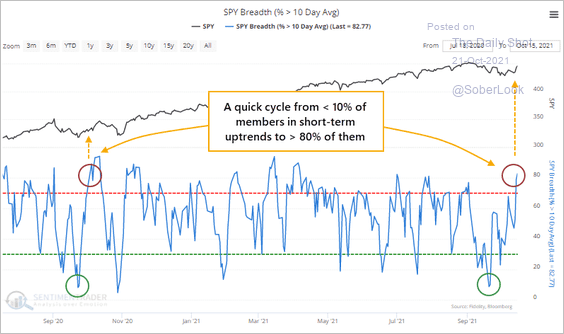 Source: SentimenTrader
Having gone from near-oversold to near-overbought in a few days, the Dow is back at the highs.
——————–
2. Transportation stocks are surging.
![]()
3. Next, we have some updates on small caps.
• Small-cap relative performance has diverged from Treasury yields.
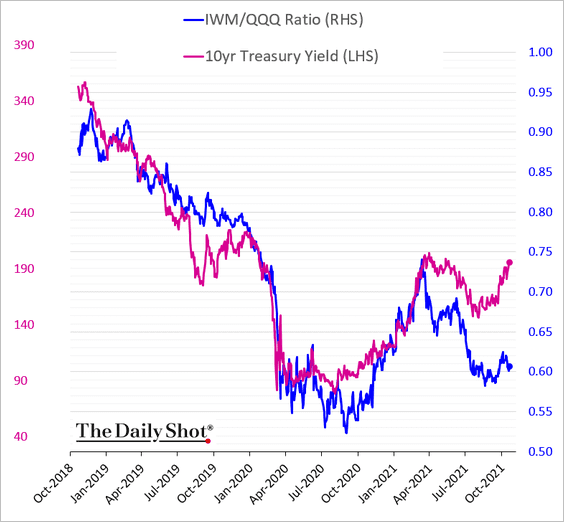 h/t Pavilion Global Markets
• Small-cap growth stocks have not outperformed the way large-cap growth shares have.
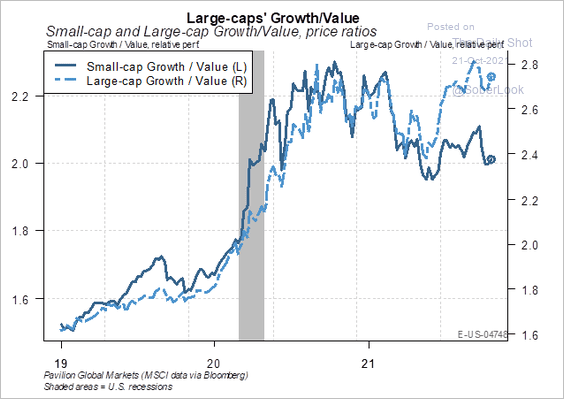 Source: Pavilion Global Markets
• Energy accounted for a significant share of the Russell 2000 value returns over the past few months.
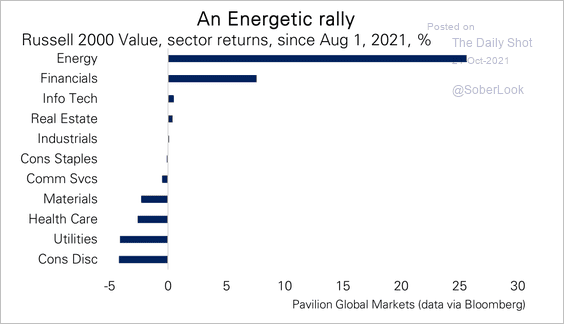 Source: Pavilion Global Markets
——————–
4. Value stocks increasingly tend to be stuck in the “value category.”
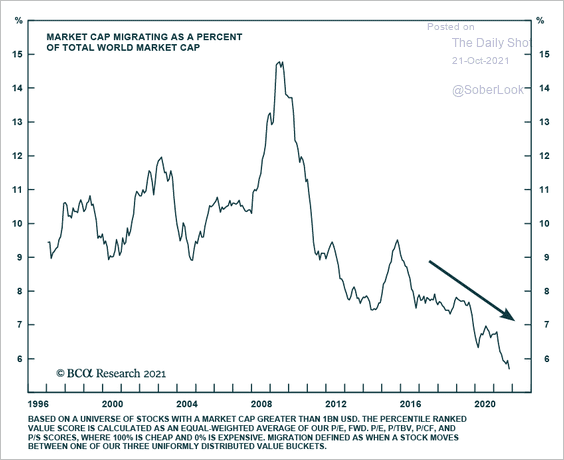 Source: BCA Research
5. Google searches for SPAC collapsed this year as the frenzy appears to be cooling down (2 charts).
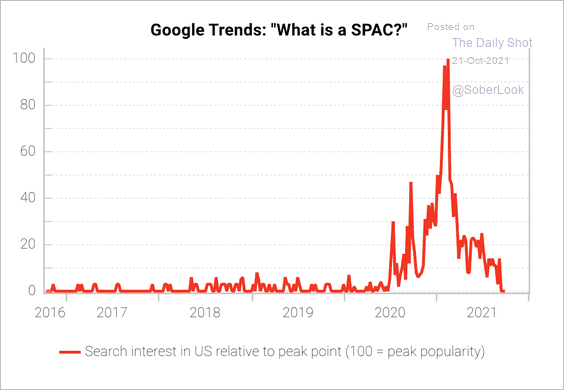 Source: Variant Perception
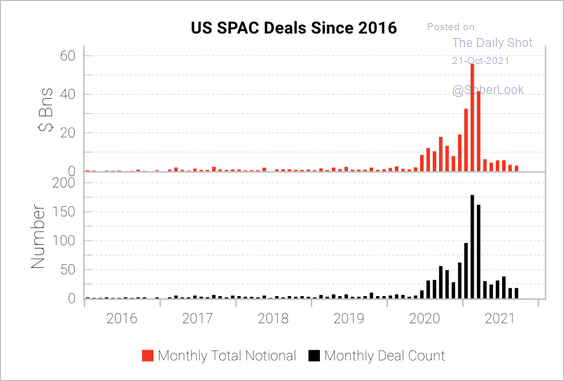 Source: Variant Perception
——————–
6. How will different factors perform over the next 12 months (according to fund managers)?
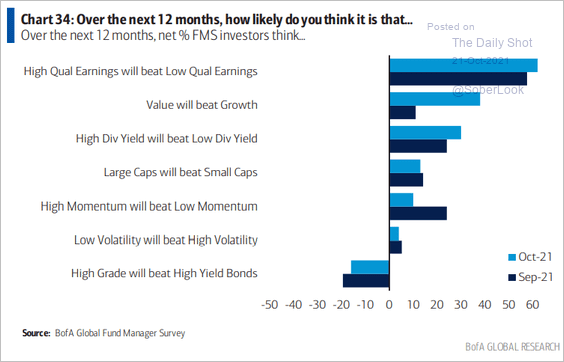 Source: BofA Global Research; @MaverickBogdan
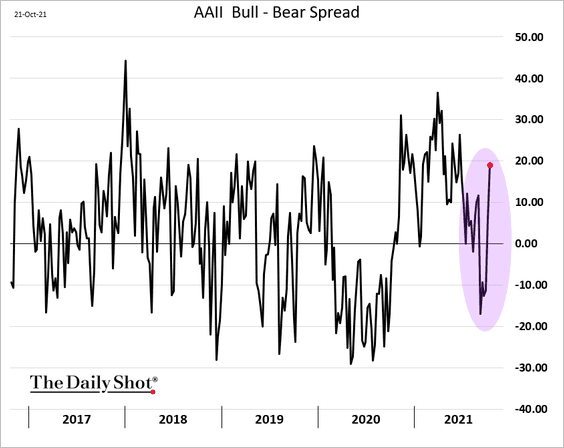
7. Investor sentiment has rebounded.
Investopedia readers (mostly retail investors) see supply chains, government spending, and inflation as the major risks going forward.
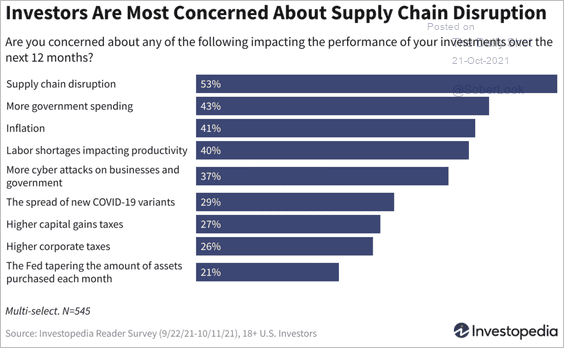 Source: Investopedia Read full article
Back to Index
Global Developments
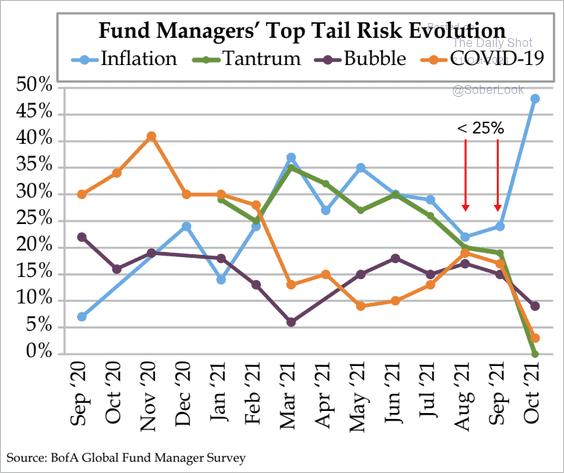
1. What do fund managers see as the biggest tail risk?
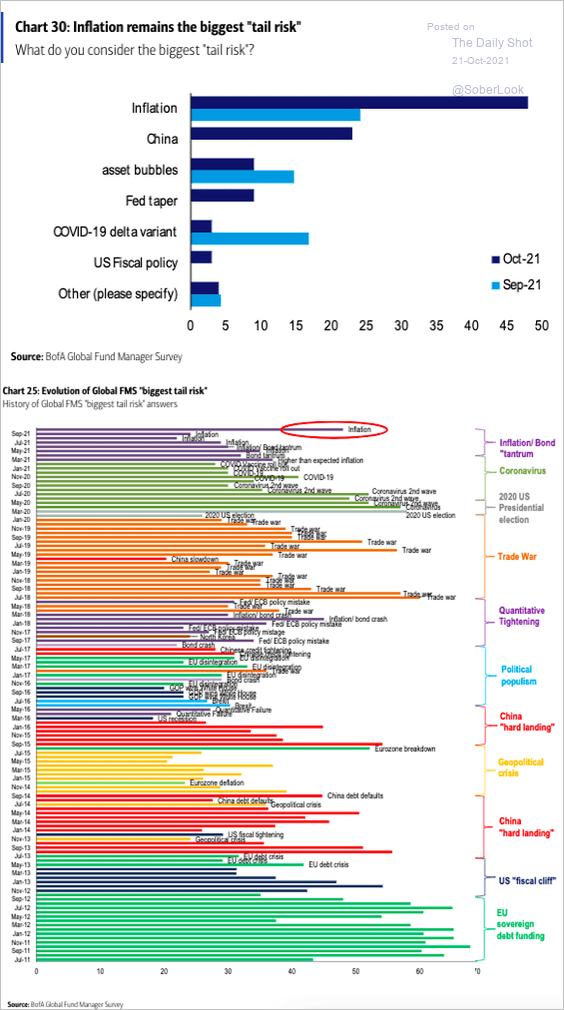 Source: BofA Global Research; @SamRo
Here are the trends over time.
 Source: The Daily Feather
——————–
2. The spike in global natural gas prices could result in significant adjustments in trade balances.
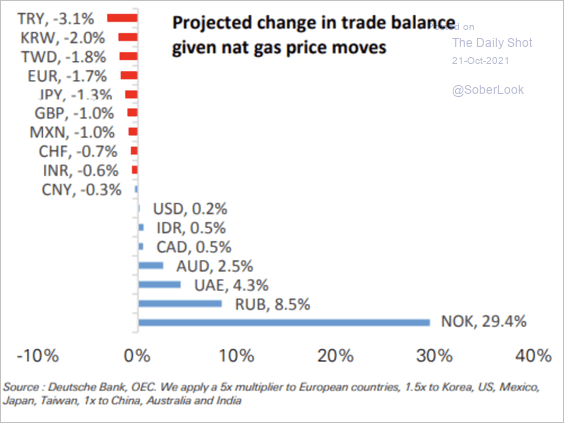 Source: Deutsche Bank Research; h/t III Capital Management
3. There has been less pandemic-related online search activity and more interest in supply-chain issues.
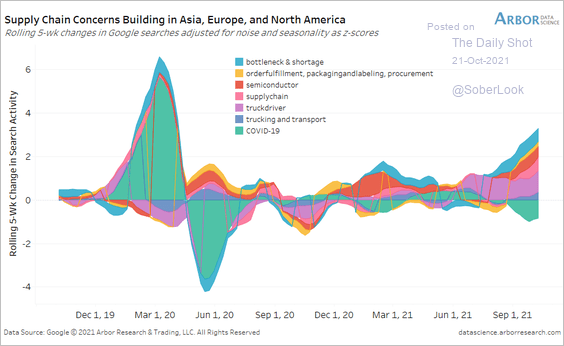 Source: Arbor Research & Trading
——————–
Food for Thought
1. Ransomware attacks:
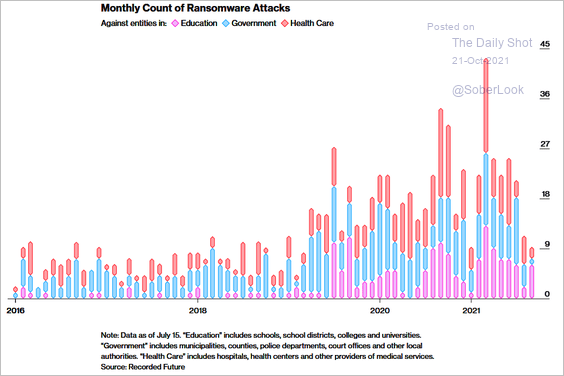 Source: Bloomberg Read full article
2. Public spending on family benefits:
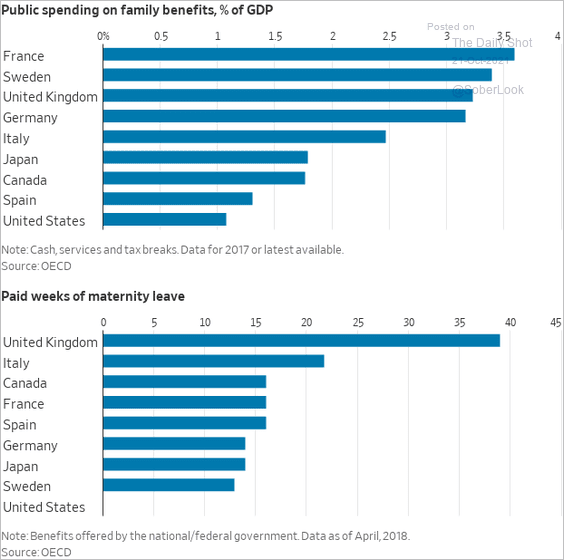 Source: @WSJ Read full article
3. Incarceration rate changes over the past decade:
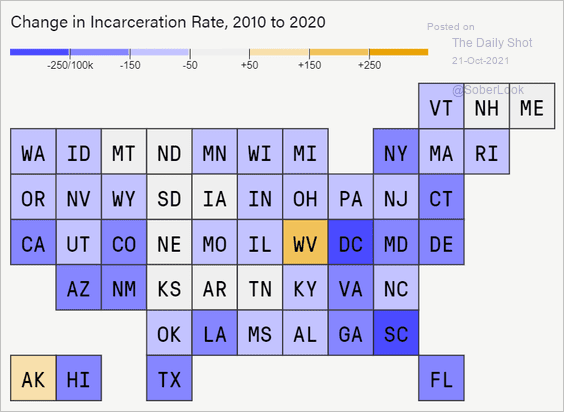 Source: The Marshall Project Read full article
4. Rising temperature in Russia:
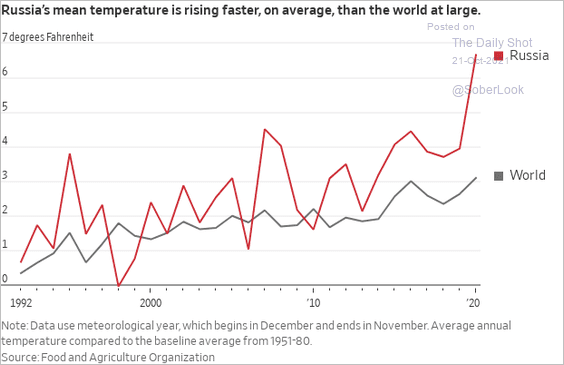 Source: @WSJ Read full article
5. Hourly wages in fossil fuels vs. renewables jobs:
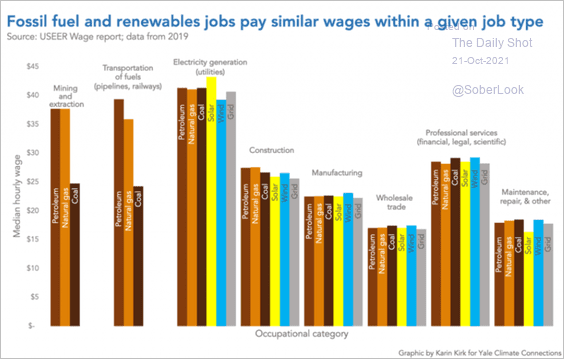 Source: NPR Read full article
6. Aggregate net-worth changes since the start of the pandemic:
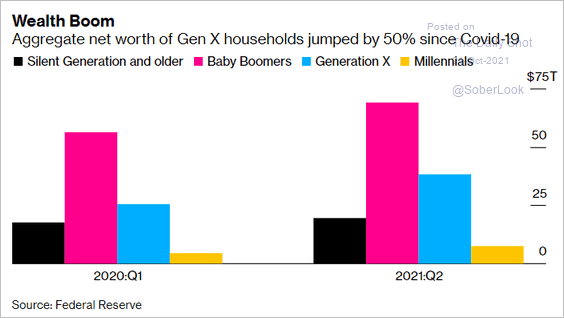 Source: Bloomberg Read full article
7. Projected US government interest expenses as a share of GDP:
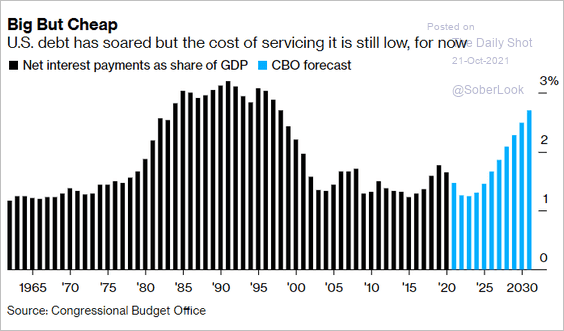 Source: Bloomberg Read full article
8. Changes in US household income:
 Source: ING
9. Long-term projections for EV sales:
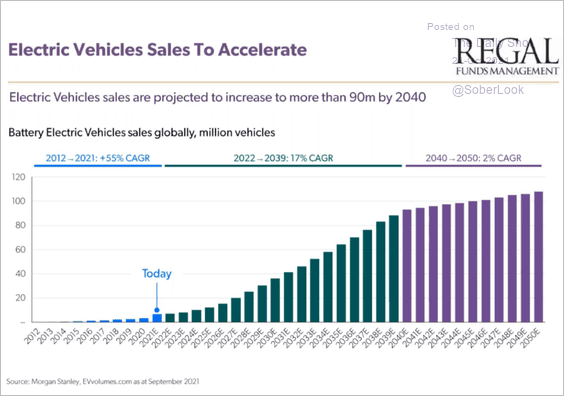 Source: Livewire Read full article
10. Brain size vs. body weight:
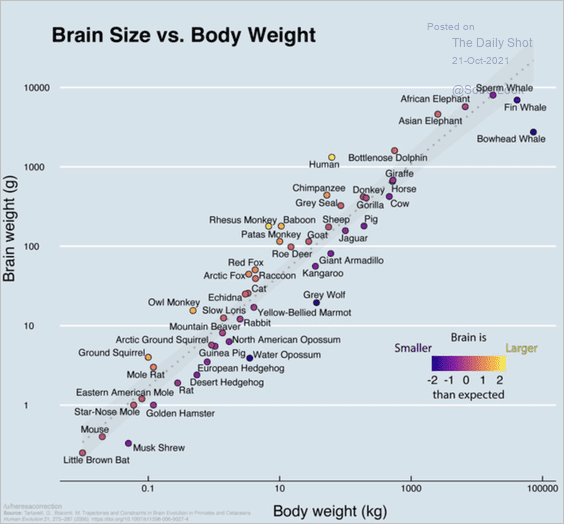 Source: @datatistic
——————–
Back to Index